Tlingit-Haida vs Yuman Disability Age Over 75
COMPARE
Tlingit-Haida
Yuman
Disability Age Over 75
Disability Age Over 75 Comparison
Tlingit-Haida
Yuman
50.6%
DISABILITY AGE OVER 75
0.0/ 100
METRIC RATING
310th/ 347
METRIC RANK
54.4%
DISABILITY AGE OVER 75
0.0/ 100
METRIC RATING
337th/ 347
METRIC RANK
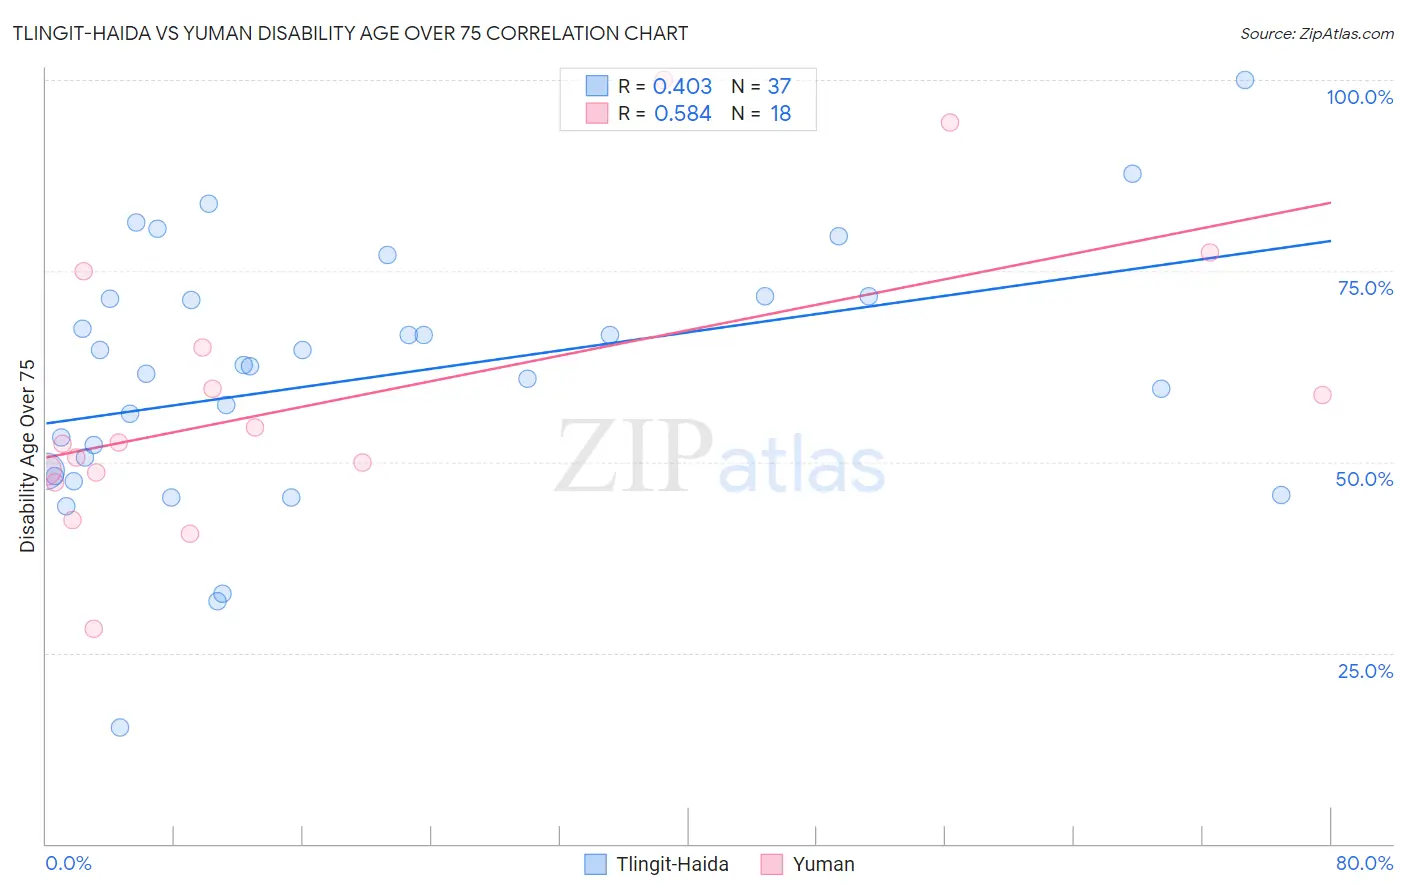
Tlingit-Haida vs Yuman Disability Age Over 75 Correlation Chart
The statistical analysis conducted on geographies consisting of 60,768,842 people shows a moderate positive correlation between the proportion of Tlingit-Haida and percentage of population with a disability over the age of 75 in the United States with a correlation coefficient (R) of 0.403 and weighted average of 50.6%. Similarly, the statistical analysis conducted on geographies consisting of 40,592,245 people shows a substantial positive correlation between the proportion of Yuman and percentage of population with a disability over the age of 75 in the United States with a correlation coefficient (R) of 0.584 and weighted average of 54.4%, a difference of 7.5%.
Disability Age Over 75 Correlation Summary
| Measurement | Tlingit-Haida | Yuman |
| Minimum | 15.2% | 28.2% |
| Maximum | 100.0% | 100.0% |
| Range | 84.8% | 71.8% |
| Mean | 60.9% | 58.1% |
| Median | 62.5% | 52.4% |
| Interquartile 25% (IQ1) | 48.4% | 48.7% |
| Interquartile 75% (IQ3) | 71.5% | 64.9% |
| Interquartile Range (IQR) | 23.0% | 16.3% |
| Standard Deviation (Sample) | 16.9% | 18.3% |
| Standard Deviation (Population) | 16.7% | 17.8% |
Similar Demographics by Disability Age Over 75
Demographics Similar to Tlingit-Haida by Disability Age Over 75
In terms of disability age over 75, the demographic groups most similar to Tlingit-Haida are Hispanic or Latino (50.6%, a difference of 0.040%), Aleut (50.6%, a difference of 0.040%), Immigrants from Fiji (50.6%, a difference of 0.070%), Cajun (50.7%, a difference of 0.10%), and Immigrants from Central America (50.5%, a difference of 0.12%).
| Demographics | Rating | Rank | Disability Age Over 75 |
| Japanese | 0.0 /100 | #303 | Tragic 50.2% |
| Immigrants | Dominican Republic | 0.0 /100 | #304 | Tragic 50.3% |
| Central American Indians | 0.0 /100 | #305 | Tragic 50.5% |
| Immigrants | Central America | 0.0 /100 | #306 | Tragic 50.5% |
| Immigrants | Fiji | 0.0 /100 | #307 | Tragic 50.6% |
| Hispanics or Latinos | 0.0 /100 | #308 | Tragic 50.6% |
| Aleuts | 0.0 /100 | #309 | Tragic 50.6% |
| Tlingit-Haida | 0.0 /100 | #310 | Tragic 50.6% |
| Cajuns | 0.0 /100 | #311 | Tragic 50.7% |
| Cheyenne | 0.0 /100 | #312 | Tragic 50.9% |
| Immigrants | Azores | 0.0 /100 | #313 | Tragic 50.9% |
| Immigrants | Mexico | 0.0 /100 | #314 | Tragic 51.1% |
| Mexicans | 0.0 /100 | #315 | Tragic 51.1% |
| Chickasaw | 0.0 /100 | #316 | Tragic 51.2% |
| Yakama | 0.0 /100 | #317 | Tragic 51.3% |
Demographics Similar to Yuman by Disability Age Over 75
In terms of disability age over 75, the demographic groups most similar to Yuman are Immigrants from Armenia (54.3%, a difference of 0.16%), Kiowa (54.2%, a difference of 0.33%), Alaskan Athabascan (54.0%, a difference of 0.85%), Apache (53.6%, a difference of 1.5%), and Colville (55.4%, a difference of 1.8%).
| Demographics | Rating | Rank | Disability Age Over 75 |
| Puerto Ricans | 0.0 /100 | #330 | Tragic 52.9% |
| Hopi | 0.0 /100 | #331 | Tragic 52.9% |
| Natives/Alaskans | 0.0 /100 | #332 | Tragic 53.1% |
| Apache | 0.0 /100 | #333 | Tragic 53.6% |
| Alaskan Athabascans | 0.0 /100 | #334 | Tragic 54.0% |
| Kiowa | 0.0 /100 | #335 | Tragic 54.2% |
| Immigrants | Armenia | 0.0 /100 | #336 | Tragic 54.3% |
| Yuman | 0.0 /100 | #337 | Tragic 54.4% |
| Colville | 0.0 /100 | #338 | Tragic 55.4% |
| Pima | 0.0 /100 | #339 | Tragic 55.8% |
| Pueblo | 0.0 /100 | #340 | Tragic 55.9% |
| Houma | 0.0 /100 | #341 | Tragic 56.2% |
| Lumbee | 0.0 /100 | #342 | Tragic 56.2% |
| Tohono O'odham | 0.0 /100 | #343 | Tragic 56.7% |
| Navajo | 0.0 /100 | #344 | Tragic 58.3% |