Tlingit-Haida vs Barbadian Disability Age Over 75
COMPARE
Tlingit-Haida
Barbadian
Disability Age Over 75
Disability Age Over 75 Comparison
Tlingit-Haida
Barbadians
50.6%
DISABILITY AGE OVER 75
0.0/ 100
METRIC RATING
310th/ 347
METRIC RANK
48.0%
DISABILITY AGE OVER 75
6.8/ 100
METRIC RATING
222nd/ 347
METRIC RANK
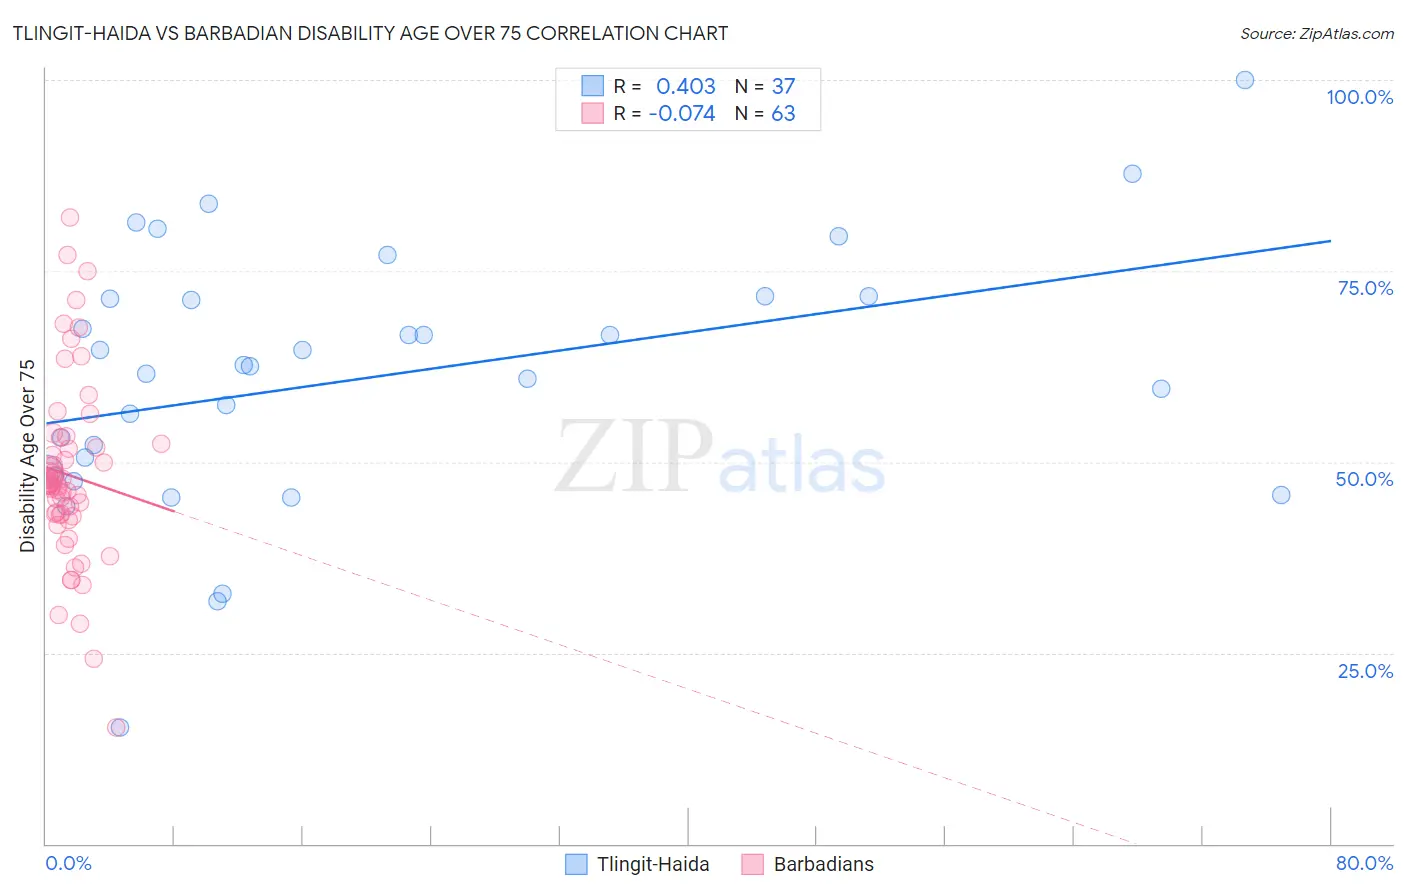
Tlingit-Haida vs Barbadian Disability Age Over 75 Correlation Chart
The statistical analysis conducted on geographies consisting of 60,768,842 people shows a moderate positive correlation between the proportion of Tlingit-Haida and percentage of population with a disability over the age of 75 in the United States with a correlation coefficient (R) of 0.403 and weighted average of 50.6%. Similarly, the statistical analysis conducted on geographies consisting of 141,188,611 people shows a slight negative correlation between the proportion of Barbadians and percentage of population with a disability over the age of 75 in the United States with a correlation coefficient (R) of -0.074 and weighted average of 48.0%, a difference of 5.3%.
Disability Age Over 75 Correlation Summary
| Measurement | Tlingit-Haida | Barbadian |
| Minimum | 15.2% | 15.2% |
| Maximum | 100.0% | 82.0% |
| Range | 84.8% | 66.8% |
| Mean | 60.9% | 48.3% |
| Median | 62.5% | 46.9% |
| Interquartile 25% (IQ1) | 48.4% | 43.1% |
| Interquartile 75% (IQ3) | 71.5% | 52.4% |
| Interquartile Range (IQR) | 23.0% | 9.3% |
| Standard Deviation (Sample) | 16.9% | 12.0% |
| Standard Deviation (Population) | 16.7% | 11.9% |
Similar Demographics by Disability Age Over 75
Demographics Similar to Tlingit-Haida by Disability Age Over 75
In terms of disability age over 75, the demographic groups most similar to Tlingit-Haida are Hispanic or Latino (50.6%, a difference of 0.040%), Aleut (50.6%, a difference of 0.040%), Immigrants from Fiji (50.6%, a difference of 0.070%), Cajun (50.7%, a difference of 0.10%), and Immigrants from Central America (50.5%, a difference of 0.12%).
| Demographics | Rating | Rank | Disability Age Over 75 |
| Japanese | 0.0 /100 | #303 | Tragic 50.2% |
| Immigrants | Dominican Republic | 0.0 /100 | #304 | Tragic 50.3% |
| Central American Indians | 0.0 /100 | #305 | Tragic 50.5% |
| Immigrants | Central America | 0.0 /100 | #306 | Tragic 50.5% |
| Immigrants | Fiji | 0.0 /100 | #307 | Tragic 50.6% |
| Hispanics or Latinos | 0.0 /100 | #308 | Tragic 50.6% |
| Aleuts | 0.0 /100 | #309 | Tragic 50.6% |
| Tlingit-Haida | 0.0 /100 | #310 | Tragic 50.6% |
| Cajuns | 0.0 /100 | #311 | Tragic 50.7% |
| Cheyenne | 0.0 /100 | #312 | Tragic 50.9% |
| Immigrants | Azores | 0.0 /100 | #313 | Tragic 50.9% |
| Immigrants | Mexico | 0.0 /100 | #314 | Tragic 51.1% |
| Mexicans | 0.0 /100 | #315 | Tragic 51.1% |
| Chickasaw | 0.0 /100 | #316 | Tragic 51.2% |
| Yakama | 0.0 /100 | #317 | Tragic 51.3% |
Demographics Similar to Barbadians by Disability Age Over 75
In terms of disability age over 75, the demographic groups most similar to Barbadians are Immigrants from Bangladesh (48.0%, a difference of 0.0%), Liberian (48.0%, a difference of 0.010%), Spanish (48.0%, a difference of 0.030%), Nonimmigrants (48.0%, a difference of 0.030%), and Immigrants from Oceania (48.0%, a difference of 0.040%).
| Demographics | Rating | Rank | Disability Age Over 75 |
| Senegalese | 10.7 /100 | #215 | Poor 47.9% |
| Immigrants | Panama | 10.2 /100 | #216 | Poor 47.9% |
| Immigrants | Grenada | 9.4 /100 | #217 | Tragic 47.9% |
| Immigrants | Western Africa | 8.3 /100 | #218 | Tragic 48.0% |
| Immigrants | Western Asia | 7.5 /100 | #219 | Tragic 48.0% |
| Bahamians | 7.4 /100 | #220 | Tragic 48.0% |
| Immigrants | Oceania | 7.3 /100 | #221 | Tragic 48.0% |
| Barbadians | 6.8 /100 | #222 | Tragic 48.0% |
| Immigrants | Bangladesh | 6.8 /100 | #223 | Tragic 48.0% |
| Liberians | 6.7 /100 | #224 | Tragic 48.0% |
| Spanish | 6.5 /100 | #225 | Tragic 48.0% |
| Immigrants | Nonimmigrants | 6.5 /100 | #226 | Tragic 48.0% |
| Zimbabweans | 6.4 /100 | #227 | Tragic 48.1% |
| Immigrants | Liberia | 5.9 /100 | #228 | Tragic 48.1% |
| Spaniards | 5.7 /100 | #229 | Tragic 48.1% |