Swiss vs Bermudan Disability
COMPARE
Swiss
Bermudan
Disability
Disability Comparison
Swiss
Bermudans
12.2%
DISABILITY
1.5/ 100
METRIC RATING
246th/ 347
METRIC RANK
12.3%
DISABILITY
1.1/ 100
METRIC RATING
252nd/ 347
METRIC RANK
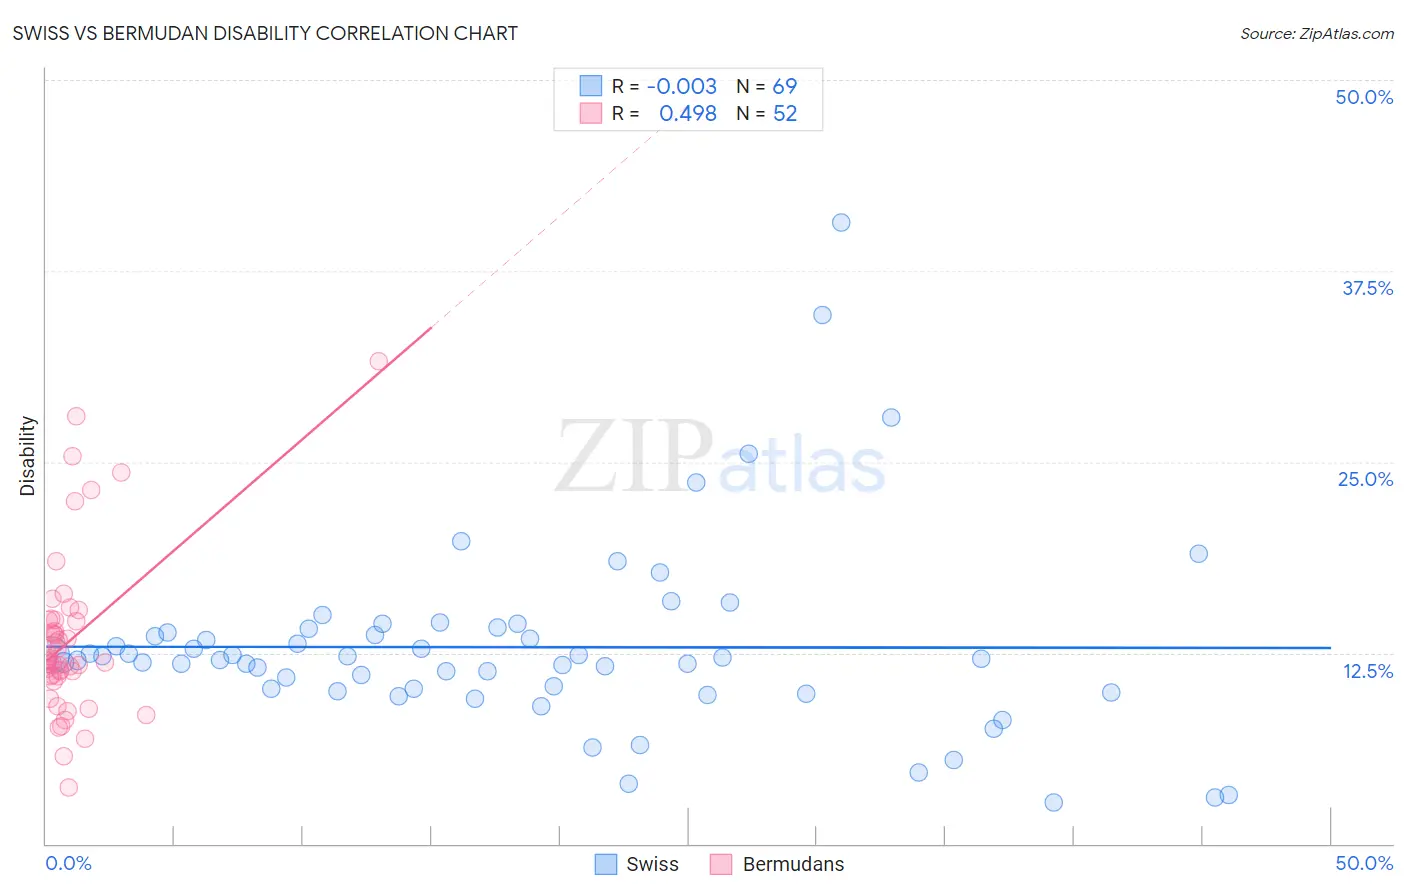
Swiss vs Bermudan Disability Correlation Chart
The statistical analysis conducted on geographies consisting of 464,998,318 people shows no correlation between the proportion of Swiss and percentage of population with a disability in the United States with a correlation coefficient (R) of -0.003 and weighted average of 12.2%. Similarly, the statistical analysis conducted on geographies consisting of 55,721,549 people shows a moderate positive correlation between the proportion of Bermudans and percentage of population with a disability in the United States with a correlation coefficient (R) of 0.498 and weighted average of 12.3%, a difference of 0.28%.
Disability Correlation Summary
| Measurement | Swiss | Bermudan |
| Minimum | 2.7% | 3.7% |
| Maximum | 40.6% | 31.6% |
| Range | 37.9% | 27.9% |
| Mean | 12.9% | 13.4% |
| Median | 12.1% | 12.0% |
| Interquartile 25% (IQ1) | 10.0% | 10.9% |
| Interquartile 75% (IQ3) | 13.9% | 14.7% |
| Interquartile Range (IQR) | 3.9% | 3.7% |
| Standard Deviation (Sample) | 6.3% | 5.4% |
| Standard Deviation (Population) | 6.2% | 5.4% |
Demographics Similar to Swiss and Bermudans by Disability
In terms of disability, the demographic groups most similar to Swiss are Liberian (12.2%, a difference of 0.030%), Indonesian (12.2%, a difference of 0.030%), British (12.2%, a difference of 0.040%), Basque (12.2%, a difference of 0.040%), and Guamanian/Chamorro (12.3%, a difference of 0.070%). Similarly, the demographic groups most similar to Bermudans are Subsaharan African (12.3%, a difference of 0.19%), European (12.3%, a difference of 0.19%), Carpatho Rusyn (12.3%, a difference of 0.20%), Guamanian/Chamorro (12.3%, a difference of 0.21%), and Indonesian (12.2%, a difference of 0.25%).
| Demographics | Rating | Rank | Disability |
| Swedes | 1.8 /100 | #239 | Tragic 12.2% |
| Hungarians | 1.7 /100 | #240 | Tragic 12.2% |
| Yugoslavians | 1.7 /100 | #241 | Tragic 12.2% |
| Poles | 1.7 /100 | #242 | Tragic 12.2% |
| British | 1.5 /100 | #243 | Tragic 12.2% |
| Basques | 1.5 /100 | #244 | Tragic 12.2% |
| Liberians | 1.5 /100 | #245 | Tragic 12.2% |
| Swiss | 1.5 /100 | #246 | Tragic 12.2% |
| Indonesians | 1.4 /100 | #247 | Tragic 12.2% |
| Guamanians/Chamorros | 1.4 /100 | #248 | Tragic 12.3% |
| Carpatho Rusyns | 1.4 /100 | #249 | Tragic 12.3% |
| Sub-Saharan Africans | 1.4 /100 | #250 | Tragic 12.3% |
| Europeans | 1.4 /100 | #251 | Tragic 12.3% |
| Bermudans | 1.1 /100 | #252 | Tragic 12.3% |
| Belgians | 0.8 /100 | #253 | Tragic 12.3% |
| German Russians | 0.8 /100 | #254 | Tragic 12.3% |
| Slovenes | 0.6 /100 | #255 | Tragic 12.4% |
| Immigrants | Dominica | 0.6 /100 | #256 | Tragic 12.4% |
| Immigrants | Laos | 0.5 /100 | #257 | Tragic 12.4% |
| Slavs | 0.5 /100 | #258 | Tragic 12.4% |
| Canadians | 0.4 /100 | #259 | Tragic 12.4% |