Swiss vs Immigrants from Taiwan Disability
COMPARE
Swiss
Immigrants from Taiwan
Disability
Disability Comparison
Swiss
Immigrants from Taiwan
12.2%
DISABILITY
1.5/ 100
METRIC RATING
246th/ 347
METRIC RANK
9.6%
DISABILITY
100.0/ 100
METRIC RATING
3rd/ 347
METRIC RANK
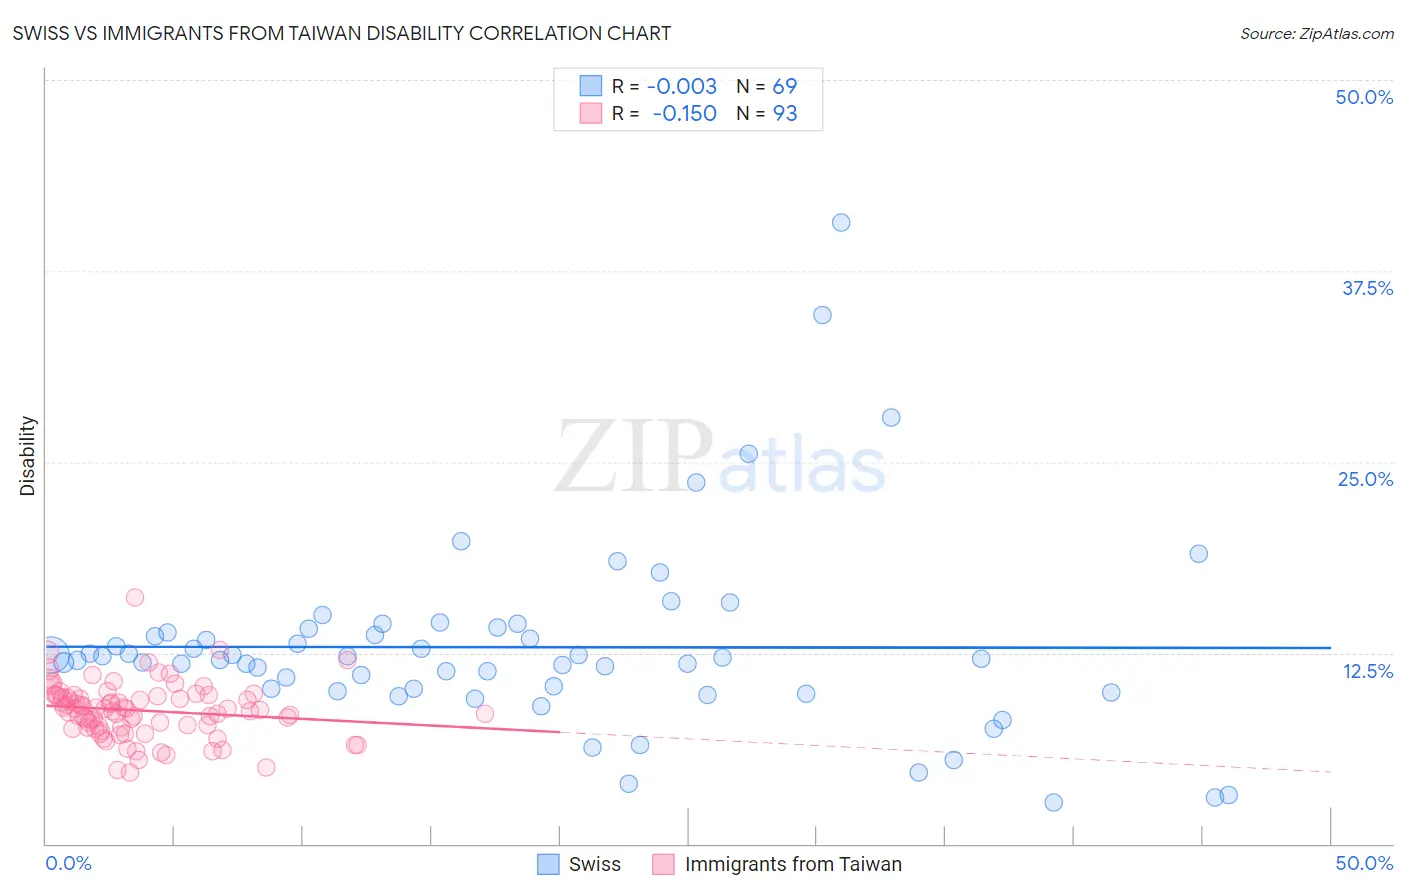
Swiss vs Immigrants from Taiwan Disability Correlation Chart
The statistical analysis conducted on geographies consisting of 464,998,318 people shows no correlation between the proportion of Swiss and percentage of population with a disability in the United States with a correlation coefficient (R) of -0.003 and weighted average of 12.2%. Similarly, the statistical analysis conducted on geographies consisting of 298,248,980 people shows a poor negative correlation between the proportion of Immigrants from Taiwan and percentage of population with a disability in the United States with a correlation coefficient (R) of -0.150 and weighted average of 9.6%, a difference of 27.5%.
Disability Correlation Summary
| Measurement | Swiss | Immigrants from Taiwan |
| Minimum | 2.7% | 4.6% |
| Maximum | 40.6% | 16.2% |
| Range | 37.9% | 11.5% |
| Mean | 12.9% | 8.7% |
| Median | 12.1% | 8.8% |
| Interquartile 25% (IQ1) | 10.0% | 7.6% |
| Interquartile 75% (IQ3) | 13.9% | 9.7% |
| Interquartile Range (IQR) | 3.9% | 2.1% |
| Standard Deviation (Sample) | 6.3% | 1.8% |
| Standard Deviation (Population) | 6.2% | 1.8% |
Similar Demographics by Disability
Demographics Similar to Swiss by Disability
In terms of disability, the demographic groups most similar to Swiss are Liberian (12.2%, a difference of 0.030%), Indonesian (12.2%, a difference of 0.030%), British (12.2%, a difference of 0.040%), Basque (12.2%, a difference of 0.040%), and Guamanian/Chamorro (12.3%, a difference of 0.070%).
| Demographics | Rating | Rank | Disability |
| Swedes | 1.8 /100 | #239 | Tragic 12.2% |
| Hungarians | 1.7 /100 | #240 | Tragic 12.2% |
| Yugoslavians | 1.7 /100 | #241 | Tragic 12.2% |
| Poles | 1.7 /100 | #242 | Tragic 12.2% |
| British | 1.5 /100 | #243 | Tragic 12.2% |
| Basques | 1.5 /100 | #244 | Tragic 12.2% |
| Liberians | 1.5 /100 | #245 | Tragic 12.2% |
| Swiss | 1.5 /100 | #246 | Tragic 12.2% |
| Indonesians | 1.4 /100 | #247 | Tragic 12.2% |
| Guamanians/Chamorros | 1.4 /100 | #248 | Tragic 12.3% |
| Carpatho Rusyns | 1.4 /100 | #249 | Tragic 12.3% |
| Sub-Saharan Africans | 1.4 /100 | #250 | Tragic 12.3% |
| Europeans | 1.4 /100 | #251 | Tragic 12.3% |
| Bermudans | 1.1 /100 | #252 | Tragic 12.3% |
| Belgians | 0.8 /100 | #253 | Tragic 12.3% |
Demographics Similar to Immigrants from Taiwan by Disability
In terms of disability, the demographic groups most similar to Immigrants from Taiwan are Filipino (9.6%, a difference of 0.080%), Immigrants from India (9.5%, a difference of 1.1%), Thai (9.7%, a difference of 1.1%), Immigrants from Bolivia (9.9%, a difference of 2.7%), and Immigrants from South Central Asia (9.9%, a difference of 3.6%).
| Demographics | Rating | Rank | Disability |
| Immigrants | India | 100.0 /100 | #1 | Exceptional 9.5% |
| Filipinos | 100.0 /100 | #2 | Exceptional 9.6% |
| Immigrants | Taiwan | 100.0 /100 | #3 | Exceptional 9.6% |
| Thais | 100.0 /100 | #4 | Exceptional 9.7% |
| Immigrants | Bolivia | 100.0 /100 | #5 | Exceptional 9.9% |
| Immigrants | South Central Asia | 100.0 /100 | #6 | Exceptional 9.9% |
| Immigrants | Singapore | 100.0 /100 | #7 | Exceptional 10.0% |
| Bolivians | 100.0 /100 | #8 | Exceptional 10.0% |
| Immigrants | Hong Kong | 100.0 /100 | #9 | Exceptional 10.0% |
| Immigrants | China | 100.0 /100 | #10 | Exceptional 10.1% |
| Iranians | 100.0 /100 | #11 | Exceptional 10.1% |
| Immigrants | Israel | 100.0 /100 | #12 | Exceptional 10.1% |
| Immigrants | Eastern Asia | 100.0 /100 | #13 | Exceptional 10.2% |
| Immigrants | Korea | 100.0 /100 | #14 | Exceptional 10.2% |
| Okinawans | 100.0 /100 | #15 | Exceptional 10.3% |