Swiss vs Yup'ik Disability
COMPARE
Swiss
Yup'ik
Disability
Disability Comparison
Swiss
Yup'ik
12.2%
DISABILITY
1.5/ 100
METRIC RATING
246th/ 347
METRIC RANK
12.2%
DISABILITY
2.2/ 100
METRIC RATING
235th/ 347
METRIC RANK
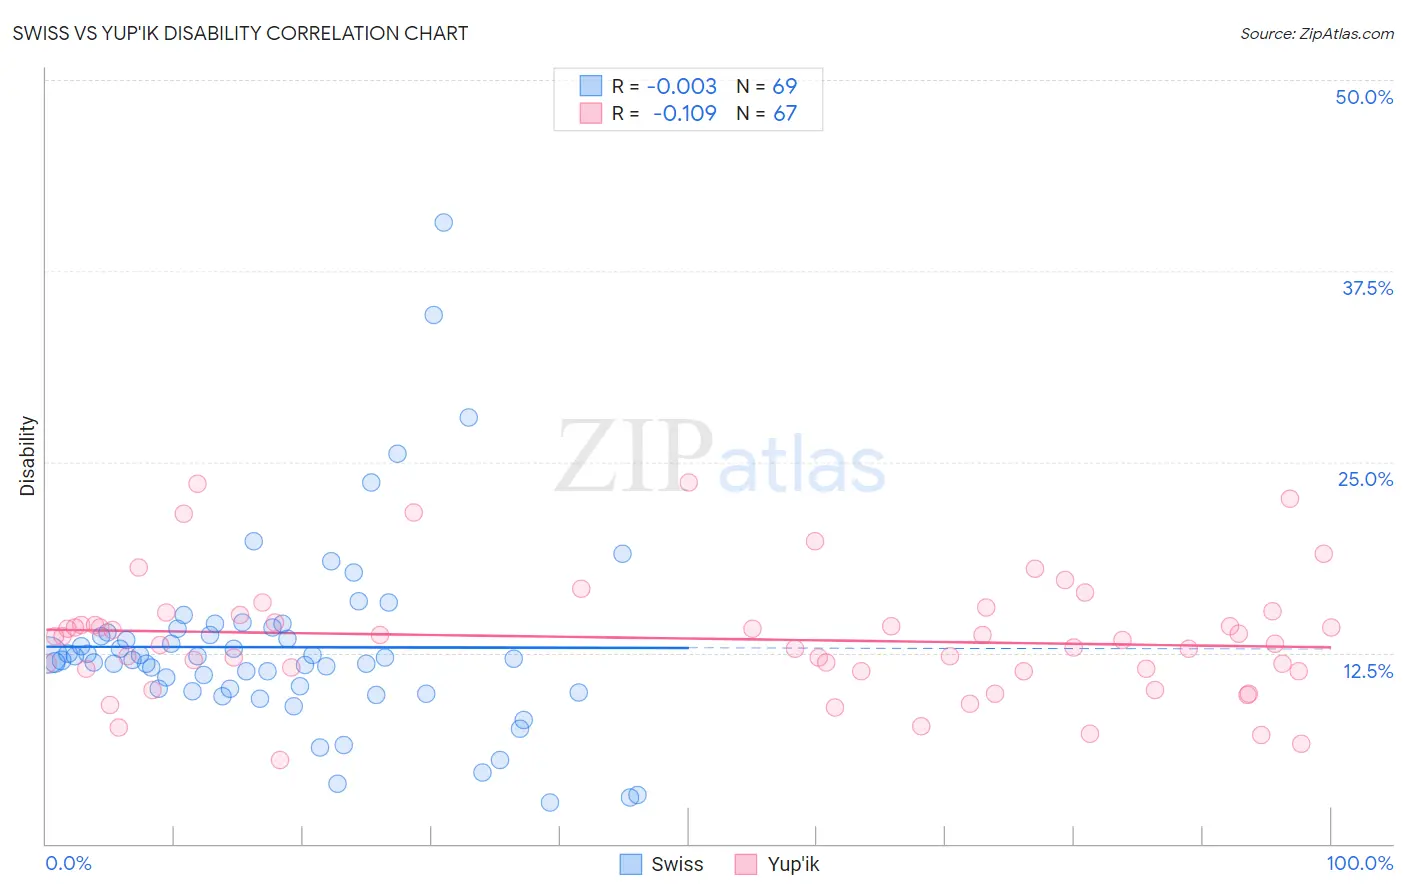
Swiss vs Yup'ik Disability Correlation Chart
The statistical analysis conducted on geographies consisting of 464,998,318 people shows no correlation between the proportion of Swiss and percentage of population with a disability in the United States with a correlation coefficient (R) of -0.003 and weighted average of 12.2%. Similarly, the statistical analysis conducted on geographies consisting of 39,961,482 people shows a poor negative correlation between the proportion of Yup'ik and percentage of population with a disability in the United States with a correlation coefficient (R) of -0.109 and weighted average of 12.2%, a difference of 0.43%.
Disability Correlation Summary
| Measurement | Swiss | Yup'ik |
| Minimum | 2.7% | 5.5% |
| Maximum | 40.6% | 23.6% |
| Range | 37.9% | 18.1% |
| Mean | 12.9% | 13.4% |
| Median | 12.1% | 13.3% |
| Interquartile 25% (IQ1) | 10.0% | 11.3% |
| Interquartile 75% (IQ3) | 13.9% | 15.0% |
| Interquartile Range (IQR) | 3.9% | 3.7% |
| Standard Deviation (Sample) | 6.3% | 3.9% |
| Standard Deviation (Population) | 6.2% | 3.9% |
Demographics Similar to Swiss and Yup'ik by Disability
In terms of disability, the demographic groups most similar to Swiss are Liberian (12.2%, a difference of 0.030%), Indonesian (12.2%, a difference of 0.030%), British (12.2%, a difference of 0.040%), Basque (12.2%, a difference of 0.040%), and Guamanian/Chamorro (12.3%, a difference of 0.070%). Similarly, the demographic groups most similar to Yup'ik are Japanese (12.2%, a difference of 0.040%), Bahamian (12.2%, a difference of 0.070%), Chinese (12.2%, a difference of 0.090%), Immigrants from Congo (12.2%, a difference of 0.14%), and Italian (12.2%, a difference of 0.16%).
| Demographics | Rating | Rank | Disability |
| Samoans | 2.6 /100 | #230 | Tragic 12.2% |
| Malaysians | 2.5 /100 | #231 | Tragic 12.2% |
| Italians | 2.5 /100 | #232 | Tragic 12.2% |
| Bahamians | 2.3 /100 | #233 | Tragic 12.2% |
| Japanese | 2.3 /100 | #234 | Tragic 12.2% |
| Yup'ik | 2.2 /100 | #235 | Tragic 12.2% |
| Chinese | 2.0 /100 | #236 | Tragic 12.2% |
| Immigrants | Congo | 1.9 /100 | #237 | Tragic 12.2% |
| Norwegians | 1.9 /100 | #238 | Tragic 12.2% |
| Swedes | 1.8 /100 | #239 | Tragic 12.2% |
| Hungarians | 1.7 /100 | #240 | Tragic 12.2% |
| Yugoslavians | 1.7 /100 | #241 | Tragic 12.2% |
| Poles | 1.7 /100 | #242 | Tragic 12.2% |
| British | 1.5 /100 | #243 | Tragic 12.2% |
| Basques | 1.5 /100 | #244 | Tragic 12.2% |
| Liberians | 1.5 /100 | #245 | Tragic 12.2% |
| Swiss | 1.5 /100 | #246 | Tragic 12.2% |
| Indonesians | 1.4 /100 | #247 | Tragic 12.2% |
| Guamanians/Chamorros | 1.4 /100 | #248 | Tragic 12.3% |
| Carpatho Rusyns | 1.4 /100 | #249 | Tragic 12.3% |
| Sub-Saharan Africans | 1.4 /100 | #250 | Tragic 12.3% |