Swiss vs Alsatian Disability
COMPARE
Swiss
Alsatian
Disability
Disability Comparison
Swiss
Alsatians
12.2%
DISABILITY
1.5/ 100
METRIC RATING
246th/ 347
METRIC RANK
12.1%
DISABILITY
3.3/ 100
METRIC RATING
227th/ 347
METRIC RANK
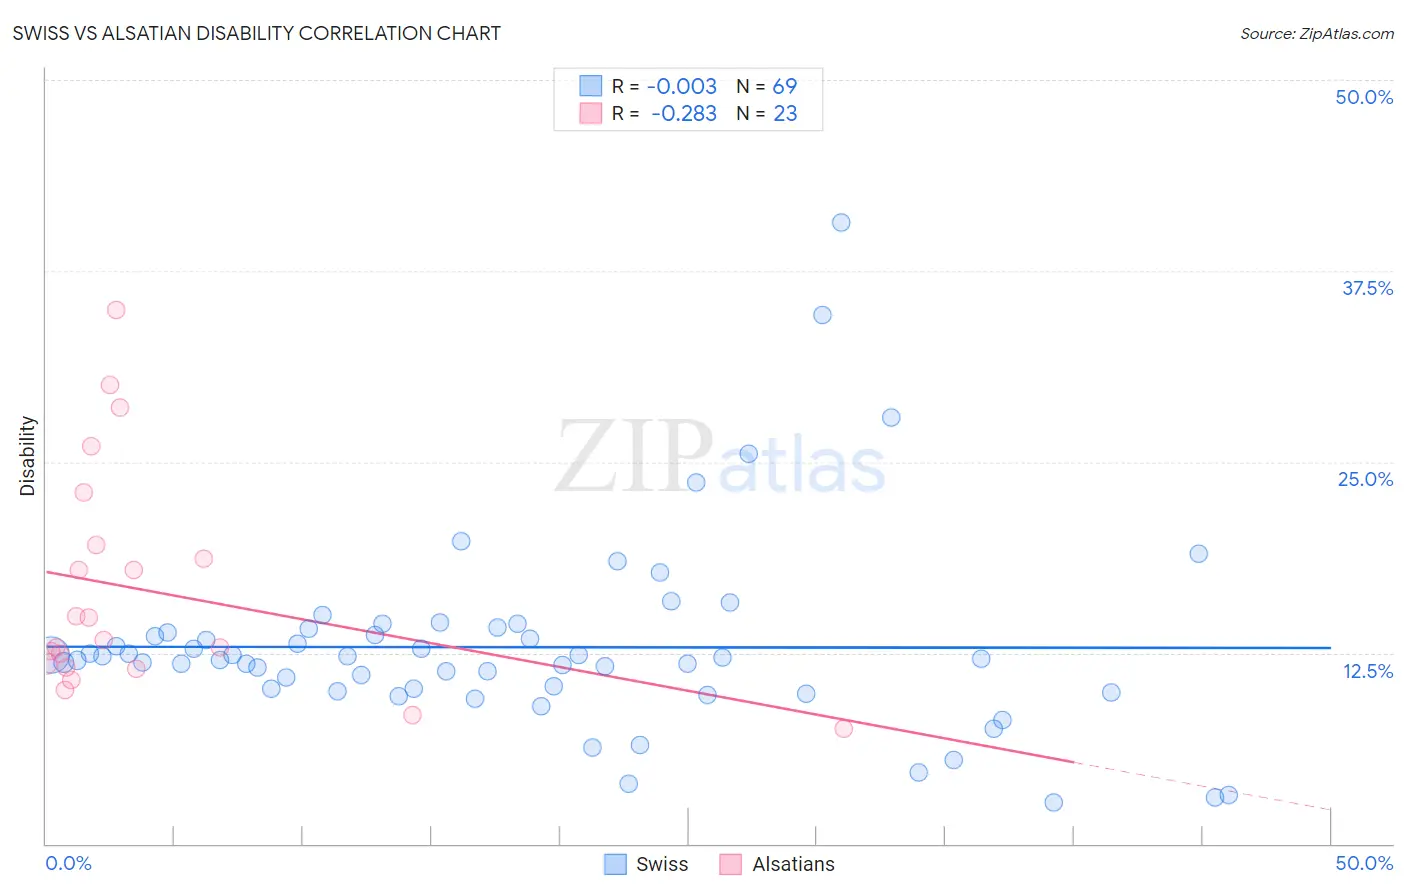
Swiss vs Alsatian Disability Correlation Chart
The statistical analysis conducted on geographies consisting of 464,998,318 people shows no correlation between the proportion of Swiss and percentage of population with a disability in the United States with a correlation coefficient (R) of -0.003 and weighted average of 12.2%. Similarly, the statistical analysis conducted on geographies consisting of 82,681,540 people shows a weak negative correlation between the proportion of Alsatians and percentage of population with a disability in the United States with a correlation coefficient (R) of -0.283 and weighted average of 12.1%, a difference of 0.87%.
Disability Correlation Summary
| Measurement | Swiss | Alsatian |
| Minimum | 2.7% | 7.5% |
| Maximum | 40.6% | 34.9% |
| Range | 37.9% | 27.4% |
| Mean | 12.9% | 16.6% |
| Median | 12.1% | 13.4% |
| Interquartile 25% (IQ1) | 10.0% | 11.5% |
| Interquartile 75% (IQ3) | 13.9% | 19.6% |
| Interquartile Range (IQR) | 3.9% | 8.0% |
| Standard Deviation (Sample) | 6.3% | 7.3% |
| Standard Deviation (Population) | 6.2% | 7.2% |
Demographics Similar to Swiss and Alsatians by Disability
In terms of disability, the demographic groups most similar to Swiss are Liberian (12.2%, a difference of 0.030%), British (12.2%, a difference of 0.040%), Basque (12.2%, a difference of 0.040%), Polish (12.2%, a difference of 0.13%), and Hungarian (12.2%, a difference of 0.15%). Similarly, the demographic groups most similar to Alsatians are Jamaican (12.1%, a difference of 0.010%), West Indian (12.2%, a difference of 0.14%), Inupiat (12.2%, a difference of 0.16%), Samoan (12.2%, a difference of 0.24%), and Malaysian (12.2%, a difference of 0.28%).
| Demographics | Rating | Rank | Disability |
| Jamaicans | 3.3 /100 | #226 | Tragic 12.1% |
| Alsatians | 3.3 /100 | #227 | Tragic 12.1% |
| West Indians | 2.9 /100 | #228 | Tragic 12.2% |
| Inupiat | 2.8 /100 | #229 | Tragic 12.2% |
| Samoans | 2.6 /100 | #230 | Tragic 12.2% |
| Malaysians | 2.5 /100 | #231 | Tragic 12.2% |
| Italians | 2.5 /100 | #232 | Tragic 12.2% |
| Bahamians | 2.3 /100 | #233 | Tragic 12.2% |
| Japanese | 2.3 /100 | #234 | Tragic 12.2% |
| Yup'ik | 2.2 /100 | #235 | Tragic 12.2% |
| Chinese | 2.0 /100 | #236 | Tragic 12.2% |
| Immigrants | Congo | 1.9 /100 | #237 | Tragic 12.2% |
| Norwegians | 1.9 /100 | #238 | Tragic 12.2% |
| Swedes | 1.8 /100 | #239 | Tragic 12.2% |
| Hungarians | 1.7 /100 | #240 | Tragic 12.2% |
| Yugoslavians | 1.7 /100 | #241 | Tragic 12.2% |
| Poles | 1.7 /100 | #242 | Tragic 12.2% |
| British | 1.5 /100 | #243 | Tragic 12.2% |
| Basques | 1.5 /100 | #244 | Tragic 12.2% |
| Liberians | 1.5 /100 | #245 | Tragic 12.2% |
| Swiss | 1.5 /100 | #246 | Tragic 12.2% |