Swiss vs Sri Lankan Disability
COMPARE
Swiss
Sri Lankan
Disability
Disability Comparison
Swiss
Sri Lankans
12.2%
DISABILITY
1.5/ 100
METRIC RATING
246th/ 347
METRIC RANK
11.0%
DISABILITY
99.5/ 100
METRIC RATING
69th/ 347
METRIC RANK
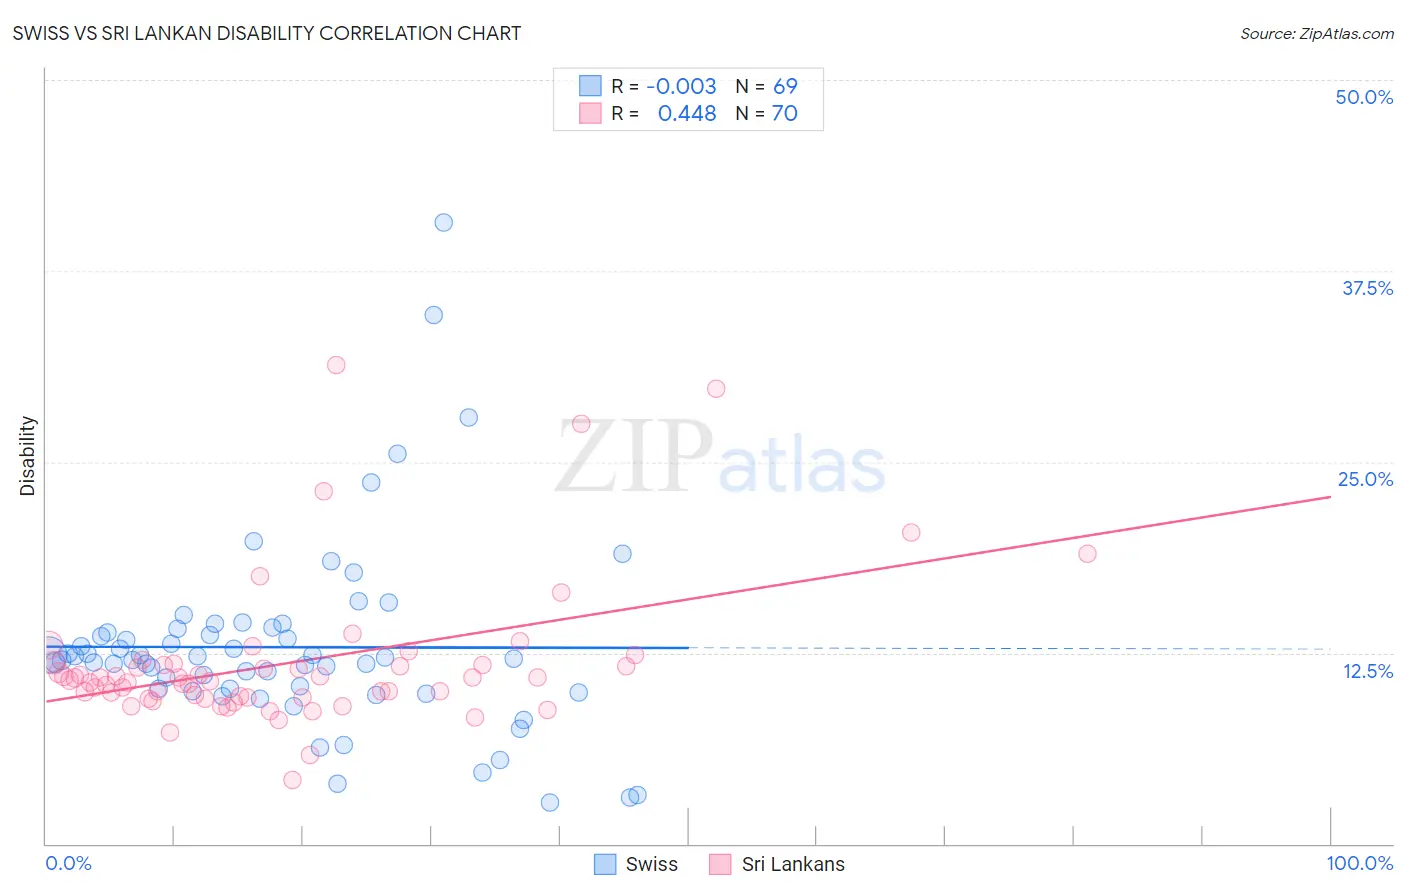
Swiss vs Sri Lankan Disability Correlation Chart
The statistical analysis conducted on geographies consisting of 464,998,318 people shows no correlation between the proportion of Swiss and percentage of population with a disability in the United States with a correlation coefficient (R) of -0.003 and weighted average of 12.2%. Similarly, the statistical analysis conducted on geographies consisting of 440,510,650 people shows a moderate positive correlation between the proportion of Sri Lankans and percentage of population with a disability in the United States with a correlation coefficient (R) of 0.448 and weighted average of 11.0%, a difference of 11.1%.
Disability Correlation Summary
| Measurement | Swiss | Sri Lankan |
| Minimum | 2.7% | 4.1% |
| Maximum | 40.6% | 31.3% |
| Range | 37.9% | 27.2% |
| Mean | 12.9% | 11.8% |
| Median | 12.1% | 10.8% |
| Interquartile 25% (IQ1) | 10.0% | 9.6% |
| Interquartile 75% (IQ3) | 13.9% | 11.7% |
| Interquartile Range (IQR) | 3.9% | 2.1% |
| Standard Deviation (Sample) | 6.3% | 4.8% |
| Standard Deviation (Population) | 6.2% | 4.7% |
Similar Demographics by Disability
Demographics Similar to Swiss by Disability
In terms of disability, the demographic groups most similar to Swiss are Liberian (12.2%, a difference of 0.030%), Indonesian (12.2%, a difference of 0.030%), British (12.2%, a difference of 0.040%), Basque (12.2%, a difference of 0.040%), and Guamanian/Chamorro (12.3%, a difference of 0.070%).
| Demographics | Rating | Rank | Disability |
| Swedes | 1.8 /100 | #239 | Tragic 12.2% |
| Hungarians | 1.7 /100 | #240 | Tragic 12.2% |
| Yugoslavians | 1.7 /100 | #241 | Tragic 12.2% |
| Poles | 1.7 /100 | #242 | Tragic 12.2% |
| British | 1.5 /100 | #243 | Tragic 12.2% |
| Basques | 1.5 /100 | #244 | Tragic 12.2% |
| Liberians | 1.5 /100 | #245 | Tragic 12.2% |
| Swiss | 1.5 /100 | #246 | Tragic 12.2% |
| Indonesians | 1.4 /100 | #247 | Tragic 12.2% |
| Guamanians/Chamorros | 1.4 /100 | #248 | Tragic 12.3% |
| Carpatho Rusyns | 1.4 /100 | #249 | Tragic 12.3% |
| Sub-Saharan Africans | 1.4 /100 | #250 | Tragic 12.3% |
| Europeans | 1.4 /100 | #251 | Tragic 12.3% |
| Bermudans | 1.1 /100 | #252 | Tragic 12.3% |
| Belgians | 0.8 /100 | #253 | Tragic 12.3% |
Demographics Similar to Sri Lankans by Disability
In terms of disability, the demographic groups most similar to Sri Lankans are Immigrants from France (11.0%, a difference of 0.080%), Immigrants from Lebanon (11.0%, a difference of 0.090%), Immigrants from Chile (11.0%, a difference of 0.18%), Immigrants from Afghanistan (11.0%, a difference of 0.21%), and Immigrants from Bangladesh (11.0%, a difference of 0.21%).
| Demographics | Rating | Rank | Disability |
| Immigrants | Northern Africa | 99.7 /100 | #62 | Exceptional 10.9% |
| Immigrants | Eritrea | 99.7 /100 | #63 | Exceptional 11.0% |
| Immigrants | Sweden | 99.6 /100 | #64 | Exceptional 11.0% |
| Bulgarians | 99.6 /100 | #65 | Exceptional 11.0% |
| Laotians | 99.6 /100 | #66 | Exceptional 11.0% |
| Colombians | 99.6 /100 | #67 | Exceptional 11.0% |
| Immigrants | Afghanistan | 99.6 /100 | #68 | Exceptional 11.0% |
| Sri Lankans | 99.5 /100 | #69 | Exceptional 11.0% |
| Immigrants | France | 99.4 /100 | #70 | Exceptional 11.0% |
| Immigrants | Lebanon | 99.4 /100 | #71 | Exceptional 11.0% |
| Immigrants | Chile | 99.4 /100 | #72 | Exceptional 11.0% |
| Immigrants | Bangladesh | 99.4 /100 | #73 | Exceptional 11.0% |
| Immigrants | Serbia | 99.4 /100 | #74 | Exceptional 11.0% |
| Immigrants | Vietnam | 99.4 /100 | #75 | Exceptional 11.0% |
| Sierra Leoneans | 99.3 /100 | #76 | Exceptional 11.0% |