Spaniard vs Seminole Disability Age Under 5
COMPARE
Spaniard
Seminole
Disability Age Under 5
Disability Age Under 5 Comparison
Spaniards
Seminole
1.4%
DISABILITY AGE UNDER 5
1.4/ 100
METRIC RATING
244th/ 347
METRIC RANK
1.6%
DISABILITY AGE UNDER 5
0.0/ 100
METRIC RATING
304th/ 347
METRIC RANK
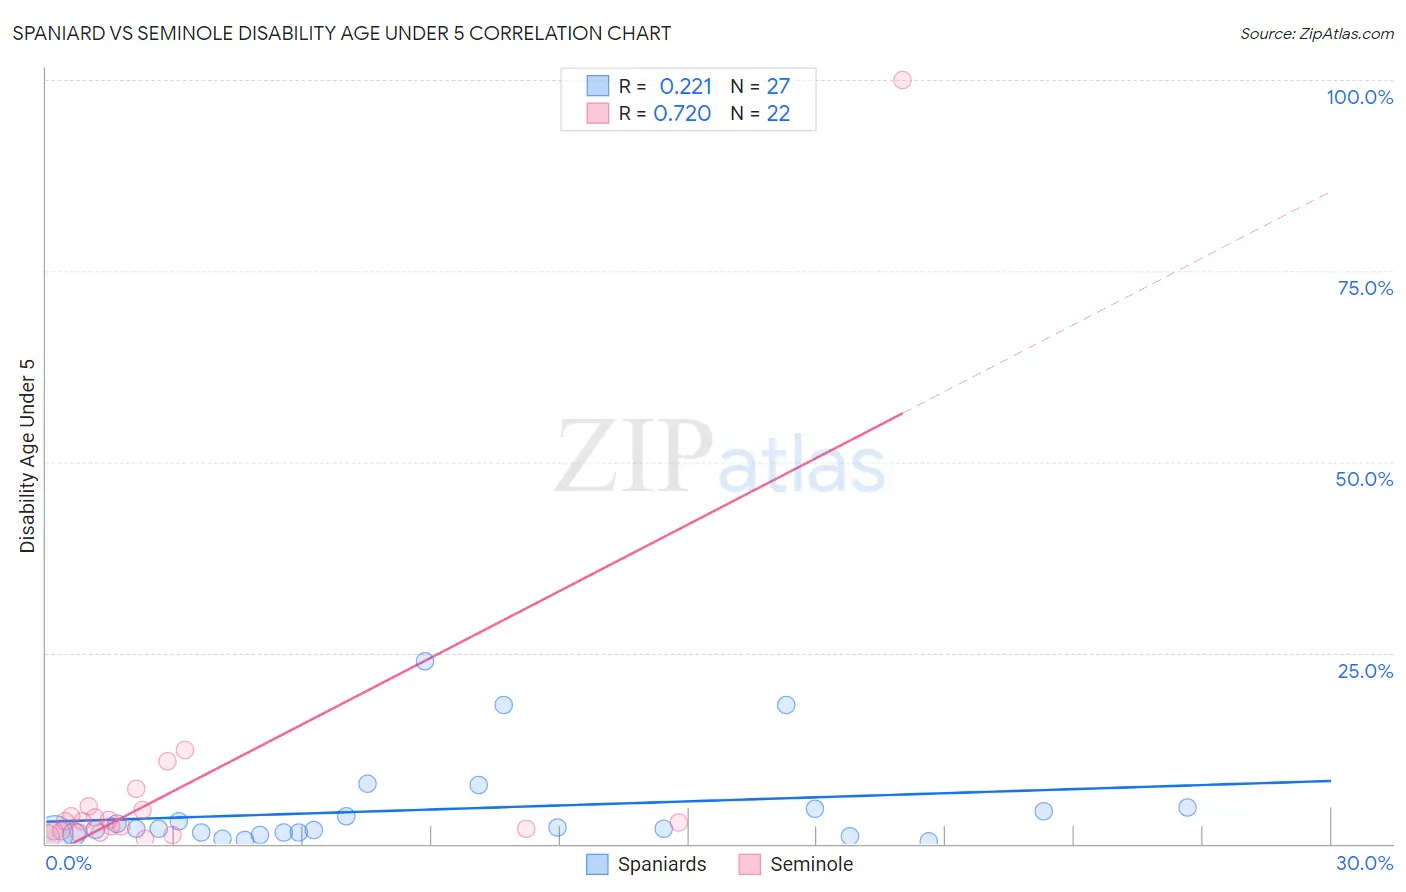
Spaniard vs Seminole Disability Age Under 5 Correlation Chart
The statistical analysis conducted on geographies consisting of 233,722,649 people shows a weak positive correlation between the proportion of Spaniards and percentage of population with a disability under the age of 5 in the United States with a correlation coefficient (R) of 0.221 and weighted average of 1.4%. Similarly, the statistical analysis conducted on geographies consisting of 90,113,501 people shows a strong positive correlation between the proportion of Seminole and percentage of population with a disability under the age of 5 in the United States with a correlation coefficient (R) of 0.720 and weighted average of 1.6%, a difference of 20.9%.
Disability Age Under 5 Correlation Summary
| Measurement | Spaniard | Seminole |
| Minimum | 0.27% | 0.70% |
| Maximum | 23.9% | 100.0% |
| Range | 23.6% | 99.3% |
| Mean | 4.5% | 7.9% |
| Median | 2.0% | 2.9% |
| Interquartile 25% (IQ1) | 1.3% | 1.6% |
| Interquartile 75% (IQ3) | 4.5% | 4.4% |
| Interquartile Range (IQR) | 3.2% | 2.8% |
| Standard Deviation (Sample) | 6.0% | 20.8% |
| Standard Deviation (Population) | 5.9% | 20.3% |
Similar Demographics by Disability Age Under 5
Demographics Similar to Spaniards by Disability Age Under 5
In terms of disability age under 5, the demographic groups most similar to Spaniards are Immigrants from Cameroon (1.4%, a difference of 0.43%), Potawatomi (1.4%, a difference of 0.52%), Russian (1.4%, a difference of 0.65%), Immigrants from England (1.4%, a difference of 0.66%), and Eastern European (1.4%, a difference of 0.70%).
| Demographics | Rating | Rank | Disability Age Under 5 |
| Basques | 3.0 /100 | #237 | Tragic 1.3% |
| Spanish American Indians | 2.4 /100 | #238 | Tragic 1.3% |
| Immigrants | Austria | 2.3 /100 | #239 | Tragic 1.3% |
| Native Hawaiians | 2.2 /100 | #240 | Tragic 1.3% |
| Maltese | 2.2 /100 | #241 | Tragic 1.3% |
| Lumbee | 2.1 /100 | #242 | Tragic 1.3% |
| Immigrants | Cameroon | 1.7 /100 | #243 | Tragic 1.4% |
| Spaniards | 1.4 /100 | #244 | Tragic 1.4% |
| Potawatomi | 1.1 /100 | #245 | Tragic 1.4% |
| Russians | 1.0 /100 | #246 | Tragic 1.4% |
| Immigrants | England | 1.0 /100 | #247 | Tragic 1.4% |
| Eastern Europeans | 1.0 /100 | #248 | Tragic 1.4% |
| Bermudans | 1.0 /100 | #249 | Tragic 1.4% |
| Africans | 1.0 /100 | #250 | Tragic 1.4% |
| Immigrants | Hungary | 1.0 /100 | #251 | Tragic 1.4% |
Demographics Similar to Seminole by Disability Age Under 5
In terms of disability age under 5, the demographic groups most similar to Seminole are Blackfeet (1.6%, a difference of 0.16%), Creek (1.6%, a difference of 0.19%), Scottish (1.6%, a difference of 0.26%), Navajo (1.6%, a difference of 0.40%), and Swiss (1.6%, a difference of 0.63%).
| Demographics | Rating | Rank | Disability Age Under 5 |
| Immigrants | Nonimmigrants | 0.0 /100 | #297 | Tragic 1.6% |
| Cajuns | 0.0 /100 | #298 | Tragic 1.6% |
| Portuguese | 0.0 /100 | #299 | Tragic 1.6% |
| Shoshone | 0.0 /100 | #300 | Tragic 1.6% |
| German Russians | 0.0 /100 | #301 | Tragic 1.6% |
| Welsh | 0.0 /100 | #302 | Tragic 1.6% |
| Swiss | 0.0 /100 | #303 | Tragic 1.6% |
| Seminole | 0.0 /100 | #304 | Tragic 1.6% |
| Blackfeet | 0.0 /100 | #305 | Tragic 1.6% |
| Creek | 0.0 /100 | #306 | Tragic 1.6% |
| Scottish | 0.0 /100 | #307 | Tragic 1.6% |
| Navajo | 0.0 /100 | #308 | Tragic 1.6% |
| Cape Verdeans | 0.0 /100 | #309 | Tragic 1.7% |
| Whites/Caucasians | 0.0 /100 | #310 | Tragic 1.7% |
| English | 0.0 /100 | #311 | Tragic 1.7% |