Spaniard vs Puerto Rican Disability Age Under 5
COMPARE
Spaniard
Puerto Rican
Disability Age Under 5
Disability Age Under 5 Comparison
Spaniards
Puerto Ricans
1.4%
DISABILITY AGE UNDER 5
1.4/ 100
METRIC RATING
244th/ 347
METRIC RANK
1.7%
DISABILITY AGE UNDER 5
0.0/ 100
METRIC RATING
312th/ 347
METRIC RANK
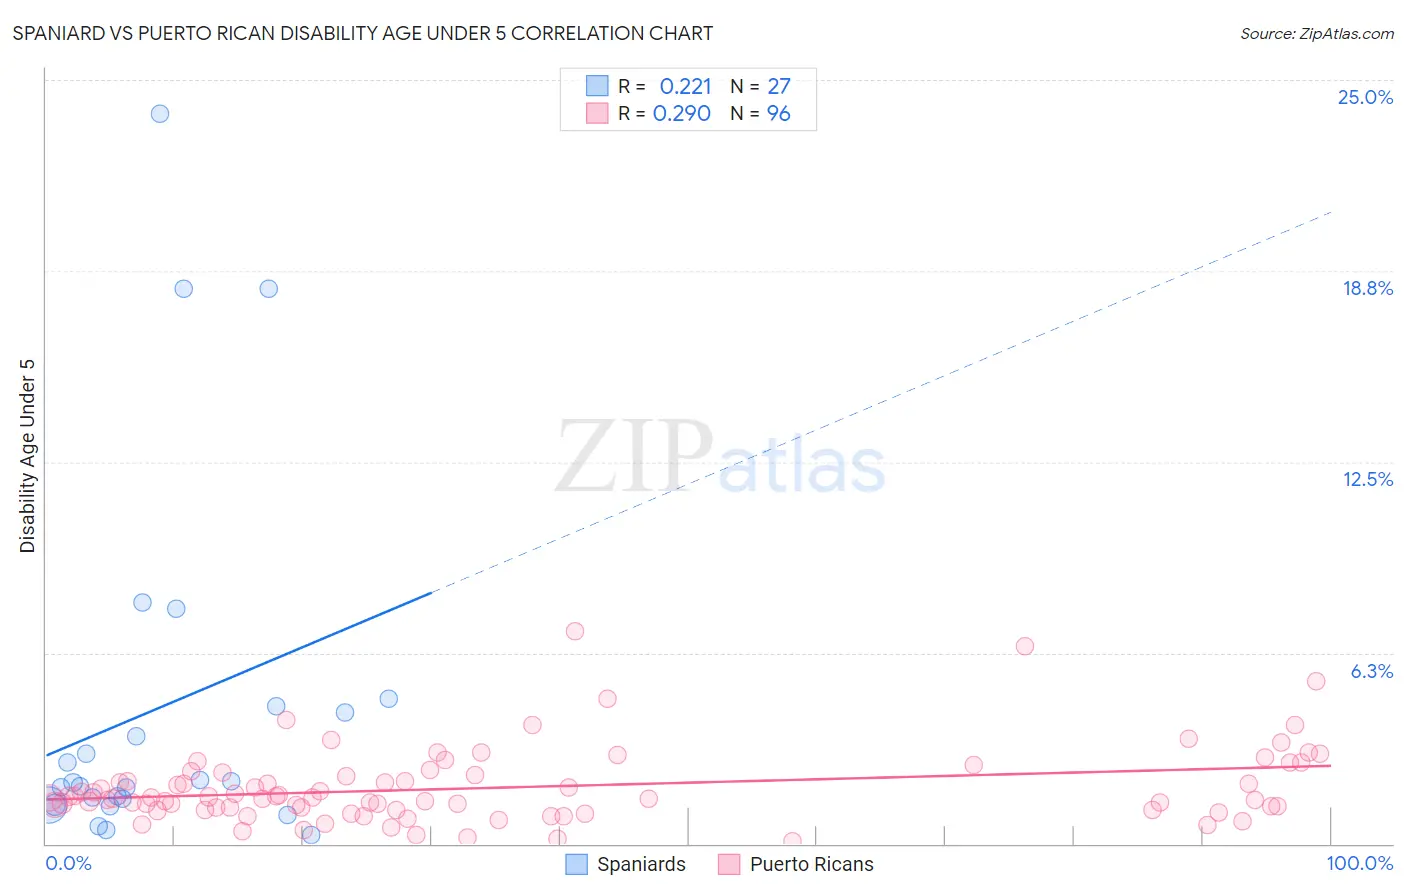
Spaniard vs Puerto Rican Disability Age Under 5 Correlation Chart
The statistical analysis conducted on geographies consisting of 233,722,649 people shows a weak positive correlation between the proportion of Spaniards and percentage of population with a disability under the age of 5 in the United States with a correlation coefficient (R) of 0.221 and weighted average of 1.4%. Similarly, the statistical analysis conducted on geographies consisting of 255,895,905 people shows a weak positive correlation between the proportion of Puerto Ricans and percentage of population with a disability under the age of 5 in the United States with a correlation coefficient (R) of 0.290 and weighted average of 1.7%, a difference of 23.0%.
Disability Age Under 5 Correlation Summary
| Measurement | Spaniard | Puerto Rican |
| Minimum | 0.27% | 0.10% |
| Maximum | 23.9% | 6.9% |
| Range | 23.6% | 6.8% |
| Mean | 4.5% | 1.8% |
| Median | 2.0% | 1.5% |
| Interquartile 25% (IQ1) | 1.3% | 1.2% |
| Interquartile 75% (IQ3) | 4.5% | 2.3% |
| Interquartile Range (IQR) | 3.2% | 1.1% |
| Standard Deviation (Sample) | 6.0% | 1.2% |
| Standard Deviation (Population) | 5.9% | 1.2% |
Similar Demographics by Disability Age Under 5
Demographics Similar to Spaniards by Disability Age Under 5
In terms of disability age under 5, the demographic groups most similar to Spaniards are Immigrants from Cameroon (1.4%, a difference of 0.43%), Potawatomi (1.4%, a difference of 0.52%), Russian (1.4%, a difference of 0.65%), Immigrants from England (1.4%, a difference of 0.66%), and Eastern European (1.4%, a difference of 0.70%).
| Demographics | Rating | Rank | Disability Age Under 5 |
| Basques | 3.0 /100 | #237 | Tragic 1.3% |
| Spanish American Indians | 2.4 /100 | #238 | Tragic 1.3% |
| Immigrants | Austria | 2.3 /100 | #239 | Tragic 1.3% |
| Native Hawaiians | 2.2 /100 | #240 | Tragic 1.3% |
| Maltese | 2.2 /100 | #241 | Tragic 1.3% |
| Lumbee | 2.1 /100 | #242 | Tragic 1.3% |
| Immigrants | Cameroon | 1.7 /100 | #243 | Tragic 1.4% |
| Spaniards | 1.4 /100 | #244 | Tragic 1.4% |
| Potawatomi | 1.1 /100 | #245 | Tragic 1.4% |
| Russians | 1.0 /100 | #246 | Tragic 1.4% |
| Immigrants | England | 1.0 /100 | #247 | Tragic 1.4% |
| Eastern Europeans | 1.0 /100 | #248 | Tragic 1.4% |
| Bermudans | 1.0 /100 | #249 | Tragic 1.4% |
| Africans | 1.0 /100 | #250 | Tragic 1.4% |
| Immigrants | Hungary | 1.0 /100 | #251 | Tragic 1.4% |
Demographics Similar to Puerto Ricans by Disability Age Under 5
In terms of disability age under 5, the demographic groups most similar to Puerto Ricans are English (1.7%, a difference of 0.040%), Celtic (1.7%, a difference of 0.16%), Norwegian (1.7%, a difference of 0.32%), Dutch (1.7%, a difference of 0.58%), and White/Caucasian (1.7%, a difference of 0.63%).
| Demographics | Rating | Rank | Disability Age Under 5 |
| Blackfeet | 0.0 /100 | #305 | Tragic 1.6% |
| Creek | 0.0 /100 | #306 | Tragic 1.6% |
| Scottish | 0.0 /100 | #307 | Tragic 1.6% |
| Navajo | 0.0 /100 | #308 | Tragic 1.6% |
| Cape Verdeans | 0.0 /100 | #309 | Tragic 1.7% |
| Whites/Caucasians | 0.0 /100 | #310 | Tragic 1.7% |
| English | 0.0 /100 | #311 | Tragic 1.7% |
| Puerto Ricans | 0.0 /100 | #312 | Tragic 1.7% |
| Celtics | 0.0 /100 | #313 | Tragic 1.7% |
| Norwegians | 0.0 /100 | #314 | Tragic 1.7% |
| Dutch | 0.0 /100 | #315 | Tragic 1.7% |
| Immigrants | Cabo Verde | 0.0 /100 | #316 | Tragic 1.7% |
| French | 0.0 /100 | #317 | Tragic 1.7% |
| Irish | 0.0 /100 | #318 | Tragic 1.7% |
| Slovaks | 0.0 /100 | #319 | Tragic 1.7% |