Spaniard vs Kiowa Disability Age Under 5
COMPARE
Spaniard
Kiowa
Disability Age Under 5
Disability Age Under 5 Comparison
Spaniards
Kiowa
1.4%
DISABILITY AGE UNDER 5
1.4/ 100
METRIC RATING
244th/ 347
METRIC RANK
1.5%
DISABILITY AGE UNDER 5
0.0/ 100
METRIC RATING
278th/ 347
METRIC RANK
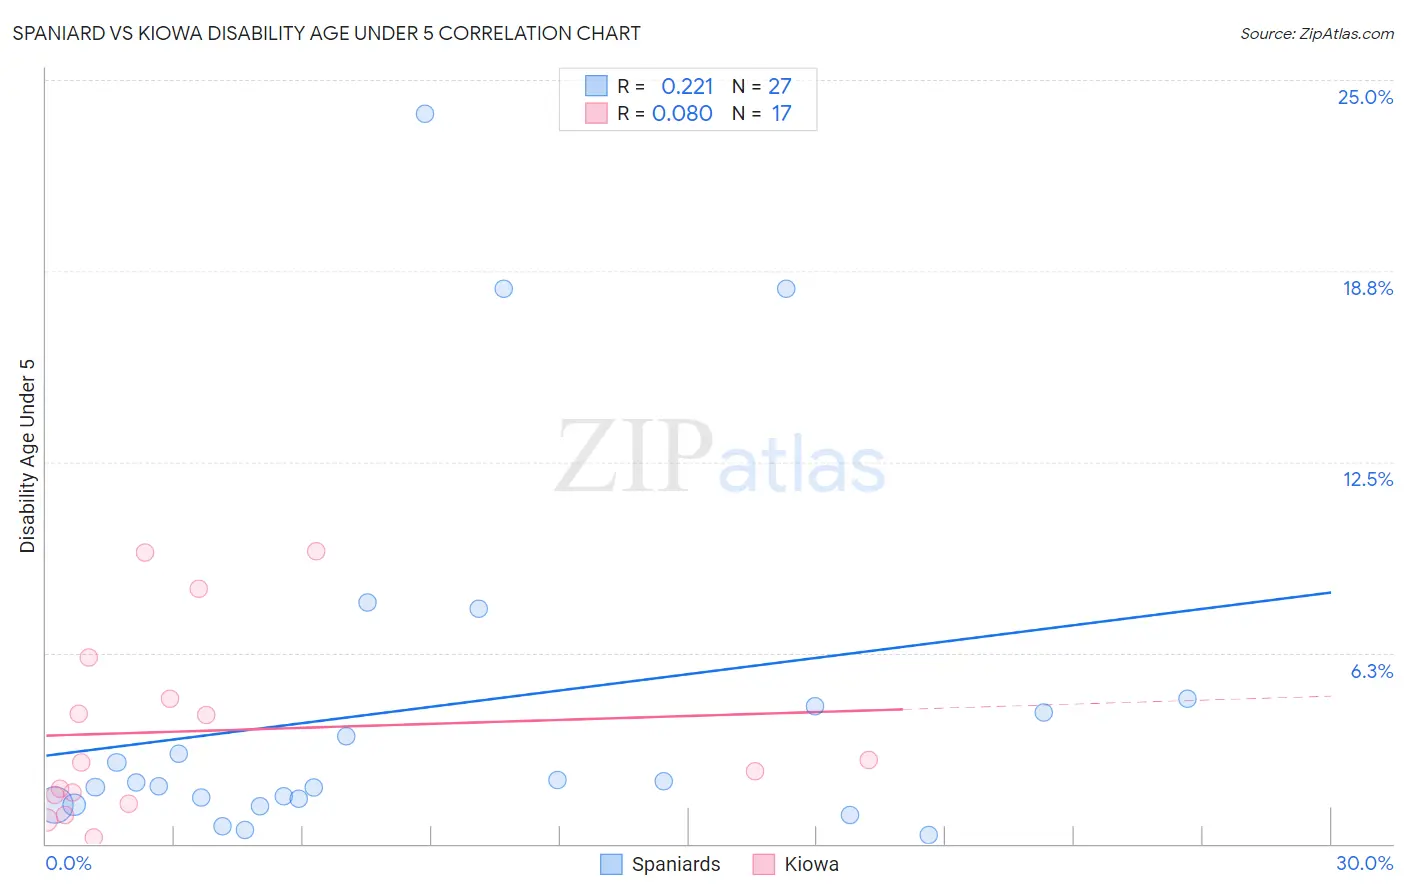
Spaniard vs Kiowa Disability Age Under 5 Correlation Chart
The statistical analysis conducted on geographies consisting of 233,722,649 people shows a weak positive correlation between the proportion of Spaniards and percentage of population with a disability under the age of 5 in the United States with a correlation coefficient (R) of 0.221 and weighted average of 1.4%. Similarly, the statistical analysis conducted on geographies consisting of 48,964,732 people shows a slight positive correlation between the proportion of Kiowa and percentage of population with a disability under the age of 5 in the United States with a correlation coefficient (R) of 0.080 and weighted average of 1.5%, a difference of 8.6%.
Disability Age Under 5 Correlation Summary
| Measurement | Spaniard | Kiowa |
| Minimum | 0.27% | 0.20% |
| Maximum | 23.9% | 9.6% |
| Range | 23.6% | 9.4% |
| Mean | 4.5% | 3.7% |
| Median | 2.0% | 2.6% |
| Interquartile 25% (IQ1) | 1.3% | 1.4% |
| Interquartile 75% (IQ3) | 4.5% | 5.4% |
| Interquartile Range (IQR) | 3.2% | 4.0% |
| Standard Deviation (Sample) | 6.0% | 3.0% |
| Standard Deviation (Population) | 5.9% | 2.9% |
Similar Demographics by Disability Age Under 5
Demographics Similar to Spaniards by Disability Age Under 5
In terms of disability age under 5, the demographic groups most similar to Spaniards are Immigrants from Cameroon (1.4%, a difference of 0.43%), Potawatomi (1.4%, a difference of 0.52%), Russian (1.4%, a difference of 0.65%), Immigrants from England (1.4%, a difference of 0.66%), and Eastern European (1.4%, a difference of 0.70%).
| Demographics | Rating | Rank | Disability Age Under 5 |
| Basques | 3.0 /100 | #237 | Tragic 1.3% |
| Spanish American Indians | 2.4 /100 | #238 | Tragic 1.3% |
| Immigrants | Austria | 2.3 /100 | #239 | Tragic 1.3% |
| Native Hawaiians | 2.2 /100 | #240 | Tragic 1.3% |
| Maltese | 2.2 /100 | #241 | Tragic 1.3% |
| Lumbee | 2.1 /100 | #242 | Tragic 1.3% |
| Immigrants | Cameroon | 1.7 /100 | #243 | Tragic 1.4% |
| Spaniards | 1.4 /100 | #244 | Tragic 1.4% |
| Potawatomi | 1.1 /100 | #245 | Tragic 1.4% |
| Russians | 1.0 /100 | #246 | Tragic 1.4% |
| Immigrants | England | 1.0 /100 | #247 | Tragic 1.4% |
| Eastern Europeans | 1.0 /100 | #248 | Tragic 1.4% |
| Bermudans | 1.0 /100 | #249 | Tragic 1.4% |
| Africans | 1.0 /100 | #250 | Tragic 1.4% |
| Immigrants | Hungary | 1.0 /100 | #251 | Tragic 1.4% |
Demographics Similar to Kiowa by Disability Age Under 5
In terms of disability age under 5, the demographic groups most similar to Kiowa are Danish (1.5%, a difference of 0.010%), Canadian (1.5%, a difference of 0.080%), British (1.5%, a difference of 0.77%), Greek (1.5%, a difference of 0.78%), and Brazilian (1.5%, a difference of 1.4%).
| Demographics | Rating | Rank | Disability Age Under 5 |
| Immigrants | Canada | 0.1 /100 | #271 | Tragic 1.4% |
| Blacks/African Americans | 0.1 /100 | #272 | Tragic 1.4% |
| Alaskan Athabascans | 0.1 /100 | #273 | Tragic 1.5% |
| Iroquois | 0.0 /100 | #274 | Tragic 1.5% |
| Brazilians | 0.0 /100 | #275 | Tragic 1.5% |
| Greeks | 0.0 /100 | #276 | Tragic 1.5% |
| Canadians | 0.0 /100 | #277 | Tragic 1.5% |
| Kiowa | 0.0 /100 | #278 | Tragic 1.5% |
| Danes | 0.0 /100 | #279 | Tragic 1.5% |
| British | 0.0 /100 | #280 | Tragic 1.5% |
| Czechoslovakians | 0.0 /100 | #281 | Tragic 1.5% |
| Cheyenne | 0.0 /100 | #282 | Tragic 1.5% |
| Delaware | 0.0 /100 | #283 | Tragic 1.5% |
| Europeans | 0.0 /100 | #284 | Tragic 1.5% |
| Croatians | 0.0 /100 | #285 | Tragic 1.5% |