Spaniard vs Lebanese Disability Age Under 5
COMPARE
Spaniard
Lebanese
Disability Age Under 5
Disability Age Under 5 Comparison
Spaniards
Lebanese
1.4%
DISABILITY AGE UNDER 5
1.4/ 100
METRIC RATING
244th/ 347
METRIC RANK
1.3%
DISABILITY AGE UNDER 5
5.3/ 100
METRIC RATING
230th/ 347
METRIC RANK
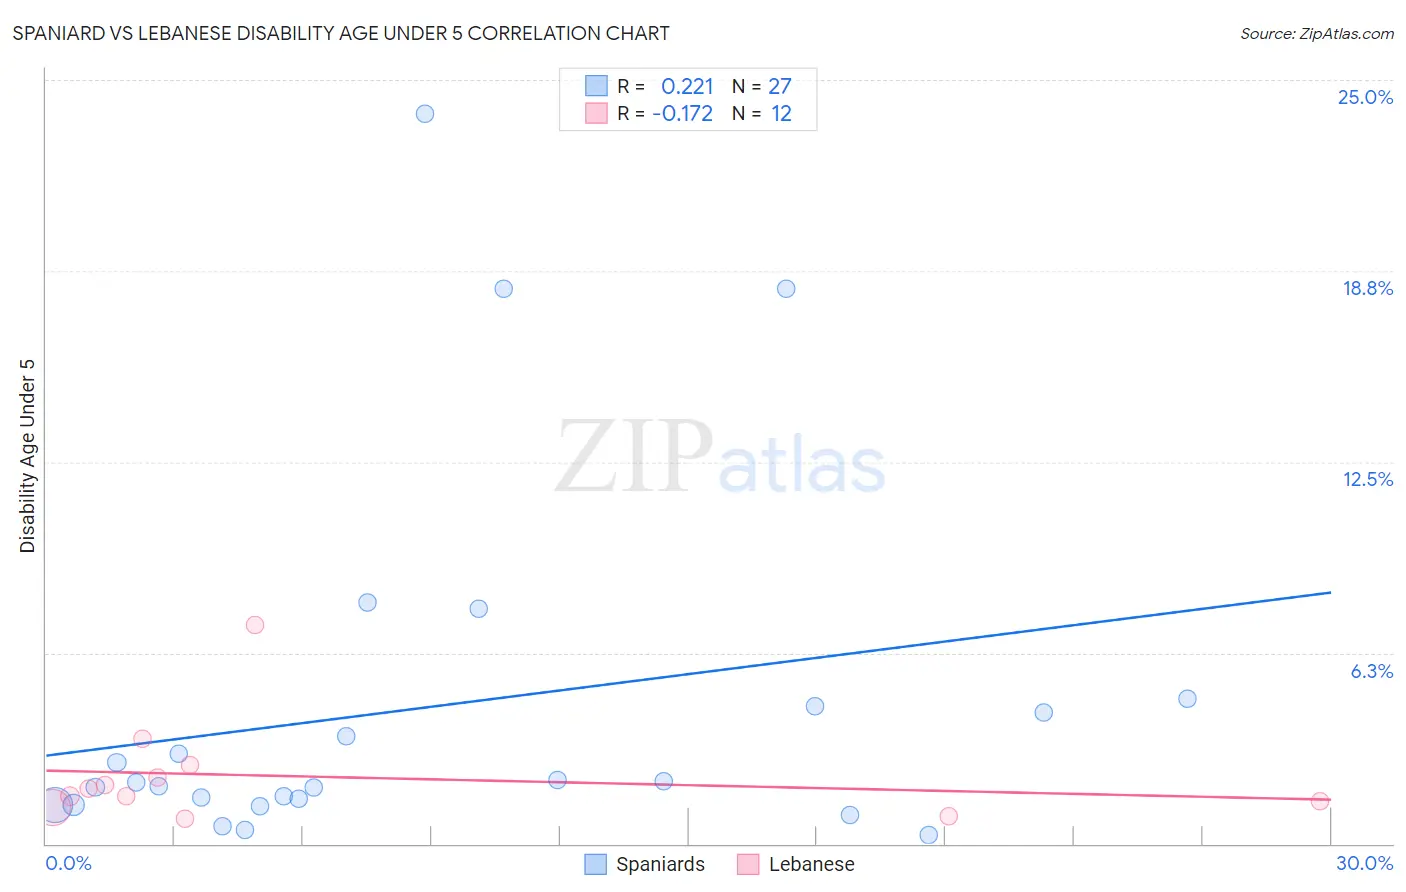
Spaniard vs Lebanese Disability Age Under 5 Correlation Chart
The statistical analysis conducted on geographies consisting of 233,722,649 people shows a weak positive correlation between the proportion of Spaniards and percentage of population with a disability under the age of 5 in the United States with a correlation coefficient (R) of 0.221 and weighted average of 1.4%. Similarly, the statistical analysis conducted on geographies consisting of 215,601,141 people shows a poor negative correlation between the proportion of Lebanese and percentage of population with a disability under the age of 5 in the United States with a correlation coefficient (R) of -0.172 and weighted average of 1.3%, a difference of 2.9%.
Disability Age Under 5 Correlation Summary
| Measurement | Spaniard | Lebanese |
| Minimum | 0.27% | 0.84% |
| Maximum | 23.9% | 7.1% |
| Range | 23.6% | 6.3% |
| Mean | 4.5% | 2.2% |
| Median | 2.0% | 1.7% |
| Interquartile 25% (IQ1) | 1.3% | 1.3% |
| Interquartile 75% (IQ3) | 4.5% | 2.4% |
| Interquartile Range (IQR) | 3.2% | 1.1% |
| Standard Deviation (Sample) | 6.0% | 1.7% |
| Standard Deviation (Population) | 5.9% | 1.6% |
Demographics Similar to Spaniards and Lebanese by Disability Age Under 5
In terms of disability age under 5, the demographic groups most similar to Spaniards are Immigrants from Cameroon (1.4%, a difference of 0.43%), Potawatomi (1.4%, a difference of 0.52%), Russian (1.4%, a difference of 0.65%), Immigrants from England (1.4%, a difference of 0.66%), and Lumbee (1.3%, a difference of 0.81%). Similarly, the demographic groups most similar to Lebanese are Immigrants from Costa Rica (1.3%, a difference of 0.10%), Immigrants from Northern Europe (1.3%, a difference of 0.25%), Luxembourger (1.3%, a difference of 0.31%), Taiwanese (1.3%, a difference of 0.32%), and French American Indian (1.3%, a difference of 0.38%).
| Demographics | Rating | Rank | Disability Age Under 5 |
| Taiwanese | 6.1 /100 | #227 | Tragic 1.3% |
| Luxembourgers | 6.1 /100 | #228 | Tragic 1.3% |
| Immigrants | Costa Rica | 5.5 /100 | #229 | Tragic 1.3% |
| Lebanese | 5.3 /100 | #230 | Tragic 1.3% |
| Immigrants | Northern Europe | 4.7 /100 | #231 | Tragic 1.3% |
| French American Indians | 4.5 /100 | #232 | Tragic 1.3% |
| Tongans | 4.2 /100 | #233 | Tragic 1.3% |
| Pueblo | 3.8 /100 | #234 | Tragic 1.3% |
| Central American Indians | 3.6 /100 | #235 | Tragic 1.3% |
| South American Indians | 3.3 /100 | #236 | Tragic 1.3% |
| Basques | 3.0 /100 | #237 | Tragic 1.3% |
| Spanish American Indians | 2.4 /100 | #238 | Tragic 1.3% |
| Immigrants | Austria | 2.3 /100 | #239 | Tragic 1.3% |
| Native Hawaiians | 2.2 /100 | #240 | Tragic 1.3% |
| Maltese | 2.2 /100 | #241 | Tragic 1.3% |
| Lumbee | 2.1 /100 | #242 | Tragic 1.3% |
| Immigrants | Cameroon | 1.7 /100 | #243 | Tragic 1.4% |
| Spaniards | 1.4 /100 | #244 | Tragic 1.4% |
| Potawatomi | 1.1 /100 | #245 | Tragic 1.4% |
| Russians | 1.0 /100 | #246 | Tragic 1.4% |
| Immigrants | England | 1.0 /100 | #247 | Tragic 1.4% |