South American vs Spanish American Indian Disability Age Under 5
COMPARE
South American
Spanish American Indian
Disability Age Under 5
Disability Age Under 5 Comparison
South Americans
Spanish American Indians
1.2%
DISABILITY AGE UNDER 5
75.6/ 100
METRIC RATING
150th/ 347
METRIC RANK
1.3%
DISABILITY AGE UNDER 5
2.4/ 100
METRIC RATING
238th/ 347
METRIC RANK
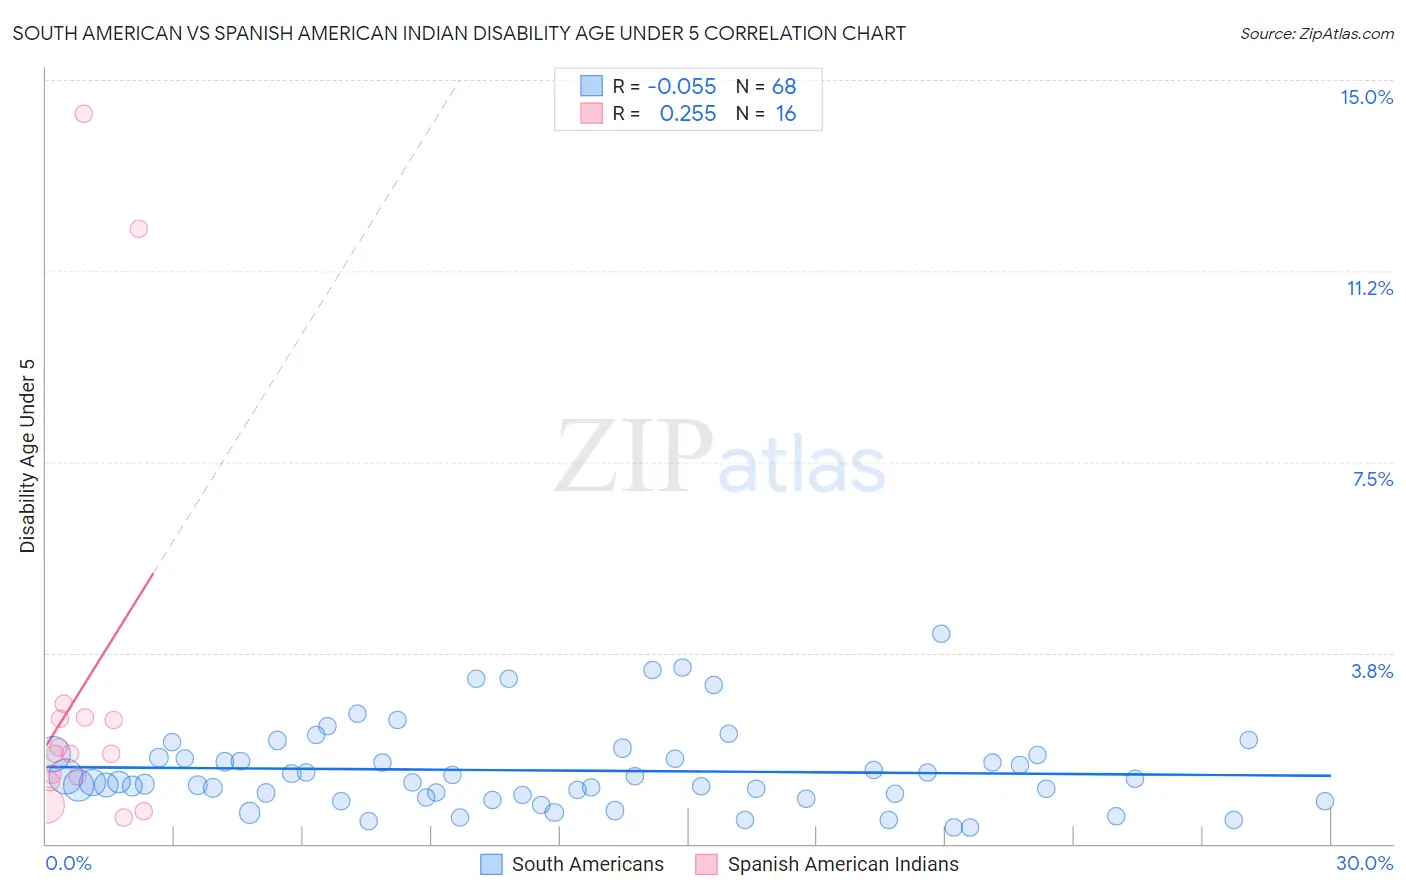
South American vs Spanish American Indian Disability Age Under 5 Correlation Chart
The statistical analysis conducted on geographies consisting of 248,221,421 people shows a slight negative correlation between the proportion of South Americans and percentage of population with a disability under the age of 5 in the United States with a correlation coefficient (R) of -0.055 and weighted average of 1.2%. Similarly, the statistical analysis conducted on geographies consisting of 62,046,351 people shows a weak positive correlation between the proportion of Spanish American Indians and percentage of population with a disability under the age of 5 in the United States with a correlation coefficient (R) of 0.255 and weighted average of 1.3%, a difference of 11.2%.
Disability Age Under 5 Correlation Summary
| Measurement | South American | Spanish American Indian |
| Minimum | 0.32% | 0.53% |
| Maximum | 4.1% | 14.3% |
| Range | 3.8% | 13.8% |
| Mean | 1.4% | 3.1% |
| Median | 1.2% | 1.8% |
| Interquartile 25% (IQ1) | 0.93% | 1.3% |
| Interquartile 75% (IQ3) | 1.7% | 2.5% |
| Interquartile Range (IQR) | 0.78% | 1.2% |
| Standard Deviation (Sample) | 0.81% | 4.0% |
| Standard Deviation (Population) | 0.81% | 3.9% |
Similar Demographics by Disability Age Under 5
Demographics Similar to South Americans by Disability Age Under 5
In terms of disability age under 5, the demographic groups most similar to South Americans are Kenyan (1.2%, a difference of 0.040%), Ghanaian (1.2%, a difference of 0.090%), Icelander (1.2%, a difference of 0.10%), Yaqui (1.2%, a difference of 0.10%), and Samoan (1.2%, a difference of 0.27%).
| Demographics | Rating | Rank | Disability Age Under 5 |
| Alsatians | 79.3 /100 | #143 | Good 1.2% |
| Immigrants | Middle Africa | 79.3 /100 | #144 | Good 1.2% |
| Immigrants | Zimbabwe | 77.9 /100 | #145 | Good 1.2% |
| Samoans | 77.7 /100 | #146 | Good 1.2% |
| Icelanders | 76.3 /100 | #147 | Good 1.2% |
| Ghanaians | 76.3 /100 | #148 | Good 1.2% |
| Kenyans | 75.9 /100 | #149 | Good 1.2% |
| South Americans | 75.6 /100 | #150 | Good 1.2% |
| Yaqui | 74.8 /100 | #151 | Good 1.2% |
| Hondurans | 72.5 /100 | #152 | Good 1.2% |
| Immigrants | Thailand | 69.4 /100 | #153 | Good 1.2% |
| Uruguayans | 68.8 /100 | #154 | Good 1.2% |
| Immigrants | Ghana | 68.7 /100 | #155 | Good 1.2% |
| Hawaiians | 68.5 /100 | #156 | Good 1.2% |
| Immigrants | South America | 67.0 /100 | #157 | Good 1.2% |
Demographics Similar to Spanish American Indians by Disability Age Under 5
In terms of disability age under 5, the demographic groups most similar to Spanish American Indians are Immigrants from Austria (1.3%, a difference of 0.16%), Native Hawaiian (1.3%, a difference of 0.18%), Maltese (1.3%, a difference of 0.25%), Lumbee (1.3%, a difference of 0.34%), and Basque (1.3%, a difference of 0.43%).
| Demographics | Rating | Rank | Disability Age Under 5 |
| Immigrants | Northern Europe | 4.7 /100 | #231 | Tragic 1.3% |
| French American Indians | 4.5 /100 | #232 | Tragic 1.3% |
| Tongans | 4.2 /100 | #233 | Tragic 1.3% |
| Pueblo | 3.8 /100 | #234 | Tragic 1.3% |
| Central American Indians | 3.6 /100 | #235 | Tragic 1.3% |
| South American Indians | 3.3 /100 | #236 | Tragic 1.3% |
| Basques | 3.0 /100 | #237 | Tragic 1.3% |
| Spanish American Indians | 2.4 /100 | #238 | Tragic 1.3% |
| Immigrants | Austria | 2.3 /100 | #239 | Tragic 1.3% |
| Native Hawaiians | 2.2 /100 | #240 | Tragic 1.3% |
| Maltese | 2.2 /100 | #241 | Tragic 1.3% |
| Lumbee | 2.1 /100 | #242 | Tragic 1.3% |
| Immigrants | Cameroon | 1.7 /100 | #243 | Tragic 1.4% |
| Spaniards | 1.4 /100 | #244 | Tragic 1.4% |
| Potawatomi | 1.1 /100 | #245 | Tragic 1.4% |