South American vs Cajun Disability Age Under 5
COMPARE
South American
Cajun
Disability Age Under 5
Disability Age Under 5 Comparison
South Americans
Cajuns
1.2%
DISABILITY AGE UNDER 5
75.6/ 100
METRIC RATING
150th/ 347
METRIC RANK
1.6%
DISABILITY AGE UNDER 5
0.0/ 100
METRIC RATING
298th/ 347
METRIC RANK
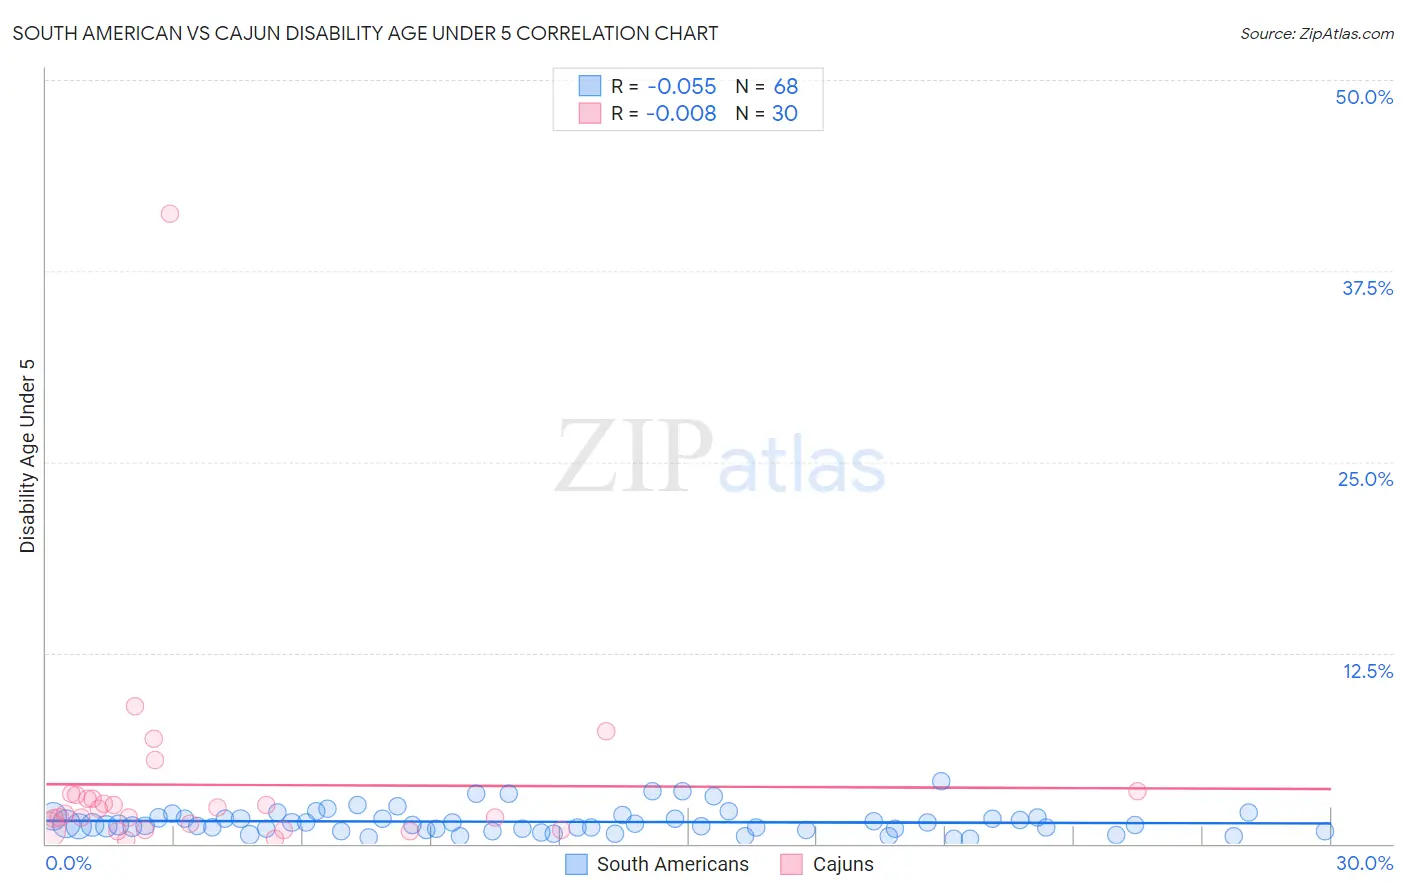
South American vs Cajun Disability Age Under 5 Correlation Chart
The statistical analysis conducted on geographies consisting of 248,221,421 people shows a slight negative correlation between the proportion of South Americans and percentage of population with a disability under the age of 5 in the United States with a correlation coefficient (R) of -0.055 and weighted average of 1.2%. Similarly, the statistical analysis conducted on geographies consisting of 103,694,895 people shows no correlation between the proportion of Cajuns and percentage of population with a disability under the age of 5 in the United States with a correlation coefficient (R) of -0.008 and weighted average of 1.6%, a difference of 32.9%.
Disability Age Under 5 Correlation Summary
| Measurement | South American | Cajun |
| Minimum | 0.32% | 0.26% |
| Maximum | 4.1% | 41.3% |
| Range | 3.8% | 41.0% |
| Mean | 1.4% | 3.9% |
| Median | 1.2% | 2.1% |
| Interquartile 25% (IQ1) | 0.93% | 0.93% |
| Interquartile 75% (IQ3) | 1.7% | 3.2% |
| Interquartile Range (IQR) | 0.78% | 2.3% |
| Standard Deviation (Sample) | 0.81% | 7.4% |
| Standard Deviation (Population) | 0.81% | 7.2% |
Similar Demographics by Disability Age Under 5
Demographics Similar to South Americans by Disability Age Under 5
In terms of disability age under 5, the demographic groups most similar to South Americans are Kenyan (1.2%, a difference of 0.040%), Ghanaian (1.2%, a difference of 0.090%), Icelander (1.2%, a difference of 0.10%), Yaqui (1.2%, a difference of 0.10%), and Samoan (1.2%, a difference of 0.27%).
| Demographics | Rating | Rank | Disability Age Under 5 |
| Alsatians | 79.3 /100 | #143 | Good 1.2% |
| Immigrants | Middle Africa | 79.3 /100 | #144 | Good 1.2% |
| Immigrants | Zimbabwe | 77.9 /100 | #145 | Good 1.2% |
| Samoans | 77.7 /100 | #146 | Good 1.2% |
| Icelanders | 76.3 /100 | #147 | Good 1.2% |
| Ghanaians | 76.3 /100 | #148 | Good 1.2% |
| Kenyans | 75.9 /100 | #149 | Good 1.2% |
| South Americans | 75.6 /100 | #150 | Good 1.2% |
| Yaqui | 74.8 /100 | #151 | Good 1.2% |
| Hondurans | 72.5 /100 | #152 | Good 1.2% |
| Immigrants | Thailand | 69.4 /100 | #153 | Good 1.2% |
| Uruguayans | 68.8 /100 | #154 | Good 1.2% |
| Immigrants | Ghana | 68.7 /100 | #155 | Good 1.2% |
| Hawaiians | 68.5 /100 | #156 | Good 1.2% |
| Immigrants | South America | 67.0 /100 | #157 | Good 1.2% |
Demographics Similar to Cajuns by Disability Age Under 5
In terms of disability age under 5, the demographic groups most similar to Cajuns are Nonimmigrants (1.6%, a difference of 0.010%), Portuguese (1.6%, a difference of 0.57%), Shoshone (1.6%, a difference of 0.91%), Polish (1.6%, a difference of 0.96%), and Finnish (1.6%, a difference of 1.0%).
| Demographics | Rating | Rank | Disability Age Under 5 |
| Northern Europeans | 0.0 /100 | #291 | Tragic 1.6% |
| Italians | 0.0 /100 | #292 | Tragic 1.6% |
| Lithuanians | 0.0 /100 | #293 | Tragic 1.6% |
| Swedes | 0.0 /100 | #294 | Tragic 1.6% |
| Finns | 0.0 /100 | #295 | Tragic 1.6% |
| Poles | 0.0 /100 | #296 | Tragic 1.6% |
| Immigrants | Nonimmigrants | 0.0 /100 | #297 | Tragic 1.6% |
| Cajuns | 0.0 /100 | #298 | Tragic 1.6% |
| Portuguese | 0.0 /100 | #299 | Tragic 1.6% |
| Shoshone | 0.0 /100 | #300 | Tragic 1.6% |
| German Russians | 0.0 /100 | #301 | Tragic 1.6% |
| Welsh | 0.0 /100 | #302 | Tragic 1.6% |
| Swiss | 0.0 /100 | #303 | Tragic 1.6% |
| Seminole | 0.0 /100 | #304 | Tragic 1.6% |
| Blackfeet | 0.0 /100 | #305 | Tragic 1.6% |