Ecuadorian vs Japanese Disability Age Under 5
COMPARE
Ecuadorian
Japanese
Disability Age Under 5
Disability Age Under 5 Comparison
Ecuadorians
Japanese
1.1%
DISABILITY AGE UNDER 5
99.5/ 100
METRIC RATING
56th/ 347
METRIC RANK
1.2%
DISABILITY AGE UNDER 5
90.3/ 100
METRIC RATING
125th/ 347
METRIC RANK
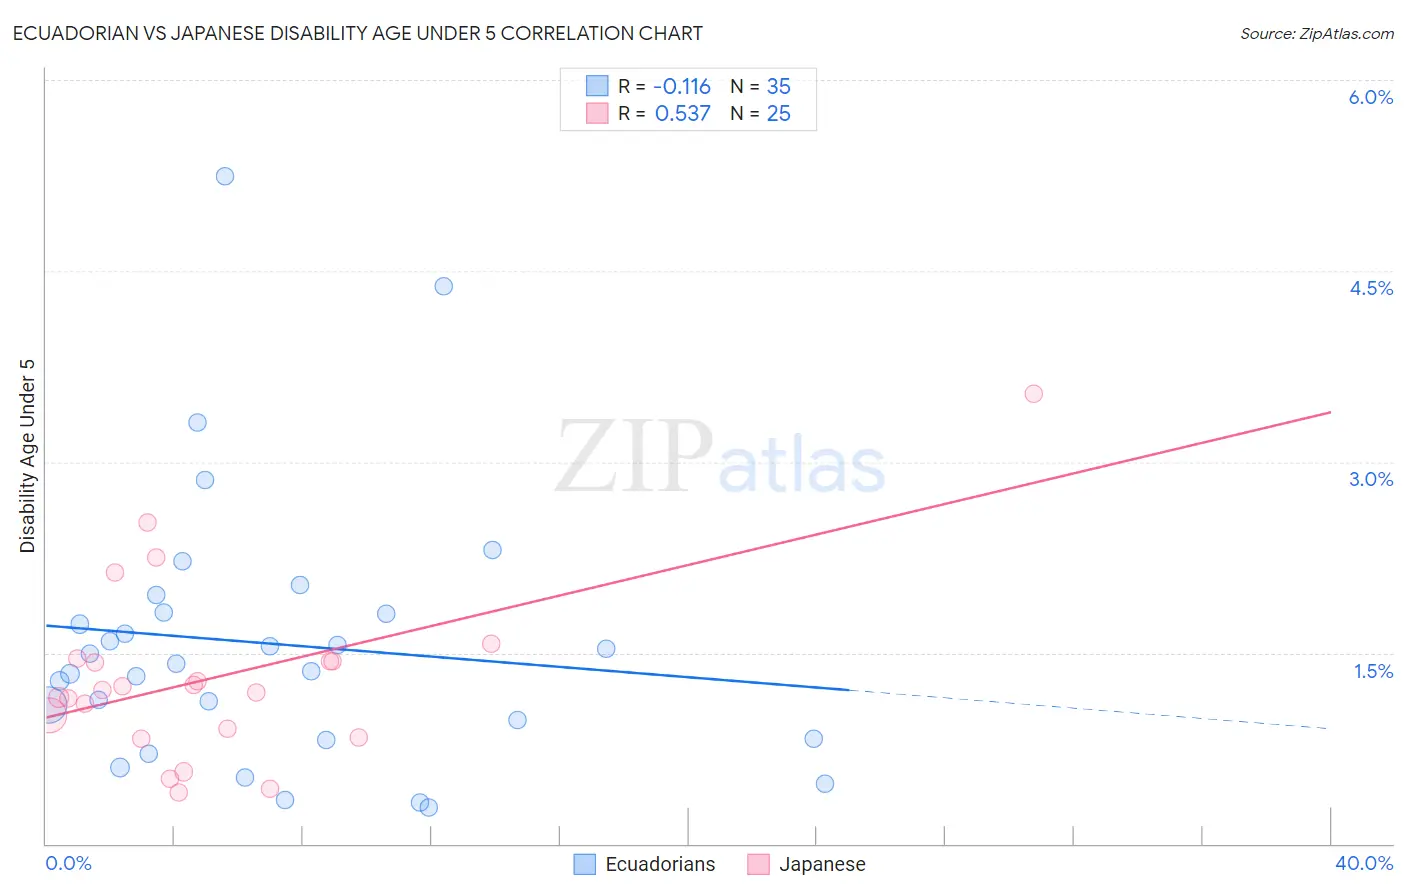
Ecuadorian vs Japanese Disability Age Under 5 Correlation Chart
The statistical analysis conducted on geographies consisting of 186,376,762 people shows a poor negative correlation between the proportion of Ecuadorians and percentage of population with a disability under the age of 5 in the United States with a correlation coefficient (R) of -0.116 and weighted average of 1.1%. Similarly, the statistical analysis conducted on geographies consisting of 161,189,921 people shows a substantial positive correlation between the proportion of Japanese and percentage of population with a disability under the age of 5 in the United States with a correlation coefficient (R) of 0.537 and weighted average of 1.2%, a difference of 7.7%.
Disability Age Under 5 Correlation Summary
| Measurement | Ecuadorian | Japanese |
| Minimum | 0.28% | 0.40% |
| Maximum | 5.2% | 3.5% |
| Range | 5.0% | 3.1% |
| Mean | 1.6% | 1.3% |
| Median | 1.4% | 1.2% |
| Interquartile 25% (IQ1) | 0.82% | 0.87% |
| Interquartile 75% (IQ3) | 1.8% | 1.4% |
| Interquartile Range (IQR) | 1.00% | 0.58% |
| Standard Deviation (Sample) | 1.1% | 0.70% |
| Standard Deviation (Population) | 1.1% | 0.69% |
Similar Demographics by Disability Age Under 5
Demographics Similar to Ecuadorians by Disability Age Under 5
In terms of disability age under 5, the demographic groups most similar to Ecuadorians are Assyrian/Chaldean/Syriac (1.1%, a difference of 0.030%), Immigrants from Egypt (1.1%, a difference of 0.22%), Immigrants from Malaysia (1.1%, a difference of 0.33%), Salvadoran (1.1%, a difference of 0.39%), and Immigrants from El Salvador (1.1%, a difference of 0.49%).
| Demographics | Rating | Rank | Disability Age Under 5 |
| Immigrants | Russia | 99.7 /100 | #49 | Exceptional 1.1% |
| Immigrants | Japan | 99.7 /100 | #50 | Exceptional 1.1% |
| Immigrants | Kazakhstan | 99.7 /100 | #51 | Exceptional 1.1% |
| Immigrants | Bolivia | 99.6 /100 | #52 | Exceptional 1.1% |
| Asians | 99.6 /100 | #53 | Exceptional 1.1% |
| Immigrants | El Salvador | 99.6 /100 | #54 | Exceptional 1.1% |
| Salvadorans | 99.5 /100 | #55 | Exceptional 1.1% |
| Ecuadorians | 99.5 /100 | #56 | Exceptional 1.1% |
| Assyrians/Chaldeans/Syriacs | 99.5 /100 | #57 | Exceptional 1.1% |
| Immigrants | Egypt | 99.4 /100 | #58 | Exceptional 1.1% |
| Immigrants | Malaysia | 99.4 /100 | #59 | Exceptional 1.1% |
| Immigrants | Western Asia | 99.2 /100 | #60 | Exceptional 1.1% |
| Immigrants | Ethiopia | 99.2 /100 | #61 | Exceptional 1.1% |
| Immigrants | Switzerland | 99.2 /100 | #62 | Exceptional 1.1% |
| Immigrants | Vietnam | 99.1 /100 | #63 | Exceptional 1.1% |
Demographics Similar to Japanese by Disability Age Under 5
In terms of disability age under 5, the demographic groups most similar to Japanese are Immigrants from Cambodia (1.2%, a difference of 0.060%), Zimbabwean (1.2%, a difference of 0.080%), Aleut (1.2%, a difference of 0.13%), Central American (1.2%, a difference of 0.16%), and Immigrants from Senegal (1.2%, a difference of 0.32%).
| Demographics | Rating | Rank | Disability Age Under 5 |
| Immigrants | Venezuela | 93.4 /100 | #118 | Exceptional 1.2% |
| Bhutanese | 92.5 /100 | #119 | Exceptional 1.2% |
| Immigrants | Eritrea | 92.3 /100 | #120 | Exceptional 1.2% |
| Immigrants | Senegal | 91.4 /100 | #121 | Exceptional 1.2% |
| Aleuts | 90.7 /100 | #122 | Exceptional 1.2% |
| Zimbabweans | 90.6 /100 | #123 | Exceptional 1.2% |
| Immigrants | Cambodia | 90.5 /100 | #124 | Exceptional 1.2% |
| Japanese | 90.3 /100 | #125 | Exceptional 1.2% |
| Central Americans | 89.7 /100 | #126 | Excellent 1.2% |
| Immigrants | Romania | 88.4 /100 | #127 | Excellent 1.2% |
| Immigrants | France | 88.4 /100 | #128 | Excellent 1.2% |
| Immigrants | Immigrants | 88.0 /100 | #129 | Excellent 1.2% |
| Koreans | 87.7 /100 | #130 | Excellent 1.2% |
| Immigrants | Serbia | 87.6 /100 | #131 | Excellent 1.2% |
| Immigrants | Eastern Europe | 87.3 /100 | #132 | Excellent 1.2% |