Canadian vs Immigrants from Portugal Disability Age Under 5
COMPARE
Canadian
Immigrants from Portugal
Disability Age Under 5
Disability Age Under 5 Comparison
Canadians
Immigrants from Portugal
1.5%
DISABILITY AGE UNDER 5
0.0/ 100
METRIC RATING
277th/ 347
METRIC RANK
1.8%
DISABILITY AGE UNDER 5
0.0/ 100
METRIC RATING
325th/ 347
METRIC RANK
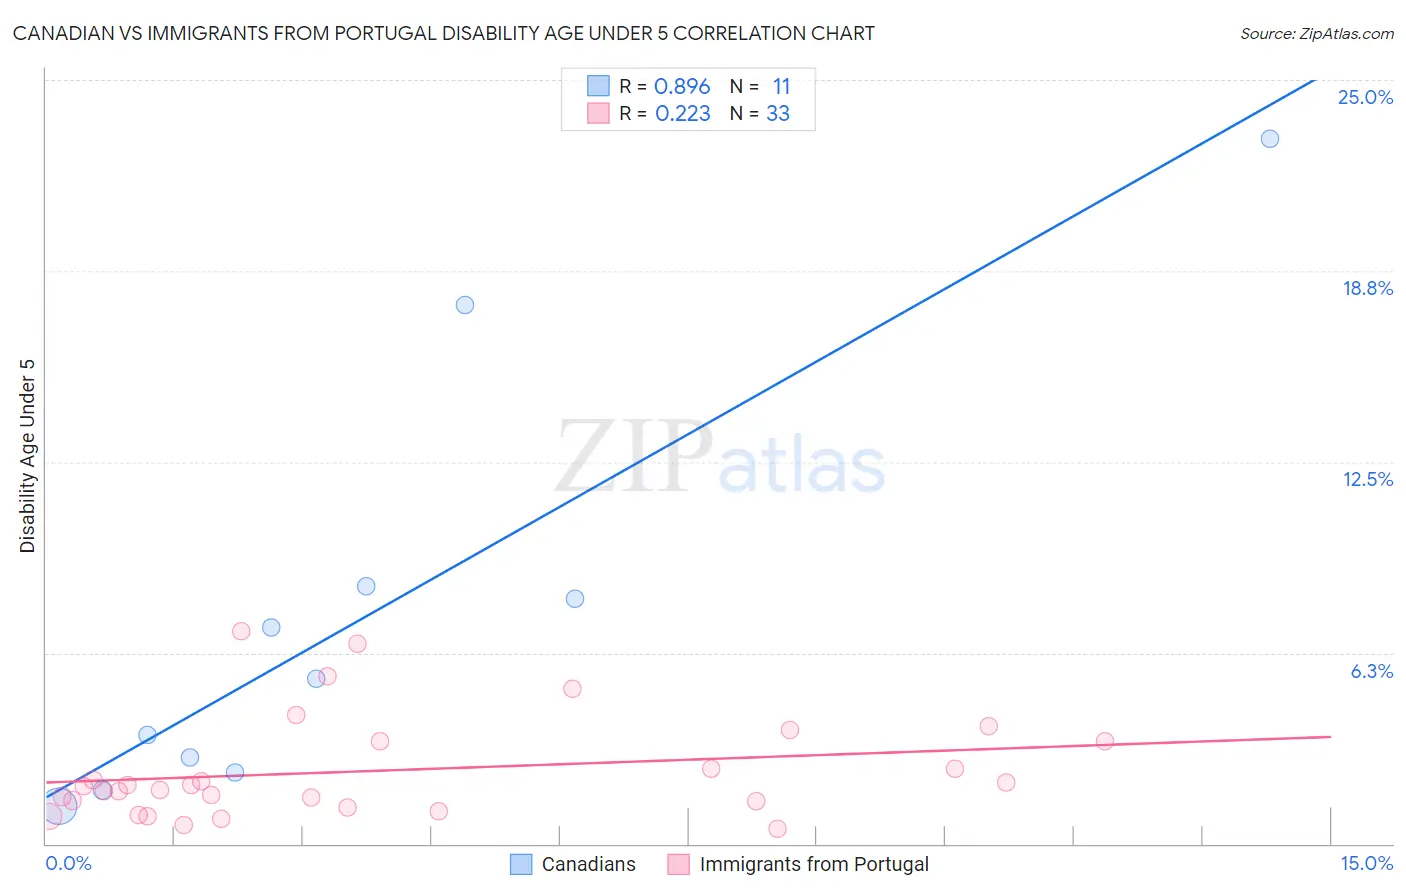
Canadian vs Immigrants from Portugal Disability Age Under 5 Correlation Chart
The statistical analysis conducted on geographies consisting of 226,239,251 people shows a very strong positive correlation between the proportion of Canadians and percentage of population with a disability under the age of 5 in the United States with a correlation coefficient (R) of 0.896 and weighted average of 1.5%. Similarly, the statistical analysis conducted on geographies consisting of 112,092,431 people shows a weak positive correlation between the proportion of Immigrants from Portugal and percentage of population with a disability under the age of 5 in the United States with a correlation coefficient (R) of 0.223 and weighted average of 1.8%, a difference of 21.7%.
Disability Age Under 5 Correlation Summary
| Measurement | Canadian | Immigrants from Portugal |
| Minimum | 1.2% | 0.48% |
| Maximum | 23.1% | 6.9% |
| Range | 21.8% | 6.5% |
| Mean | 7.4% | 2.4% |
| Median | 5.4% | 1.9% |
| Interquartile 25% (IQ1) | 2.3% | 1.3% |
| Interquartile 75% (IQ3) | 8.4% | 3.4% |
| Interquartile Range (IQR) | 6.1% | 2.1% |
| Standard Deviation (Sample) | 7.0% | 1.7% |
| Standard Deviation (Population) | 6.7% | 1.6% |
Similar Demographics by Disability Age Under 5
Demographics Similar to Canadians by Disability Age Under 5
In terms of disability age under 5, the demographic groups most similar to Canadians are Kiowa (1.5%, a difference of 0.080%), Danish (1.5%, a difference of 0.090%), Greek (1.5%, a difference of 0.70%), British (1.5%, a difference of 0.85%), and Brazilian (1.5%, a difference of 1.3%).
| Demographics | Rating | Rank | Disability Age Under 5 |
| Immigrants | North America | 0.1 /100 | #270 | Tragic 1.4% |
| Immigrants | Canada | 0.1 /100 | #271 | Tragic 1.4% |
| Blacks/African Americans | 0.1 /100 | #272 | Tragic 1.4% |
| Alaskan Athabascans | 0.1 /100 | #273 | Tragic 1.5% |
| Iroquois | 0.0 /100 | #274 | Tragic 1.5% |
| Brazilians | 0.0 /100 | #275 | Tragic 1.5% |
| Greeks | 0.0 /100 | #276 | Tragic 1.5% |
| Canadians | 0.0 /100 | #277 | Tragic 1.5% |
| Kiowa | 0.0 /100 | #278 | Tragic 1.5% |
| Danes | 0.0 /100 | #279 | Tragic 1.5% |
| British | 0.0 /100 | #280 | Tragic 1.5% |
| Czechoslovakians | 0.0 /100 | #281 | Tragic 1.5% |
| Cheyenne | 0.0 /100 | #282 | Tragic 1.5% |
| Delaware | 0.0 /100 | #283 | Tragic 1.5% |
| Europeans | 0.0 /100 | #284 | Tragic 1.5% |
Demographics Similar to Immigrants from Portugal by Disability Age Under 5
In terms of disability age under 5, the demographic groups most similar to Immigrants from Portugal are Cherokee (1.8%, a difference of 1.3%), Sioux (1.8%, a difference of 1.4%), Osage (1.8%, a difference of 1.8%), Chickasaw (1.7%, a difference of 3.1%), and American (1.9%, a difference of 3.5%).
| Demographics | Rating | Rank | Disability Age Under 5 |
| Irish | 0.0 /100 | #318 | Tragic 1.7% |
| Slovaks | 0.0 /100 | #319 | Tragic 1.7% |
| Scotch-Irish | 0.0 /100 | #320 | Tragic 1.7% |
| Ottawa | 0.0 /100 | #321 | Tragic 1.7% |
| Germans | 0.0 /100 | #322 | Tragic 1.7% |
| Chickasaw | 0.0 /100 | #323 | Tragic 1.7% |
| Cherokee | 0.0 /100 | #324 | Tragic 1.8% |
| Immigrants | Portugal | 0.0 /100 | #325 | Tragic 1.8% |
| Sioux | 0.0 /100 | #326 | Tragic 1.8% |
| Osage | 0.0 /100 | #327 | Tragic 1.8% |
| Americans | 0.0 /100 | #328 | Tragic 1.9% |
| Houma | 0.0 /100 | #329 | Tragic 1.9% |
| Choctaw | 0.0 /100 | #330 | Tragic 1.9% |
| French Canadians | 0.0 /100 | #331 | Tragic 1.9% |
| Chippewa | 0.0 /100 | #332 | Tragic 1.9% |