Canadian vs Immigrants from Belarus Disability Age Under 5
COMPARE
Canadian
Immigrants from Belarus
Disability Age Under 5
Disability Age Under 5 Comparison
Canadians
Immigrants from Belarus
1.5%
DISABILITY AGE UNDER 5
0.0/ 100
METRIC RATING
277th/ 347
METRIC RANK
1.0%
DISABILITY AGE UNDER 5
100.0/ 100
METRIC RATING
29th/ 347
METRIC RANK
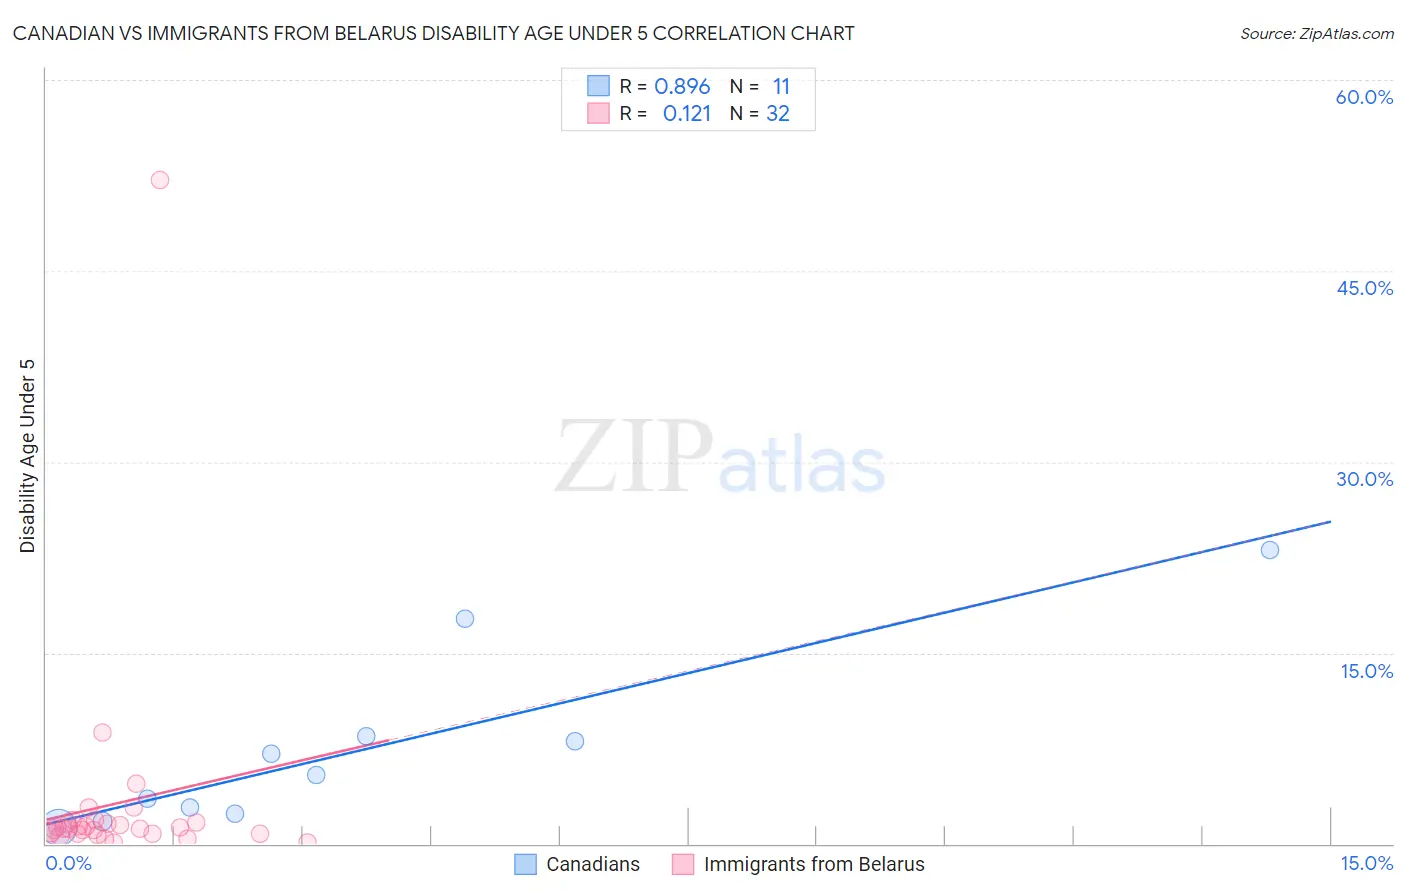
Canadian vs Immigrants from Belarus Disability Age Under 5 Correlation Chart
The statistical analysis conducted on geographies consisting of 226,239,251 people shows a very strong positive correlation between the proportion of Canadians and percentage of population with a disability under the age of 5 in the United States with a correlation coefficient (R) of 0.896 and weighted average of 1.5%. Similarly, the statistical analysis conducted on geographies consisting of 102,408,276 people shows a poor positive correlation between the proportion of Immigrants from Belarus and percentage of population with a disability under the age of 5 in the United States with a correlation coefficient (R) of 0.121 and weighted average of 1.0%, a difference of 44.2%.
Disability Age Under 5 Correlation Summary
| Measurement | Canadian | Immigrants from Belarus |
| Minimum | 1.2% | 0.12% |
| Maximum | 23.1% | 52.1% |
| Range | 21.8% | 52.0% |
| Mean | 7.4% | 3.1% |
| Median | 5.4% | 1.2% |
| Interquartile 25% (IQ1) | 2.3% | 0.78% |
| Interquartile 75% (IQ3) | 8.4% | 1.6% |
| Interquartile Range (IQR) | 6.1% | 0.83% |
| Standard Deviation (Sample) | 7.0% | 9.1% |
| Standard Deviation (Population) | 6.7% | 8.9% |
Similar Demographics by Disability Age Under 5
Demographics Similar to Canadians by Disability Age Under 5
In terms of disability age under 5, the demographic groups most similar to Canadians are Kiowa (1.5%, a difference of 0.080%), Danish (1.5%, a difference of 0.090%), Greek (1.5%, a difference of 0.70%), British (1.5%, a difference of 0.85%), and Brazilian (1.5%, a difference of 1.3%).
| Demographics | Rating | Rank | Disability Age Under 5 |
| Immigrants | North America | 0.1 /100 | #270 | Tragic 1.4% |
| Immigrants | Canada | 0.1 /100 | #271 | Tragic 1.4% |
| Blacks/African Americans | 0.1 /100 | #272 | Tragic 1.4% |
| Alaskan Athabascans | 0.1 /100 | #273 | Tragic 1.5% |
| Iroquois | 0.0 /100 | #274 | Tragic 1.5% |
| Brazilians | 0.0 /100 | #275 | Tragic 1.5% |
| Greeks | 0.0 /100 | #276 | Tragic 1.5% |
| Canadians | 0.0 /100 | #277 | Tragic 1.5% |
| Kiowa | 0.0 /100 | #278 | Tragic 1.5% |
| Danes | 0.0 /100 | #279 | Tragic 1.5% |
| British | 0.0 /100 | #280 | Tragic 1.5% |
| Czechoslovakians | 0.0 /100 | #281 | Tragic 1.5% |
| Cheyenne | 0.0 /100 | #282 | Tragic 1.5% |
| Delaware | 0.0 /100 | #283 | Tragic 1.5% |
| Europeans | 0.0 /100 | #284 | Tragic 1.5% |
Demographics Similar to Immigrants from Belarus by Disability Age Under 5
In terms of disability age under 5, the demographic groups most similar to Immigrants from Belarus are Immigrants from Eastern Asia (1.0%, a difference of 0.12%), Immigrants from South Central Asia (1.0%, a difference of 0.52%), Guyanese (1.0%, a difference of 0.76%), Armenian (1.0%, a difference of 0.81%), and Iranian (1.0%, a difference of 0.86%).
| Demographics | Rating | Rank | Disability Age Under 5 |
| Immigrants | Iran | 100.0 /100 | #22 | Exceptional 1.00% |
| Yakama | 100.0 /100 | #23 | Exceptional 1.00% |
| Indians (Asian) | 100.0 /100 | #24 | Exceptional 1.0% |
| Immigrants | Micronesia | 100.0 /100 | #25 | Exceptional 1.0% |
| Immigrants | Taiwan | 100.0 /100 | #26 | Exceptional 1.0% |
| Guyanese | 100.0 /100 | #27 | Exceptional 1.0% |
| Immigrants | Eastern Asia | 100.0 /100 | #28 | Exceptional 1.0% |
| Immigrants | Belarus | 100.0 /100 | #29 | Exceptional 1.0% |
| Immigrants | South Central Asia | 99.9 /100 | #30 | Exceptional 1.0% |
| Armenians | 99.9 /100 | #31 | Exceptional 1.0% |
| Iranians | 99.9 /100 | #32 | Exceptional 1.0% |
| Bolivians | 99.9 /100 | #33 | Exceptional 1.0% |
| Immigrants | Ukraine | 99.9 /100 | #34 | Exceptional 1.0% |
| Barbadians | 99.9 /100 | #35 | Exceptional 1.0% |
| Immigrants | Nepal | 99.9 /100 | #36 | Exceptional 1.0% |