Zip Codes with the Largest Austrian Community in Malibu, CA
On this page
RELATED REPORTS & OPTIONS
Austrian
Population
Highest PopulationHighest Population DensityLowest Population DensityMale / Female RatioFemale / Male RatioOldest PopulationOldest Population | MaleOldest Population | FemaleYoungest PopulationYoungest Population | MaleYoungest Population | Female
Race (Community Size)
Race (Percentage)
Ancestry (Community Size)
AmericanArabAustrianBahamianBhutaneseBrazilianBritishBurmeseCentral AmericanCherokeeChileanCroatianCubanCzechDanishDutchEastern EuropeanEcuadorianEnglishEuropeanFilipinoFrenchFrench CanadianGermanGreekGuatemalanHungarianIndian (Asian)IranianIrishItalianKoreanLaotianLithuanianMexicanNative HawaiianNorwegianPalestinianPolishPuerto RicanRussianSalvadoranScandinavianScottishSouth AfricanSouth AmericanSpaniardSpanishSri LankanSubsaharan AfricanSwedishSwissThaiUkrainian
Ancestry (Percentage)
AmericanArabAustrianBahamianBhutaneseBrazilianBritishBurmeseCentral AmericanCherokeeChileanCroatianCubanCzechDanishDutchEastern EuropeanEcuadorianEnglishEuropeanFilipinoFrenchFrench CanadianGermanGreekGuatemalanHungarianIndian (Asian)IranianIrishItalianKoreanLaotianLithuanianMexicanNative HawaiianNorwegianPalestinianPolishPuerto RicanRussianSalvadoranScandinavianScottishSouth AfricanSouth AmericanSpaniardSpanishSri LankanSubsaharan AfricanSwedishSwissThaiUkrainian
Immigrant Origin (Total)
AfricaAsiaBrazilCanadaCaribbeanCentral AmericaChinaEastern AfricaEastern AsiaEastern EuropeEl SalvadorEuropeHungaryIndiaIndonesiaIsraelKenyaKoreaLatin AmericaOceaniaPhilippinesSingaporeSouth AmericaSouth Central AsiaSouth Eastern AsiaTaiwanWestern Asia
Immigrant Origin (Percentage)
AfricaAsiaBrazilCanadaCaribbeanCentral AmericaChinaEastern AfricaEastern AsiaEastern EuropeEl SalvadorEuropeHungaryIndiaIndonesiaIsraelKenyaKoreaLatin AmericaOceaniaPhilippinesSingaporeSouth AmericaSouth Central AsiaSouth Eastern AsiaTaiwanWestern Asia
Income
Highest Per Capita IncomeHighest Earnings | MaleHighest Earnings | FemaleHighest Wage/Income Gap ($)Highest Wage/Income Gap (%)Lowest Per Capita IncomeLowest Earnings | MaleLowest Earnings | FemaleLowest Wage/Income Gap ($)Lowest Wage/Income Gap (%)
Unemployment
Highest UnemploymentHighest Unemployment | MaleHighest Unemployment | FemaleHighest Unemployment | Youth < 25Lowest UnemploymentLowest Unemployment | MaleLowest Unemployment | FemaleLowest Unemployment | Youth < 25
Employment Occupations
Architecture & EngineeringArts, Media & EntertainmentBusiness & FinancialCommunity & Social Service Computer & MathematicsComputer, Engineering & ScienceConstruction & ExtractionEducation Instruction & LibraryEducation, Arts & MediaFirefighting & PreventionFood Preparation & ServingInstallation, Maintenance & RepairLaw EnforcementLife, Physical & Social ScienceManagementMaterial MovingOffice & AdministrationPersonal Care and ServiceProductionSales & RelatedSecurity & ProtectionTransportation
Employment Industries
Accommodation & Food ServicesArts, Entertainment & RecreationConstructionEducational ServicesFinance & InsuranceHealth Care & Social AssistanceInformation & TechnologyPublic AdministrationReal Estate, Rental & LeasingRetail TradeTransportation & Warehousing
Employer Class
Private Company EmployeesSelf-Employed / Not IncorporatedNot-for-profit OrganizationsLocal Government EmployeesState Government Employees
Commute Time
Longest CommuteLongest Commute | MaleLongest Commute | FemaleShortest CommuteShortest Commute | MaleShortest Commute | Female
Commute Means
School Enrollment
Education by Degree Field
Malibu
States
AlabamaAlaskaArizonaArkansasCaliforniaColoradoConnecticutDelawareDistrict Of ColumbiaFloridaGeorgiaHawaiiIdahoIllinoisIndianaIowaKansasKentuckyLouisianaMaineMarylandMassachusettsMichiganMinnesotaMississippiMissouriMontanaNebraskaNevadaNew HampshireNew JerseyNew MexicoNew YorkNorth CarolinaNorth DakotaOhioOklahomaOregonPennsylvaniaPuerto RicoRhode IslandSouth CarolinaSouth DakotaTennesseeTexasUtahVermontVirginiaWashingtonWest VirginiaWisconsinWyoming
California Cities
AlhambraAnaheimApple ValleyArcadiaAuburnBakersfieldBerkeleyBeverly HillsBurbankCamarilloCanyon CountryCarlsbadCastro ValleyChicoChula VistaCitrus HeightsClovisConcordCoronaCosta MesaCulver CityDaly CityDanvilleDavisDesert Hot SpringsDuarteEl CajonElk GroveEncinoEscondidoEurekaFairfieldFontanaFremontFresnoFullertonGarden GroveGardenaGlendaleGlendoraGrass ValleyHaywardHemetHuntington BeachIndioInglewoodIrvineLa MesaLakewoodLancasterLivermoreLodiLompocLong BeachLos AltosLos AngelesLos GatosMaderaMalibuMantecaMenifeeMission ViejoModestoMoreno ValleyMountain ViewMurrietaNapaNewport BeachNorth HollywoodNorthridgeNovatoOaklandOceansideOntarioOrangeOrovilleOxnardPalm DesertPalm SpringsPalo AltoPasadenaPerrisPetalumaPleasantonRancho CordovaRancho CucamongaReddingRedondo BeachRedwood CityRichmondRiversideRocklinRosevilleSacramentoSalinasSan BernardinoSan ClementeSan DiegoSan FranciscoSan JoseSan LeandroSan Luis ObispoSan MarcosSan MateoSan PedroSan RafaelSan RamonSanta AnaSanta BarbaraSanta ClaraSanta ClaritaSanta CruzSanta MariaSanta MonicaSanta RosaSherman OaksSimi ValleyStocktonSunnyvaleTehachapiTemeculaThousand OaksTorranceTracyTurlockTustinTwentynine PalmsUplandVacavilleValenciaVallejoVan NuysVenturaVictorvilleVisaliaVistaWalnut CreekWest CovinaWhittierWoodlandWoodland HillsYuba City
Compare Zip Codes
Comparison Subject
Compare StatesCompare CitiesCompare Zip Codes
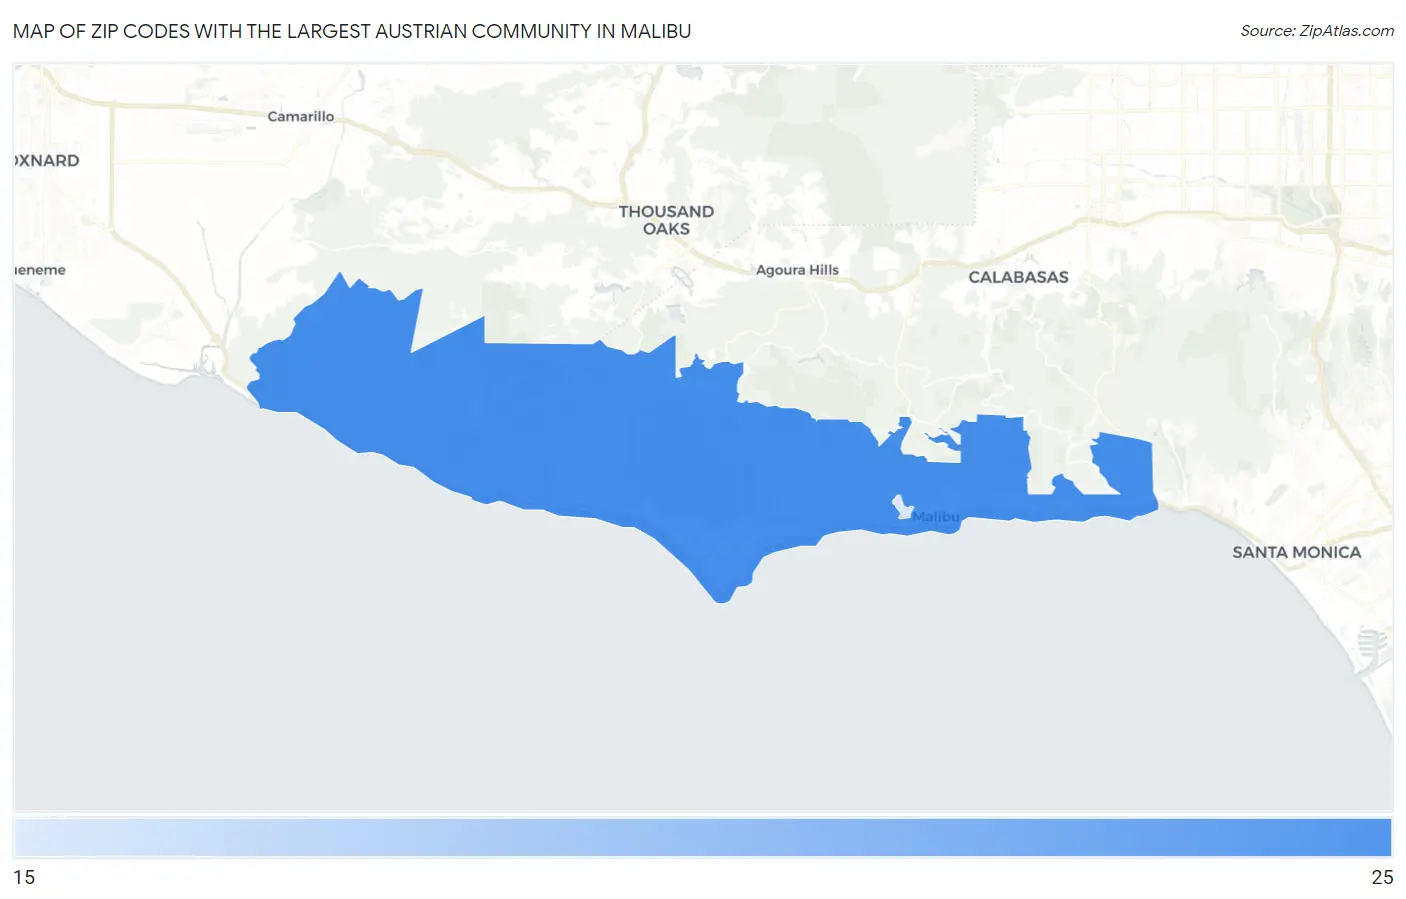
Map of Zip Codes with the Largest Austrian Community in Malibu
15
25
Zip Codes with the Largest Austrian Community in Malibu, CA
| Zip Code | Austrian | vs State | vs National | |
| 1. | 90265 | 25 | 62,120(0.04%)#641 | 616,016(0.00%)#6,287 |
| 2. | 90263 | 15 | 62,120(0.02%)#764 | 616,016(0.00%)#8,164 |
1
Common Questions
What are the Top Zip Codes with the Largest Austrian Community in Malibu, CA?
Top Zip Codes with the Largest Austrian Community in Malibu, CA are:
What zip code has the Largest Austrian Community in Malibu, CA?
90265 has the Largest Austrian Community in Malibu, CA with 25.
What is the Total Austrian Population in California?
Total Austrian Population in California is 62,120.
What is the Total Austrian Population in the United States?
Total Austrian Population in the United States is 616,016.