Zip Codes with the Highest Percentage of Population Employed in Business & Financial in Malibu, CA
RELATED REPORTS & OPTIONS
Business & Financial
Malibu
Compare Zip Codes
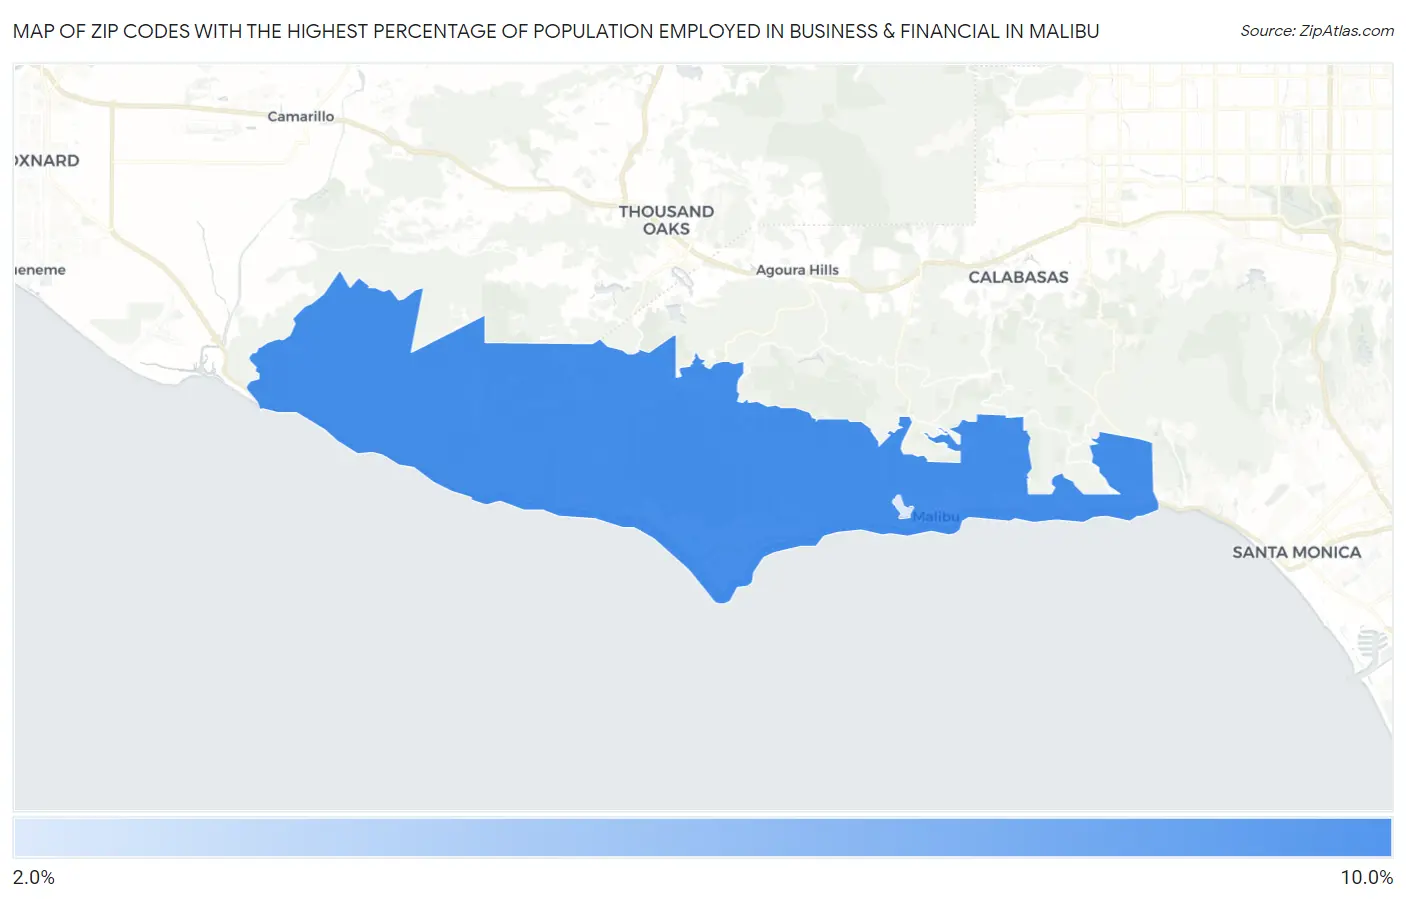
Map of Zip Codes with the Highest Percentage of Population Employed in Business & Financial in Malibu
2.2%
9.4%
Zip Codes with the Highest Percentage of Population Employed in Business & Financial in Malibu, CA
| Zip Code | % Employed | vs State | vs National | |
| 1. | 90265 | 9.4% | 5.8%(+3.57)#216 | 5.8%(+3.61)#2,746 |
| 2. | 90263 | 2.2% | 5.8%(-3.60)#1,276 | 5.8%(-3.57)#21,028 |
1
Common Questions
What are the Top Zip Codes with the Highest Percentage of Population Employed in Business & Financial in Malibu, CA?
Top Zip Codes with the Highest Percentage of Population Employed in Business & Financial in Malibu, CA are:
What zip code has the Highest Percentage of Population Employed in Business & Financial in Malibu, CA?
90265 has the Highest Percentage of Population Employed in Business & Financial in Malibu, CA with 9.4%.
What is the Percentage of Population Employed in Business & Financial in Malibu, CA?
Percentage of Population Employed in Business & Financial in Malibu is 10.7%.
What is the Percentage of Population Employed in Business & Financial in California?
Percentage of Population Employed in Business & Financial in California is 5.8%.
What is the Percentage of Population Employed in Business & Financial in the United States?
Percentage of Population Employed in Business & Financial in the United States is 5.8%.