Zip Codes with the Highest Percentage of Population Employed in Mining, Quarrying, & Extraction in Danville, CA
RELATED REPORTS & OPTIONS
Mining, Quarrying, & Extraction
Danville
Compare Zip Codes
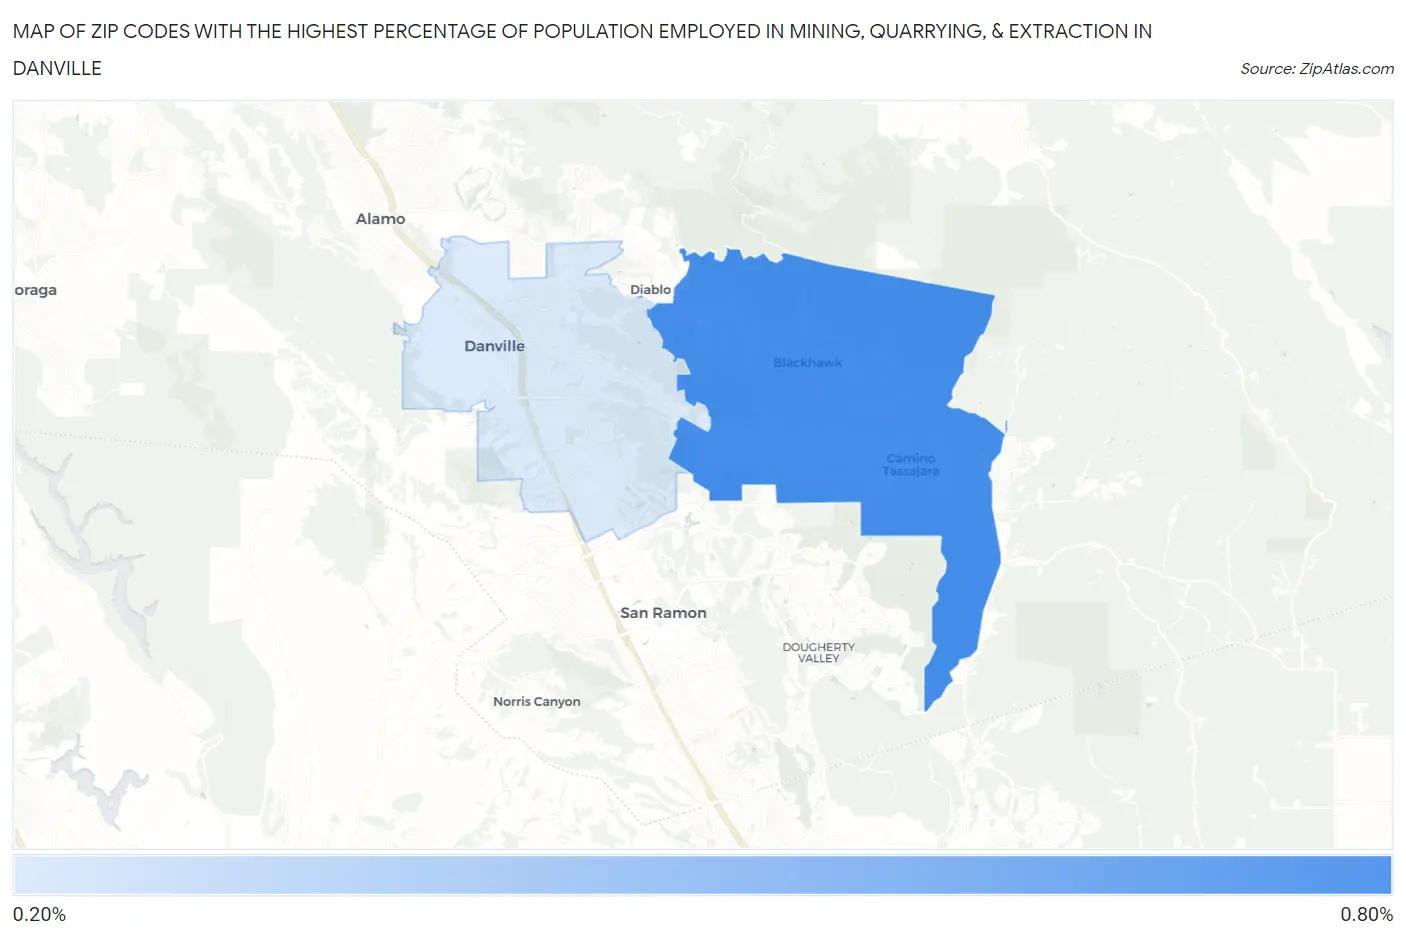
Map of Zip Codes with the Highest Percentage of Population Employed in Mining, Quarrying, & Extraction in Danville
0.25%
0.69%
Zip Codes with the Highest Percentage of Population Employed in Mining, Quarrying, & Extraction in Danville, CA
| Zip Code | % Employed | vs State | vs National | |
| 1. | 94506 | 0.69% | 0.12%(+0.570)#85 | 0.44%(+0.253)#6,356 |
| 2. | 94526 | 0.25% | 0.12%(+0.122)#169 | 0.44%(-0.195)#9,018 |
1
Common Questions
What are the Top Zip Codes with the Highest Percentage of Population Employed in Mining, Quarrying, & Extraction in Danville, CA?
Top Zip Codes with the Highest Percentage of Population Employed in Mining, Quarrying, & Extraction in Danville, CA are:
What zip code has the Highest Percentage of Population Employed in Mining, Quarrying, & Extraction in Danville, CA?
94506 has the Highest Percentage of Population Employed in Mining, Quarrying, & Extraction in Danville, CA with 0.69%.
What is the Percentage of Population Employed in Mining, Quarrying, & Extraction in Danville, CA?
Percentage of Population Employed in Mining, Quarrying, & Extraction in Danville is 0.34%.
What is the Percentage of Population Employed in Mining, Quarrying, & Extraction in California?
Percentage of Population Employed in Mining, Quarrying, & Extraction in California is 0.12%.
What is the Percentage of Population Employed in Mining, Quarrying, & Extraction in the United States?
Percentage of Population Employed in Mining, Quarrying, & Extraction in the United States is 0.44%.