Zip Codes with the Highest Percentage of Population Employed in Administrative & Support Services in Danville, CA
RELATED REPORTS & OPTIONS
Administrative & Support Services
Danville
Compare Zip Codes
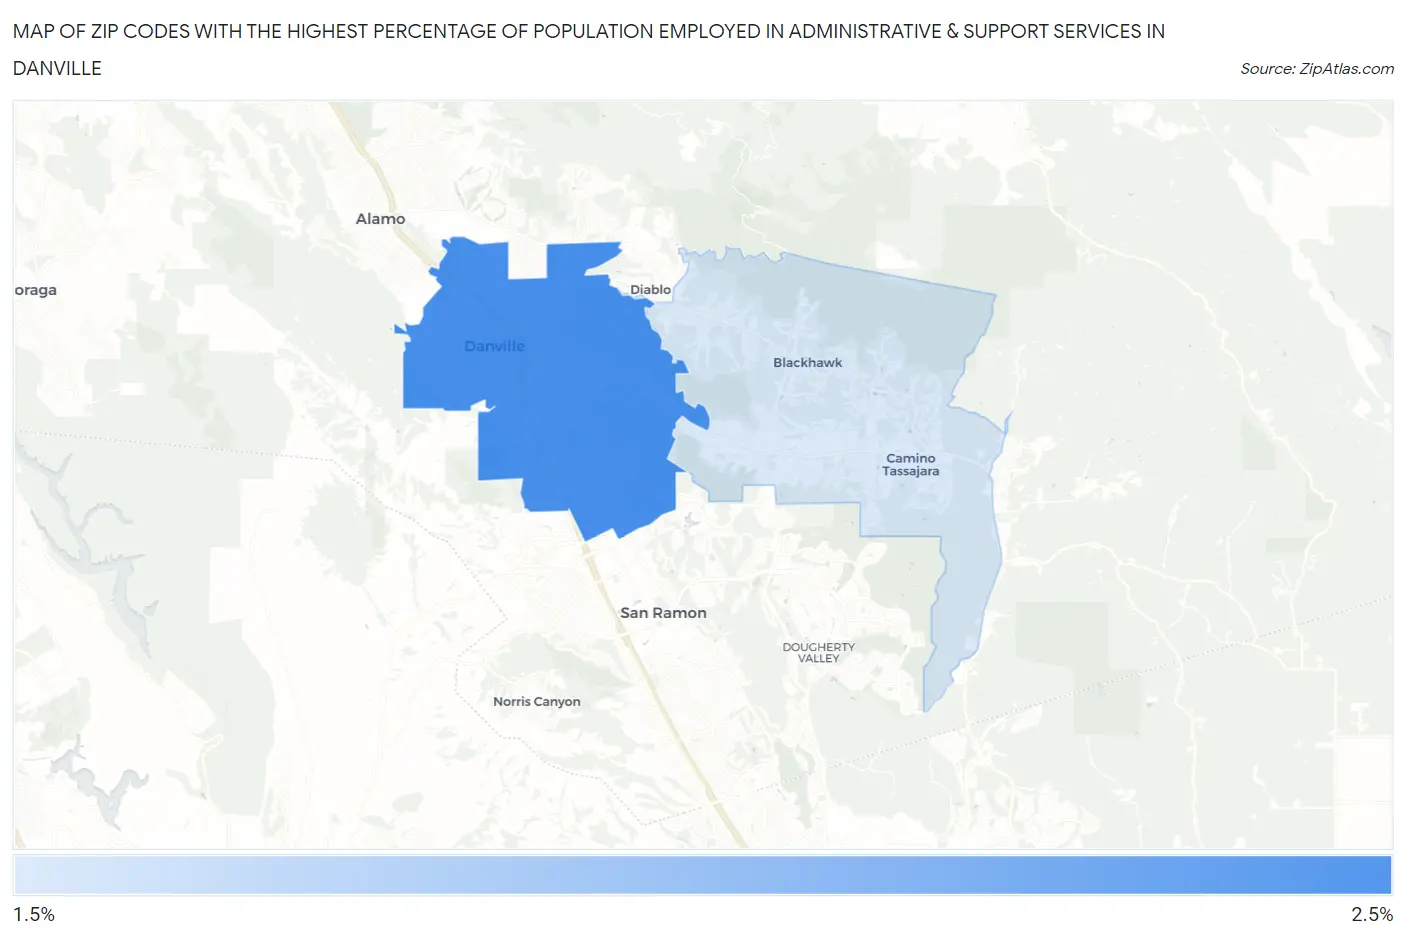
Map of Zip Codes with the Highest Percentage of Population Employed in Administrative & Support Services in Danville
1.6%
2.3%
Zip Codes with the Highest Percentage of Population Employed in Administrative & Support Services in Danville, CA
| Zip Code | % Employed | vs State | vs National | |
| 1. | 94526 | 2.3% | 4.6%(-2.25)#1,256 | 4.1%(-1.83)#19,083 |
| 2. | 94506 | 1.6% | 4.6%(-3.00)#1,396 | 4.1%(-2.58)#22,452 |
1
Common Questions
What are the Top Zip Codes with the Highest Percentage of Population Employed in Administrative & Support Services in Danville, CA?
Top Zip Codes with the Highest Percentage of Population Employed in Administrative & Support Services in Danville, CA are:
What zip code has the Highest Percentage of Population Employed in Administrative & Support Services in Danville, CA?
94526 has the Highest Percentage of Population Employed in Administrative & Support Services in Danville, CA with 2.3%.
What is the Percentage of Population Employed in Administrative & Support Services in Danville, CA?
Percentage of Population Employed in Administrative & Support Services in Danville is 2.0%.
What is the Percentage of Population Employed in Administrative & Support Services in California?
Percentage of Population Employed in Administrative & Support Services in California is 4.6%.
What is the Percentage of Population Employed in Administrative & Support Services in the United States?
Percentage of Population Employed in Administrative & Support Services in the United States is 4.1%.