Zip Codes with the Highest Percentage of Population Employed in Food Preparation & Serving in Fayetteville, AR
RELATED REPORTS & OPTIONS
Food Preparation & Serving
Fayetteville
Compare Zip Codes
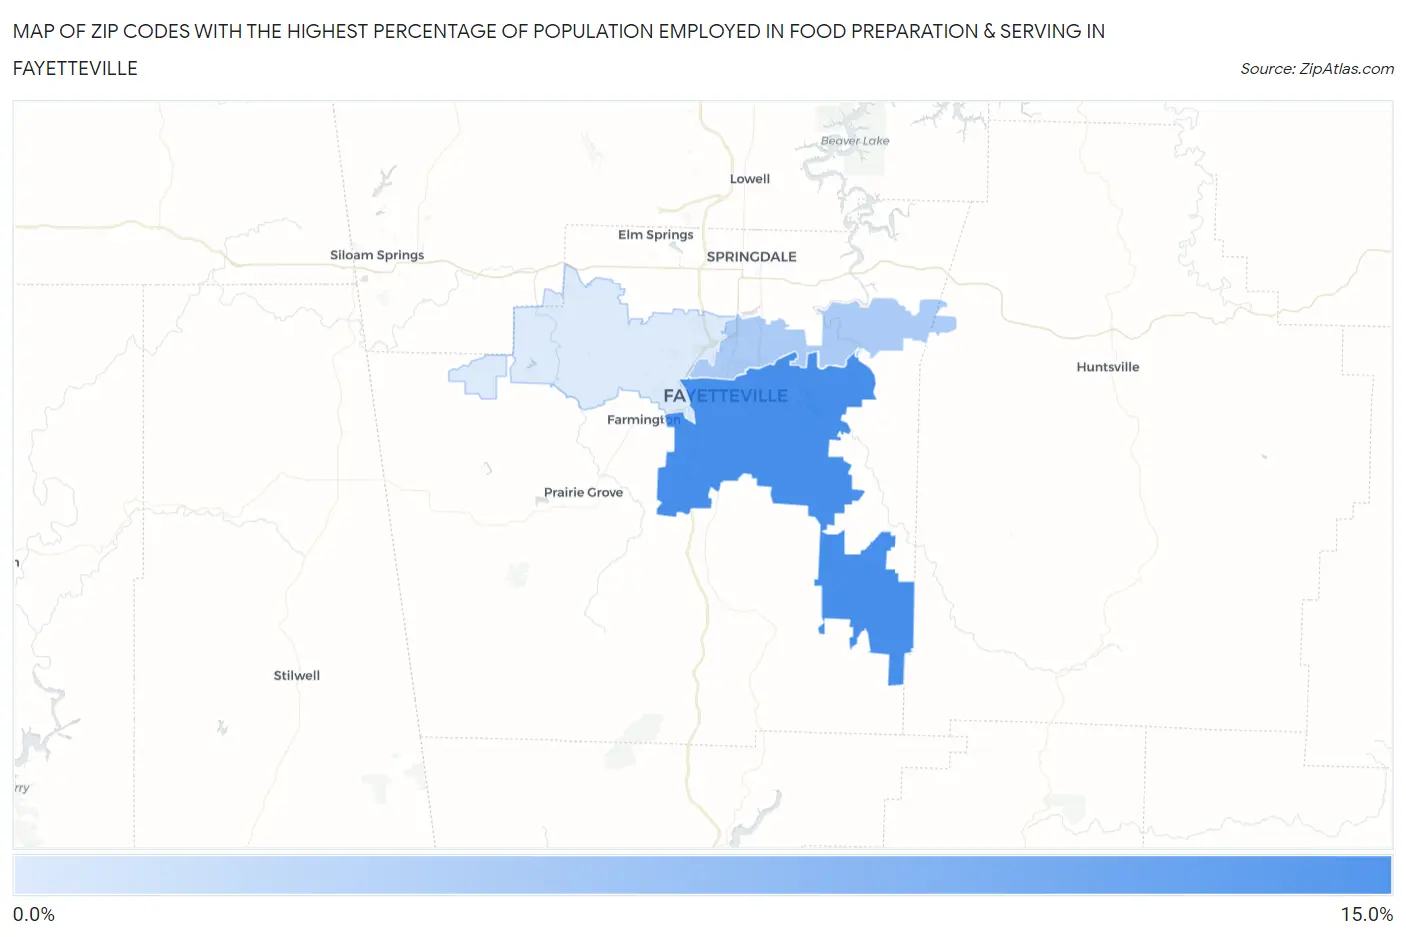
Map of Zip Codes with the Highest Percentage of Population Employed in Food Preparation & Serving in Fayetteville
4.5%
11.4%
Zip Codes with the Highest Percentage of Population Employed in Food Preparation & Serving in Fayetteville, AR
| Zip Code | % Employed | vs State | vs National | |
| 1. | 72701 | 11.4% | 5.4%(+6.00)#44 | 5.3%(+6.07)#1,895 |
| 2. | 72703 | 6.8% | 5.4%(+1.41)#145 | 5.3%(+1.48)#7,149 |
| 3. | 72704 | 4.5% | 5.4%(-0.822)#238 | 5.3%(-0.748)#14,868 |
1
Common Questions
What are the Top Zip Codes with the Highest Percentage of Population Employed in Food Preparation & Serving in Fayetteville, AR?
Top Zip Codes with the Highest Percentage of Population Employed in Food Preparation & Serving in Fayetteville, AR are:
What zip code has the Highest Percentage of Population Employed in Food Preparation & Serving in Fayetteville, AR?
72701 has the Highest Percentage of Population Employed in Food Preparation & Serving in Fayetteville, AR with 11.4%.
What is the Percentage of Population Employed in Food Preparation & Serving in Fayetteville, AR?
Percentage of Population Employed in Food Preparation & Serving in Fayetteville is 8.4%.
What is the Percentage of Population Employed in Food Preparation & Serving in Arkansas?
Percentage of Population Employed in Food Preparation & Serving in Arkansas is 5.4%.
What is the Percentage of Population Employed in Food Preparation & Serving in the United States?
Percentage of Population Employed in Food Preparation & Serving in the United States is 5.3%.