Zip Codes with the Highest Percentage of Population Employed in Food Preparation & Serving in Fort Smith, AR
RELATED REPORTS & OPTIONS
Food Preparation & Serving
Fort Smith
Compare Zip Codes
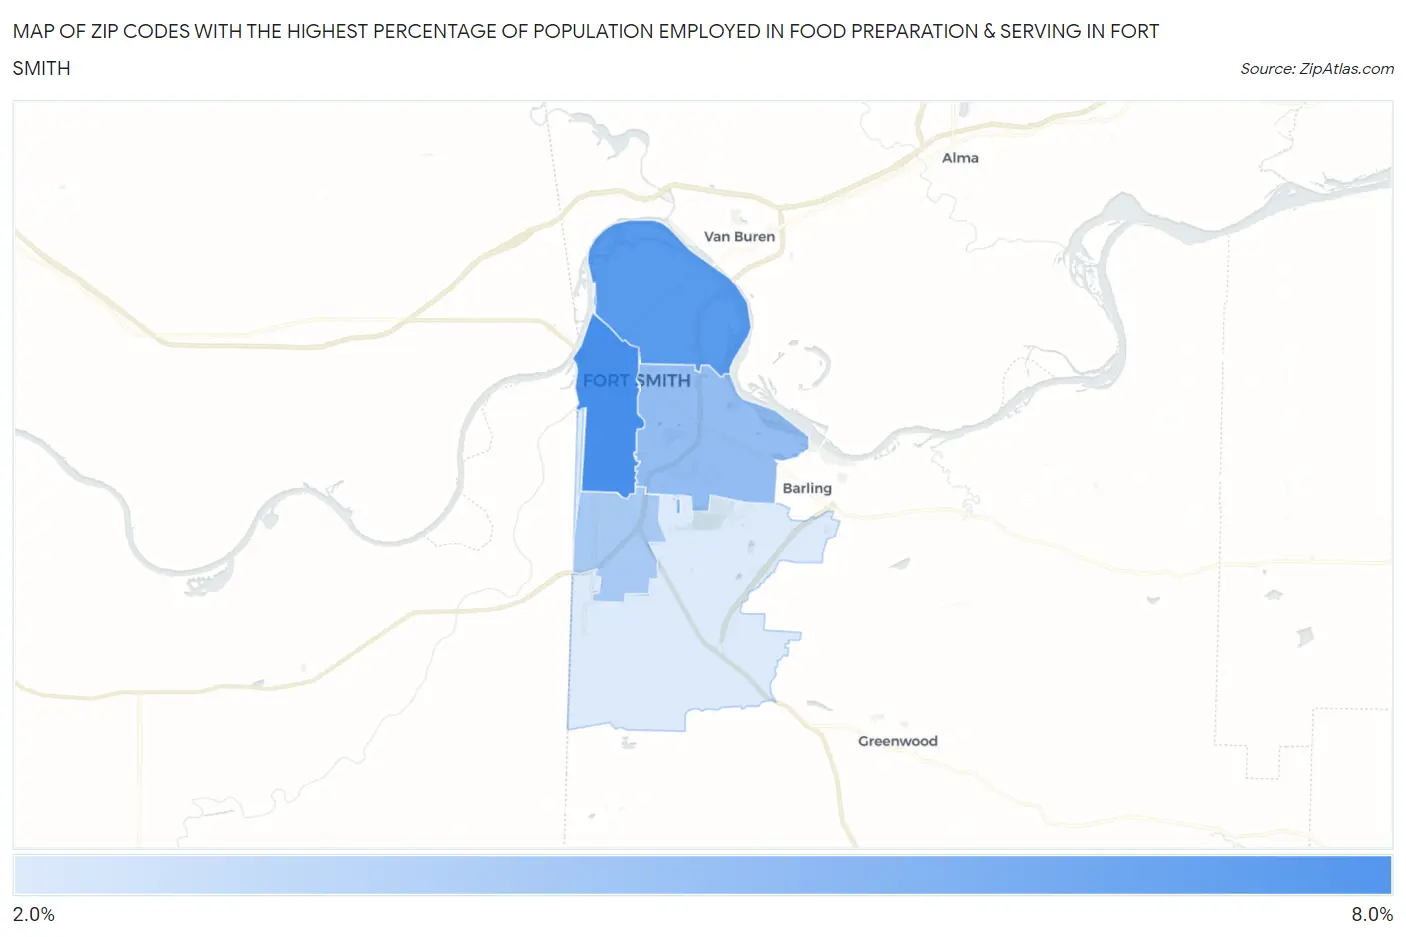
Map of Zip Codes with the Highest Percentage of Population Employed in Food Preparation & Serving in Fort Smith
2.4%
7.4%
Zip Codes with the Highest Percentage of Population Employed in Food Preparation & Serving in Fort Smith, AR
| Zip Code | % Employed | vs State | vs National | |
| 1. | 72901 | 7.4% | 5.4%(+2.01)#121 | 5.3%(+2.09)#5,793 |
| 2. | 72904 | 6.8% | 5.4%(+1.47)#141 | 5.3%(+1.55)#6,985 |
| 3. | 72903 | 4.8% | 5.4%(-0.555)#220 | 5.3%(-0.482)#13,748 |
| 4. | 72908 | 4.1% | 5.4%(-1.23)#258 | 5.3%(-1.15)#16,565 |
| 5. | 72916 | 2.4% | 5.4%(-2.95)#357 | 5.3%(-2.87)#23,419 |
1
Common Questions
What are the Top 3 Zip Codes with the Highest Percentage of Population Employed in Food Preparation & Serving in Fort Smith, AR?
Top 3 Zip Codes with the Highest Percentage of Population Employed in Food Preparation & Serving in Fort Smith, AR are:
What zip code has the Highest Percentage of Population Employed in Food Preparation & Serving in Fort Smith, AR?
72901 has the Highest Percentage of Population Employed in Food Preparation & Serving in Fort Smith, AR with 7.4%.
What is the Percentage of Population Employed in Food Preparation & Serving in Fort Smith, AR?
Percentage of Population Employed in Food Preparation & Serving in Fort Smith is 5.5%.
What is the Percentage of Population Employed in Food Preparation & Serving in Arkansas?
Percentage of Population Employed in Food Preparation & Serving in Arkansas is 5.4%.
What is the Percentage of Population Employed in Food Preparation & Serving in the United States?
Percentage of Population Employed in Food Preparation & Serving in the United States is 5.3%.