Zip Codes with the Highest Percentage of Population Employed in Food Preparation & Serving in Conway, AR
RELATED REPORTS & OPTIONS
Food Preparation & Serving
Conway
Compare Zip Codes
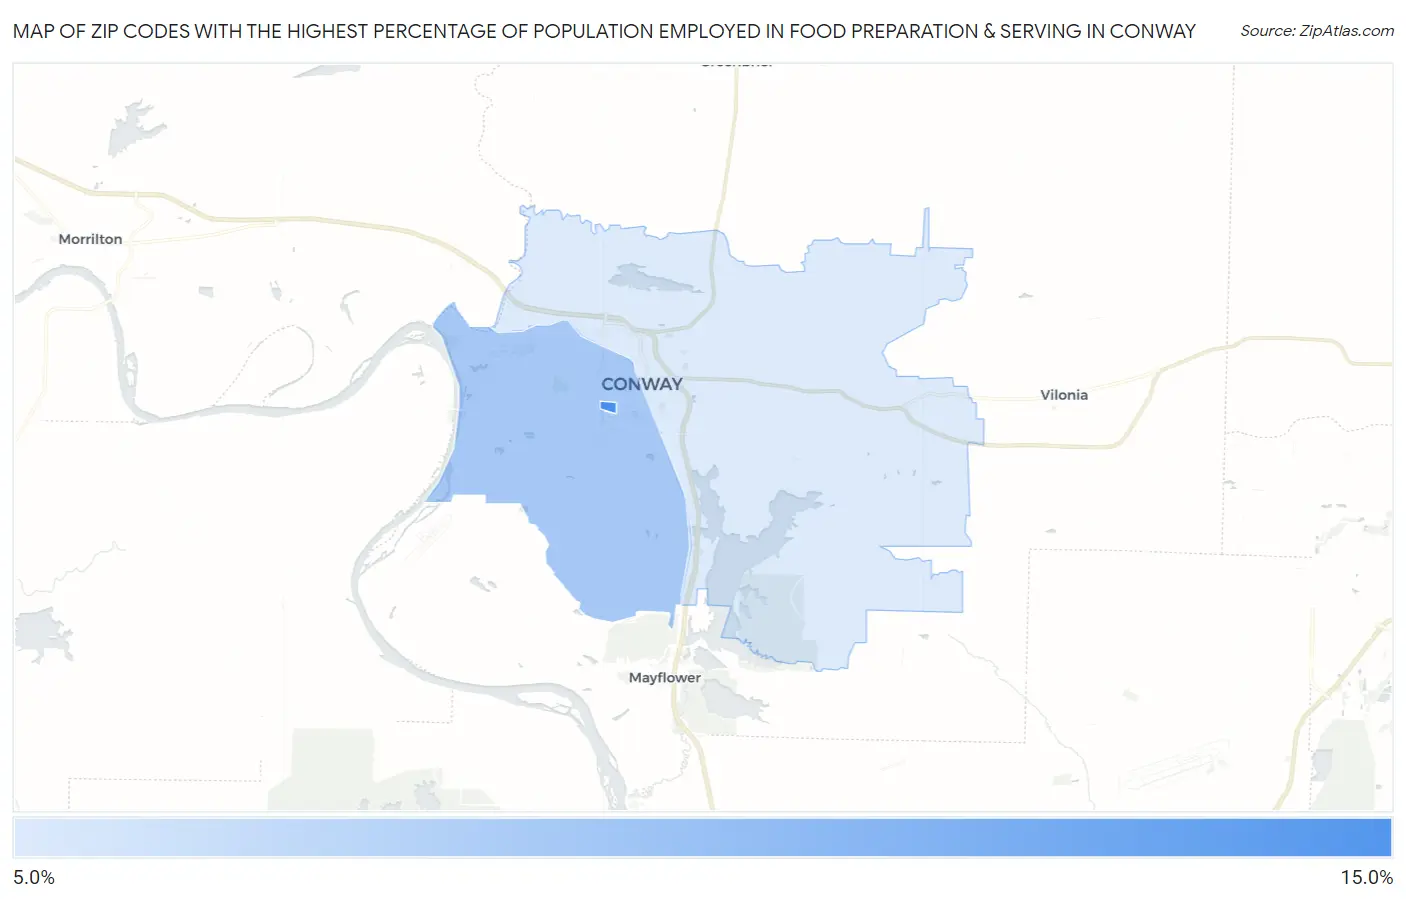
Map of Zip Codes with the Highest Percentage of Population Employed in Food Preparation & Serving in Conway
5.4%
11.3%
Zip Codes with the Highest Percentage of Population Employed in Food Preparation & Serving in Conway, AR
| Zip Code | % Employed | vs State | vs National | |
| 1. | 72035 | 11.3% | 5.4%(+5.89)#45 | 5.3%(+5.96)#1,936 |
| 2. | 72034 | 7.5% | 5.4%(+2.14)#118 | 5.3%(+2.22)#5,560 |
| 3. | 72032 | 5.4% | 5.4%(+0.037)#191 | 5.3%(+0.111)#11,418 |
1
Common Questions
What are the Top Zip Codes with the Highest Percentage of Population Employed in Food Preparation & Serving in Conway, AR?
Top Zip Codes with the Highest Percentage of Population Employed in Food Preparation & Serving in Conway, AR are:
What zip code has the Highest Percentage of Population Employed in Food Preparation & Serving in Conway, AR?
72035 has the Highest Percentage of Population Employed in Food Preparation & Serving in Conway, AR with 11.3%.
What is the Percentage of Population Employed in Food Preparation & Serving in Conway, AR?
Percentage of Population Employed in Food Preparation & Serving in Conway is 7.8%.
What is the Percentage of Population Employed in Food Preparation & Serving in Arkansas?
Percentage of Population Employed in Food Preparation & Serving in Arkansas is 5.4%.
What is the Percentage of Population Employed in Food Preparation & Serving in the United States?
Percentage of Population Employed in Food Preparation & Serving in the United States is 5.3%.