Zip Codes with the Highest Percentage of Population Employed in Food Preparation & Serving in North Little Rock, AR
RELATED REPORTS & OPTIONS
Food Preparation & Serving
North Little Rock
Compare Zip Codes
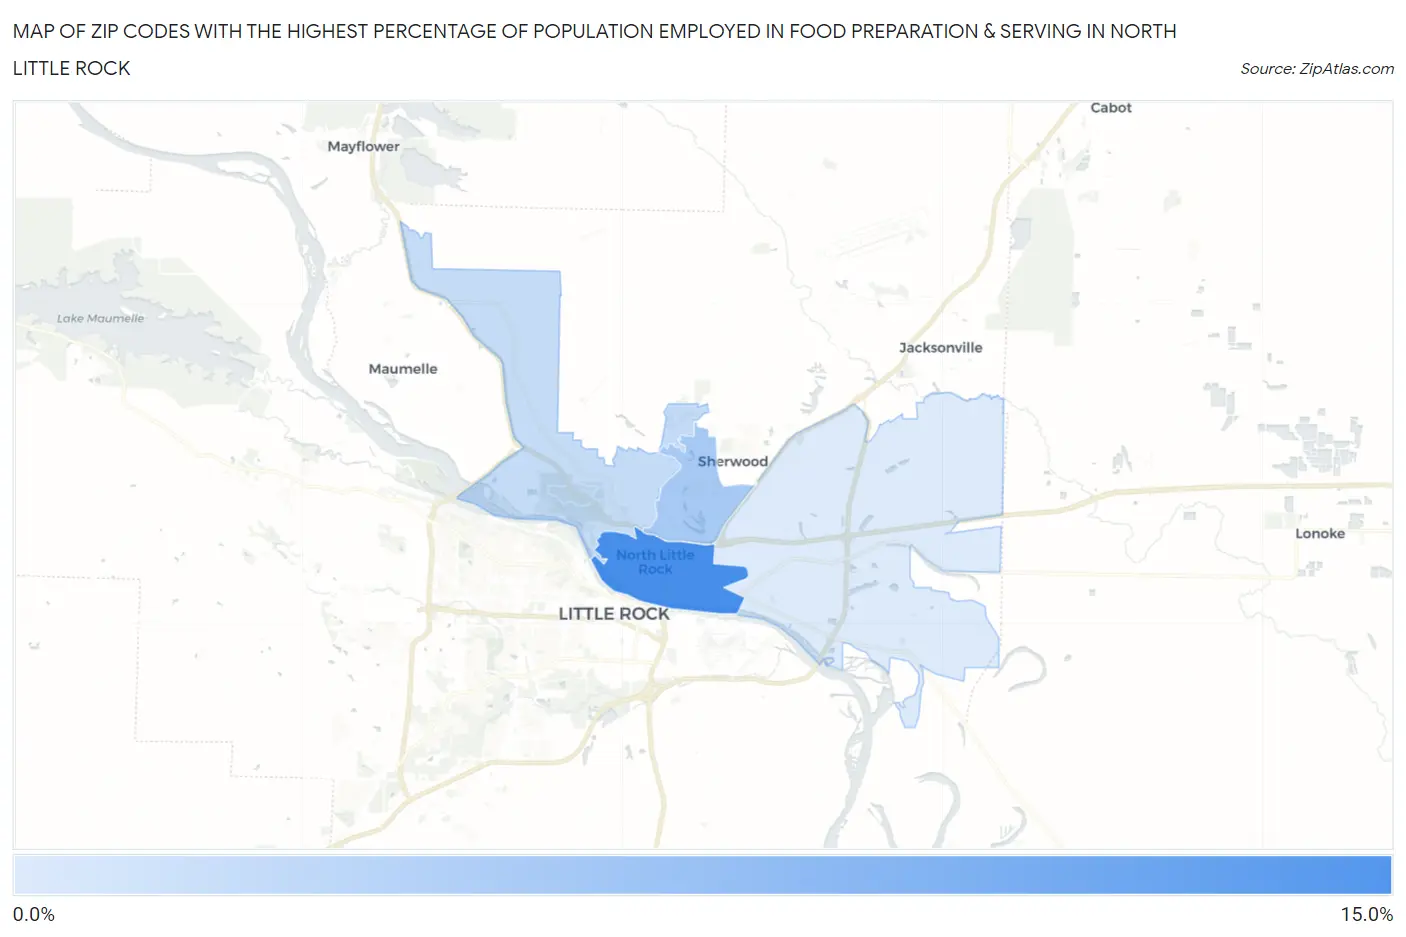
Map of Zip Codes with the Highest Percentage of Population Employed in Food Preparation & Serving in North Little Rock
3.8%
10.7%
Zip Codes with the Highest Percentage of Population Employed in Food Preparation & Serving in North Little Rock, AR
| Zip Code | % Employed | vs State | vs National | |
| 1. | 72114 | 10.7% | 5.4%(+5.29)#49 | 5.3%(+5.37)#2,232 |
| 2. | 72116 | 6.1% | 5.4%(+0.768)#165 | 5.3%(+0.841)#8,938 |
| 3. | 72118 | 4.9% | 5.4%(-0.503)#217 | 5.3%(-0.429)#13,527 |
| 4. | 72117 | 3.8% | 5.4%(-1.55)#278 | 5.3%(-1.48)#17,912 |
1
Common Questions
What are the Top 3 Zip Codes with the Highest Percentage of Population Employed in Food Preparation & Serving in North Little Rock, AR?
Top 3 Zip Codes with the Highest Percentage of Population Employed in Food Preparation & Serving in North Little Rock, AR are:
What zip code has the Highest Percentage of Population Employed in Food Preparation & Serving in North Little Rock, AR?
72114 has the Highest Percentage of Population Employed in Food Preparation & Serving in North Little Rock, AR with 10.7%.
What is the Percentage of Population Employed in Food Preparation & Serving in North Little Rock, AR?
Percentage of Population Employed in Food Preparation & Serving in North Little Rock is 5.3%.
What is the Percentage of Population Employed in Food Preparation & Serving in Arkansas?
Percentage of Population Employed in Food Preparation & Serving in Arkansas is 5.4%.
What is the Percentage of Population Employed in Food Preparation & Serving in the United States?
Percentage of Population Employed in Food Preparation & Serving in the United States is 5.3%.