Gum Springs, AR Map & Demographics
Gum Springs Map
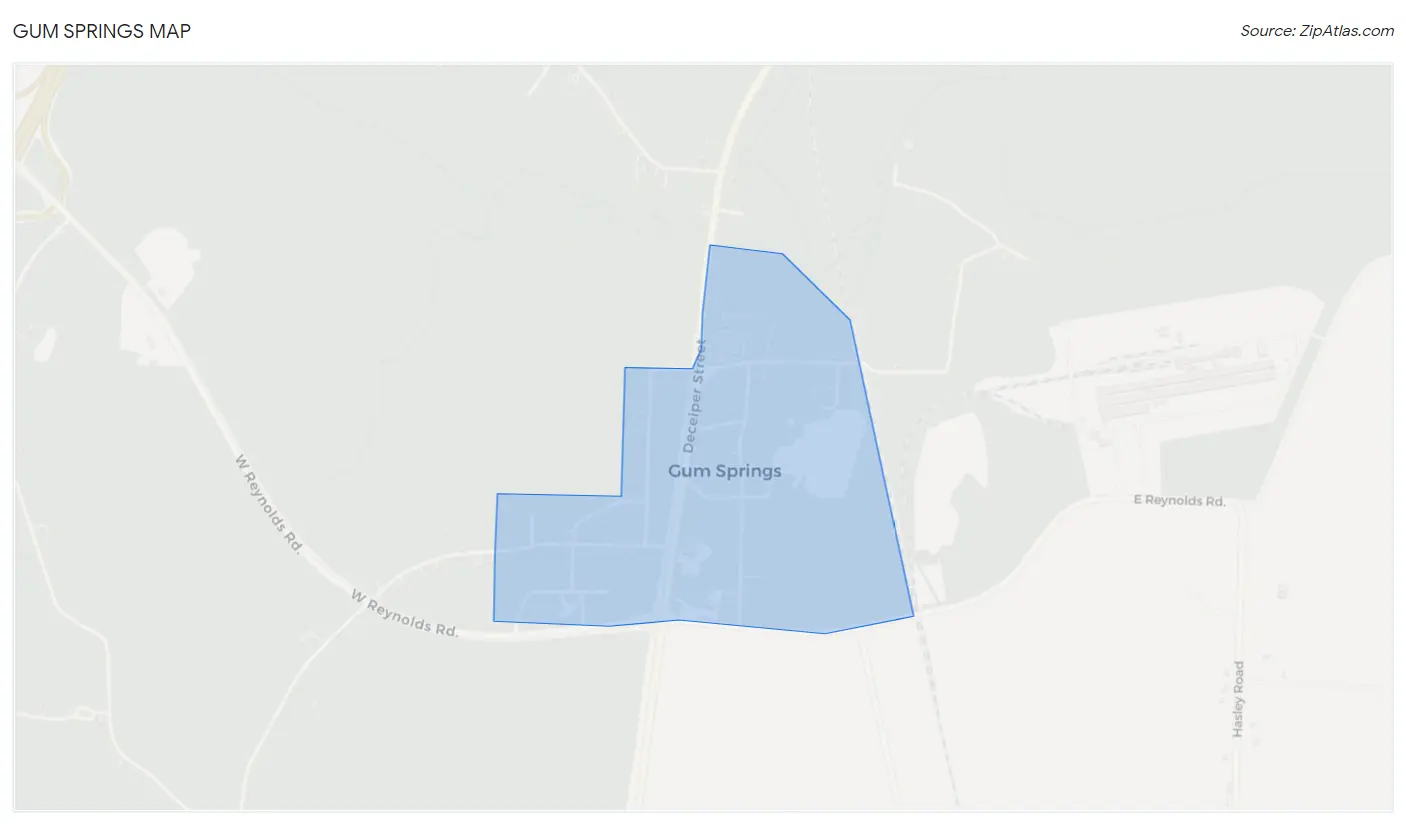
Gum Springs Overview
$25,833
PER CAPITA INCOME
$48,750
AVG FAMILY INCOME
$41,250
AVG HOUSEHOLD INCOME
21.1%
WAGE / INCOME GAP [ % ]
78.9¢/ $1
WAGE / INCOME GAP [ $ ]
0.22
INEQUALITY / GINI INDEX
84
TOTAL POPULATION
24
MALE POPULATION
60
FEMALE POPULATION
40.00
MALES / 100 FEMALES
250.00
FEMALES / 100 MALES
47.9
MEDIAN AGE
2.6
AVG FAMILY SIZE
1.7
AVG HOUSEHOLD SIZE
43
LABOR FORCE [ PEOPLE ]
60.6%
PERCENT IN LABOR FORCE
11.6%
UNEMPLOYMENT RATE
Income in Gum Springs
Income Overview in Gum Springs
Per Capita Income in Gum Springs is $25,833, while median incomes of families and households are $48,750 and $41,250 respectively.
| Characteristic | Number | Measure |
| Per Capita Income | 84 | $25,833 |
| Median Family Income | 21 | $48,750 |
| Mean Family Income | 21 | $55,662 |
| Median Household Income | 49 | $41,250 |
| Mean Household Income | 49 | $45,829 |
| Income Deficit | 21 | $0 |
| Wage / Income Gap (%) | 84 | 21.08% |
| Wage / Income Gap ($) | 84 | 78.92¢ per $1 |
| Gini / Inequality Index | 84 | 0.22 |
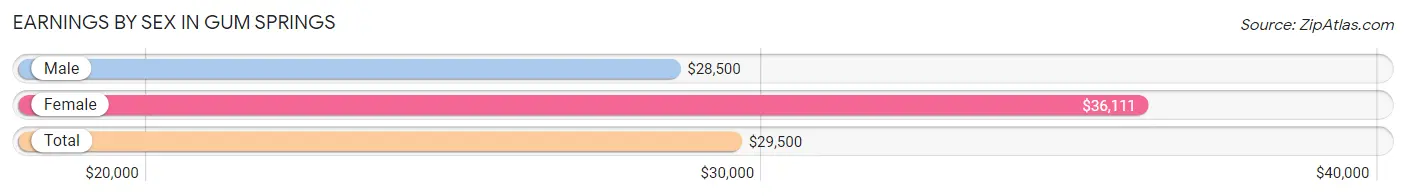
Earnings by Sex in Gum Springs
Average Earnings in Gum Springs are $29,500, $28,500 for men and $36,111 for women, a difference of 21.1%.
| Sex | Number | Average Earnings |
| Male | 16 (32.0%) | $28,500 |
| Female | 34 (68.0%) | $36,111 |
| Total | 50 (100.0%) | $29,500 |
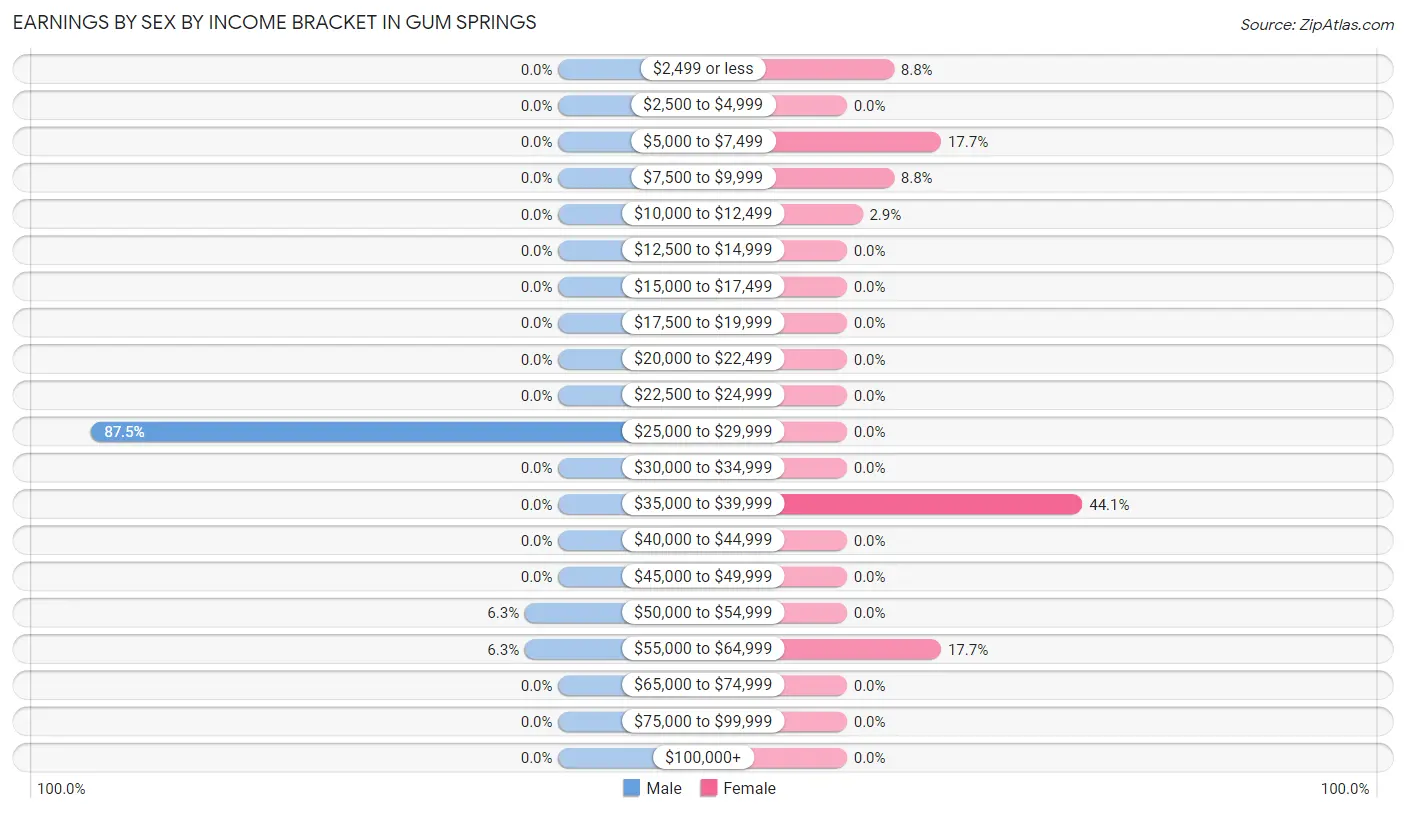
Earnings by Sex by Income Bracket in Gum Springs
The most common earnings brackets in Gum Springs are $25,000 to $29,999 for men (14 | 87.5%) and $35,000 to $39,999 for women (15 | 44.1%).
| Income | Male | Female |
| $2,499 or less | 0 (0.0%) | 3 (8.8%) |
| $2,500 to $4,999 | 0 (0.0%) | 0 (0.0%) |
| $5,000 to $7,499 | 0 (0.0%) | 6 (17.6%) |
| $7,500 to $9,999 | 0 (0.0%) | 3 (8.8%) |
| $10,000 to $12,499 | 0 (0.0%) | 1 (2.9%) |
| $12,500 to $14,999 | 0 (0.0%) | 0 (0.0%) |
| $15,000 to $17,499 | 0 (0.0%) | 0 (0.0%) |
| $17,500 to $19,999 | 0 (0.0%) | 0 (0.0%) |
| $20,000 to $22,499 | 0 (0.0%) | 0 (0.0%) |
| $22,500 to $24,999 | 0 (0.0%) | 0 (0.0%) |
| $25,000 to $29,999 | 14 (87.5%) | 0 (0.0%) |
| $30,000 to $34,999 | 0 (0.0%) | 0 (0.0%) |
| $35,000 to $39,999 | 0 (0.0%) | 15 (44.1%) |
| $40,000 to $44,999 | 0 (0.0%) | 0 (0.0%) |
| $45,000 to $49,999 | 0 (0.0%) | 0 (0.0%) |
| $50,000 to $54,999 | 1 (6.2%) | 0 (0.0%) |
| $55,000 to $64,999 | 1 (6.2%) | 6 (17.6%) |
| $65,000 to $74,999 | 0 (0.0%) | 0 (0.0%) |
| $75,000 to $99,999 | 0 (0.0%) | 0 (0.0%) |
| $100,000+ | 0 (0.0%) | 0 (0.0%) |
| Total | 16 (100.0%) | 34 (100.0%) |
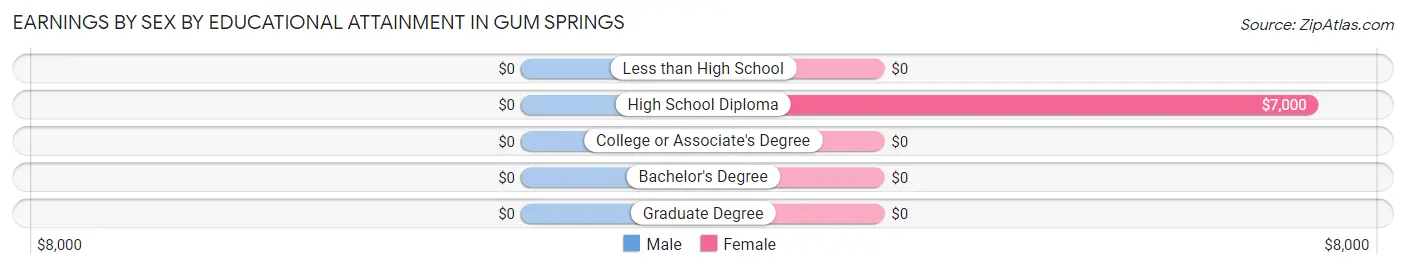
Earnings by Sex by Educational Attainment in Gum Springs
| Educational Attainment | Male Income | Female Income |
| Less than High School | - | - |
| High School Diploma | - | - |
| College or Associate's Degree | - | - |
| Bachelor's Degree | - | - |
| Graduate Degree | - | - |
| Total | $28,500 | $36,111 |
Family Income in Gum Springs
Family Income Brackets in Gum Springs
According to the Gum Springs family income data, there are 8 families falling into the $35,000 to $49,999 income range, which is the most common income bracket and makes up 38.1% of all families.
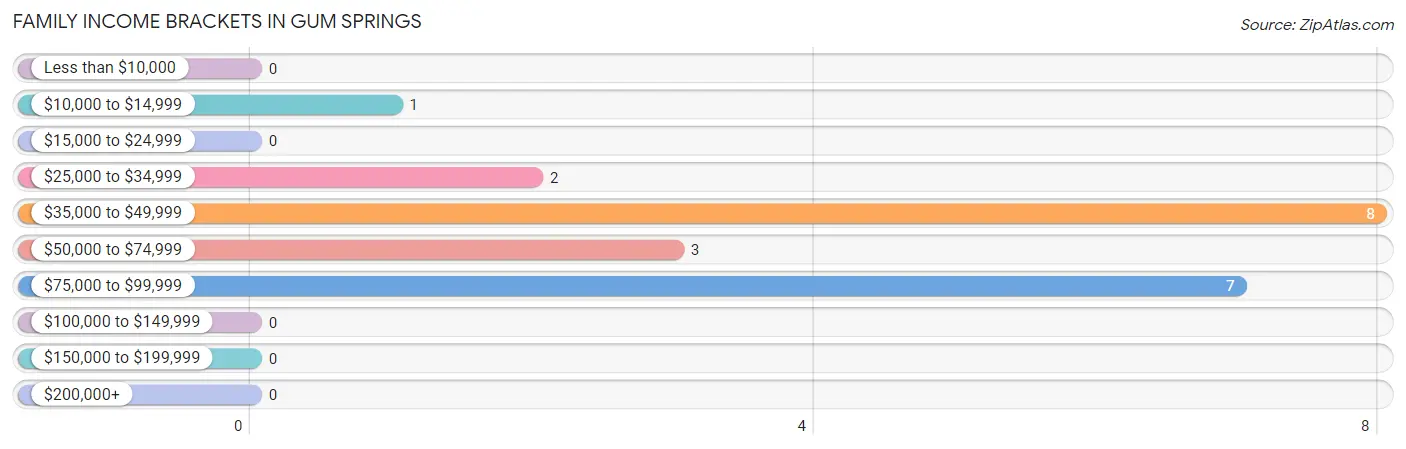
| Income Bracket | # Families | % Families |
| Less than $10,000 | 0 | 0.0% |
| $10,000 to $14,999 | 1 | 4.8% |
| $15,000 to $24,999 | 0 | 0.0% |
| $25,000 to $34,999 | 2 | 9.5% |
| $35,000 to $49,999 | 8 | 38.1% |
| $50,000 to $74,999 | 3 | 14.3% |
| $75,000 to $99,999 | 7 | 33.3% |
| $100,000 to $149,999 | 0 | 0.0% |
| $150,000 to $199,999 | 0 | 0.0% |
| $200,000+ | 0 | 0.0% |
Family Income by Famaliy Size in Gum Springs
2-person families (10 | 47.6%) account for the highest median family income in Gum Springs with $78,333 per family, while 2-person families (10 | 47.6%) have the highest median income of $39,166 per family member.
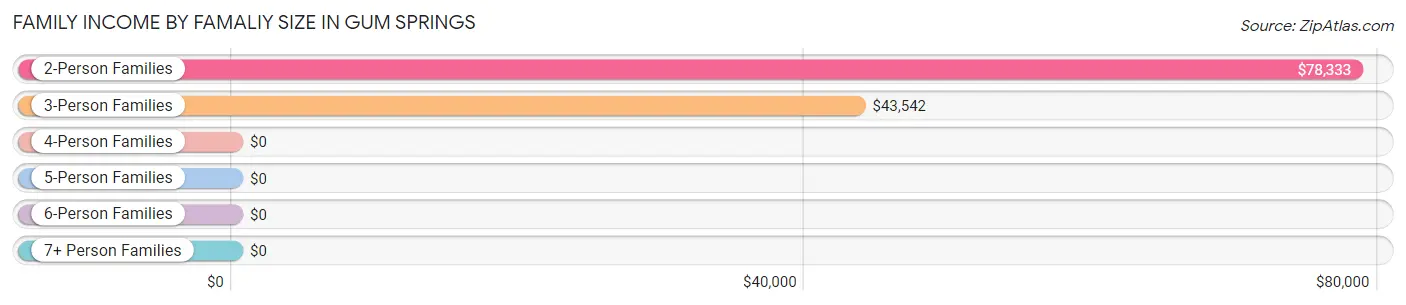
| Income Bracket | # Families | Median Income |
| 2-Person Families | 10 (47.6%) | $78,333 |
| 3-Person Families | 11 (52.4%) | $43,542 |
| 4-Person Families | 0 (0.0%) | $0 |
| 5-Person Families | 0 (0.0%) | $0 |
| 6-Person Families | 0 (0.0%) | $0 |
| 7+ Person Families | 0 (0.0%) | $0 |
| Total | 21 (100.0%) | $48,750 |
Family Income by Number of Earners in Gum Springs
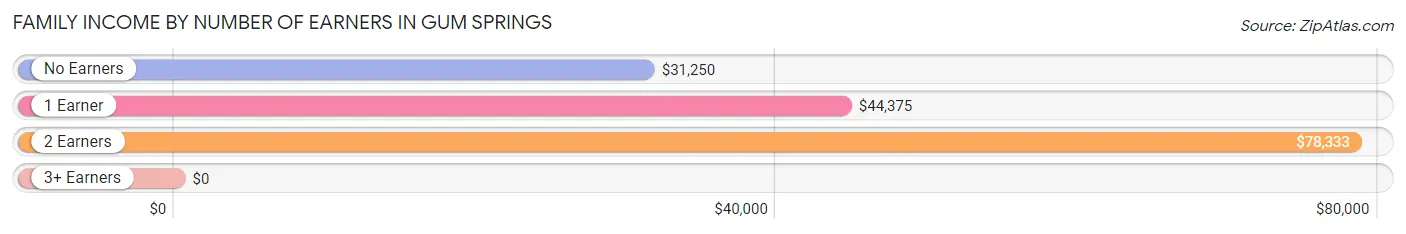
| Number of Earners | # Families | Median Income |
| No Earners | 4 (19.1%) | $31,250 |
| 1 Earner | 9 (42.9%) | $44,375 |
| 2 Earners | 8 (38.1%) | $78,333 |
| 3+ Earners | 0 (0.0%) | $0 |
| Total | 21 (100.0%) | $48,750 |
Household Income in Gum Springs
Household Income Brackets in Gum Springs
With 23 households falling in the category, the $35,000 to $49,999 income range is the most frequent in Gum Springs, accounting for 46.9% of all households.
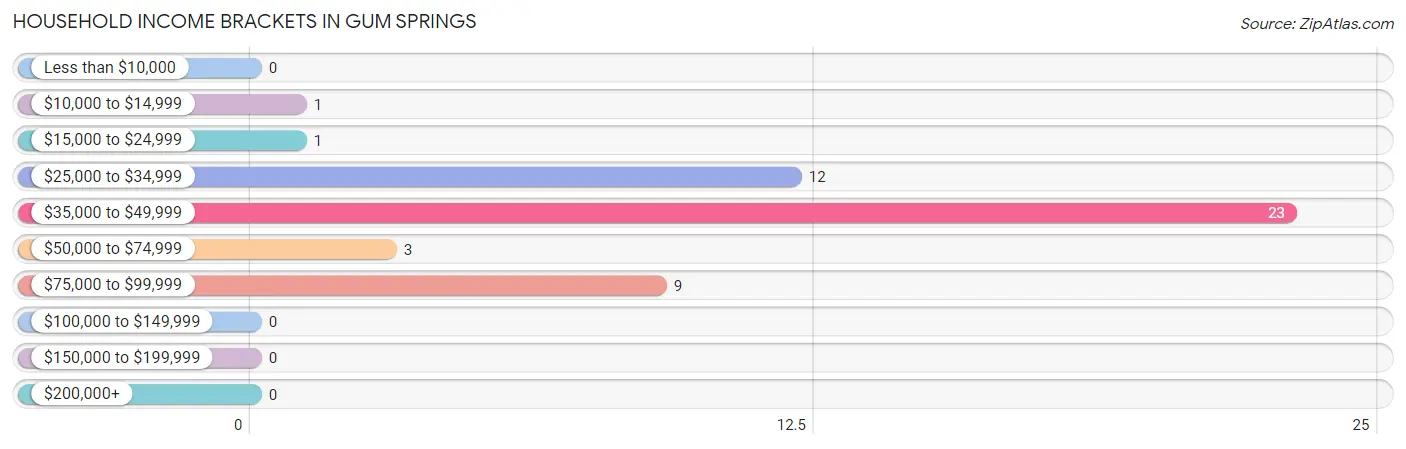
| Income Bracket | # Households | % Households |
| Less than $10,000 | 0 | 0.0% |
| $10,000 to $14,999 | 1 | 2.0% |
| $15,000 to $24,999 | 1 | 2.0% |
| $25,000 to $34,999 | 12 | 24.5% |
| $35,000 to $49,999 | 23 | 46.9% |
| $50,000 to $74,999 | 3 | 6.1% |
| $75,000 to $99,999 | 9 | 18.4% |
| $100,000 to $149,999 | 0 | 0.0% |
| $150,000 to $199,999 | 0 | 0.0% |
| $200,000+ | 0 | 0.0% |
Household Income by Householder Age in Gum Springs
The median household income in Gum Springs is $41,250, with the highest median household income of $46,250 found in the 65+ years age bracket for the primary householder. A total of 10 households (20.4%) fall into this category.
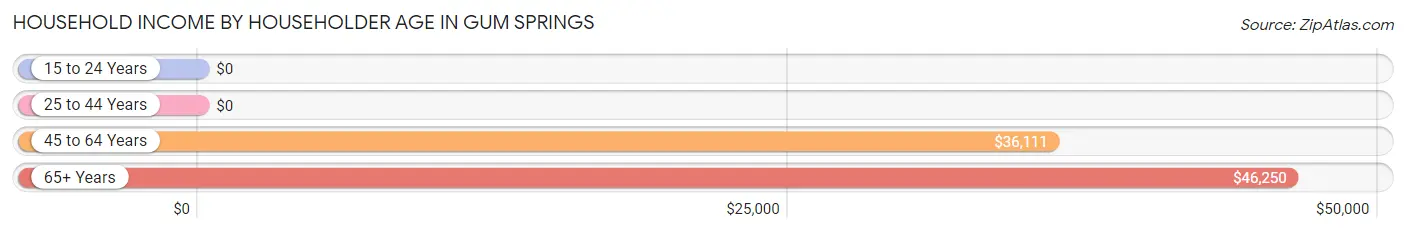
| Income Bracket | # Households | Median Income |
| 15 to 24 Years | 0 (0.0%) | $0 |
| 25 to 44 Years | 7 (14.3%) | $0 |
| 45 to 64 Years | 32 (65.3%) | $36,111 |
| 65+ Years | 10 (20.4%) | $46,250 |
| Total | 49 (100.0%) | $41,250 |
Poverty in Gum Springs
Income Below Poverty by Sex and Age in Gum Springs
With 4.2% poverty level for males and 3.3% for females among the residents of Gum Springs, 65 to 74 year old males and 55 to 64 year old females are the most vulnerable to poverty, with 1 males (16.7%) and 2 females (14.3%) in their respective age groups living below the poverty level.
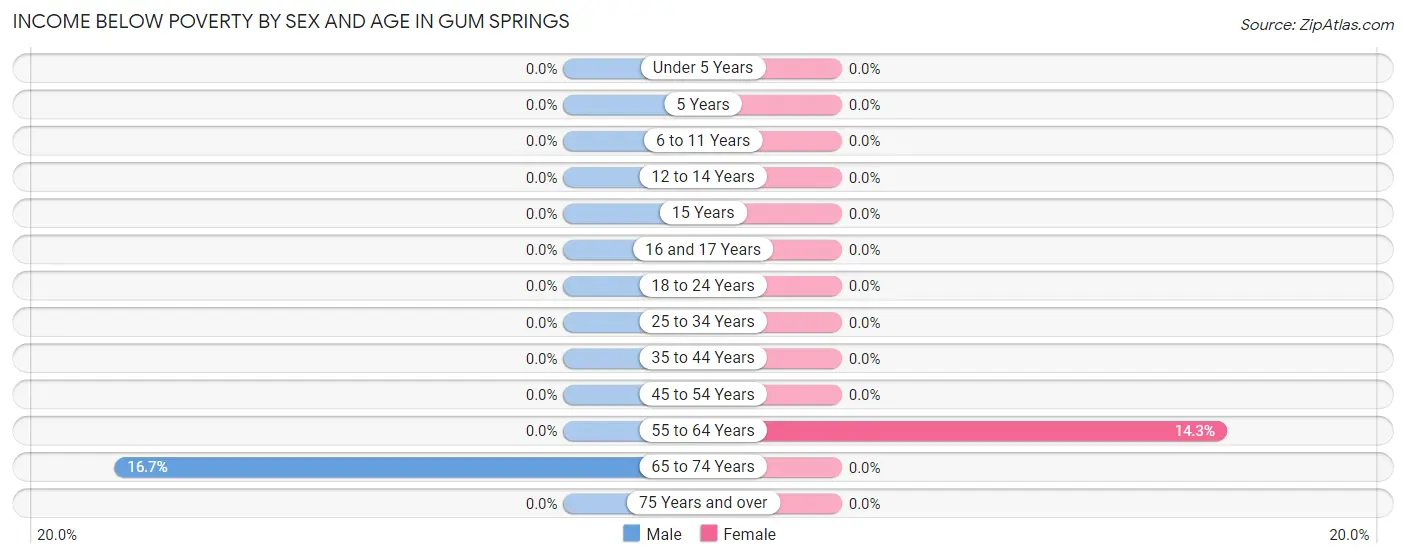
| Age Bracket | Male | Female |
| Under 5 Years | 0 (0.0%) | 0 (0.0%) |
| 5 Years | 0 (0.0%) | 0 (0.0%) |
| 6 to 11 Years | 0 (0.0%) | 0 (0.0%) |
| 12 to 14 Years | 0 (0.0%) | 0 (0.0%) |
| 15 Years | 0 (0.0%) | 0 (0.0%) |
| 16 and 17 Years | 0 (0.0%) | 0 (0.0%) |
| 18 to 24 Years | 0 (0.0%) | 0 (0.0%) |
| 25 to 34 Years | 0 (0.0%) | 0 (0.0%) |
| 35 to 44 Years | 0 (0.0%) | 0 (0.0%) |
| 45 to 54 Years | 0 (0.0%) | 0 (0.0%) |
| 55 to 64 Years | 0 (0.0%) | 2 (14.3%) |
| 65 to 74 Years | 1 (16.7%) | 0 (0.0%) |
| 75 Years and over | 0 (0.0%) | 0 (0.0%) |
| Total | 1 (4.2%) | 2 (3.3%) |
Income Above Poverty by Sex and Age in Gum Springs
According to the poverty statistics in Gum Springs, males aged 12 to 14 years and females aged 6 to 11 years are the age groups that are most secure financially, with 100.0% of males and 100.0% of females in these age groups living above the poverty line.
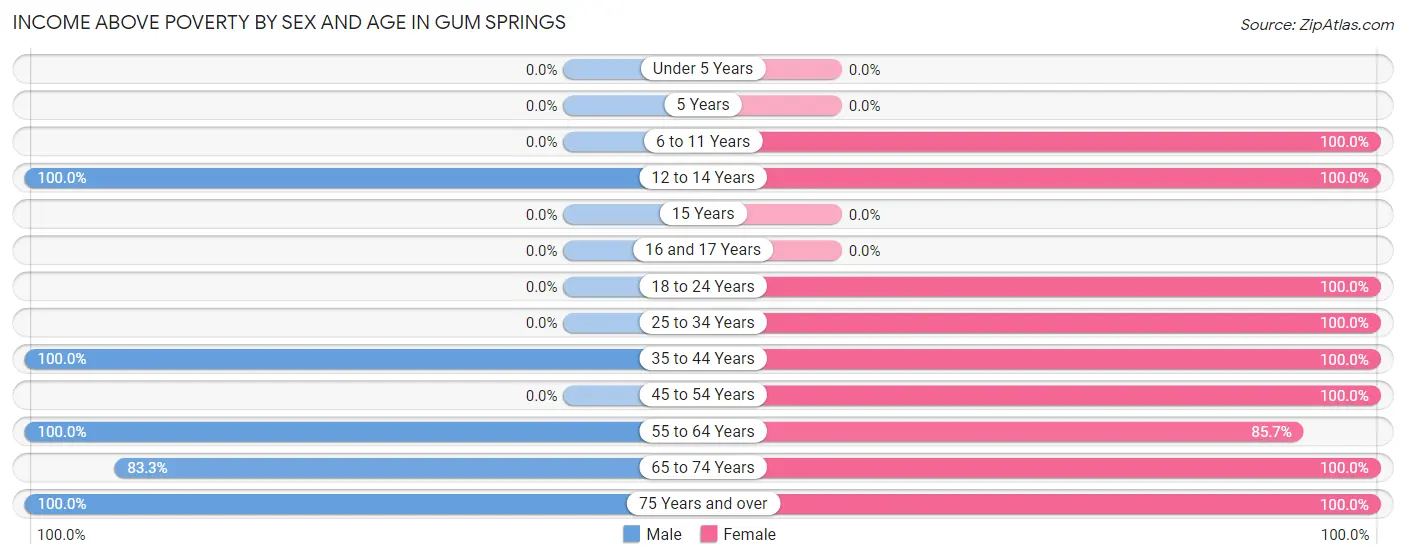
| Age Bracket | Male | Female |
| Under 5 Years | 0 (0.0%) | 0 (0.0%) |
| 5 Years | 0 (0.0%) | 0 (0.0%) |
| 6 to 11 Years | 0 (0.0%) | 8 (100.0%) |
| 12 to 14 Years | 2 (100.0%) | 3 (100.0%) |
| 15 Years | 0 (0.0%) | 0 (0.0%) |
| 16 and 17 Years | 0 (0.0%) | 0 (0.0%) |
| 18 to 24 Years | 0 (0.0%) | 7 (100.0%) |
| 25 to 34 Years | 0 (0.0%) | 5 (100.0%) |
| 35 to 44 Years | 1 (100.0%) | 7 (100.0%) |
| 45 to 54 Years | 0 (0.0%) | 13 (100.0%) |
| 55 to 64 Years | 11 (100.0%) | 12 (85.7%) |
| 65 to 74 Years | 5 (83.3%) | 2 (100.0%) |
| 75 Years and over | 4 (100.0%) | 1 (100.0%) |
| Total | 23 (95.8%) | 58 (96.7%) |
Income Below Poverty Among Married-Couple Families in Gum Springs
The poverty statistics for married-couple families in Gum Springs show that 16.7% or 1 of the total 6 families live below the poverty line. Families with no children have the highest poverty rate of 16.7%, comprising of 1 families. On the other hand, families with no children have the lowest poverty rate of 16.7%, which includes 1 families.
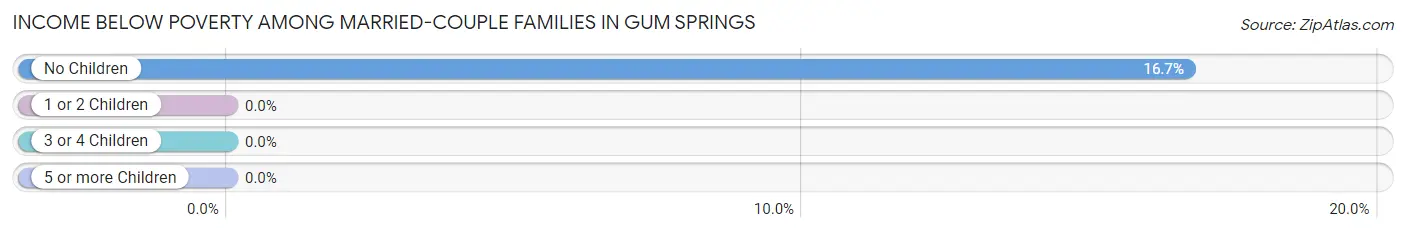
| Children | Above Poverty | Below Poverty |
| No Children | 5 (83.3%) | 1 (16.7%) |
| 1 or 2 Children | 0 (0.0%) | 0 (0.0%) |
| 3 or 4 Children | 0 (0.0%) | 0 (0.0%) |
| 5 or more Children | 0 (0.0%) | 0 (0.0%) |
| Total | 5 (83.3%) | 1 (16.7%) |
Income Below Poverty Among Single-Parent Households in Gum Springs
| Children | Single Father | Single Mother |
| No Children | 0 (0.0%) | 0 (0.0%) |
| 1 or 2 Children | 0 (0.0%) | 0 (0.0%) |
| 3 or 4 Children | 0 (0.0%) | 0 (0.0%) |
| 5 or more Children | 0 (0.0%) | 0 (0.0%) |
| Total | 0 (0.0%) | 0 (0.0%) |
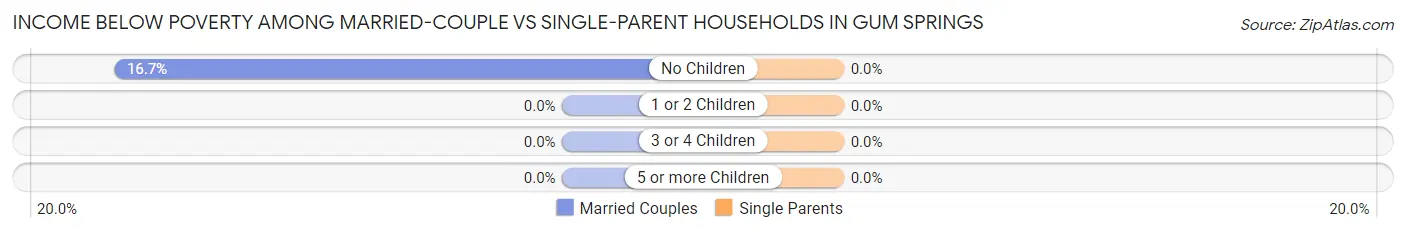
Income Below Poverty Among Married-Couple vs Single-Parent Households in Gum Springs
| Children | Married-Couple Families | Single-Parent Households |
| No Children | 1 (16.7%) | 0 (0.0%) |
| 1 or 2 Children | 0 (0.0%) | 0 (0.0%) |
| 3 or 4 Children | 0 (0.0%) | 0 (0.0%) |
| 5 or more Children | 0 (0.0%) | 0 (0.0%) |
| Total | 1 (16.7%) | 0 (0.0%) |
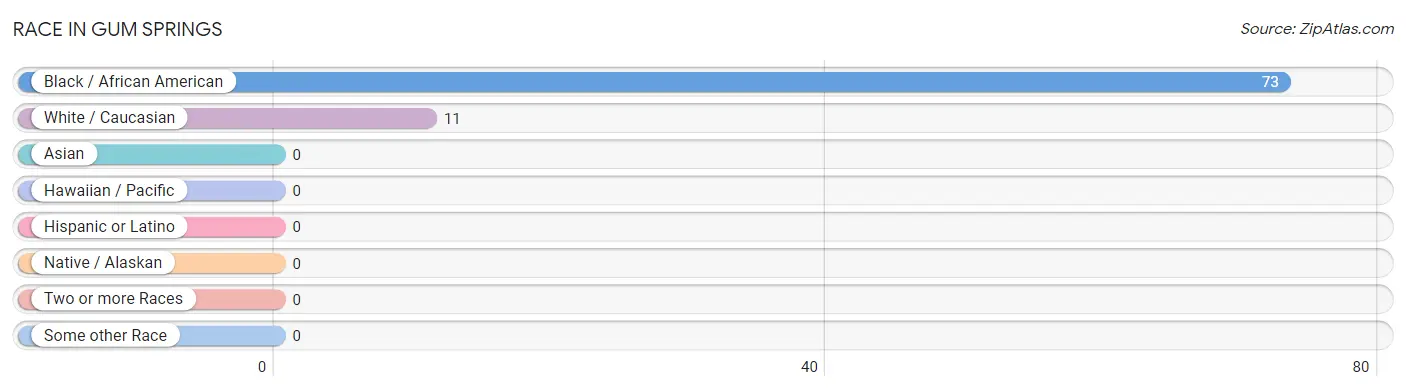
Race in Gum Springs
The most populous races in Gum Springs are Black / African American (73 | 86.9%), and White / Caucasian (11 | 13.1%).
| Race | # Population | % Population |
| Asian | 0 | 0.0% |
| Black / African American | 73 | 86.9% |
| Hawaiian / Pacific | 0 | 0.0% |
| Hispanic or Latino | 0 | 0.0% |
| Native / Alaskan | 0 | 0.0% |
| White / Caucasian | 11 | 13.1% |
| Two or more Races | 0 | 0.0% |
| Some other Race | 0 | 0.0% |
| Total | 84 | 100.0% |
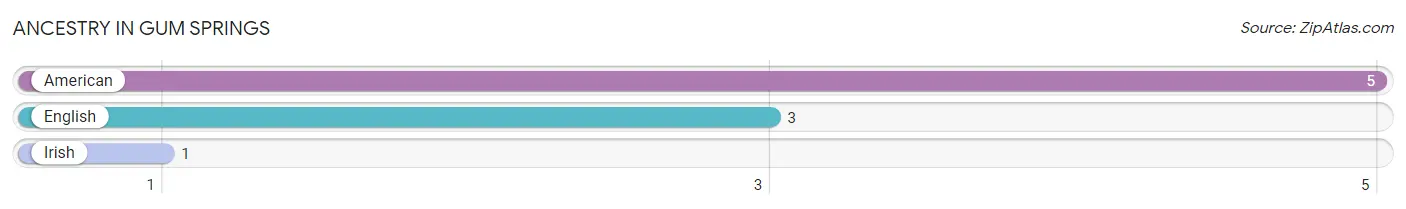
Ancestry in Gum Springs
The most populous ancestries reported in Gum Springs are American (5 | 5.9%), English (3 | 3.6%), and Irish (1 | 1.2%), together accounting for 10.7% of all Gum Springs residents.
| Ancestry | # Population | % Population |
| American | 5 | 5.9% |
| English | 3 | 3.6% |
| Irish | 1 | 1.2% | View All 3 Rows |
Immigrants in Gum Springs

| Immigration Origin | # Population | % Population | View All 0 Rows |
Sex and Age in Gum Springs
Sex and Age in Gum Springs
The most populous age groups in Gum Springs are 55 to 59 Years (6 | 25.0%) for men and 45 to 49 Years (10 | 16.7%) for women.
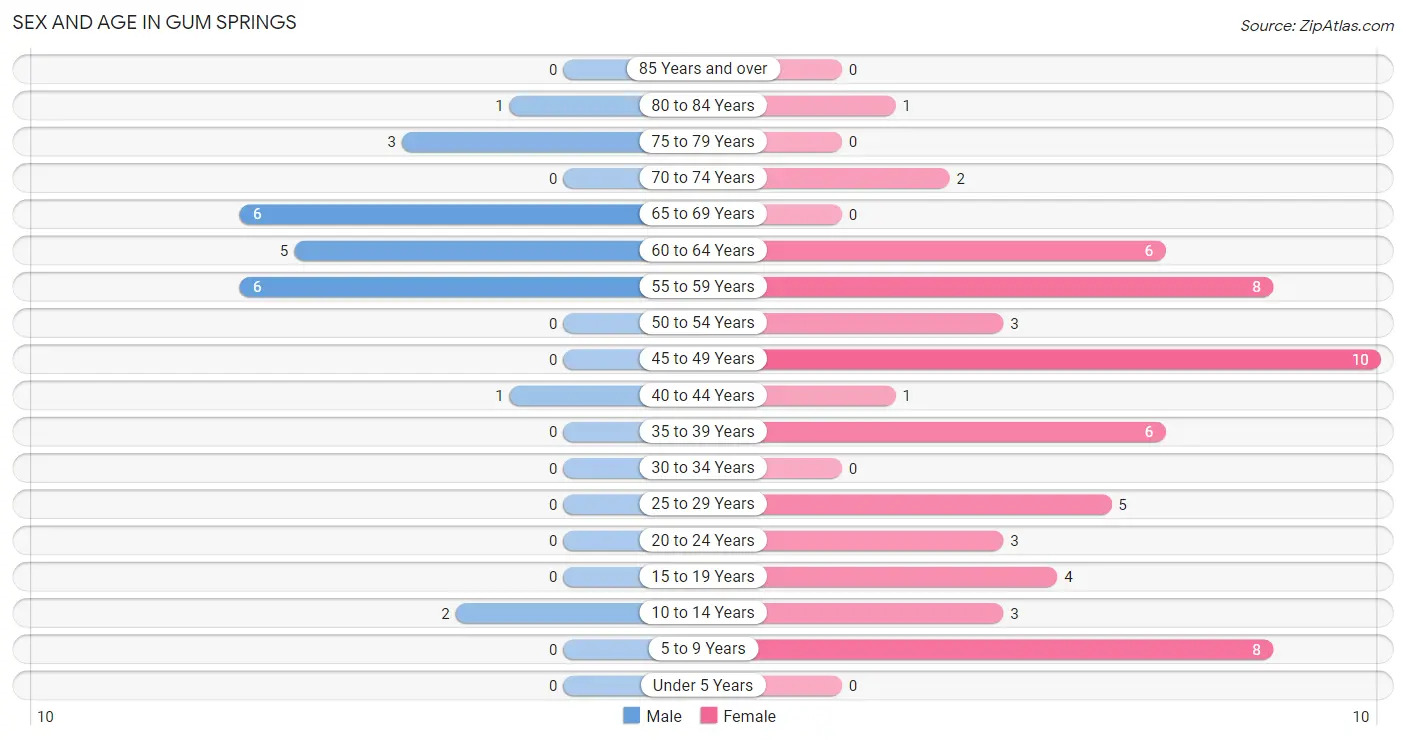
| Age Bracket | Male | Female |
| Under 5 Years | 0 (0.0%) | 0 (0.0%) |
| 5 to 9 Years | 0 (0.0%) | 8 (13.3%) |
| 10 to 14 Years | 2 (8.3%) | 3 (5.0%) |
| 15 to 19 Years | 0 (0.0%) | 4 (6.7%) |
| 20 to 24 Years | 0 (0.0%) | 3 (5.0%) |
| 25 to 29 Years | 0 (0.0%) | 5 (8.3%) |
| 30 to 34 Years | 0 (0.0%) | 0 (0.0%) |
| 35 to 39 Years | 0 (0.0%) | 6 (10.0%) |
| 40 to 44 Years | 1 (4.2%) | 1 (1.7%) |
| 45 to 49 Years | 0 (0.0%) | 10 (16.7%) |
| 50 to 54 Years | 0 (0.0%) | 3 (5.0%) |
| 55 to 59 Years | 6 (25.0%) | 8 (13.3%) |
| 60 to 64 Years | 5 (20.8%) | 6 (10.0%) |
| 65 to 69 Years | 6 (25.0%) | 0 (0.0%) |
| 70 to 74 Years | 0 (0.0%) | 2 (3.3%) |
| 75 to 79 Years | 3 (12.5%) | 0 (0.0%) |
| 80 to 84 Years | 1 (4.2%) | 1 (1.7%) |
| 85 Years and over | 0 (0.0%) | 0 (0.0%) |
| Total | 24 (100.0%) | 60 (100.0%) |
Families and Households in Gum Springs
Median Family Size in Gum Springs
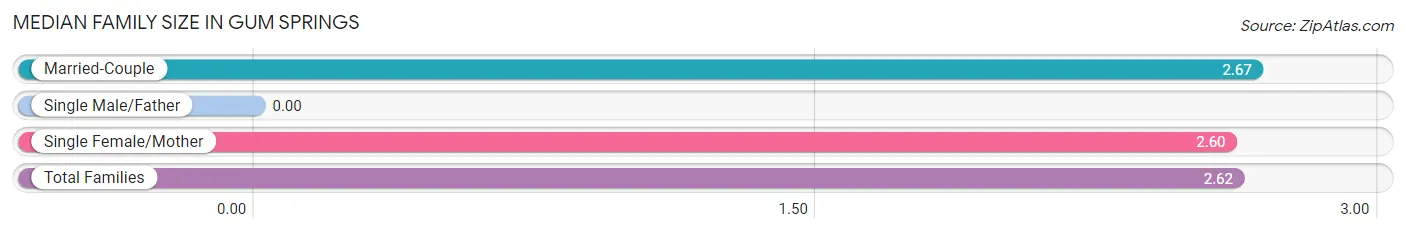
| Family Type | # Families | Family Size |
| Married-Couple | 6 (28.6%) | 2.67 |
| Single Male/Father | 0 (0.0%) | - |
| Single Female/Mother | 15 (71.4%) | 2.60 |
| Total Families | 21 (100.0%) | 2.62 |
Median Household Size in Gum Springs
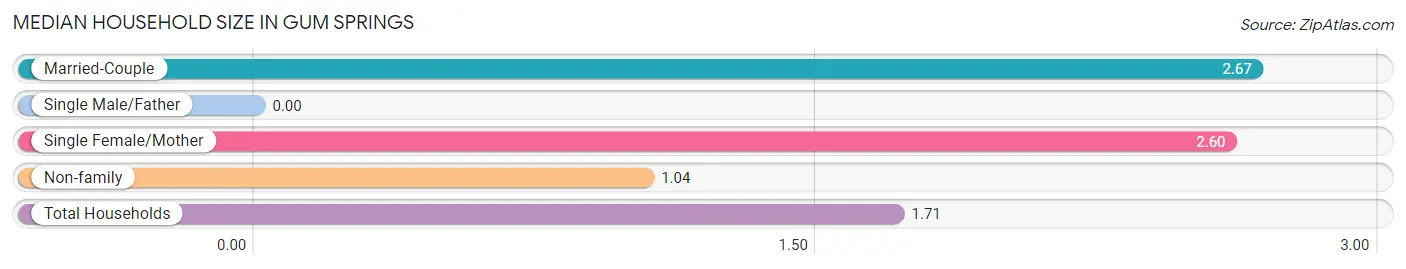
| Household Type | # Households | Household Size |
| Married-Couple | 6 (12.2%) | 2.67 |
| Single Male/Father | 0 (0.0%) | - |
| Single Female/Mother | 15 (30.6%) | 2.60 |
| Non-family | 28 (57.1%) | 1.04 |
| Total Households | 49 (100.0%) | 1.71 |
Household Size by Marriage Status in Gum Springs
Out of a total of 49 households in Gum Springs, 21 (42.9%) are family households, while 28 (57.1%) are nonfamily households. The most numerous type of family households are 3-person households, comprising 11, and the most common type of nonfamily households are 1-person households, comprising 26.
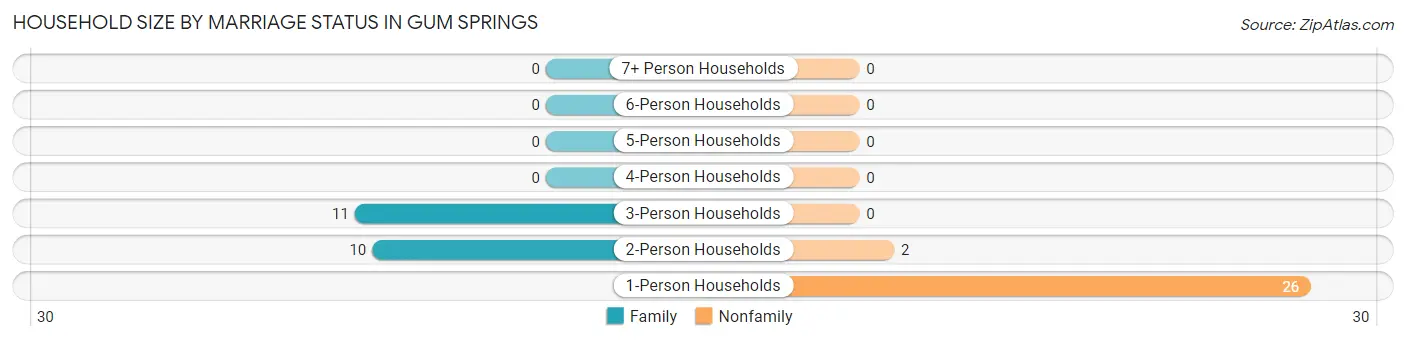
| Household Size | Family Households | Nonfamily Households |
| 1-Person Households | - | 26 (53.1%) |
| 2-Person Households | 10 (20.4%) | 2 (4.1%) |
| 3-Person Households | 11 (22.5%) | 0 (0.0%) |
| 4-Person Households | 0 (0.0%) | 0 (0.0%) |
| 5-Person Households | 0 (0.0%) | 0 (0.0%) |
| 6-Person Households | 0 (0.0%) | 0 (0.0%) |
| 7+ Person Households | 0 (0.0%) | 0 (0.0%) |
| Total | 21 (42.9%) | 28 (57.1%) |
Female Fertility in Gum Springs
Fertility by Age in Gum Springs
| Age Bracket | Women with Births | Births / 1,000 Women |
| 15 to 19 years | 0 (0.0%) | 0.0 |
| 20 to 34 years | 0 (0.0%) | 0.0 |
| 35 to 50 years | 0 (0.0%) | 0.0 |
| Total | 0 (0.0%) | 0.0 |
Fertility by Age by Marriage Status in Gum Springs
| Age Bracket | Married | Unmarried |
| 15 to 19 years | 0 (0.0%) | 0 (0.0%) |
| 20 to 34 years | 0 (0.0%) | 0 (0.0%) |
| 35 to 50 years | 0 (0.0%) | 0 (0.0%) |
| Total | 0 (0.0%) | 0 (0.0%) |
Fertility by Education in Gum Springs
| Educational Attainment | Women with Births | Births / 1,000 Women |
| Less than High School | 0 (0.0%) | 0.0 |
| High School Diploma | 0 (0.0%) | 0.0 |
| College or Associate's Degree | 0 (0.0%) | 0.0 |
| Bachelor's Degree | 0 (0.0%) | 0.0 |
| Graduate Degree | 0 (0.0%) | 0.0 |
| Total | 0 (0.0%) | 0.0 |
Fertility by Education by Marriage Status in Gum Springs

| Educational Attainment | Married | Unmarried |
| Less than High School | 0 (0.0%) | 0 (0.0%) |
| High School Diploma | 0 (0.0%) | 0 (0.0%) |
| College or Associate's Degree | 0 (0.0%) | 0 (0.0%) |
| Bachelor's Degree | 0 (0.0%) | 0 (0.0%) |
| Graduate Degree | 0 (0.0%) | 0 (0.0%) |
| Total | 0 (0.0%) | 0 (0.0%) |
Employment Characteristics in Gum Springs
Employment by Class of Employer in Gum Springs
Among the 38 employed individuals in Gum Springs, private company employees (34 | 89.5%), local government employees (2 | 5.3%), and state government employees (2 | 5.3%) make up the most common classes of employment.
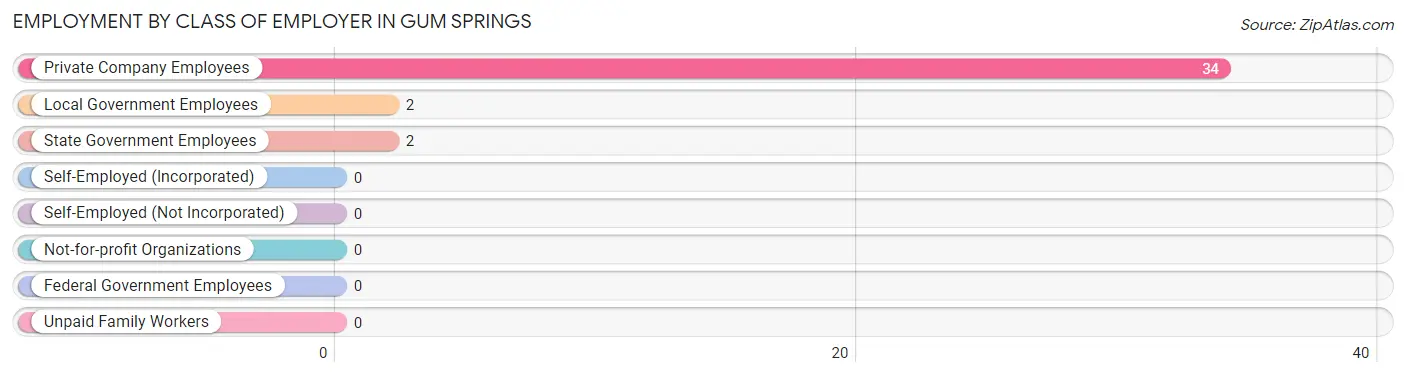
| Employer Class | # Employees | % Employees |
| Private Company Employees | 34 | 89.5% |
| Self-Employed (Incorporated) | 0 | 0.0% |
| Self-Employed (Not Incorporated) | 0 | 0.0% |
| Not-for-profit Organizations | 0 | 0.0% |
| Local Government Employees | 2 | 5.3% |
| State Government Employees | 2 | 5.3% |
| Federal Government Employees | 0 | 0.0% |
| Unpaid Family Workers | 0 | 0.0% |
| Total | 38 | 100.0% |
Employment Status by Age in Gum Springs
According to the labor force statistics for Gum Springs, out of the total population over 16 years of age (71), 60.6% or 43 individuals are in the labor force, with 11.6% or 5 of them unemployed. The age group with the highest labor force participation rate is 25 to 29 years, with 100.0% or 5 individuals in the labor force. Within the labor force, the 25 to 29 years age range has the highest percentage of unemployed individuals, with 100.0% or 5 of them being unemployed.
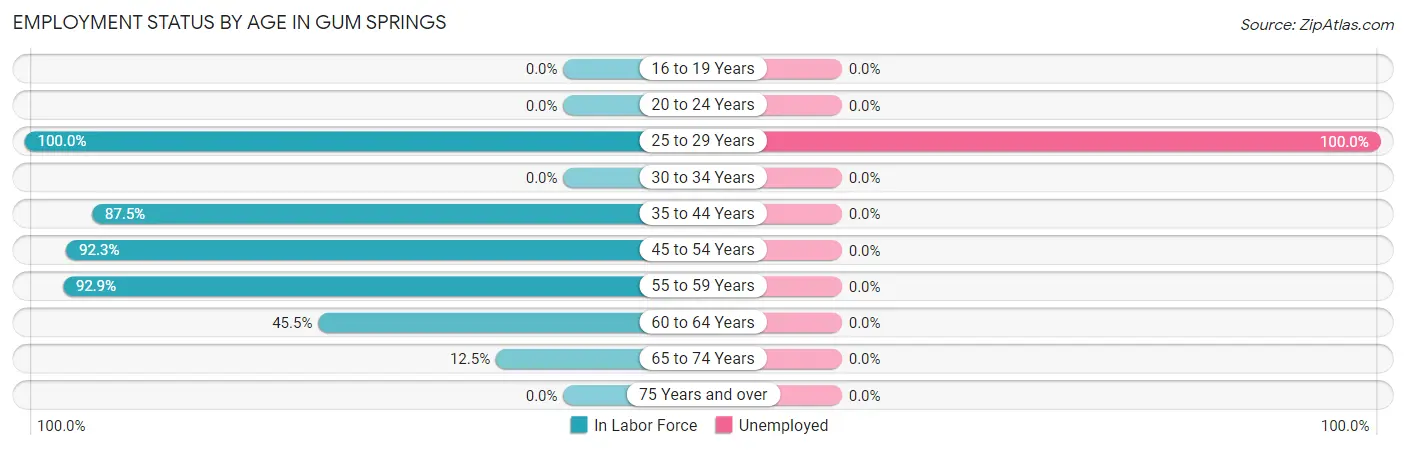
| Age Bracket | In Labor Force | Unemployed |
| 16 to 19 Years | 0 (0.0%) | 0 (0.0%) |
| 20 to 24 Years | 0 (0.0%) | 0 (0.0%) |
| 25 to 29 Years | 5 (100.0%) | 5 (100.0%) |
| 30 to 34 Years | 0 (0.0%) | 0 (0.0%) |
| 35 to 44 Years | 7 (87.5%) | 0 (0.0%) |
| 45 to 54 Years | 12 (92.3%) | 0 (0.0%) |
| 55 to 59 Years | 13 (92.9%) | 0 (0.0%) |
| 60 to 64 Years | 5 (45.5%) | 0 (0.0%) |
| 65 to 74 Years | 1 (12.5%) | 0 (0.0%) |
| 75 Years and over | 0 (0.0%) | 0 (0.0%) |
| Total | 43 (60.6%) | 5 (11.6%) |
Employment Status by Educational Attainment in Gum Springs
According to labor force statistics for Gum Springs, 82.4% of individuals (42) out of the total population between 25 and 64 years of age (51) are in the labor force, with 11.9% or 5 of them being unemployed. The group with the highest labor force participation rate are those with the educational attainment of less than high school, with 100.0% or 1 individuals in the labor force. Within the labor force, individuals with high school diploma education have the highest percentage of unemployment, with 45.5% or 5 of them being unemployed.
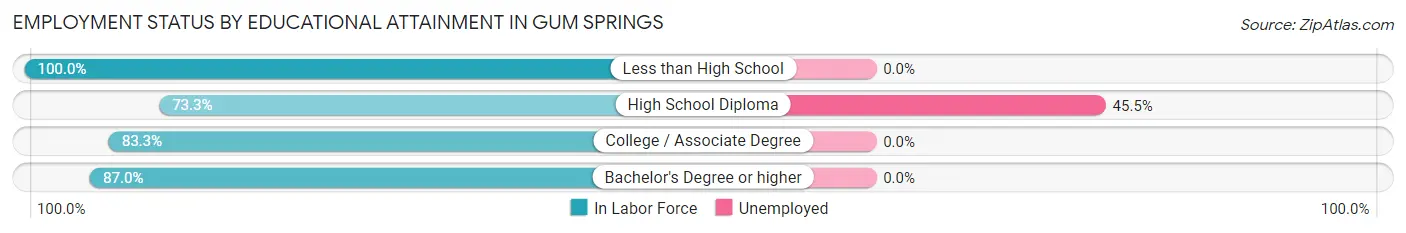
| Educational Attainment | In Labor Force | Unemployed |
| Less than High School | 1 (100.0%) | 0 (0.0%) |
| High School Diploma | 11 (73.3%) | 7 (45.5%) |
| College / Associate Degree | 10 (83.3%) | 0 (0.0%) |
| Bachelor's Degree or higher | 20 (87.0%) | 0 (0.0%) |
| Total | 42 (82.4%) | 6 (11.9%) |
Employment Occupations by Sex in Gum Springs
Management, Business, Science and Arts Occupations
The most common Management, Business, Science and Arts occupations in Gum Springs are Community & Social Service (6 | 15.8%), and Education, Arts & Media (6 | 15.8%).
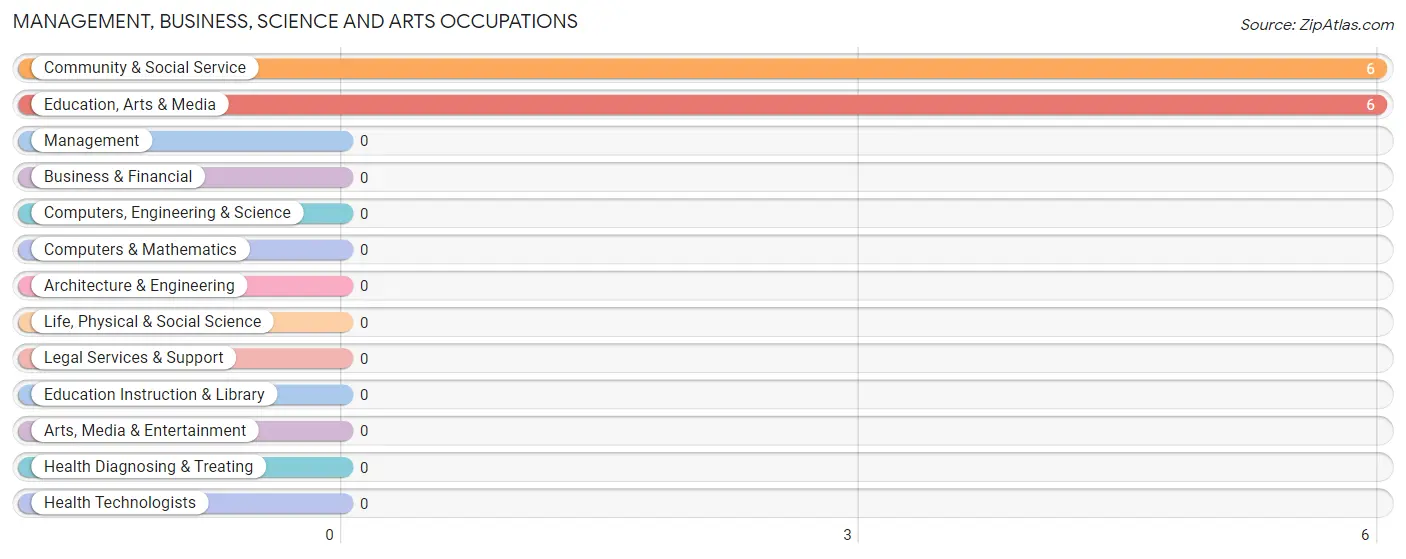
Management, Business, Science and Arts Occupations by Sex
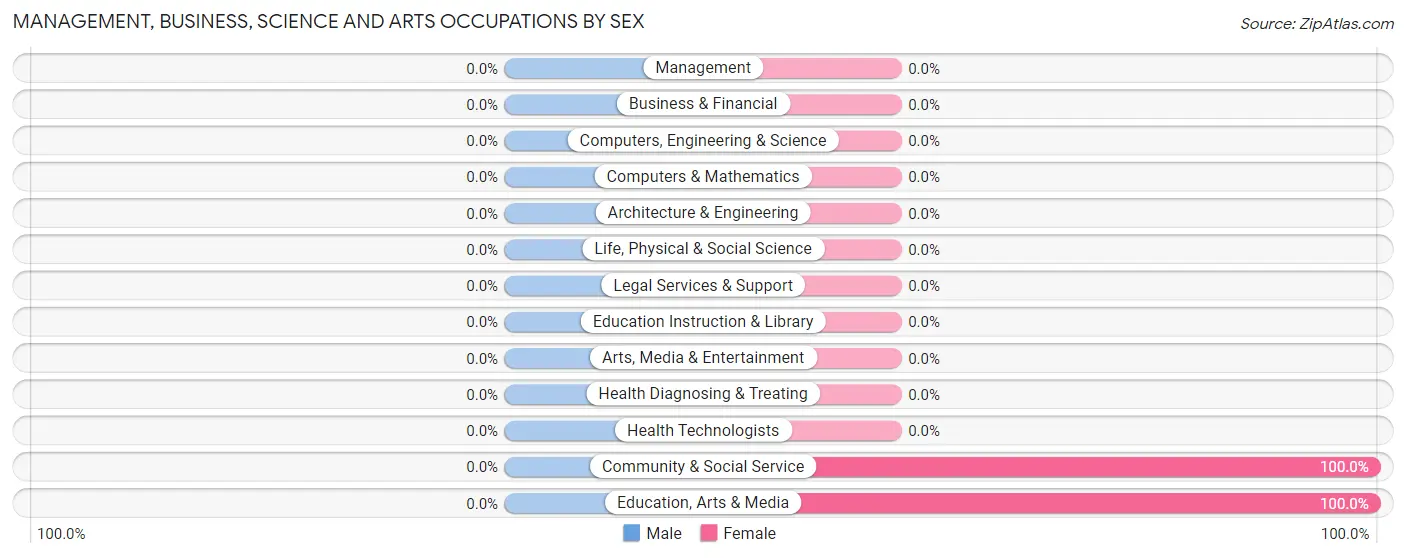
| Occupation | Male | Female |
| Management | 0 (0.0%) | 0 (0.0%) |
| Business & Financial | 0 (0.0%) | 0 (0.0%) |
| Computers, Engineering & Science | 0 (0.0%) | 0 (0.0%) |
| Computers & Mathematics | 0 (0.0%) | 0 (0.0%) |
| Architecture & Engineering | 0 (0.0%) | 0 (0.0%) |
| Life, Physical & Social Science | 0 (0.0%) | 0 (0.0%) |
| Community & Social Service | 0 (0.0%) | 6 (100.0%) |
| Education, Arts & Media | 0 (0.0%) | 6 (100.0%) |
| Legal Services & Support | 0 (0.0%) | 0 (0.0%) |
| Education Instruction & Library | 0 (0.0%) | 0 (0.0%) |
| Arts, Media & Entertainment | 0 (0.0%) | 0 (0.0%) |
| Health Diagnosing & Treating | 0 (0.0%) | 0 (0.0%) |
| Health Technologists | 0 (0.0%) | 0 (0.0%) |
| Total (Category) | 0 (0.0%) | 6 (100.0%) |
| Total (Overall) | 12 (31.6%) | 26 (68.4%) |
Services Occupations
The most common Services occupations in Gum Springs are Healthcare Support (9 | 23.7%), and Food Preparation & Serving (2 | 5.3%).
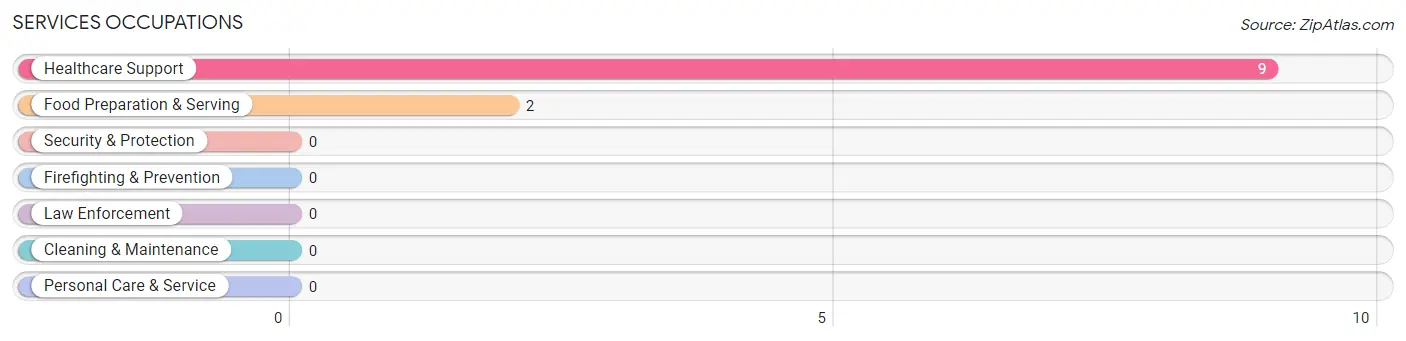
Services Occupations by Sex
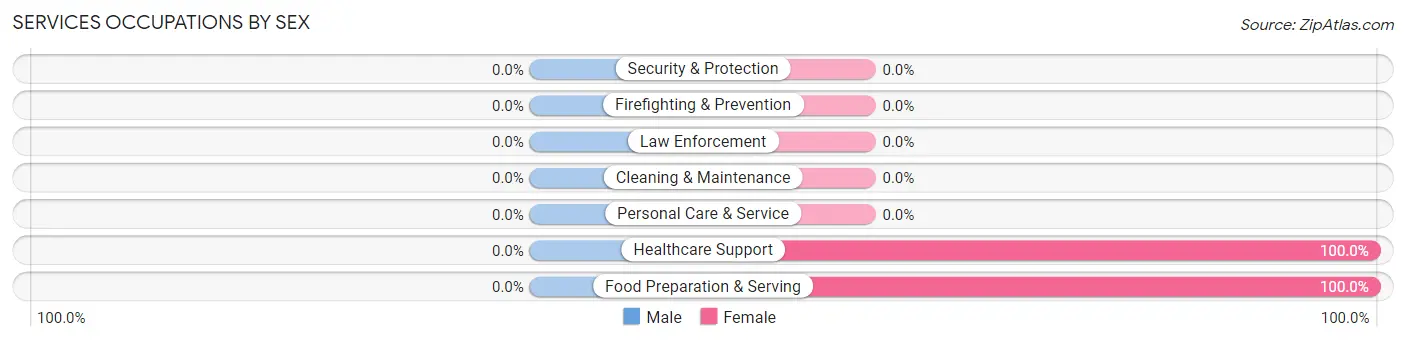
| Occupation | Male | Female |
| Healthcare Support | 0 (0.0%) | 9 (100.0%) |
| Security & Protection | 0 (0.0%) | 0 (0.0%) |
| Firefighting & Prevention | 0 (0.0%) | 0 (0.0%) |
| Law Enforcement | 0 (0.0%) | 0 (0.0%) |
| Food Preparation & Serving | 0 (0.0%) | 2 (100.0%) |
| Cleaning & Maintenance | 0 (0.0%) | 0 (0.0%) |
| Personal Care & Service | 0 (0.0%) | 0 (0.0%) |
| Total (Category) | 0 (0.0%) | 11 (100.0%) |
| Total (Overall) | 12 (31.6%) | 26 (68.4%) |
Sales and Office Occupations
The most common Sales and Office occupations in Gum Springs are Office & Administration (6 | 15.8%), and Sales & Related (1 | 2.6%).
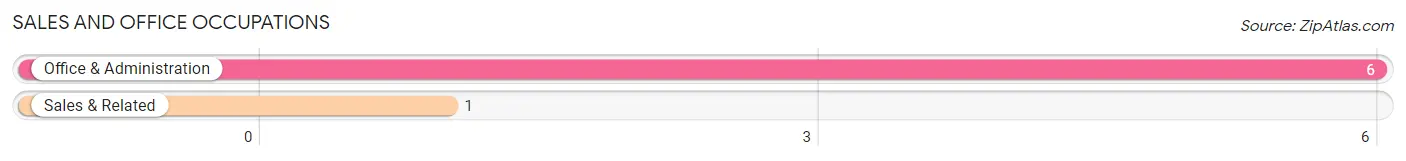
Sales and Office Occupations by Sex
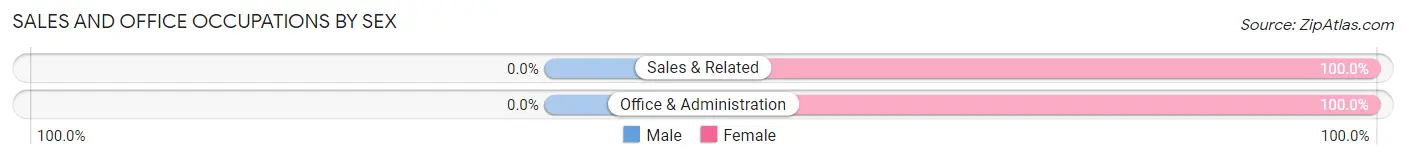
| Occupation | Male | Female |
| Sales & Related | 0 (0.0%) | 1 (100.0%) |
| Office & Administration | 0 (0.0%) | 6 (100.0%) |
| Total (Category) | 0 (0.0%) | 7 (100.0%) |
| Total (Overall) | 12 (31.6%) | 26 (68.4%) |
Natural Resources, Construction and Maintenance Occupations
The most common Natural Resources, Construction and Maintenance occupations in Gum Springs are , and Installation, Maintenance & Repair (2 | 5.3%).
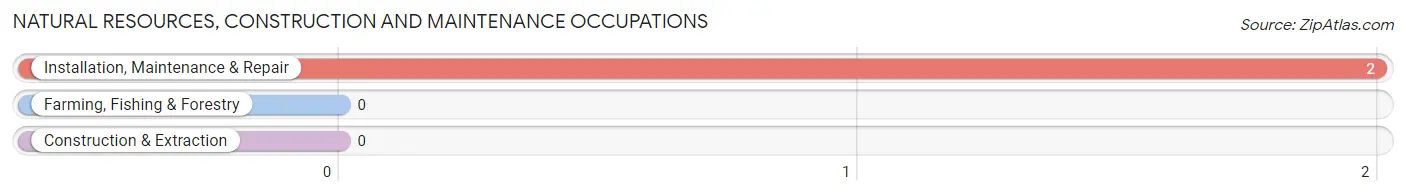
Natural Resources, Construction and Maintenance Occupations by Sex
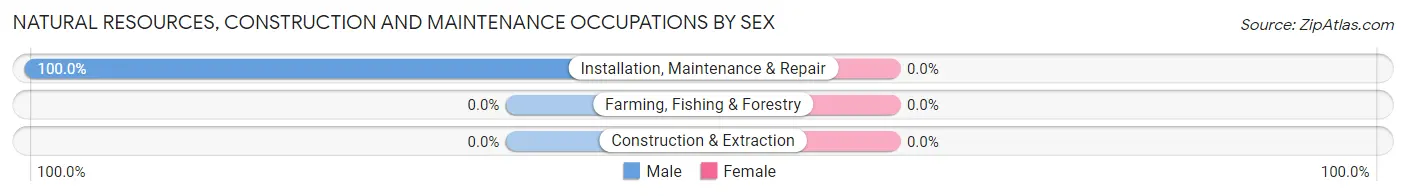
| Occupation | Male | Female |
| Farming, Fishing & Forestry | 0 (0.0%) | 0 (0.0%) |
| Construction & Extraction | 0 (0.0%) | 0 (0.0%) |
| Installation, Maintenance & Repair | 2 (100.0%) | 0 (0.0%) |
| Total (Category) | 2 (100.0%) | 0 (0.0%) |
| Total (Overall) | 12 (31.6%) | 26 (68.4%) |
Production, Transportation and Moving Occupations
The most common Production, Transportation and Moving occupations in Gum Springs are , and Transportation (12 | 31.6%).
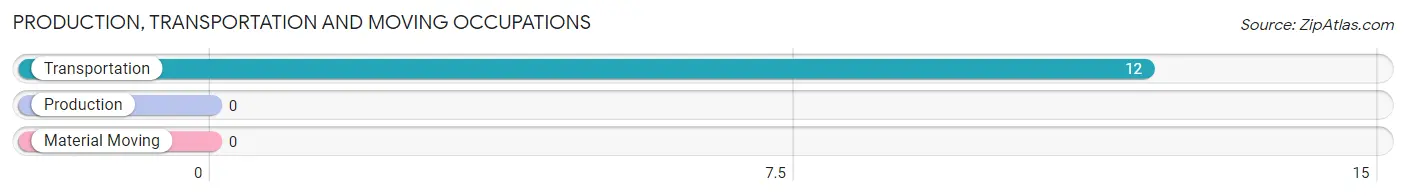
Production, Transportation and Moving Occupations by Sex
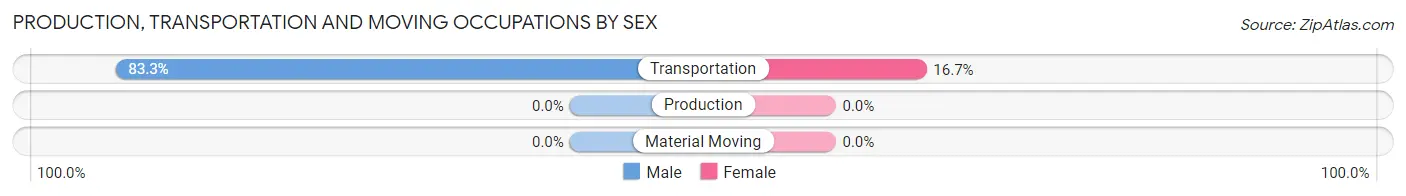
| Occupation | Male | Female |
| Production | 0 (0.0%) | 0 (0.0%) |
| Transportation | 10 (83.3%) | 2 (16.7%) |
| Material Moving | 0 (0.0%) | 0 (0.0%) |
| Total (Category) | 10 (83.3%) | 2 (16.7%) |
| Total (Overall) | 12 (31.6%) | 26 (68.4%) |
Employment Industries by Sex in Gum Springs
Employment Industries in Gum Springs
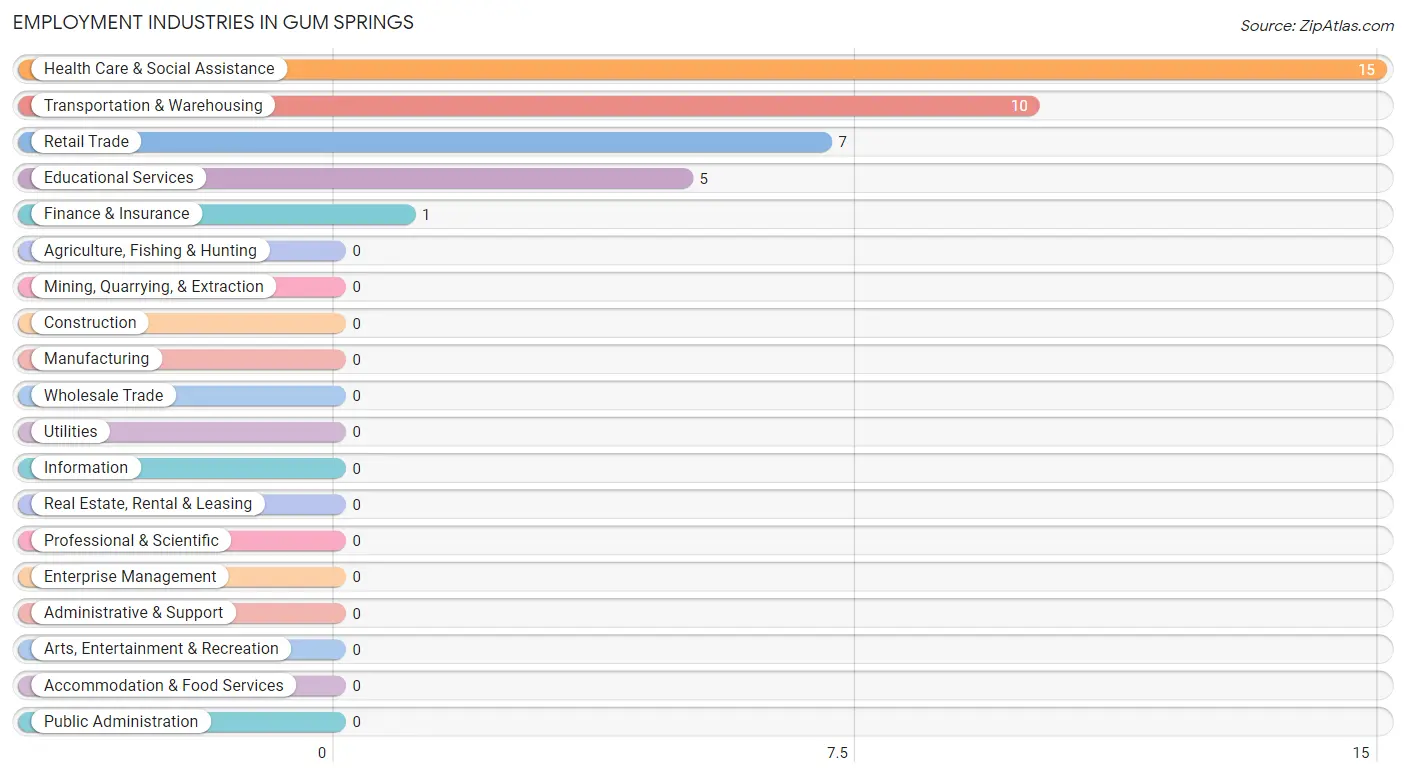
The major employment industries in Gum Springs include Health Care & Social Assistance (15 | 39.5%), Transportation & Warehousing (10 | 26.3%), Retail Trade (7 | 18.4%), Educational Services (5 | 13.2%), and Finance & Insurance (1 | 2.6%).
Employment Industries by Sex in Gum Springs
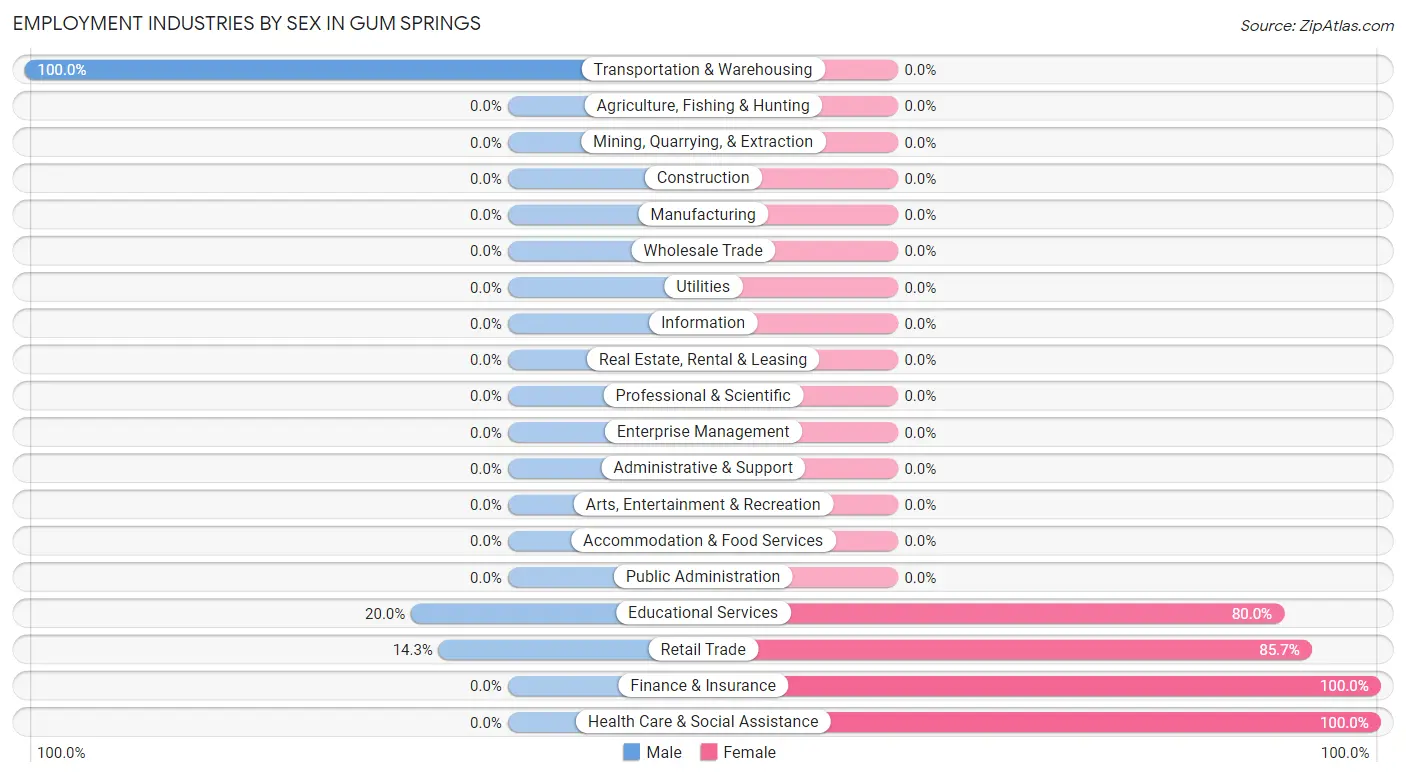
The Gum Springs industries that see more men than women are Transportation & Warehousing (100.0%), Educational Services (20.0%), and Retail Trade (14.3%), whereas the industries that tend to have a higher number of women are Finance & Insurance (100.0%), Health Care & Social Assistance (100.0%), and Retail Trade (85.7%).
| Industry | Male | Female |
| Agriculture, Fishing & Hunting | 0 (0.0%) | 0 (0.0%) |
| Mining, Quarrying, & Extraction | 0 (0.0%) | 0 (0.0%) |
| Construction | 0 (0.0%) | 0 (0.0%) |
| Manufacturing | 0 (0.0%) | 0 (0.0%) |
| Wholesale Trade | 0 (0.0%) | 0 (0.0%) |
| Retail Trade | 1 (14.3%) | 6 (85.7%) |
| Transportation & Warehousing | 10 (100.0%) | 0 (0.0%) |
| Utilities | 0 (0.0%) | 0 (0.0%) |
| Information | 0 (0.0%) | 0 (0.0%) |
| Finance & Insurance | 0 (0.0%) | 1 (100.0%) |
| Real Estate, Rental & Leasing | 0 (0.0%) | 0 (0.0%) |
| Professional & Scientific | 0 (0.0%) | 0 (0.0%) |
| Enterprise Management | 0 (0.0%) | 0 (0.0%) |
| Administrative & Support | 0 (0.0%) | 0 (0.0%) |
| Educational Services | 1 (20.0%) | 4 (80.0%) |
| Health Care & Social Assistance | 0 (0.0%) | 15 (100.0%) |
| Arts, Entertainment & Recreation | 0 (0.0%) | 0 (0.0%) |
| Accommodation & Food Services | 0 (0.0%) | 0 (0.0%) |
| Public Administration | 0 (0.0%) | 0 (0.0%) |
| Total | 12 (31.6%) | 26 (68.4%) |
Education in Gum Springs
School Enrollment in Gum Springs
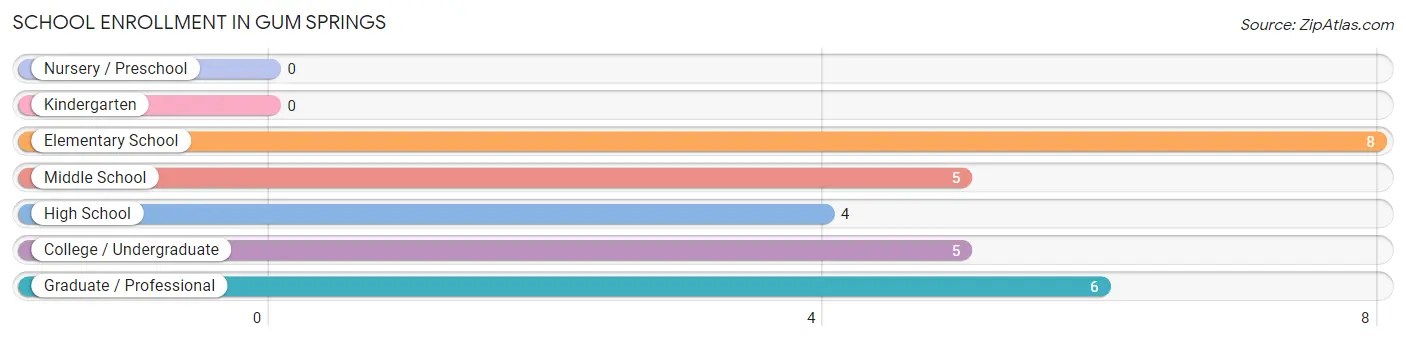
The most common levels of schooling among the 28 students in Gum Springs are elementary school (8 | 28.6%), graduate / professional (6 | 21.4%), and middle school (5 | 17.9%).
| School Level | # Students | % Students |
| Nursery / Preschool | 0 | 0.0% |
| Kindergarten | 0 | 0.0% |
| Elementary School | 8 | 28.6% |
| Middle School | 5 | 17.9% |
| High School | 4 | 14.3% |
| College / Undergraduate | 5 | 17.9% |
| Graduate / Professional | 6 | 21.4% |
| Total | 28 | 100.0% |
School Enrollment by Age by Funding Source in Gum Springs
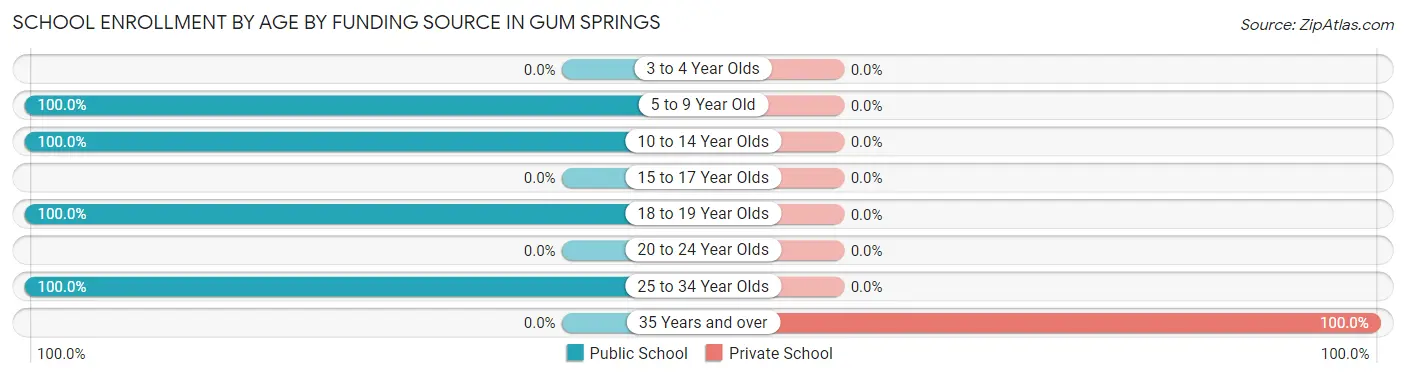
Out of a total of 28 students who are enrolled in schools in Gum Springs, 6 (21.4%) attend a private institution, while the remaining 22 (78.6%) are enrolled in public schools. The age group of 35 years and over has the highest likelihood of being enrolled in private schools, with 6 (100.0% in the age bracket) enrolled. Conversely, the age group of 5 to 9 year old has the lowest likelihood of being enrolled in a private school, with 8 (100.0% in the age bracket) attending a public institution.
| Age Bracket | Public School | Private School |
| 3 to 4 Year Olds | 0 (0.0%) | 0 (0.0%) |
| 5 to 9 Year Old | 8 (100.0%) | 0 (0.0%) |
| 10 to 14 Year Olds | 5 (100.0%) | 0 (0.0%) |
| 15 to 17 Year Olds | 0 (0.0%) | 0 (0.0%) |
| 18 to 19 Year Olds | 4 (100.0%) | 0 (0.0%) |
| 20 to 24 Year Olds | 0 (0.0%) | 0 (0.0%) |
| 25 to 34 Year Olds | 5 (100.0%) | 0 (0.0%) |
| 35 Years and over | 0 (0.0%) | 6 (100.0%) |
| Total | 22 (78.6%) | 6 (21.4%) |
Educational Attainment by Field of Study in Gum Springs
Business (8 | 33.3%), social sciences (7 | 29.2%), liberal arts & history (7 | 29.2%), psychology (1 | 4.2%), and literature & languages (1 | 4.2%) are the most common fields of study among 24 individuals in Gum Springs who have obtained a bachelor's degree or higher.
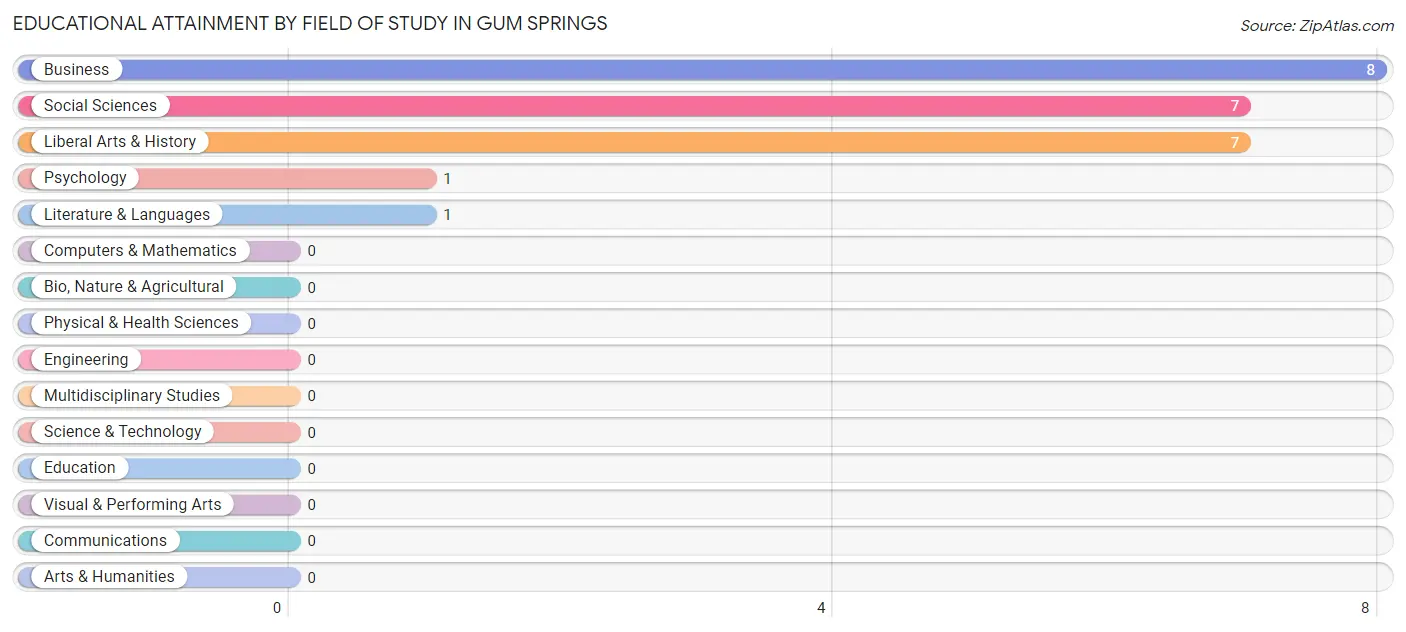
| Field of Study | # Graduates | % Graduates |
| Computers & Mathematics | 0 | 0.0% |
| Bio, Nature & Agricultural | 0 | 0.0% |
| Physical & Health Sciences | 0 | 0.0% |
| Psychology | 1 | 4.2% |
| Social Sciences | 7 | 29.2% |
| Engineering | 0 | 0.0% |
| Multidisciplinary Studies | 0 | 0.0% |
| Science & Technology | 0 | 0.0% |
| Business | 8 | 33.3% |
| Education | 0 | 0.0% |
| Literature & Languages | 1 | 4.2% |
| Liberal Arts & History | 7 | 29.2% |
| Visual & Performing Arts | 0 | 0.0% |
| Communications | 0 | 0.0% |
| Arts & Humanities | 0 | 0.0% |
| Total | 24 | 100.0% |
Transportation & Commute in Gum Springs
Vehicle Availability by Sex in Gum Springs
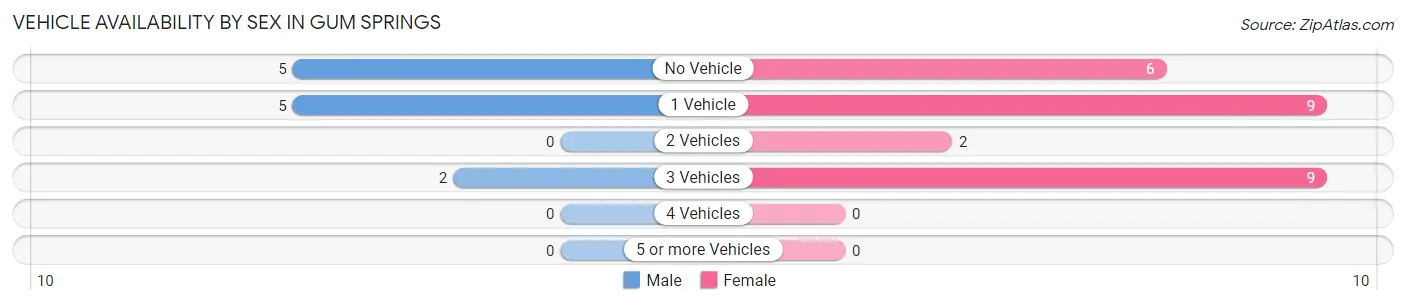
The most prevalent vehicle ownership categories in Gum Springs are males with no vehicle (5, accounting for 41.7%) and females with no vehicle (6, making up 19.2%).
| Vehicles Available | Male | Female |
| No Vehicle | 5 (41.7%) | 6 (23.1%) |
| 1 Vehicle | 5 (41.7%) | 9 (34.6%) |
| 2 Vehicles | 0 (0.0%) | 2 (7.7%) |
| 3 Vehicles | 2 (16.7%) | 9 (34.6%) |
| 4 Vehicles | 0 (0.0%) | 0 (0.0%) |
| 5 or more Vehicles | 0 (0.0%) | 0 (0.0%) |
| Total | 12 (100.0%) | 26 (100.0%) |
Commute Time in Gum Springs
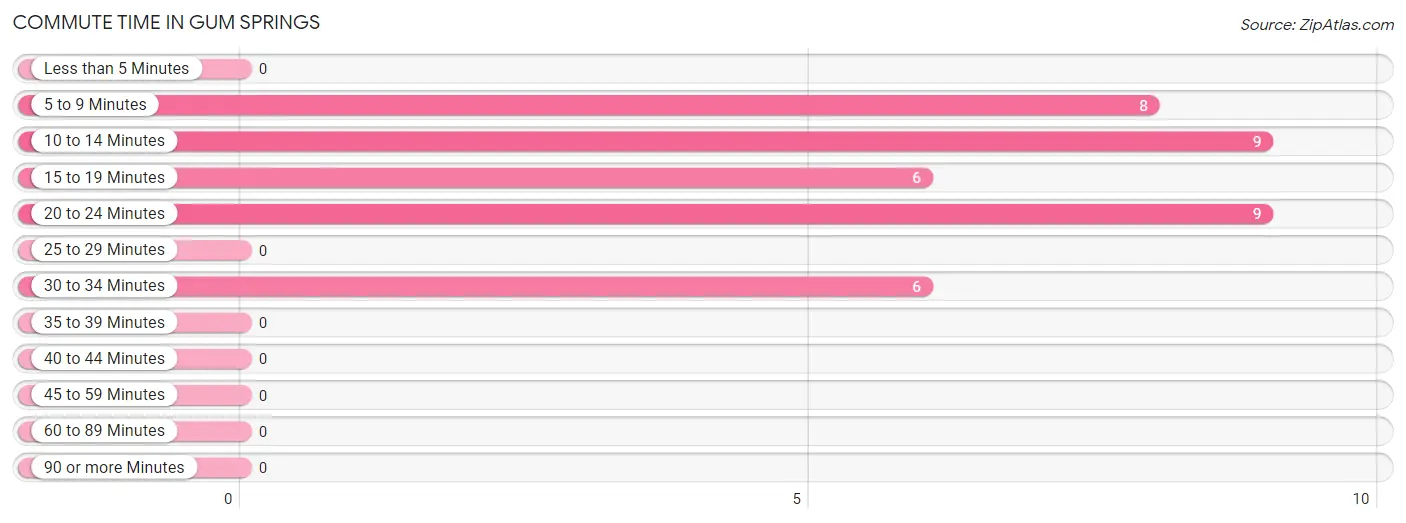
The most frequently occuring commute durations in Gum Springs are 10 to 14 minutes (9 commuters, 23.7%), 20 to 24 minutes (9 commuters, 23.7%), and 5 to 9 minutes (8 commuters, 21.0%).
| Commute Time | # Commuters | % Commuters |
| Less than 5 Minutes | 0 | 0.0% |
| 5 to 9 Minutes | 8 | 21.0% |
| 10 to 14 Minutes | 9 | 23.7% |
| 15 to 19 Minutes | 6 | 15.8% |
| 20 to 24 Minutes | 9 | 23.7% |
| 25 to 29 Minutes | 0 | 0.0% |
| 30 to 34 Minutes | 6 | 15.8% |
| 35 to 39 Minutes | 0 | 0.0% |
| 40 to 44 Minutes | 0 | 0.0% |
| 45 to 59 Minutes | 0 | 0.0% |
| 60 to 89 Minutes | 0 | 0.0% |
| 90 or more Minutes | 0 | 0.0% |
Commute Time by Sex in Gum Springs
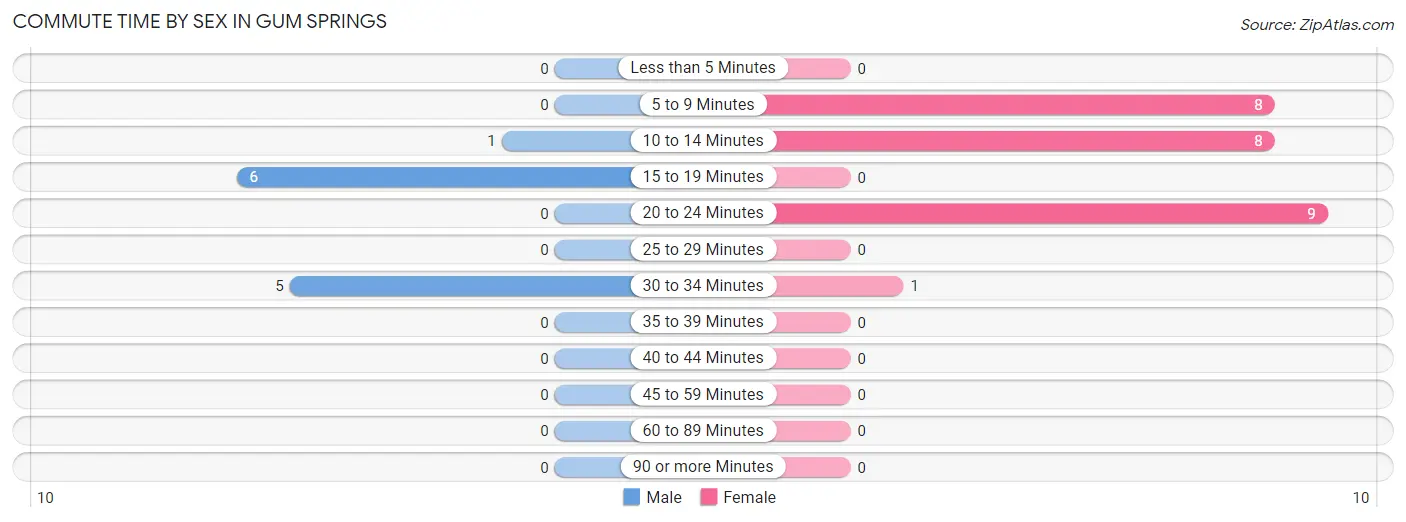
The most common commute times in Gum Springs are 15 to 19 minutes (6 commuters, 50.0%) for males and 20 to 24 minutes (9 commuters, 34.6%) for females.
| Commute Time | Male | Female |
| Less than 5 Minutes | 0 (0.0%) | 0 (0.0%) |
| 5 to 9 Minutes | 0 (0.0%) | 8 (30.8%) |
| 10 to 14 Minutes | 1 (8.3%) | 8 (30.8%) |
| 15 to 19 Minutes | 6 (50.0%) | 0 (0.0%) |
| 20 to 24 Minutes | 0 (0.0%) | 9 (34.6%) |
| 25 to 29 Minutes | 0 (0.0%) | 0 (0.0%) |
| 30 to 34 Minutes | 5 (41.7%) | 1 (3.8%) |
| 35 to 39 Minutes | 0 (0.0%) | 0 (0.0%) |
| 40 to 44 Minutes | 0 (0.0%) | 0 (0.0%) |
| 45 to 59 Minutes | 0 (0.0%) | 0 (0.0%) |
| 60 to 89 Minutes | 0 (0.0%) | 0 (0.0%) |
| 90 or more Minutes | 0 (0.0%) | 0 (0.0%) |
Time of Departure to Work by Sex in Gum Springs
The most frequent times of departure to work in Gum Springs are 6:30 AM to 6:59 AM (6, 50.0%) for males and 7:00 AM to 7:29 AM (15, 57.7%) for females.
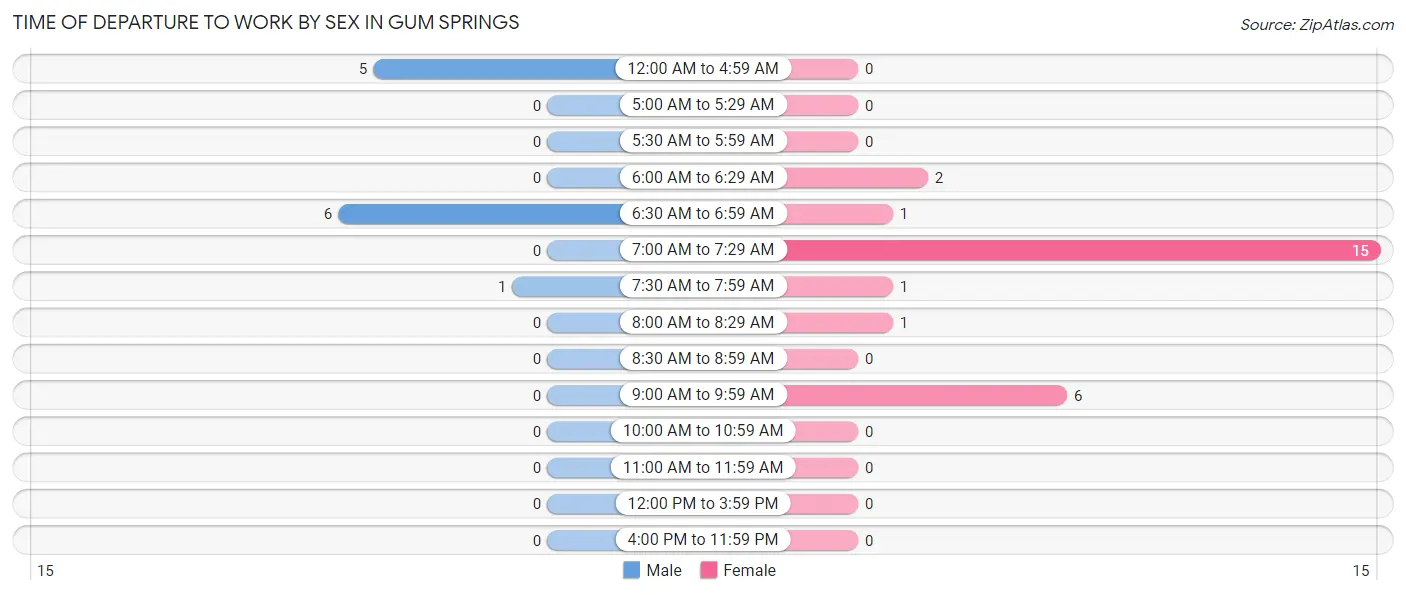
| Time of Departure | Male | Female |
| 12:00 AM to 4:59 AM | 5 (41.7%) | 0 (0.0%) |
| 5:00 AM to 5:29 AM | 0 (0.0%) | 0 (0.0%) |
| 5:30 AM to 5:59 AM | 0 (0.0%) | 0 (0.0%) |
| 6:00 AM to 6:29 AM | 0 (0.0%) | 2 (7.7%) |
| 6:30 AM to 6:59 AM | 6 (50.0%) | 1 (3.8%) |
| 7:00 AM to 7:29 AM | 0 (0.0%) | 15 (57.7%) |
| 7:30 AM to 7:59 AM | 1 (8.3%) | 1 (3.8%) |
| 8:00 AM to 8:29 AM | 0 (0.0%) | 1 (3.8%) |
| 8:30 AM to 8:59 AM | 0 (0.0%) | 0 (0.0%) |
| 9:00 AM to 9:59 AM | 0 (0.0%) | 6 (23.1%) |
| 10:00 AM to 10:59 AM | 0 (0.0%) | 0 (0.0%) |
| 11:00 AM to 11:59 AM | 0 (0.0%) | 0 (0.0%) |
| 12:00 PM to 3:59 PM | 0 (0.0%) | 0 (0.0%) |
| 4:00 PM to 11:59 PM | 0 (0.0%) | 0 (0.0%) |
| Total | 12 (100.0%) | 26 (100.0%) |
Housing Occupancy in Gum Springs
Occupancy by Ownership in Gum Springs
Of the total 49 dwellings in Gum Springs, owner-occupied units account for 23 (46.9%), while renter-occupied units make up 26 (53.1%).
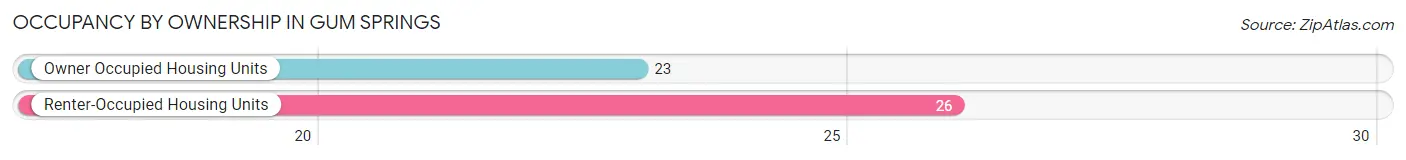
| Occupancy | # Housing Units | % Housing Units |
| Owner Occupied Housing Units | 23 | 46.9% |
| Renter-Occupied Housing Units | 26 | 53.1% |
| Total Occupied Housing Units | 49 | 100.0% |
Occupancy by Household Size in Gum Springs
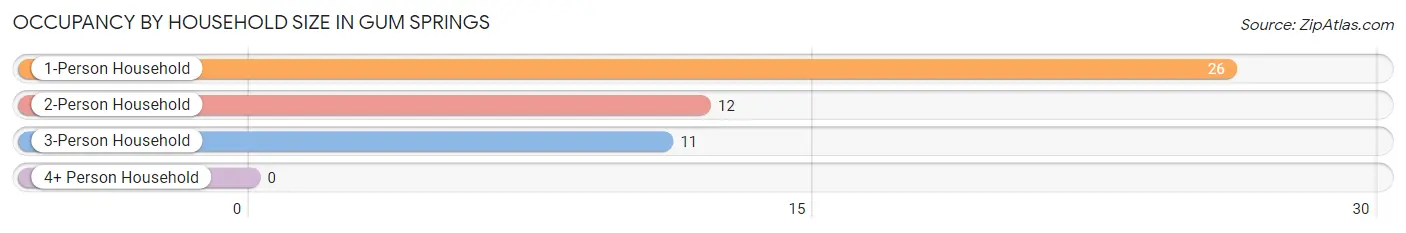
| Household Size | # Housing Units | % Housing Units |
| 1-Person Household | 26 | 53.1% |
| 2-Person Household | 12 | 24.5% |
| 3-Person Household | 11 | 22.5% |
| 4+ Person Household | 0 | 0.0% |
| Total Housing Units | 49 | 100.0% |
Occupancy by Ownership by Household Size in Gum Springs
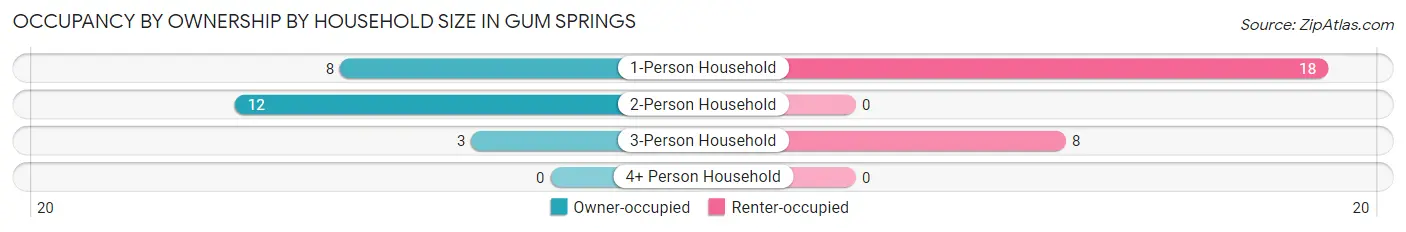
| Household Size | Owner-occupied | Renter-occupied |
| 1-Person Household | 8 (30.8%) | 18 (69.2%) |
| 2-Person Household | 12 (100.0%) | 0 (0.0%) |
| 3-Person Household | 3 (27.3%) | 8 (72.7%) |
| 4+ Person Household | 0 (0.0%) | 0 (0.0%) |
| Total Housing Units | 23 (46.9%) | 26 (53.1%) |
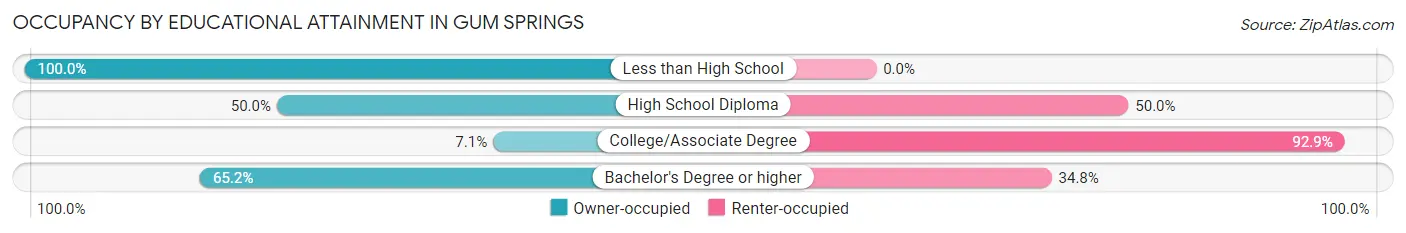
Occupancy by Educational Attainment in Gum Springs
| Household Size | Owner-occupied | Renter-occupied |
| Less than High School | 2 (100.0%) | 0 (0.0%) |
| High School Diploma | 5 (50.0%) | 5 (50.0%) |
| College/Associate Degree | 1 (7.1%) | 13 (92.9%) |
| Bachelor's Degree or higher | 15 (65.2%) | 8 (34.8%) |
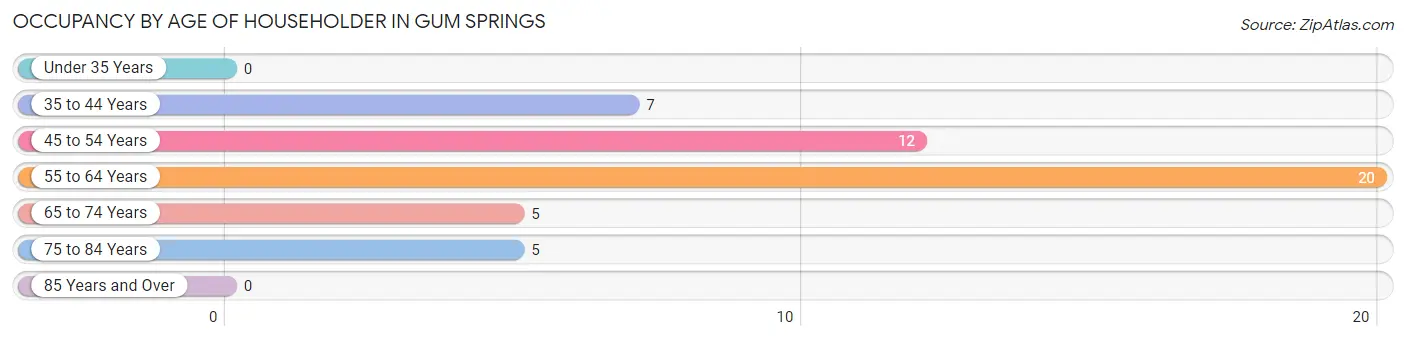
Occupancy by Age of Householder in Gum Springs
| Age Bracket | # Households | % Households |
| Under 35 Years | 0 | 0.0% |
| 35 to 44 Years | 7 | 14.3% |
| 45 to 54 Years | 12 | 24.5% |
| 55 to 64 Years | 20 | 40.8% |
| 65 to 74 Years | 5 | 10.2% |
| 75 to 84 Years | 5 | 10.2% |
| 85 Years and Over | 0 | 0.0% |
| Total | 49 | 100.0% |
Housing Finances in Gum Springs
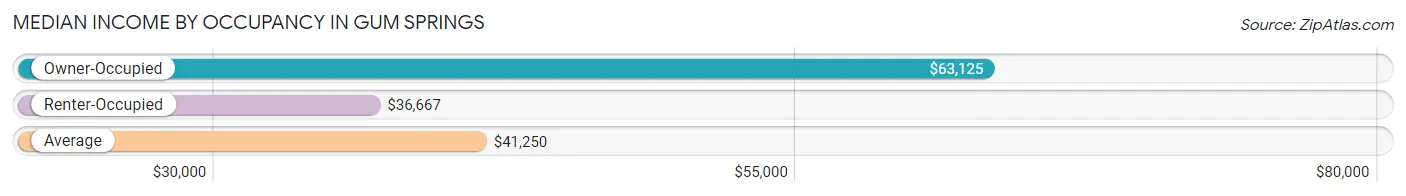
Median Income by Occupancy in Gum Springs
| Occupancy Type | # Households | Median Income |
| Owner-Occupied | 23 (46.9%) | $63,125 |
| Renter-Occupied | 26 (53.1%) | $36,667 |
| Average | 49 (100.0%) | $41,250 |
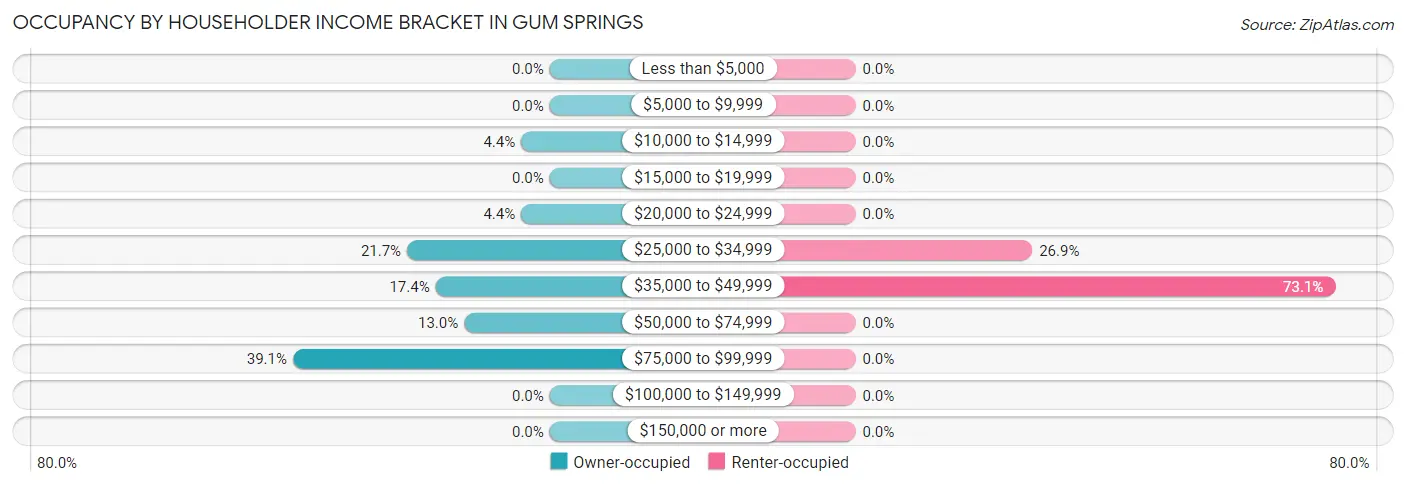
Occupancy by Householder Income Bracket in Gum Springs
| Income Bracket | Owner-occupied | Renter-occupied |
| Less than $5,000 | 0 (0.0%) | 0 (0.0%) |
| $5,000 to $9,999 | 0 (0.0%) | 0 (0.0%) |
| $10,000 to $14,999 | 1 (4.3%) | 0 (0.0%) |
| $15,000 to $19,999 | 0 (0.0%) | 0 (0.0%) |
| $20,000 to $24,999 | 1 (4.3%) | 0 (0.0%) |
| $25,000 to $34,999 | 5 (21.7%) | 7 (26.9%) |
| $35,000 to $49,999 | 4 (17.4%) | 19 (73.1%) |
| $50,000 to $74,999 | 3 (13.0%) | 0 (0.0%) |
| $75,000 to $99,999 | 9 (39.1%) | 0 (0.0%) |
| $100,000 to $149,999 | 0 (0.0%) | 0 (0.0%) |
| $150,000 or more | 0 (0.0%) | 0 (0.0%) |
| Total | 23 (100.0%) | 26 (100.0%) |
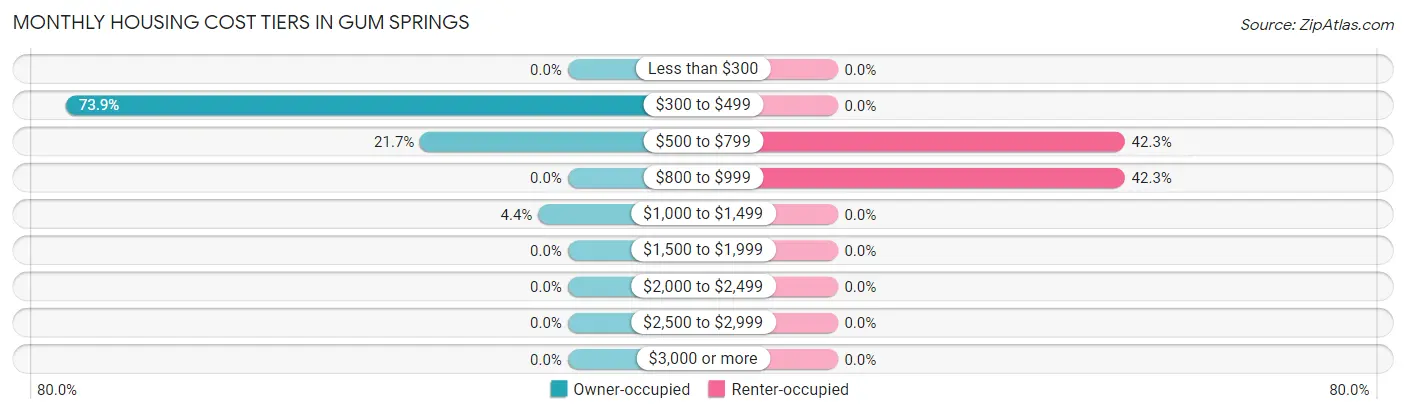
Monthly Housing Cost Tiers in Gum Springs
| Monthly Cost | Owner-occupied | Renter-occupied |
| Less than $300 | 0 (0.0%) | 0 (0.0%) |
| $300 to $499 | 17 (73.9%) | 0 (0.0%) |
| $500 to $799 | 5 (21.7%) | 11 (42.3%) |
| $800 to $999 | 0 (0.0%) | 11 (42.3%) |
| $1,000 to $1,499 | 1 (4.3%) | 0 (0.0%) |
| $1,500 to $1,999 | 0 (0.0%) | 0 (0.0%) |
| $2,000 to $2,499 | 0 (0.0%) | 0 (0.0%) |
| $2,500 to $2,999 | 0 (0.0%) | 0 (0.0%) |
| $3,000 or more | 0 (0.0%) | 0 (0.0%) |
| Total | 23 (100.0%) | 26 (100.0%) |
Physical Housing Characteristics in Gum Springs
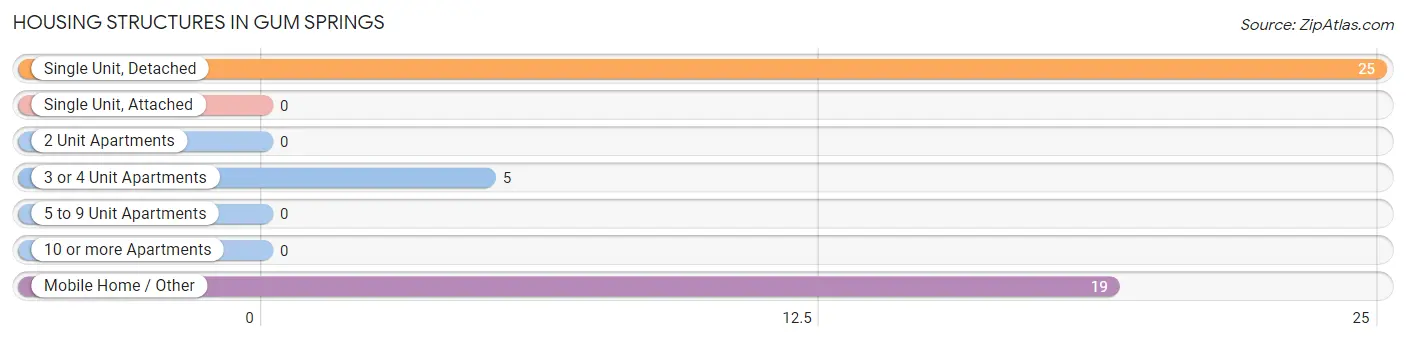
Housing Structures in Gum Springs
| Structure Type | # Housing Units | % Housing Units |
| Single Unit, Detached | 25 | 51.0% |
| Single Unit, Attached | 0 | 0.0% |
| 2 Unit Apartments | 0 | 0.0% |
| 3 or 4 Unit Apartments | 5 | 10.2% |
| 5 to 9 Unit Apartments | 0 | 0.0% |
| 10 or more Apartments | 0 | 0.0% |
| Mobile Home / Other | 19 | 38.8% |
| Total | 49 | 100.0% |
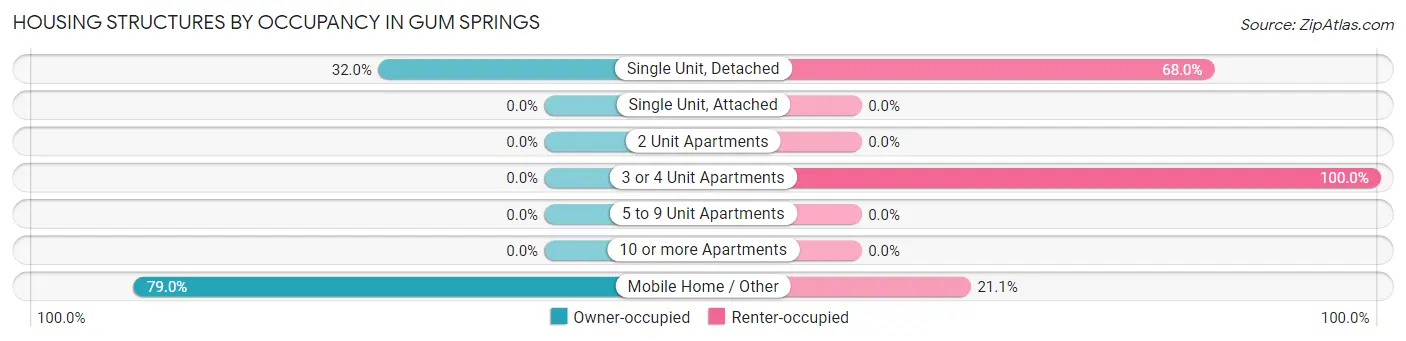
Housing Structures by Occupancy in Gum Springs
| Structure Type | Owner-occupied | Renter-occupied |
| Single Unit, Detached | 8 (32.0%) | 17 (68.0%) |
| Single Unit, Attached | 0 (0.0%) | 0 (0.0%) |
| 2 Unit Apartments | 0 (0.0%) | 0 (0.0%) |
| 3 or 4 Unit Apartments | 0 (0.0%) | 5 (100.0%) |
| 5 to 9 Unit Apartments | 0 (0.0%) | 0 (0.0%) |
| 10 or more Apartments | 0 (0.0%) | 0 (0.0%) |
| Mobile Home / Other | 15 (78.9%) | 4 (21.0%) |
| Total | 23 (46.9%) | 26 (53.1%) |
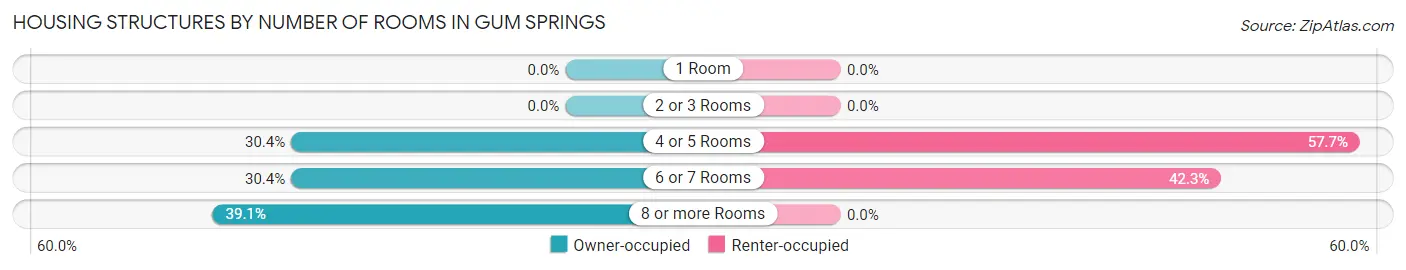
Housing Structures by Number of Rooms in Gum Springs
| Number of Rooms | Owner-occupied | Renter-occupied |
| 1 Room | 0 (0.0%) | 0 (0.0%) |
| 2 or 3 Rooms | 0 (0.0%) | 0 (0.0%) |
| 4 or 5 Rooms | 7 (30.4%) | 15 (57.7%) |
| 6 or 7 Rooms | 7 (30.4%) | 11 (42.3%) |
| 8 or more Rooms | 9 (39.1%) | 0 (0.0%) |
| Total | 23 (100.0%) | 26 (100.0%) |
Housing Structure by Heating Type in Gum Springs
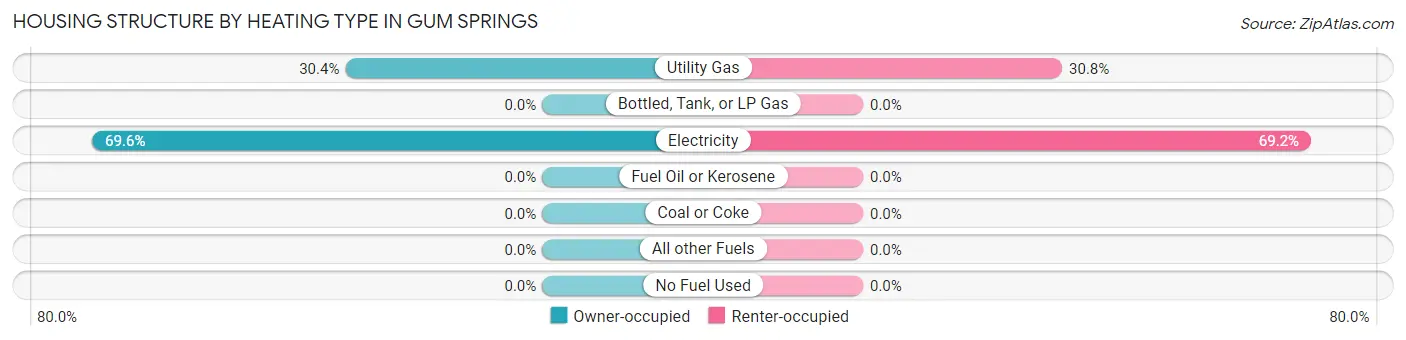
| Heating Type | Owner-occupied | Renter-occupied |
| Utility Gas | 7 (30.4%) | 8 (30.8%) |
| Bottled, Tank, or LP Gas | 0 (0.0%) | 0 (0.0%) |
| Electricity | 16 (69.6%) | 18 (69.2%) |
| Fuel Oil or Kerosene | 0 (0.0%) | 0 (0.0%) |
| Coal or Coke | 0 (0.0%) | 0 (0.0%) |
| All other Fuels | 0 (0.0%) | 0 (0.0%) |
| No Fuel Used | 0 (0.0%) | 0 (0.0%) |
| Total | 23 (100.0%) | 26 (100.0%) |
Household Vehicle Usage in Gum Springs
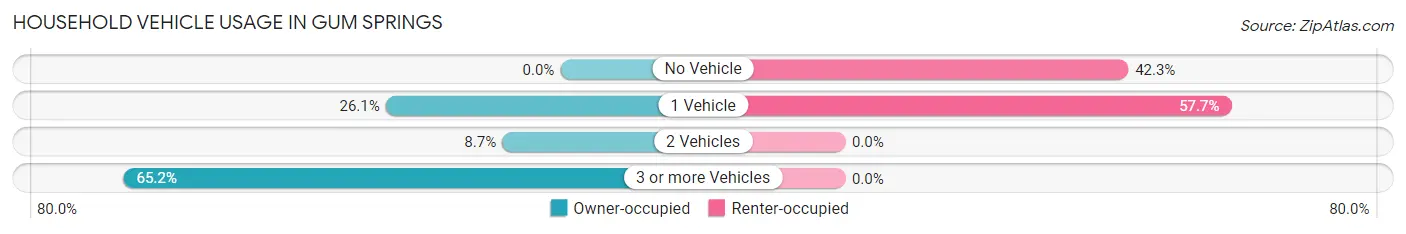
| Vehicles per Household | Owner-occupied | Renter-occupied |
| No Vehicle | 0 (0.0%) | 11 (42.3%) |
| 1 Vehicle | 6 (26.1%) | 15 (57.7%) |
| 2 Vehicles | 2 (8.7%) | 0 (0.0%) |
| 3 or more Vehicles | 15 (65.2%) | 0 (0.0%) |
| Total | 23 (100.0%) | 26 (100.0%) |
Real Estate & Mortgages in Gum Springs
Real Estate and Mortgage Overview in Gum Springs
| Characteristic | Without Mortgage | With Mortgage |
| Housing Units | 18 | 5 |
| Median Property Value | $51,300 | $92,500 |
| Median Household Income | - | - |
| Monthly Housing Costs | $400 | $0 |
| Real Estate Taxes | $486 | $1 |
Property Value by Mortgage Status in Gum Springs
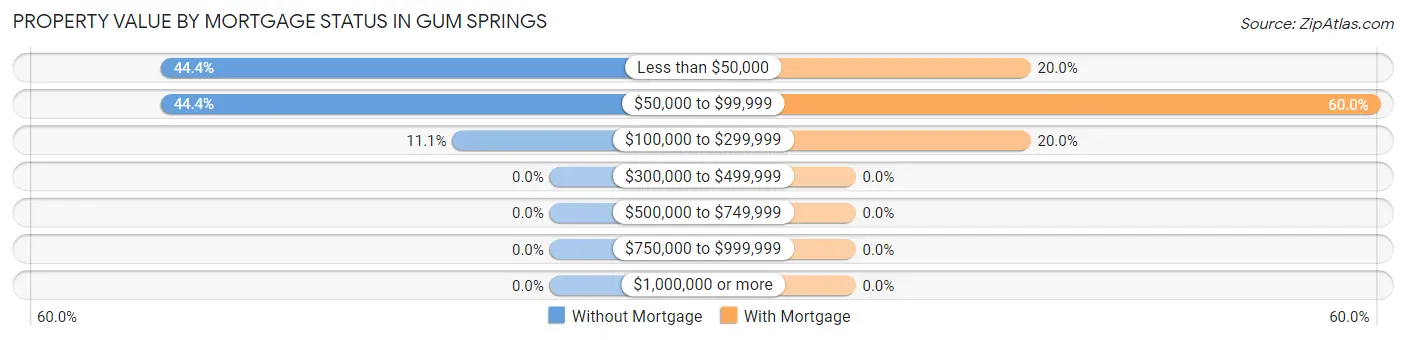
| Property Value | Without Mortgage | With Mortgage |
| Less than $50,000 | 8 (44.4%) | 1 (20.0%) |
| $50,000 to $99,999 | 8 (44.4%) | 3 (60.0%) |
| $100,000 to $299,999 | 2 (11.1%) | 1 (20.0%) |
| $300,000 to $499,999 | 0 (0.0%) | 0 (0.0%) |
| $500,000 to $749,999 | 0 (0.0%) | 0 (0.0%) |
| $750,000 to $999,999 | 0 (0.0%) | 0 (0.0%) |
| $1,000,000 or more | 0 (0.0%) | 0 (0.0%) |
| Total | 18 (100.0%) | 5 (100.0%) |
Household Income by Mortgage Status in Gum Springs
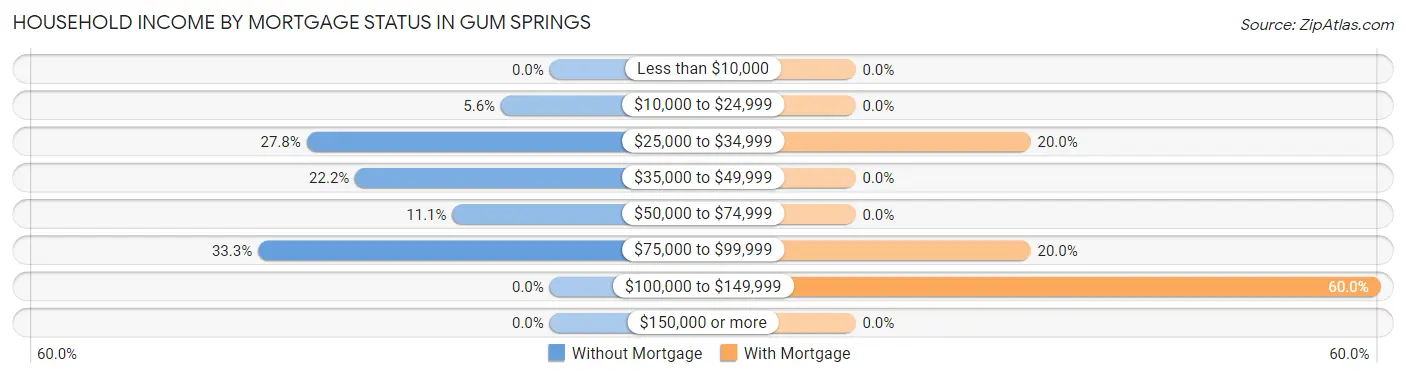
| Household Income | Without Mortgage | With Mortgage |
| Less than $10,000 | 0 (0.0%) | 0 (0.0%) |
| $10,000 to $24,999 | 1 (5.6%) | 0 (0.0%) |
| $25,000 to $34,999 | 5 (27.8%) | 1 (20.0%) |
| $35,000 to $49,999 | 4 (22.2%) | 0 (0.0%) |
| $50,000 to $74,999 | 2 (11.1%) | 0 (0.0%) |
| $75,000 to $99,999 | 6 (33.3%) | 1 (20.0%) |
| $100,000 to $149,999 | 0 (0.0%) | 3 (60.0%) |
| $150,000 or more | 0 (0.0%) | 0 (0.0%) |
| Total | 18 (100.0%) | 5 (100.0%) |
Property Value to Household Income Ratio in Gum Springs
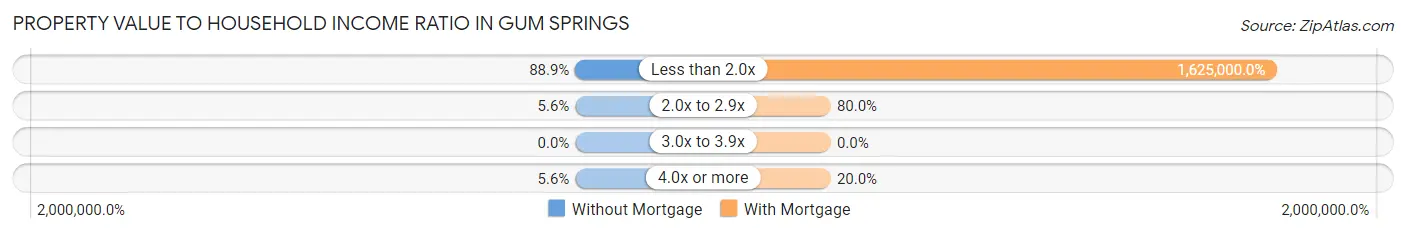
| Value-to-Income Ratio | Without Mortgage | With Mortgage |
| Less than 2.0x | 16 (88.9%) | 81,250 (1,625,000.0%) |
| 2.0x to 2.9x | 1 (5.6%) | 4 (80.0%) |
| 3.0x to 3.9x | 0 (0.0%) | 0 (0.0%) |
| 4.0x or more | 1 (5.6%) | 1 (20.0%) |
| Total | 18 (100.0%) | 5 (100.0%) |
Real Estate Taxes by Mortgage Status in Gum Springs
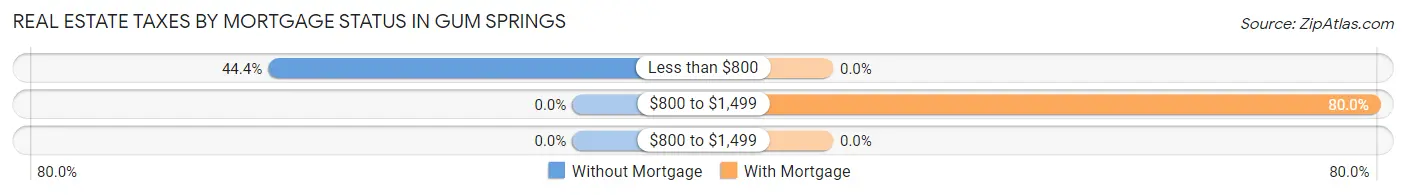
| Property Taxes | Without Mortgage | With Mortgage |
| Less than $800 | 8 (44.4%) | 0 (0.0%) |
| $800 to $1,499 | 0 (0.0%) | 4 (80.0%) |
| $800 to $1,499 | 0 (0.0%) | 0 (0.0%) |
| Total | 18 (100.0%) | 5 (100.0%) |
Health & Disability in Gum Springs
Health Insurance Coverage by Age in Gum Springs
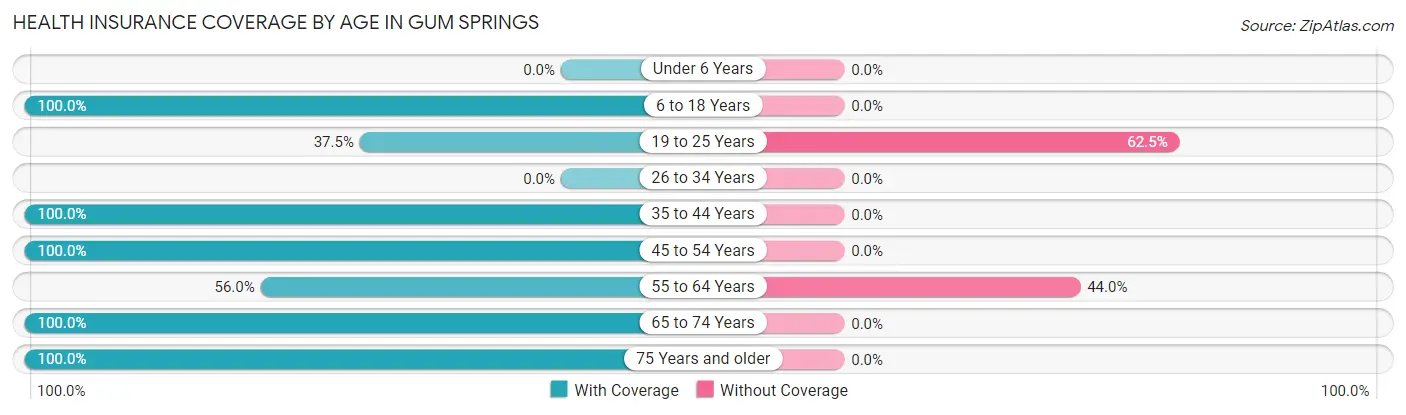
| Age Bracket | With Coverage | Without Coverage |
| Under 6 Years | 0 (0.0%) | 0 (0.0%) |
| 6 to 18 Years | 17 (100.0%) | 0 (0.0%) |
| 19 to 25 Years | 3 (37.5%) | 5 (62.5%) |
| 26 to 34 Years | 0 (0.0%) | 0 (0.0%) |
| 35 to 44 Years | 8 (100.0%) | 0 (0.0%) |
| 45 to 54 Years | 13 (100.0%) | 0 (0.0%) |
| 55 to 64 Years | 14 (56.0%) | 11 (44.0%) |
| 65 to 74 Years | 8 (100.0%) | 0 (0.0%) |
| 75 Years and older | 5 (100.0%) | 0 (0.0%) |
| Total | 68 (80.9%) | 16 (19.1%) |
Health Insurance Coverage by Citizenship Status in Gum Springs
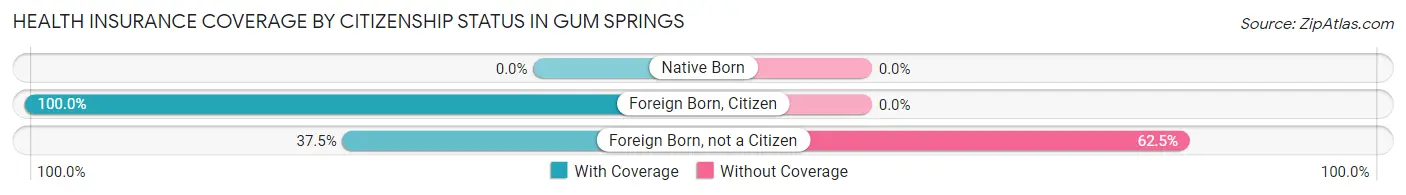
| Citizenship Status | With Coverage | Without Coverage |
| Native Born | 0 (0.0%) | 0 (0.0%) |
| Foreign Born, Citizen | 17 (100.0%) | 0 (0.0%) |
| Foreign Born, not a Citizen | 3 (37.5%) | 5 (62.5%) |
Health Insurance Coverage by Household Income in Gum Springs
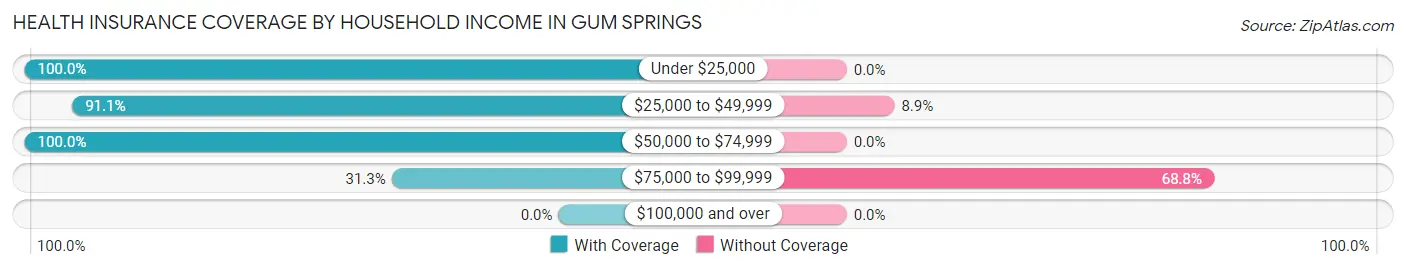
| Household Income | With Coverage | Without Coverage |
| Under $25,000 | 4 (100.0%) | 0 (0.0%) |
| $25,000 to $49,999 | 51 (91.1%) | 5 (8.9%) |
| $50,000 to $74,999 | 8 (100.0%) | 0 (0.0%) |
| $75,000 to $99,999 | 5 (31.2%) | 11 (68.8%) |
| $100,000 and over | 0 (0.0%) | 0 (0.0%) |
Public vs Private Health Insurance Coverage by Age in Gum Springs
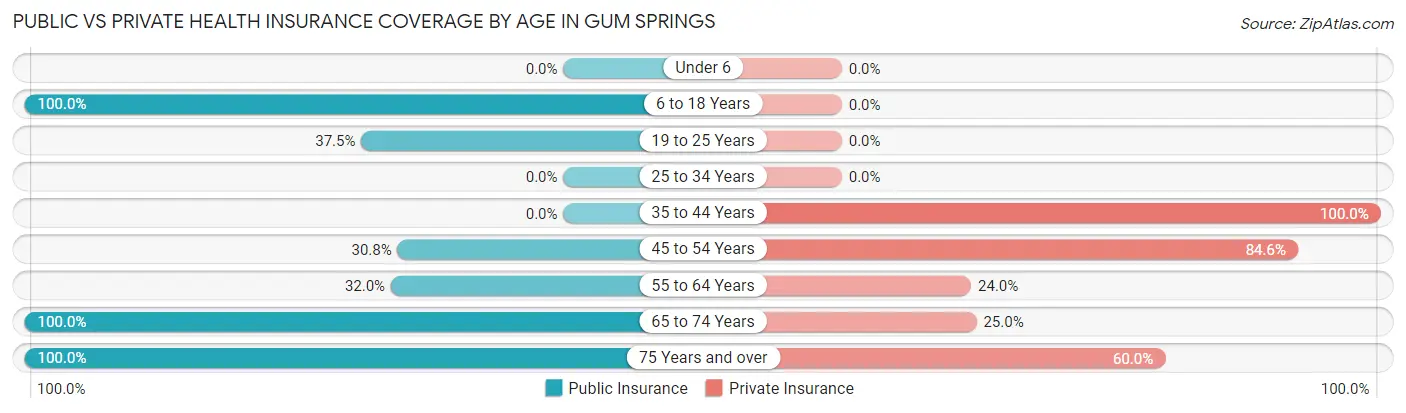
| Age Bracket | Public Insurance | Private Insurance |
| Under 6 | 0 (0.0%) | 0 (0.0%) |
| 6 to 18 Years | 17 (100.0%) | 0 (0.0%) |
| 19 to 25 Years | 3 (37.5%) | 0 (0.0%) |
| 25 to 34 Years | 0 (0.0%) | 0 (0.0%) |
| 35 to 44 Years | 0 (0.0%) | 8 (100.0%) |
| 45 to 54 Years | 4 (30.8%) | 11 (84.6%) |
| 55 to 64 Years | 8 (32.0%) | 6 (24.0%) |
| 65 to 74 Years | 8 (100.0%) | 2 (25.0%) |
| 75 Years and over | 5 (100.0%) | 3 (60.0%) |
| Total | 45 (53.6%) | 30 (35.7%) |
Disability Status by Sex by Age in Gum Springs
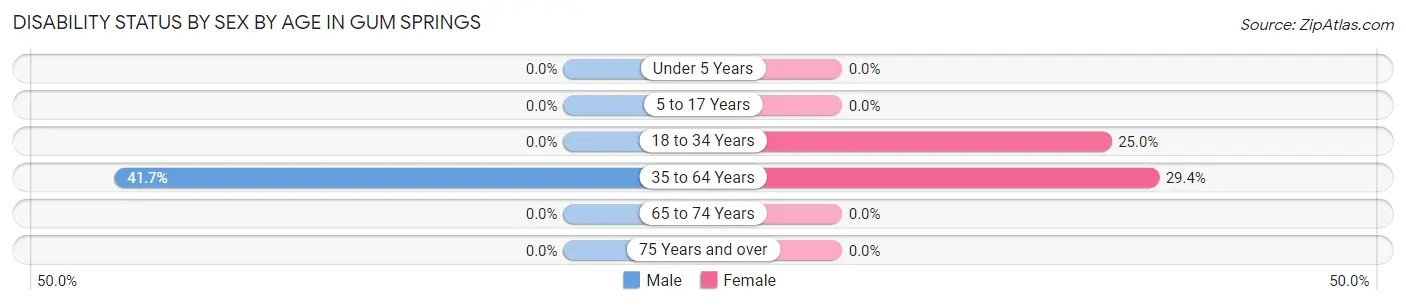
| Age Bracket | Male | Female |
| Under 5 Years | 0 (0.0%) | 0 (0.0%) |
| 5 to 17 Years | 0 (0.0%) | 0 (0.0%) |
| 18 to 34 Years | 0 (0.0%) | 3 (25.0%) |
| 35 to 64 Years | 5 (41.7%) | 10 (29.4%) |
| 65 to 74 Years | 0 (0.0%) | 0 (0.0%) |
| 75 Years and over | 0 (0.0%) | 0 (0.0%) |
Disability Class by Sex by Age in Gum Springs
Disability Class: Hearing Difficulty
| Age Bracket | Male | Female |
| Under 5 Years | 0 (0.0%) | 0 (0.0%) |
| 5 to 17 Years | 0 (0.0%) | 0 (0.0%) |
| 18 to 34 Years | 0 (0.0%) | 0 (0.0%) |
| 35 to 64 Years | 0 (0.0%) | 0 (0.0%) |
| 65 to 74 Years | 0 (0.0%) | 0 (0.0%) |
| 75 Years and over | 0 (0.0%) | 0 (0.0%) |
Disability Class: Vision Difficulty
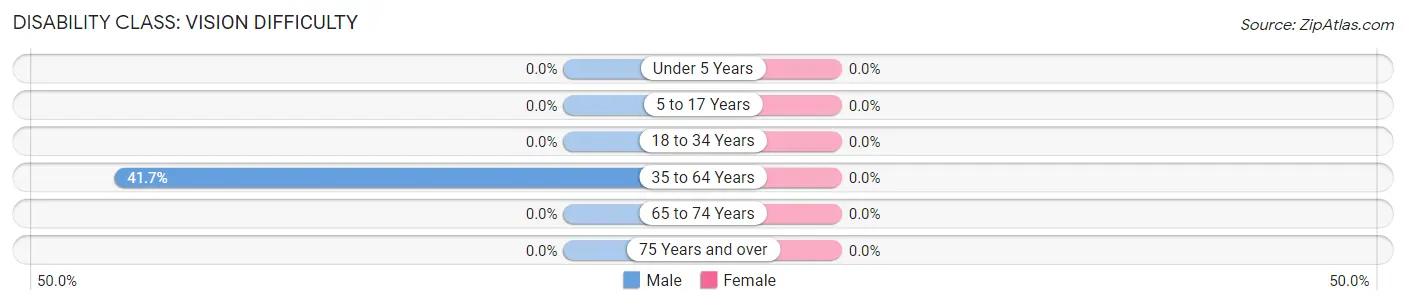
| Age Bracket | Male | Female |
| Under 5 Years | 0 (0.0%) | 0 (0.0%) |
| 5 to 17 Years | 0 (0.0%) | 0 (0.0%) |
| 18 to 34 Years | 0 (0.0%) | 0 (0.0%) |
| 35 to 64 Years | 5 (41.7%) | 0 (0.0%) |
| 65 to 74 Years | 0 (0.0%) | 0 (0.0%) |
| 75 Years and over | 0 (0.0%) | 0 (0.0%) |
Disability Class: Cognitive Difficulty
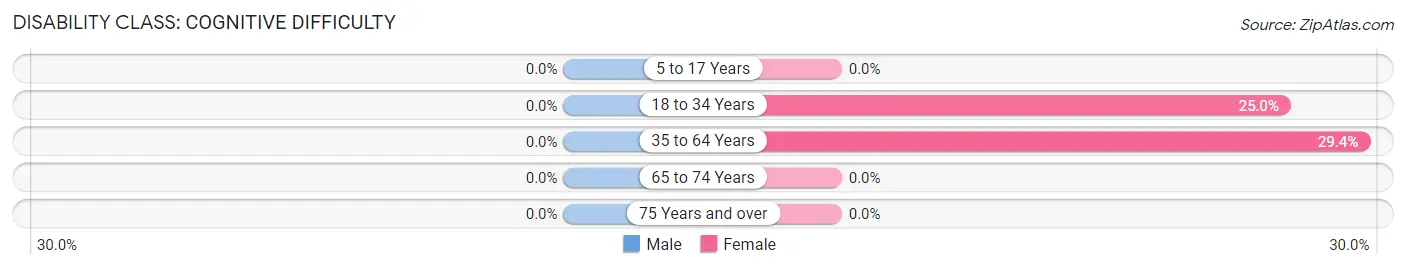
| Age Bracket | Male | Female |
| 5 to 17 Years | 0 (0.0%) | 0 (0.0%) |
| 18 to 34 Years | 0 (0.0%) | 3 (25.0%) |
| 35 to 64 Years | 0 (0.0%) | 10 (29.4%) |
| 65 to 74 Years | 0 (0.0%) | 0 (0.0%) |
| 75 Years and over | 0 (0.0%) | 0 (0.0%) |
Disability Class: Ambulatory Difficulty
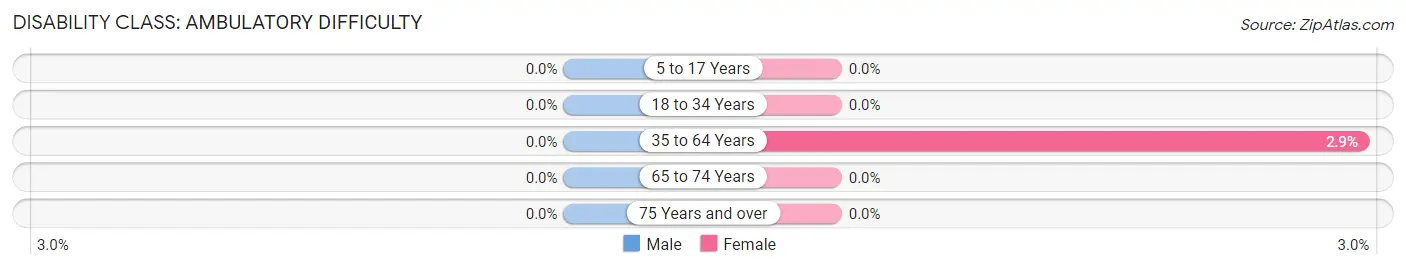
| Age Bracket | Male | Female |
| 5 to 17 Years | 0 (0.0%) | 0 (0.0%) |
| 18 to 34 Years | 0 (0.0%) | 0 (0.0%) |
| 35 to 64 Years | 0 (0.0%) | 1 (2.9%) |
| 65 to 74 Years | 0 (0.0%) | 0 (0.0%) |
| 75 Years and over | 0 (0.0%) | 0 (0.0%) |
Disability Class: Self-Care Difficulty
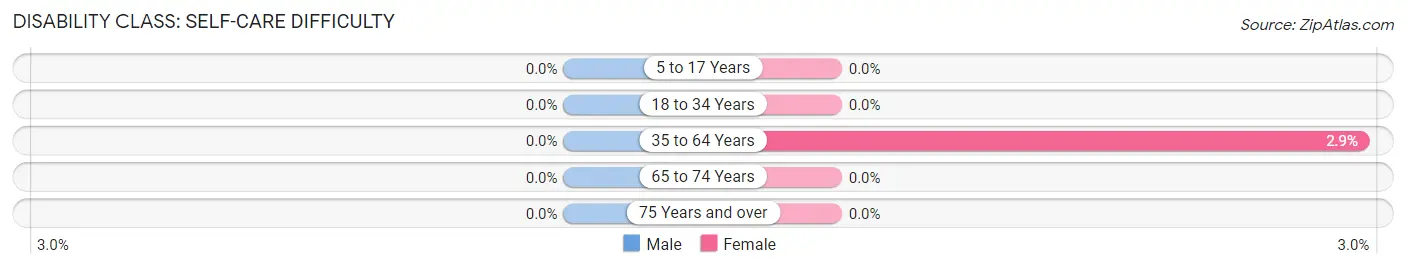
| Age Bracket | Male | Female |
| 5 to 17 Years | 0 (0.0%) | 0 (0.0%) |
| 18 to 34 Years | 0 (0.0%) | 0 (0.0%) |
| 35 to 64 Years | 0 (0.0%) | 1 (2.9%) |
| 65 to 74 Years | 0 (0.0%) | 0 (0.0%) |
| 75 Years and over | 0 (0.0%) | 0 (0.0%) |
Technology Access in Gum Springs
Computing Device Access in Gum Springs
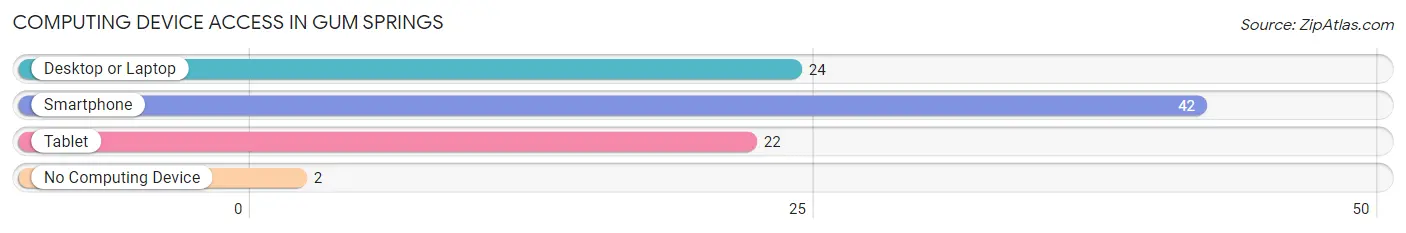
| Device Type | # Households | % Households |
| Desktop or Laptop | 24 | 49.0% |
| Smartphone | 42 | 85.7% |
| Tablet | 22 | 44.9% |
| No Computing Device | 2 | 4.1% |
| Total | 49 | 100.0% |
Internet Access in Gum Springs
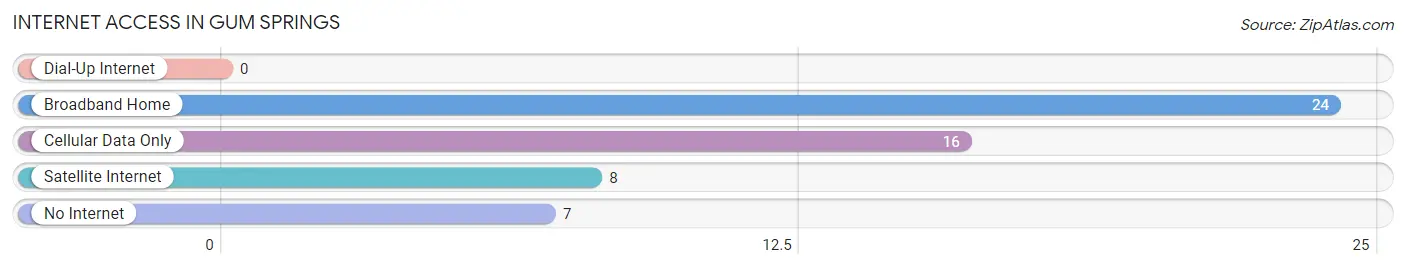
| Internet Type | # Households | % Households |
| Dial-Up Internet | 0 | 0.0% |
| Broadband Home | 24 | 49.0% |
| Cellular Data Only | 16 | 32.7% |
| Satellite Internet | 8 | 16.3% |
| No Internet | 7 | 14.3% |
| Total | 49 | 100.0% |
Gum Springs Summary
Gum Springs is an unincorporated community located in the Ozark Mountains of Arkansas. It is situated in the northwest corner of the state, in Madison County, and is approximately 10 miles south of the Arkansas-Missouri border. The community is located along the banks of the White River, and is home to a population of approximately 500 people.
History
Gum Springs was first settled in the early 1800s by a group of settlers from Tennessee. The settlers were attracted to the area due to its abundance of natural resources, including timber, game, and fish. The community was named after a nearby spring that was known for its sweet-tasting water.
In the late 1800s, the community began to grow and develop. A post office was established in 1883, and a school was built in 1885. The school was later replaced by a larger building in 1910.
In the early 1900s, the community began to experience a period of growth and prosperity. The population increased, and businesses began to open. A cotton gin, a grist mill, and a sawmill were all established in the area.
Geography
Gum Springs is located in the Ozark Mountains of Arkansas. The community is situated in the northwest corner of the state, in Madison County. It is approximately 10 miles south of the Arkansas-Missouri border.
The community is located along the banks of the White River. The river is a major tributary of the Mississippi River, and is a popular destination for fishing and boating.
The area is characterized by rolling hills and dense forests. The climate is humid and subtropical, with hot summers and mild winters.
Economy
Gum Springs is a rural community with a primarily agricultural economy. The area is known for its production of cotton, soybeans, and corn. The community also has a thriving timber industry, and is home to several sawmills.
In addition to agriculture and timber, the community is home to several small businesses. These include a general store, a gas station, and a restaurant.
Demographics
Gum Springs is home to a population of approximately 500 people. The population is predominantly white, with a small minority of African Americans. The median household income is approximately $30,000, and the median age is 40.
The community is served by the Gum Springs School District, which includes a K-12 school. The school is known for its strong academic programs and its commitment to providing a quality education for all students.
Conclusion
Gum Springs is a small, rural community located in the Ozark Mountains of Arkansas. The community is known for its abundance of natural resources, and its economy is primarily based on agriculture and timber. The population is predominantly white, with a small minority of African Americans. The community is served by the Gum Springs School District, which is known for its strong academic programs and its commitment to providing a quality education for all students.
Common Questions
What is Per Capita Income in Gum Springs?
Per Capita income in Gum Springs is $25,833.
What is the Median Family Income in Gum Springs?
Median Family Income in Gum Springs is $48,750.
What is the Median Household income in Gum Springs?
Median Household Income in Gum Springs is $41,250.
What is Income or Wage Gap in Gum Springs?
Income or Wage Gap in Gum Springs is 21.1%.
Women in Gum Springs earn 78.9 cents for every dollar earned by a man.
What is Inequality or Gini Index in Gum Springs?
Inequality or Gini Index in Gum Springs is 0.22.
What is the Total Population of Gum Springs?
Total Population of Gum Springs is 84.
What is the Total Male Population of Gum Springs?
Total Male Population of Gum Springs is 24.
What is the Total Female Population of Gum Springs?
Total Female Population of Gum Springs is 60.
What is the Ratio of Males per 100 Females in Gum Springs?
There are 40.00 Males per 100 Females in Gum Springs.
What is the Ratio of Females per 100 Males in Gum Springs?
There are 250.00 Females per 100 Males in Gum Springs.
What is the Median Population Age in Gum Springs?
Median Population Age in Gum Springs is 47.9 Years.
What is the Average Family Size in Gum Springs
Average Family Size in Gum Springs is 2.6 People.
What is the Average Household Size in Gum Springs
Average Household Size in Gum Springs is 1.7 People.
How Large is the Labor Force in Gum Springs?
There are 43 People in the Labor Forcein in Gum Springs.
What is the Percentage of People in the Labor Force in Gum Springs?
60.6% of People are in the Labor Force in Gum Springs.
What is the Unemployment Rate in Gum Springs?
Unemployment Rate in Gum Springs is 11.6%.