Cities with the Highest Poverty Level in New Hampshire
RELATED REPORTS & OPTIONS
Highest Poverty
New Hampshire
Compare Cities
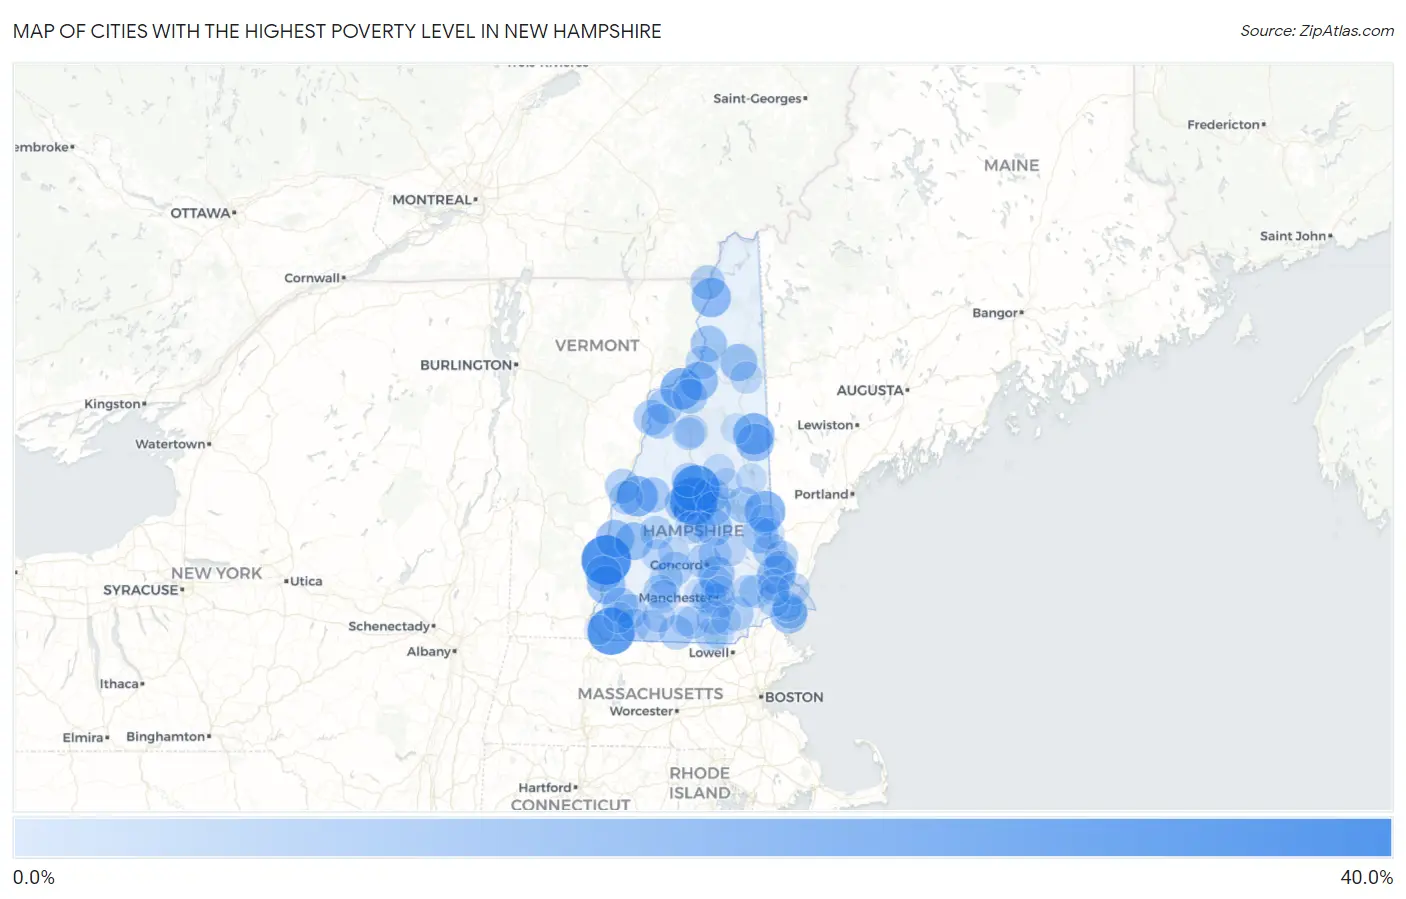
Map of Cities with the Highest Poverty Level in New Hampshire
0.0%
40.0%
Cities with the Highest Poverty Level in New Hampshire
| City | Poverty | vs State | vs National | |
| 1. | Charlestown | 37.0% | 7.3%(+29.7)#1 | 12.5%(+24.5)#2,053 |
| 2. | New Hampton | 33.3% | 7.3%(+26.0)#2 | 12.5%(+20.8)#2,650 |
| 3. | Winchester | 33.1% | 7.3%(+25.8)#3 | 12.5%(+20.6)#2,716 |
| 4. | Ashland | 32.5% | 7.3%(+25.2)#4 | 12.5%(+20.0)#2,832 |
| 5. | Littleton | 22.2% | 7.3%(+14.9)#5 | 12.5%(+9.68)#6,357 |
| 6. | North Conway | 21.8% | 7.3%(+14.5)#6 | 12.5%(+9.30)#6,564 |
| 7. | Sanbornville | 21.0% | 7.3%(+13.7)#7 | 12.5%(+8.47)#7,039 |
| 8. | Enfield | 20.6% | 7.3%(+13.3)#8 | 12.5%(+8.10)#7,259 |
| 9. | Colebrook | 18.5% | 7.3%(+11.1)#9 | 12.5%(+5.92)#8,656 |
| 10. | Walpole | 16.8% | 7.3%(+9.45)#10 | 12.5%(+4.24)#9,957 |
| 11. | Durham | 16.6% | 7.3%(+9.25)#11 | 12.5%(+4.04)#10,124 |
| 12. | Whitefield | 16.3% | 7.3%(+9.00)#12 | 12.5%(+3.79)#10,359 |
| 13. | Claremont | 15.9% | 7.3%(+8.52)#13 | 12.5%(+3.32)#10,738 |
| 14. | Conway | 15.8% | 7.3%(+8.45)#14 | 12.5%(+3.24)#10,800 |
| 15. | Newport | 15.1% | 7.3%(+7.80)#15 | 12.5%(+2.59)#11,439 |
| 16. | Berlin | 14.6% | 7.3%(+7.29)#16 | 12.5%(+2.08)#11,928 |
| 17. | Bristol | 14.4% | 7.3%(+7.10)#17 | 12.5%(+1.89)#12,103 |
| 18. | Seabrook Beach | 14.4% | 7.3%(+7.03)#18 | 12.5%(+1.82)#12,176 |
| 19. | Suncook | 14.0% | 7.3%(+6.67)#19 | 12.5%(+1.46)#12,517 |
| 20. | Belmont | 13.8% | 7.3%(+6.50)#20 | 12.5%(+1.29)#12,655 |
| 21. | Farmington | 13.6% | 7.3%(+6.30)#21 | 12.5%(+1.09)#12,870 |
| 22. | North Walpole | 12.9% | 7.3%(+5.58)#22 | 12.5%(+0.369)#13,610 |
| 23. | Groveton | 12.7% | 7.3%(+5.38)#23 | 12.5%(+0.175)#13,823 |
| 24. | Wolfeboro | 12.4% | 7.3%(+5.06)#24 | 12.5%(-0.145)#14,150 |
| 25. | Meredith | 11.7% | 7.3%(+4.34)#25 | 12.5%(-0.867)#14,958 |
| 26. | Manchester | 11.6% | 7.3%(+4.24)#26 | 12.5%(-0.974)#15,075 |
| 27. | Woodsville | 11.2% | 7.3%(+3.89)#27 | 12.5%(-1.32)#15,516 |
| 28. | Keene | 11.2% | 7.3%(+3.83)#28 | 12.5%(-1.38)#15,588 |
| 29. | Canaan | 11.0% | 7.3%(+3.66)#29 | 12.5%(-1.55)#15,805 |
| 30. | Lisbon | 10.9% | 7.3%(+3.54)#30 | 12.5%(-1.67)#15,972 |
| 31. | Bethlehem | 10.5% | 7.3%(+3.18)#31 | 12.5%(-2.03)#16,438 |
| 32. | Hanover | 10.5% | 7.3%(+3.14)#32 | 12.5%(-2.07)#16,490 |
| 33. | Mountain Lakes | 10.4% | 7.3%(+3.06)#33 | 12.5%(-2.15)#16,582 |
| 34. | Hampton Beach | 10.4% | 7.3%(+3.05)#34 | 12.5%(-2.16)#16,592 |
| 35. | Laconia | 10.2% | 7.3%(+2.87)#35 | 12.5%(-2.34)#16,820 |
| 36. | West Stewartstown | 9.9% | 7.3%(+2.53)#36 | 12.5%(-2.68)#17,259 |
| 37. | Derry | 9.9% | 7.3%(+2.53)#37 | 12.5%(-2.68)#17,264 |
| 38. | Rochester | 9.8% | 7.3%(+2.48)#38 | 12.5%(-2.73)#17,332 |
| 39. | Marlborough | 9.8% | 7.3%(+2.46)#39 | 12.5%(-2.75)#17,353 |
| 40. | Pinardville | 9.6% | 7.3%(+2.30)#40 | 12.5%(-2.91)#17,567 |
| 41. | Concord | 9.6% | 7.3%(+2.27)#41 | 12.5%(-2.94)#17,611 |
| 42. | Plymouth | 9.6% | 7.3%(+2.25)#42 | 12.5%(-2.95)#17,641 |
| 43. | Greenville | 9.4% | 7.3%(+2.10)#43 | 12.5%(-3.11)#17,826 |
| 44. | Henniker | 9.3% | 7.3%(+1.99)#44 | 12.5%(-3.22)#17,962 |
| 45. | East Merrimack | 8.8% | 7.3%(+1.47)#45 | 12.5%(-3.74)#18,659 |
| 46. | Somersworth | 8.7% | 7.3%(+1.34)#46 | 12.5%(-3.87)#18,863 |
| 47. | Lancaster | 8.6% | 7.3%(+1.29)#47 | 12.5%(-3.92)#18,929 |
| 48. | Lebanon | 8.4% | 7.3%(+1.12)#48 | 12.5%(-4.09)#19,171 |
| 49. | Epping | 8.3% | 7.3%(+0.954)#49 | 12.5%(-4.26)#19,383 |
| 50. | New London | 7.9% | 7.3%(+0.570)#50 | 12.5%(-4.64)#19,871 |
| 51. | New Boston | 7.8% | 7.3%(+0.480)#51 | 12.5%(-4.73)#20,006 |
| 52. | Hillsborough | 7.7% | 7.3%(+0.417)#52 | 12.5%(-4.79)#20,099 |
| 53. | Dover | 7.6% | 7.3%(+0.288)#53 | 12.5%(-4.92)#20,270 |
| 54. | Nashua | 7.6% | 7.3%(+0.266)#54 | 12.5%(-4.94)#20,308 |
| 55. | Milford | 7.6% | 7.3%(+0.258)#55 | 12.5%(-4.95)#20,316 |
| 56. | Antrim | 7.4% | 7.3%(+0.065)#56 | 12.5%(-5.14)#20,587 |
| 57. | Exeter | 7.4% | 7.3%(+0.032)#57 | 12.5%(-5.18)#20,638 |
| 58. | Bennington | 7.1% | 7.3%(-0.210)#58 | 12.5%(-5.42)#20,970 |
| 59. | Troy | 7.1% | 7.3%(-0.260)#59 | 12.5%(-5.47)#21,034 |
| 60. | Loudon | 7.0% | 7.3%(-0.291)#60 | 12.5%(-5.50)#21,081 |
| 61. | Lincoln | 6.9% | 7.3%(-0.442)#61 | 12.5%(-5.65)#21,309 |
| 62. | Jaffrey | 6.6% | 7.3%(-0.687)#62 | 12.5%(-5.90)#21,669 |
| 63. | North Woodstock | 6.6% | 7.3%(-0.746)#63 | 12.5%(-5.96)#21,752 |
| 64. | Hooksett | 6.4% | 7.3%(-0.912)#64 | 12.5%(-6.12)#21,989 |
| 65. | Peterborough | 6.4% | 7.3%(-0.924)#65 | 12.5%(-6.13)#22,006 |
| 66. | Raymond | 6.3% | 7.3%(-1.01)#66 | 12.5%(-6.22)#22,143 |
| 67. | Franklin | 6.3% | 7.3%(-1.07)#67 | 12.5%(-6.28)#22,220 |
| 68. | Newmarket | 6.1% | 7.3%(-1.24)#68 | 12.5%(-6.45)#22,490 |
| 69. | Pittsfield | 6.0% | 7.3%(-1.33)#69 | 12.5%(-6.54)#22,610 |
| 70. | Portsmouth | 6.0% | 7.3%(-1.35)#70 | 12.5%(-6.56)#22,654 |
| 71. | Gorham | 5.7% | 7.3%(-1.65)#71 | 12.5%(-6.86)#23,085 |
| 72. | Tilton Northfield | 5.4% | 7.3%(-1.88)#72 | 12.5%(-7.09)#23,416 |
| 73. | Center Sandwich | 5.2% | 7.3%(-2.09)#73 | 12.5%(-7.30)#23,753 |
| 74. | Bradford | 4.9% | 7.3%(-2.42)#74 | 12.5%(-7.63)#24,164 |
| 75. | Warner | 4.7% | 7.3%(-2.62)#75 | 12.5%(-7.83)#24,454 |
| 76. | Suissevale | 4.4% | 7.3%(-2.89)#76 | 12.5%(-8.10)#24,839 |
| 77. | Milton | 4.3% | 7.3%(-3.03)#77 | 12.5%(-8.24)#25,037 |
| 78. | West Swanzey | 3.9% | 7.3%(-3.41)#78 | 12.5%(-8.62)#25,551 |
| 79. | Union | 3.9% | 7.3%(-3.42)#79 | 12.5%(-8.63)#25,566 |
| 80. | Hampton | 3.8% | 7.3%(-3.51)#80 | 12.5%(-8.72)#25,671 |
| 81. | Hudson | 3.6% | 7.3%(-3.74)#81 | 12.5%(-8.95)#25,987 |
| 82. | Goffstown | 3.4% | 7.3%(-3.97)#82 | 12.5%(-9.17)#26,319 |
| 83. | Bartlett | 3.1% | 7.3%(-4.18)#83 | 12.5%(-9.39)#26,612 |
| 84. | Center Ossipee | 3.1% | 7.3%(-4.23)#84 | 12.5%(-9.44)#26,672 |
| 85. | South Hooksett | 3.0% | 7.3%(-4.33)#85 | 12.5%(-9.54)#26,786 |
| 86. | Newfields | 2.4% | 7.3%(-4.92)#86 | 12.5%(-10.1)#27,454 |
| 87. | Wilton | 2.3% | 7.3%(-5.00)#87 | 12.5%(-10.2)#27,547 |
| 88. | Hinsdale | 2.0% | 7.3%(-5.30)#88 | 12.5%(-10.5)#27,854 |
| 89. | Londonderry | 2.0% | 7.3%(-5.32)#89 | 12.5%(-10.5)#27,880 |
| 90. | Francestown | 1.6% | 7.3%(-5.77)#90 | 12.5%(-11.0)#28,267 |
| 91. | Klondike Corner | 1.5% | 7.3%(-5.83)#91 | 12.5%(-11.0)#28,318 |
1
Common Questions
What are the Top 10 Cities with the Highest Poverty Level in New Hampshire?
Top 10 Cities with the Highest Poverty Level in New Hampshire are:
#1
37.0%
#2
33.3%
#3
33.1%
#4
32.5%
#5
22.2%
#6
21.8%
#7
21.0%
#8
20.6%
#9
18.5%
#10
16.8%
What city has the Highest Poverty Level in New Hampshire?
Charlestown has the Highest Poverty Level in New Hampshire with 37.0%.
What is the Poverty Level in the State of New Hampshire?
Poverty Level in New Hampshire is 7.3%.
What is the Poverty Level in the United States?
Poverty Level in the United States is 12.5%.