New London, NH Map & Demographics
New London Map
New London Overview
$27,758
PER CAPITA INCOME
$116,979
AVG FAMILY INCOME
$83,796
AVG HOUSEHOLD INCOME
0.47
INEQUALITY / GINI INDEX
1,340
TOTAL POPULATION
543
MALE POPULATION
797
FEMALE POPULATION
68.13
MALES / 100 FEMALES
146.78
FEMALES / 100 MALES
21.7
MEDIAN AGE
2.7
AVG FAMILY SIZE
2.1
AVG HOUSEHOLD SIZE
384
LABOR FORCE [ PEOPLE ]
30.5%
PERCENT IN LABOR FORCE
0.8%
UNEMPLOYMENT RATE
New London Zip Codes
New London Area Codes
Income in New London
Income Overview in New London
Per Capita Income in New London is $27,758, while median incomes of families and households are $116,979 and $83,796 respectively.
| Characteristic | Number | Measure |
| Per Capita Income | 1,340 | $27,758 |
| Median Family Income | 163 | $116,979 |
| Mean Family Income | 163 | $127,320 |
| Median Household Income | 276 | $83,796 |
| Mean Household Income | 276 | $110,253 |
| Income Deficit | 163 | $0 |
| Wage / Income Gap (%) | 1,340 | 0.00% |
| Wage / Income Gap ($) | 1,340 | 100.00¢ per $1 |
| Gini / Inequality Index | 1,340 | 0.47 |
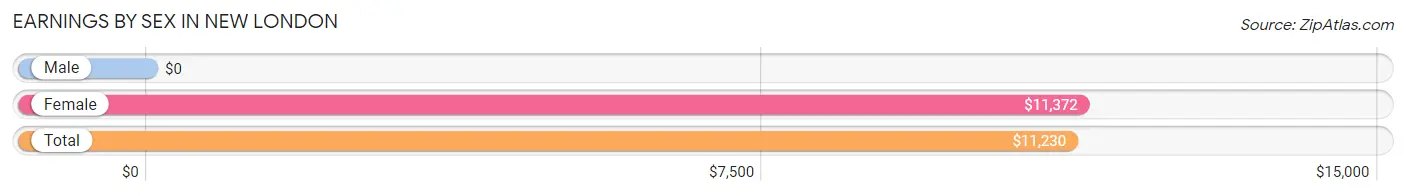
Earnings by Sex in New London
| Sex | Number | Average Earnings |
| Male | 294 (51.3%) | $0 |
| Female | 279 (48.7%) | $11,372 |
| Total | 573 (100.0%) | $11,230 |
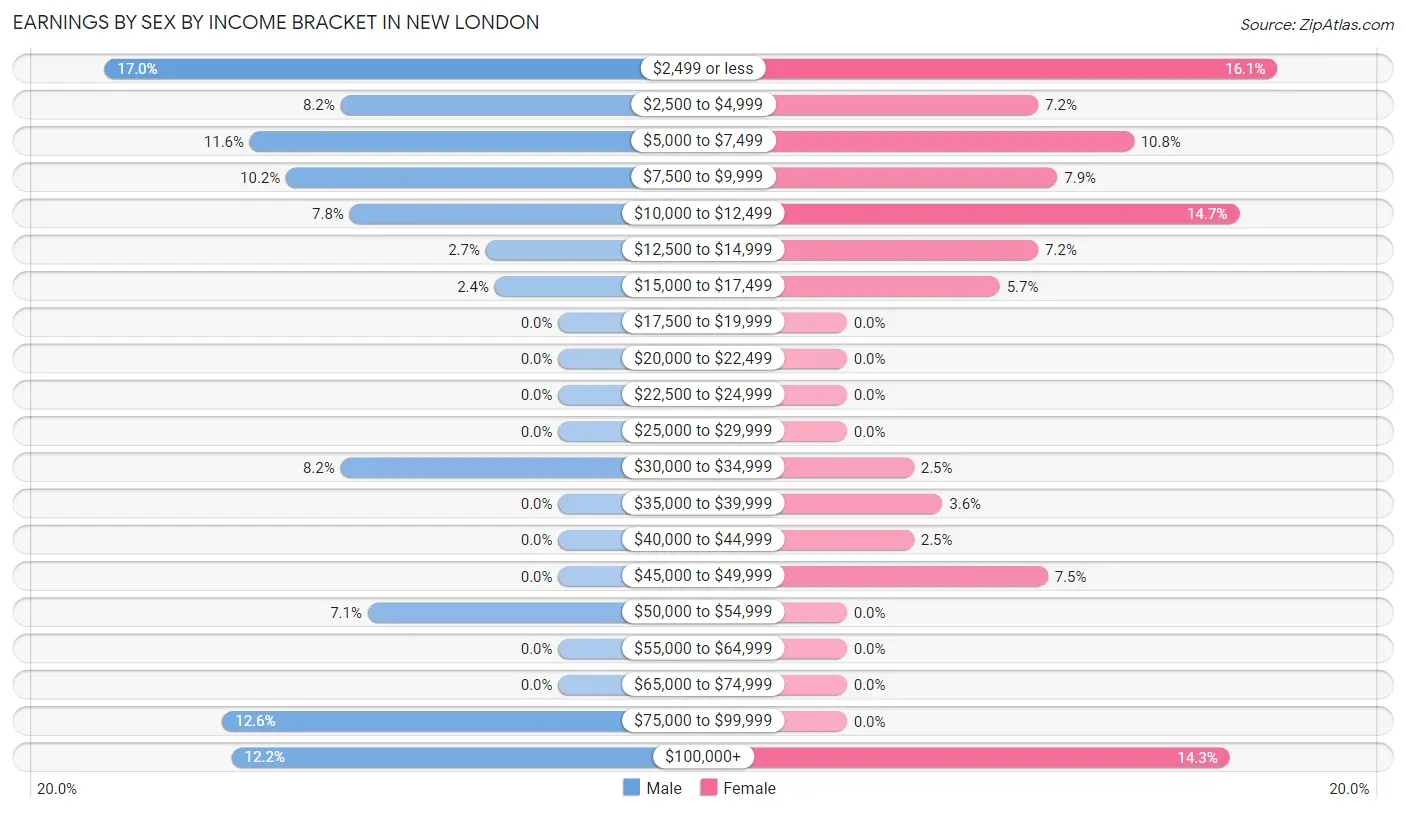
Earnings by Sex by Income Bracket in New London
The most common earnings brackets in New London are $2,499 or less for men (50 | 17.0%) and $2,499 or less for women (45 | 16.1%).
| Income | Male | Female |
| $2,499 or less | 50 (17.0%) | 45 (16.1%) |
| $2,500 to $4,999 | 24 (8.2%) | 20 (7.2%) |
| $5,000 to $7,499 | 34 (11.6%) | 30 (10.7%) |
| $7,500 to $9,999 | 30 (10.2%) | 22 (7.9%) |
| $10,000 to $12,499 | 23 (7.8%) | 41 (14.7%) |
| $12,500 to $14,999 | 8 (2.7%) | 20 (7.2%) |
| $15,000 to $17,499 | 7 (2.4%) | 16 (5.7%) |
| $17,500 to $19,999 | 0 (0.0%) | 0 (0.0%) |
| $20,000 to $22,499 | 0 (0.0%) | 0 (0.0%) |
| $22,500 to $24,999 | 0 (0.0%) | 0 (0.0%) |
| $25,000 to $29,999 | 0 (0.0%) | 0 (0.0%) |
| $30,000 to $34,999 | 24 (8.2%) | 7 (2.5%) |
| $35,000 to $39,999 | 0 (0.0%) | 10 (3.6%) |
| $40,000 to $44,999 | 0 (0.0%) | 7 (2.5%) |
| $45,000 to $49,999 | 0 (0.0%) | 21 (7.5%) |
| $50,000 to $54,999 | 21 (7.1%) | 0 (0.0%) |
| $55,000 to $64,999 | 0 (0.0%) | 0 (0.0%) |
| $65,000 to $74,999 | 0 (0.0%) | 0 (0.0%) |
| $75,000 to $99,999 | 37 (12.6%) | 0 (0.0%) |
| $100,000+ | 36 (12.2%) | 40 (14.3%) |
| Total | 294 (100.0%) | 279 (100.0%) |
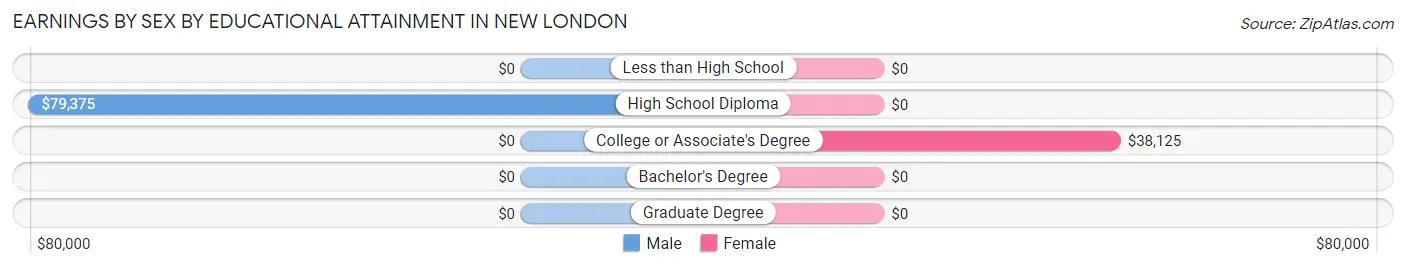
Earnings by Sex by Educational Attainment in New London
| Educational Attainment | Male Income | Female Income |
| Less than High School | - | - |
| High School Diploma | $79,375 | $0 |
| College or Associate's Degree | - | - |
| Bachelor's Degree | - | - |
| Graduate Degree | - | - |
| Total | $77,635 | $0 |
Family Income in New London
Family Income Brackets in New London
According to the New London family income data, there are 41 families falling into the $100,000 to $149,999 income range, which is the most common income bracket and makes up 25.2% of all families.
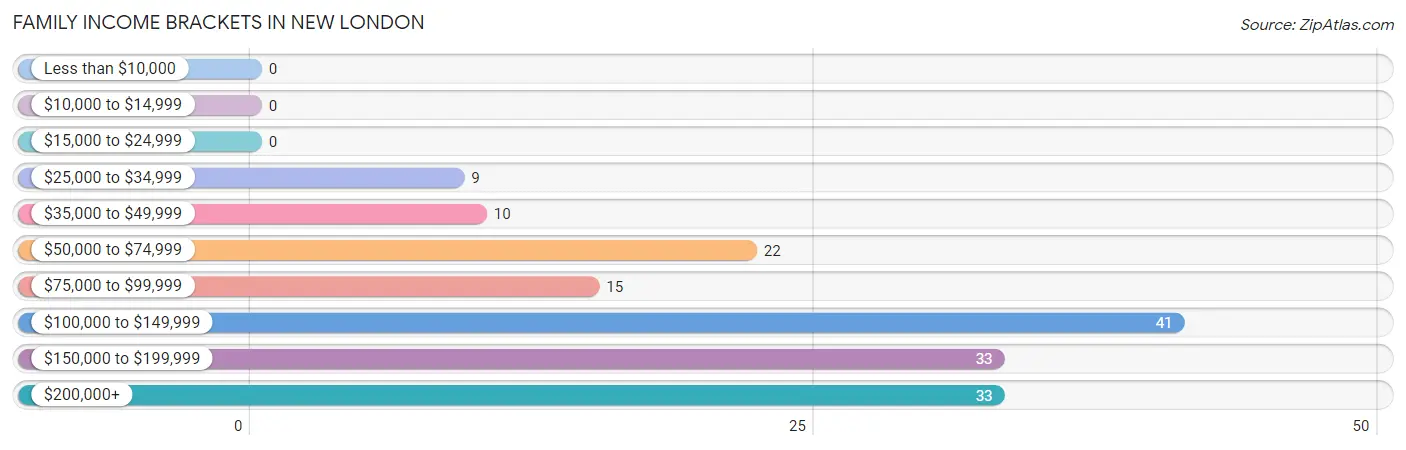
| Income Bracket | # Families | % Families |
| Less than $10,000 | 0 | 0.0% |
| $10,000 to $14,999 | 0 | 0.0% |
| $15,000 to $24,999 | 0 | 0.0% |
| $25,000 to $34,999 | 9 | 5.5% |
| $35,000 to $49,999 | 10 | 6.1% |
| $50,000 to $74,999 | 22 | 13.5% |
| $75,000 to $99,999 | 15 | 9.2% |
| $100,000 to $149,999 | 41 | 25.2% |
| $150,000 to $199,999 | 33 | 20.2% |
| $200,000+ | 33 | 20.2% |
Family Income by Famaliy Size in New London
2-person families (94 | 57.7%) account for the highest median family income in New London with $114,531 per family, while 2-person families (94 | 57.7%) have the highest median income of $57,266 per family member.
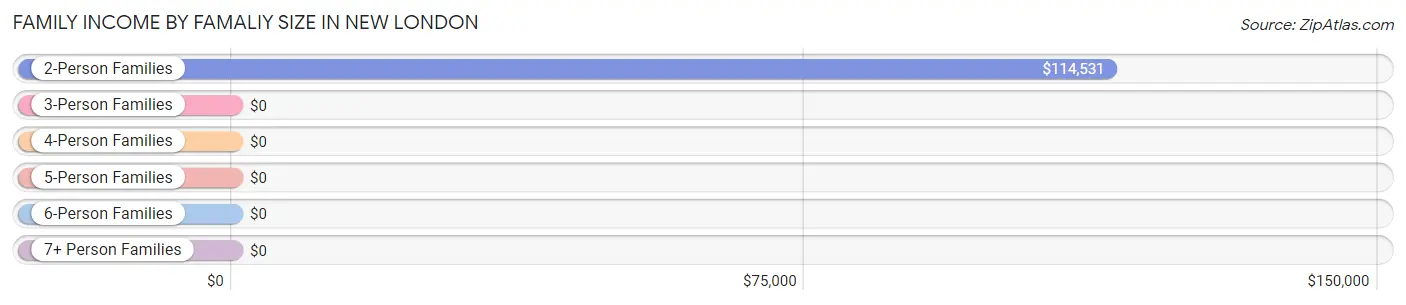
| Income Bracket | # Families | Median Income |
| 2-Person Families | 94 (57.7%) | $114,531 |
| 3-Person Families | 22 (13.5%) | $0 |
| 4-Person Families | 47 (28.8%) | $0 |
| 5-Person Families | 0 (0.0%) | $0 |
| 6-Person Families | 0 (0.0%) | $0 |
| 7+ Person Families | 0 (0.0%) | $0 |
| Total | 163 (100.0%) | $116,979 |
Family Income by Number of Earners in New London
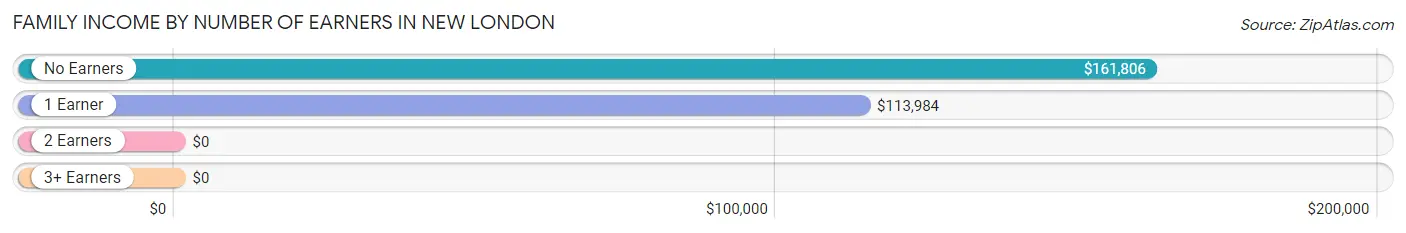
| Number of Earners | # Families | Median Income |
| No Earners | 61 (37.4%) | $161,806 |
| 1 Earner | 39 (23.9%) | $113,984 |
| 2 Earners | 35 (21.5%) | $0 |
| 3+ Earners | 28 (17.2%) | $0 |
| Total | 163 (100.0%) | $116,979 |
Household Income in New London
Household Income Brackets in New London
With 51 households falling in the category, the $200,000+ income range is the most frequent in New London, accounting for 18.5% of all households. In contrast, only 5 households (1.8%) fall into the $15,000 to $24,999 income bracket, making it the least populous group.
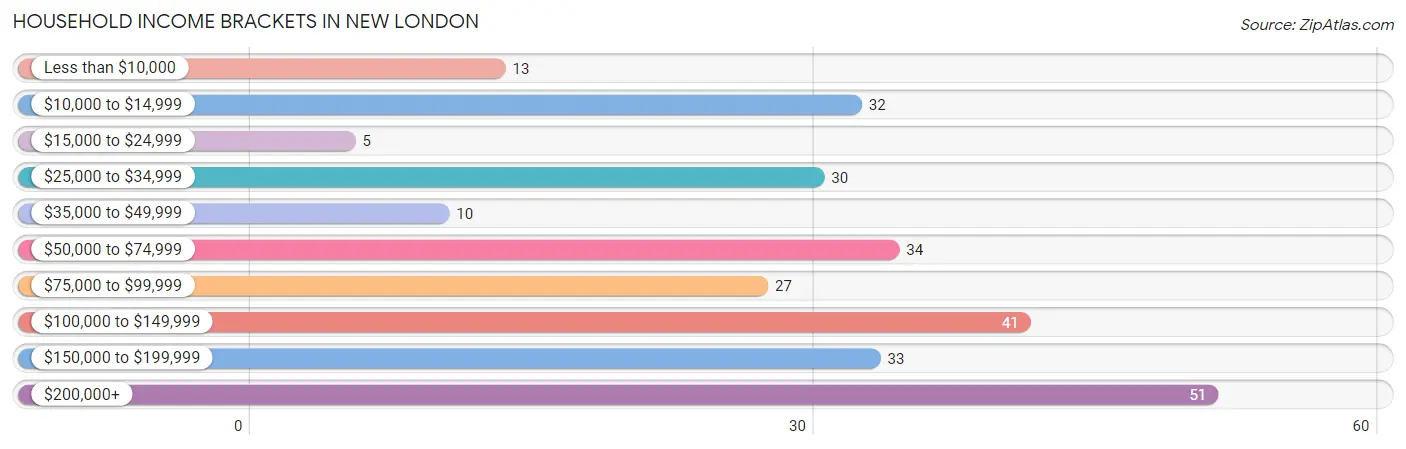
| Income Bracket | # Households | % Households |
| Less than $10,000 | 13 | 4.7% |
| $10,000 to $14,999 | 32 | 11.6% |
| $15,000 to $24,999 | 5 | 1.8% |
| $25,000 to $34,999 | 30 | 10.9% |
| $35,000 to $49,999 | 10 | 3.6% |
| $50,000 to $74,999 | 34 | 12.3% |
| $75,000 to $99,999 | 27 | 9.8% |
| $100,000 to $149,999 | 41 | 14.9% |
| $150,000 to $199,999 | 33 | 12.0% |
| $200,000+ | 51 | 18.5% |
Household Income by Householder Age in New London
The median household income in New London is $83,796, with the highest median household income of $83,472 found in the 65+ years age bracket for the primary householder. A total of 175 households (63.4%) fall into this category.
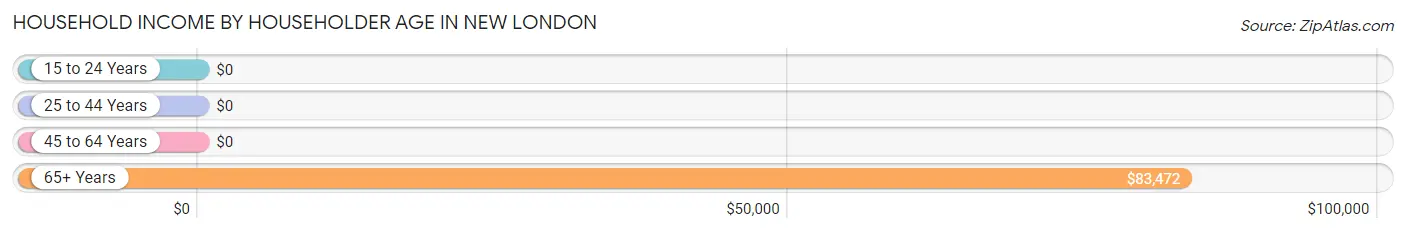
| Income Bracket | # Households | Median Income |
| 15 to 24 Years | 0 (0.0%) | $0 |
| 25 to 44 Years | 51 (18.5%) | $0 |
| 45 to 64 Years | 50 (18.1%) | $0 |
| 65+ Years | 175 (63.4%) | $83,472 |
| Total | 276 (100.0%) | $83,796 |
Poverty in New London
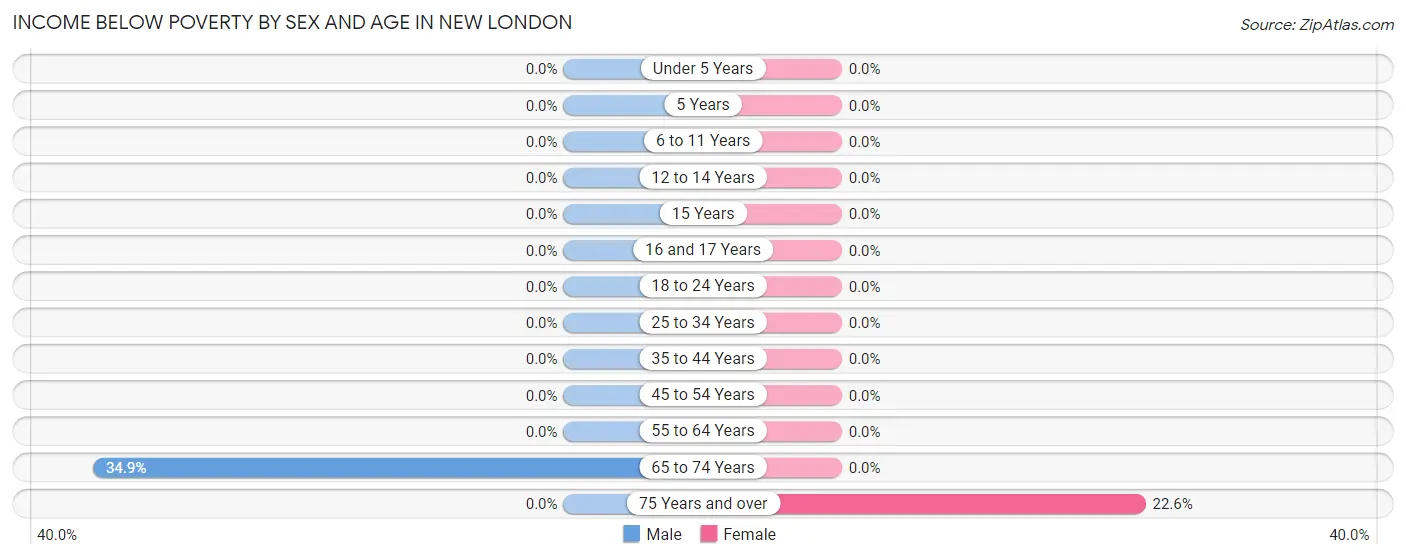
Income Below Poverty by Sex and Age in New London
With 8.1% poverty level for males and 7.7% for females among the residents of New London, 65 to 74 year old males and 75 year old and over females are the most vulnerable to poverty, with 22 males (34.9%) and 23 females (22.6%) in their respective age groups living below the poverty level.
| Age Bracket | Male | Female |
| Under 5 Years | 0 (0.0%) | 0 (0.0%) |
| 5 Years | 0 (0.0%) | 0 (0.0%) |
| 6 to 11 Years | 0 (0.0%) | 0 (0.0%) |
| 12 to 14 Years | 0 (0.0%) | 0 (0.0%) |
| 15 Years | 0 (0.0%) | 0 (0.0%) |
| 16 and 17 Years | 0 (0.0%) | 0 (0.0%) |
| 18 to 24 Years | 0 (0.0%) | 0 (0.0%) |
| 25 to 34 Years | 0 (0.0%) | 0 (0.0%) |
| 35 to 44 Years | 0 (0.0%) | 0 (0.0%) |
| 45 to 54 Years | 0 (0.0%) | 0 (0.0%) |
| 55 to 64 Years | 0 (0.0%) | 0 (0.0%) |
| 65 to 74 Years | 22 (34.9%) | 0 (0.0%) |
| 75 Years and over | 0 (0.0%) | 23 (22.6%) |
| Total | 22 (8.1%) | 23 (7.7%) |
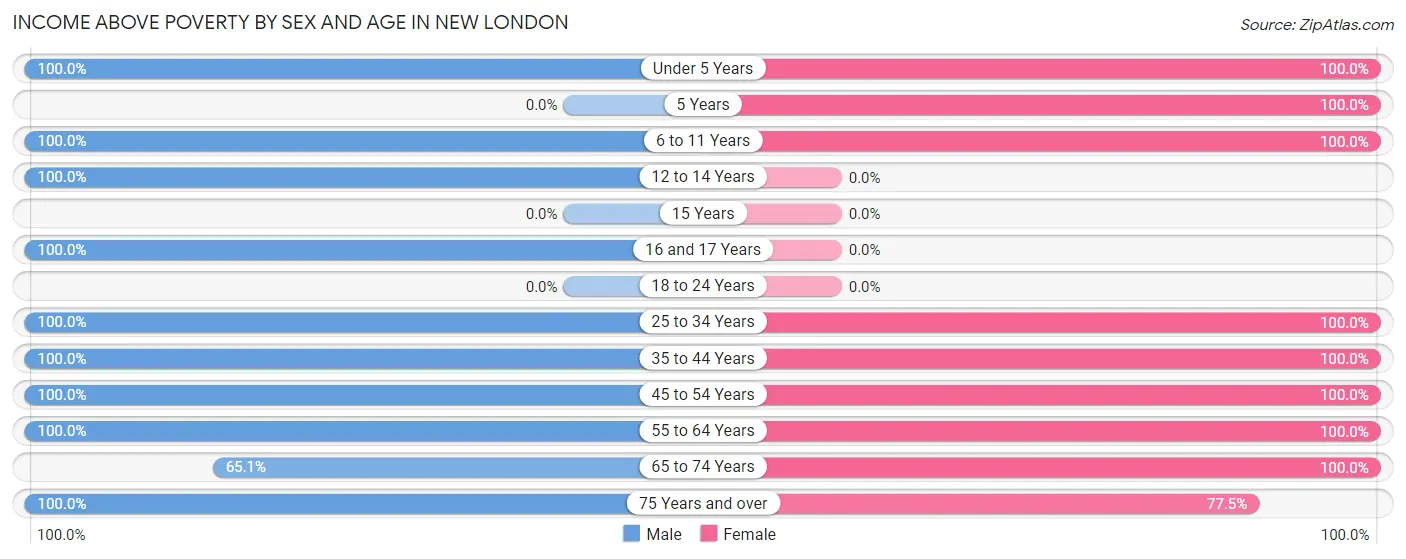
Income Above Poverty by Sex and Age in New London
According to the poverty statistics in New London, males aged under 5 years and females aged under 5 years are the age groups that are most secure financially, with 100.0% of males and 100.0% of females in these age groups living above the poverty line.
| Age Bracket | Male | Female |
| Under 5 Years | 13 (100.0%) | 12 (100.0%) |
| 5 Years | 0 (0.0%) | 8 (100.0%) |
| 6 to 11 Years | 13 (100.0%) | 24 (100.0%) |
| 12 to 14 Years | 10 (100.0%) | 0 (0.0%) |
| 15 Years | 0 (0.0%) | 0 (0.0%) |
| 16 and 17 Years | 29 (100.0%) | 0 (0.0%) |
| 18 to 24 Years | 0 (0.0%) | 0 (0.0%) |
| 25 to 34 Years | 50 (100.0%) | 22 (100.0%) |
| 35 to 44 Years | 26 (100.0%) | 16 (100.0%) |
| 45 to 54 Years | 7 (100.0%) | 29 (100.0%) |
| 55 to 64 Years | 22 (100.0%) | 15 (100.0%) |
| 65 to 74 Years | 41 (65.1%) | 69 (100.0%) |
| 75 Years and over | 40 (100.0%) | 79 (77.4%) |
| Total | 251 (91.9%) | 274 (92.3%) |
Income Below Poverty Among Married-Couple Families in New London
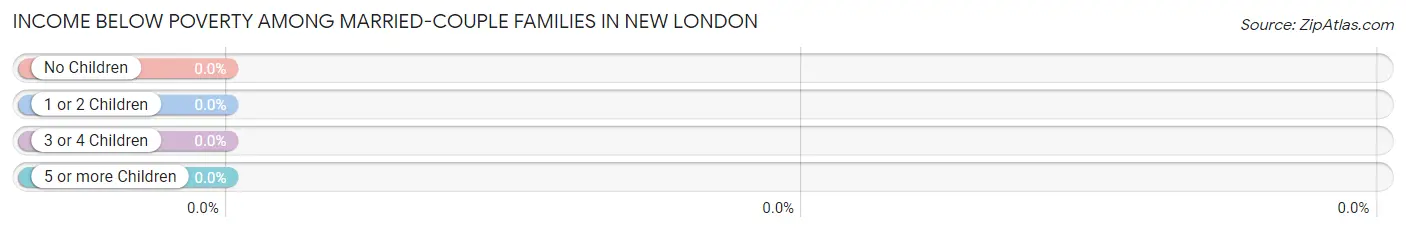
| Children | Above Poverty | Below Poverty |
| No Children | 75 (100.0%) | 0 (0.0%) |
| 1 or 2 Children | 63 (100.0%) | 0 (0.0%) |
| 3 or 4 Children | 0 (0.0%) | 0 (0.0%) |
| 5 or more Children | 0 (0.0%) | 0 (0.0%) |
| Total | 138 (100.0%) | 0 (0.0%) |
Income Below Poverty Among Single-Parent Households in New London
| Children | Single Father | Single Mother |
| No Children | 0 (0.0%) | 0 (0.0%) |
| 1 or 2 Children | 0 (0.0%) | 0 (0.0%) |
| 3 or 4 Children | 0 (0.0%) | 0 (0.0%) |
| 5 or more Children | 0 (0.0%) | 0 (0.0%) |
| Total | 0 (0.0%) | 0 (0.0%) |
Income Below Poverty Among Married-Couple vs Single-Parent Households in New London
| Children | Married-Couple Families | Single-Parent Households |
| No Children | 0 (0.0%) | 0 (0.0%) |
| 1 or 2 Children | 0 (0.0%) | 0 (0.0%) |
| 3 or 4 Children | 0 (0.0%) | 0 (0.0%) |
| 5 or more Children | 0 (0.0%) | 0 (0.0%) |
| Total | 0 (0.0%) | 0 (0.0%) |
Race in New London
The most populous races in New London are White / Caucasian (1,213 | 90.5%), Two or more Races (70 | 5.2%), and Hispanic or Latino (44 | 3.3%).
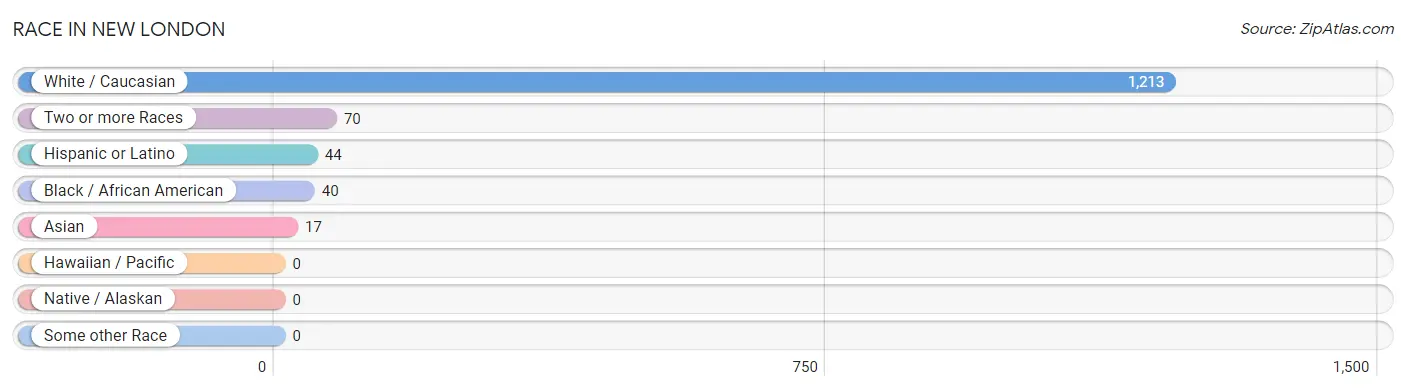
| Race | # Population | % Population |
| Asian | 17 | 1.3% |
| Black / African American | 40 | 3.0% |
| Hawaiian / Pacific | 0 | 0.0% |
| Hispanic or Latino | 44 | 3.3% |
| Native / Alaskan | 0 | 0.0% |
| White / Caucasian | 1,213 | 90.5% |
| Two or more Races | 70 | 5.2% |
| Some other Race | 0 | 0.0% |
| Total | 1,340 | 100.0% |
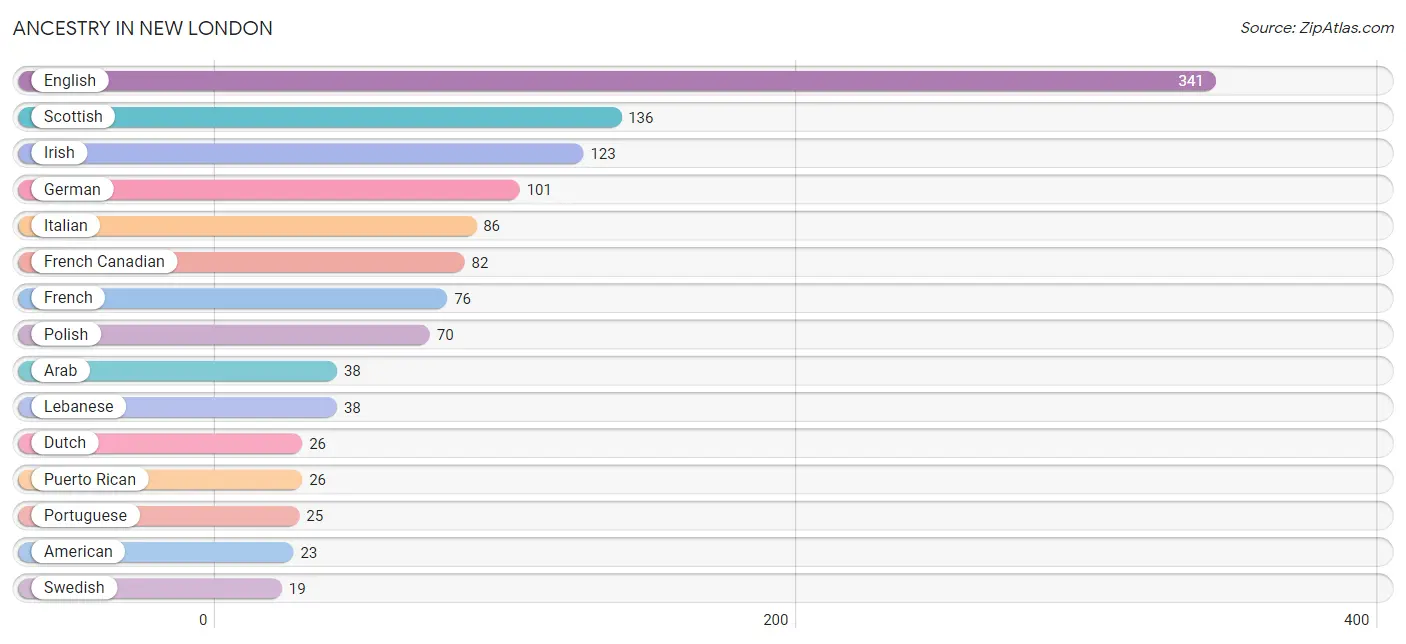
Ancestry in New London
The most populous ancestries reported in New London are English (341 | 25.5%), Scottish (136 | 10.2%), Irish (123 | 9.2%), German (101 | 7.5%), and Italian (86 | 6.4%), together accounting for 58.7% of all New London residents.
| Ancestry | # Population | % Population |
| American | 23 | 1.7% |
| Arab | 38 | 2.8% |
| Belgian | 18 | 1.3% |
| British | 18 | 1.3% |
| Celtic | 7 | 0.5% |
| Dominican | 9 | 0.7% |
| Dutch | 26 | 1.9% |
| English | 341 | 25.5% |
| European | 7 | 0.5% |
| French | 76 | 5.7% |
| French Canadian | 82 | 6.1% |
| German | 101 | 7.5% |
| Greek | 18 | 1.3% |
| Indian (Asian) | 12 | 0.9% |
| Irish | 123 | 9.2% |
| Italian | 86 | 6.4% |
| Lebanese | 38 | 2.8% |
| Norwegian | 16 | 1.2% |
| Polish | 70 | 5.2% |
| Portuguese | 25 | 1.9% |
| Puerto Rican | 26 | 1.9% |
| Scandinavian | 3 | 0.2% |
| Scottish | 136 | 10.2% |
| Slovak | 2 | 0.2% |
| Spaniard | 7 | 0.5% |
| Spanish | 2 | 0.2% |
| Subsaharan African | 7 | 0.5% |
| Swedish | 19 | 1.4% |
| Thai | 2 | 0.2% |
| Trinidadian and Tobagonian | 6 | 0.4% |
| Turkish | 3 | 0.2% |
| Welsh | 9 | 0.7% | View All 32 Rows |
Immigrants in New London
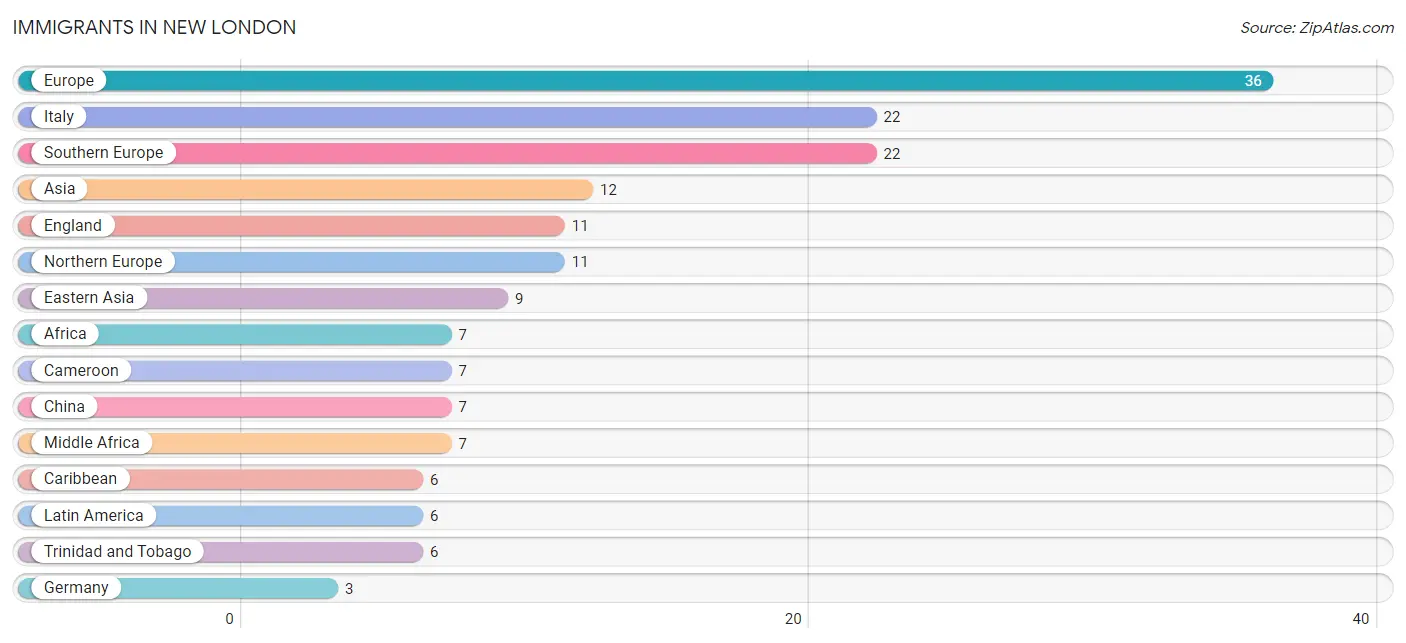
The most numerous immigrant groups reported in New London came from Europe (36 | 2.7%), Italy (22 | 1.6%), Southern Europe (22 | 1.6%), Asia (12 | 0.9%), and England (11 | 0.8%), together accounting for 7.7% of all New London residents.
| Immigration Origin | # Population | % Population |
| Africa | 7 | 0.5% |
| Asia | 12 | 0.9% |
| Cameroon | 7 | 0.5% |
| Caribbean | 6 | 0.4% |
| China | 7 | 0.5% |
| Eastern Asia | 9 | 0.7% |
| England | 11 | 0.8% |
| Europe | 36 | 2.7% |
| Germany | 3 | 0.2% |
| Italy | 22 | 1.6% |
| Korea | 2 | 0.2% |
| Latin America | 6 | 0.4% |
| Middle Africa | 7 | 0.5% |
| Nepal | 3 | 0.2% |
| Northern Europe | 11 | 0.8% |
| South Central Asia | 3 | 0.2% |
| Southern Europe | 22 | 1.6% |
| Trinidad and Tobago | 6 | 0.4% |
| Western Europe | 3 | 0.2% | View All 19 Rows |
Sex and Age in New London
Sex and Age in New London
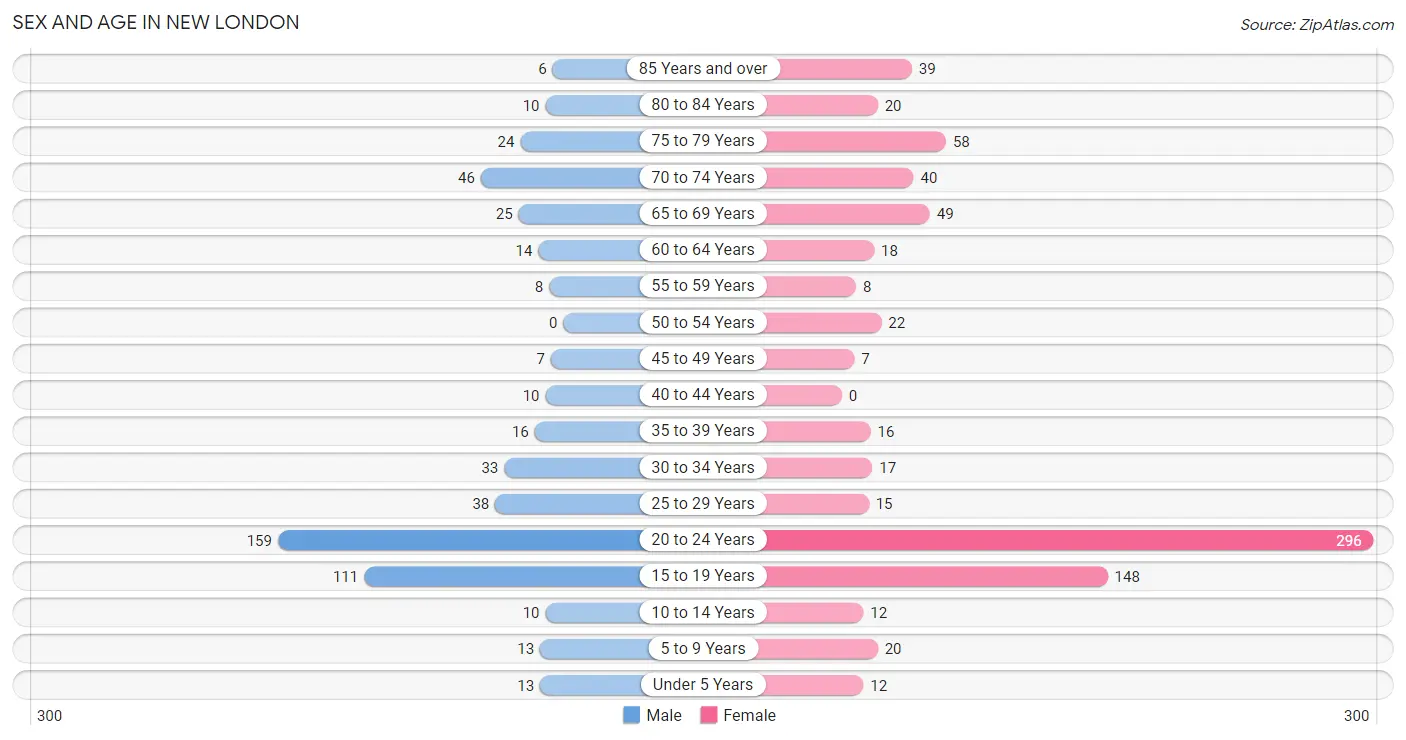
The most populous age groups in New London are 20 to 24 Years (159 | 29.3%) for men and 20 to 24 Years (296 | 37.1%) for women.
| Age Bracket | Male | Female |
| Under 5 Years | 13 (2.4%) | 12 (1.5%) |
| 5 to 9 Years | 13 (2.4%) | 20 (2.5%) |
| 10 to 14 Years | 10 (1.8%) | 12 (1.5%) |
| 15 to 19 Years | 111 (20.4%) | 148 (18.6%) |
| 20 to 24 Years | 159 (29.3%) | 296 (37.1%) |
| 25 to 29 Years | 38 (7.0%) | 15 (1.9%) |
| 30 to 34 Years | 33 (6.1%) | 17 (2.1%) |
| 35 to 39 Years | 16 (2.9%) | 16 (2.0%) |
| 40 to 44 Years | 10 (1.8%) | 0 (0.0%) |
| 45 to 49 Years | 7 (1.3%) | 7 (0.9%) |
| 50 to 54 Years | 0 (0.0%) | 22 (2.8%) |
| 55 to 59 Years | 8 (1.5%) | 8 (1.0%) |
| 60 to 64 Years | 14 (2.6%) | 18 (2.3%) |
| 65 to 69 Years | 25 (4.6%) | 49 (6.1%) |
| 70 to 74 Years | 46 (8.5%) | 40 (5.0%) |
| 75 to 79 Years | 24 (4.4%) | 58 (7.3%) |
| 80 to 84 Years | 10 (1.8%) | 20 (2.5%) |
| 85 Years and over | 6 (1.1%) | 39 (4.9%) |
| Total | 543 (100.0%) | 797 (100.0%) |
Families and Households in New London
Median Family Size in New London
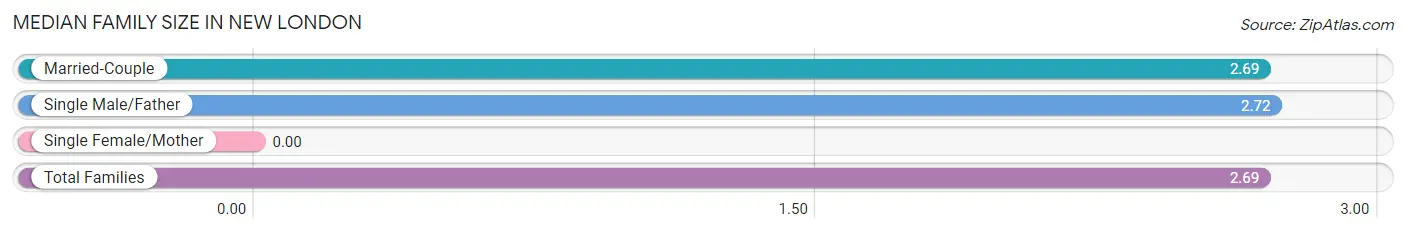
| Family Type | # Families | Family Size |
| Married-Couple | 138 (84.7%) | 2.69 |
| Single Male/Father | 25 (15.3%) | 2.72 |
| Single Female/Mother | 0 (0.0%) | - |
| Total Families | 163 (100.0%) | 2.69 |
Median Household Size in New London
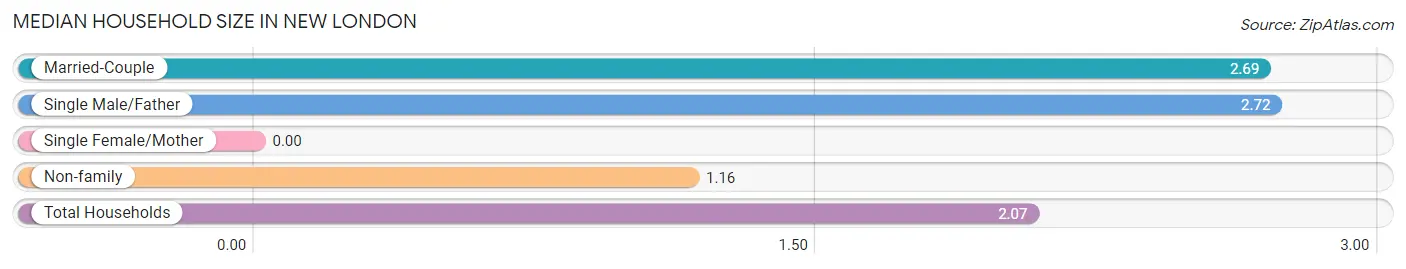
| Household Type | # Households | Household Size |
| Married-Couple | 138 (50.0%) | 2.69 |
| Single Male/Father | 25 (9.1%) | 2.72 |
| Single Female/Mother | 0 (0.0%) | - |
| Non-family | 113 (40.9%) | 1.16 |
| Total Households | 276 (100.0%) | 2.07 |
Household Size by Marriage Status in New London
Out of a total of 276 households in New London, 163 (59.1%) are family households, while 113 (40.9%) are nonfamily households. The most numerous type of family households are 2-person households, comprising 94, and the most common type of nonfamily households are 1-person households, comprising 95.
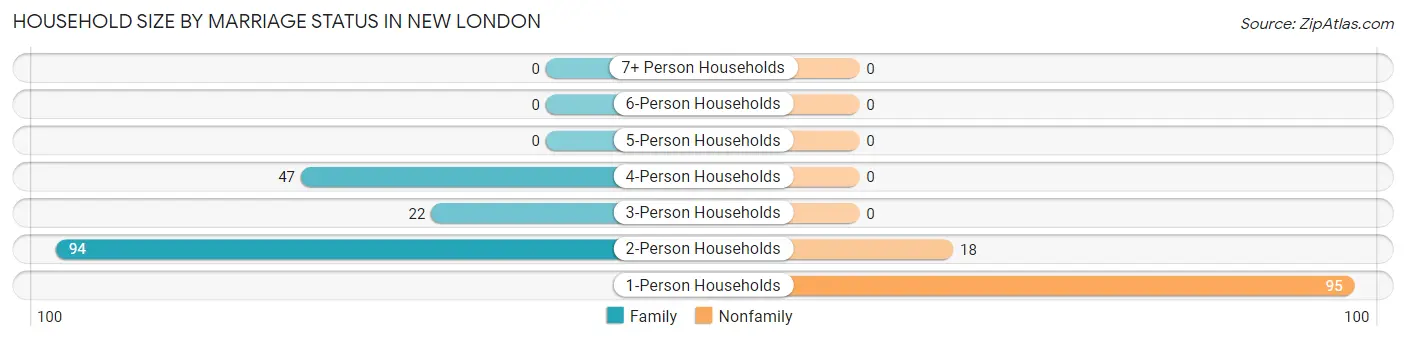
| Household Size | Family Households | Nonfamily Households |
| 1-Person Households | - | 95 (34.4%) |
| 2-Person Households | 94 (34.1%) | 18 (6.5%) |
| 3-Person Households | 22 (8.0%) | 0 (0.0%) |
| 4-Person Households | 47 (17.0%) | 0 (0.0%) |
| 5-Person Households | 0 (0.0%) | 0 (0.0%) |
| 6-Person Households | 0 (0.0%) | 0 (0.0%) |
| 7+ Person Households | 0 (0.0%) | 0 (0.0%) |
| Total | 163 (59.1%) | 113 (40.9%) |
Female Fertility in New London
Fertility by Age in New London
Average fertility rate in New London is 23.0 births per 1,000 women. Women in the age bracket of 20 to 34 years have the highest fertility rate with 37.0 births per 1,000 women. Women in the age bracket of 20 to 34 years acount for 100.0% of all women with births.
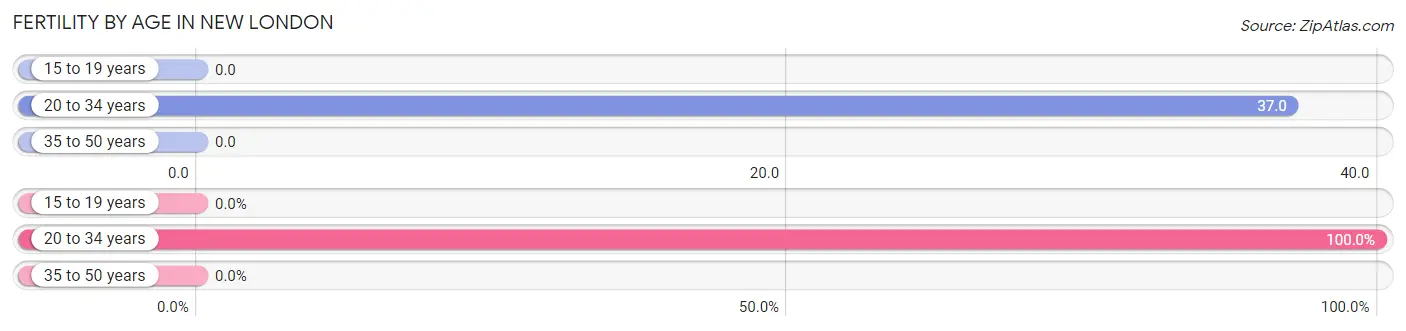
| Age Bracket | Women with Births | Births / 1,000 Women |
| 15 to 19 years | 0 (0.0%) | 0.0 |
| 20 to 34 years | 12 (100.0%) | 37.0 |
| 35 to 50 years | 0 (0.0%) | 0.0 |
| Total | 12 (100.0%) | 23.0 |
Fertility by Age by Marriage Status in New London
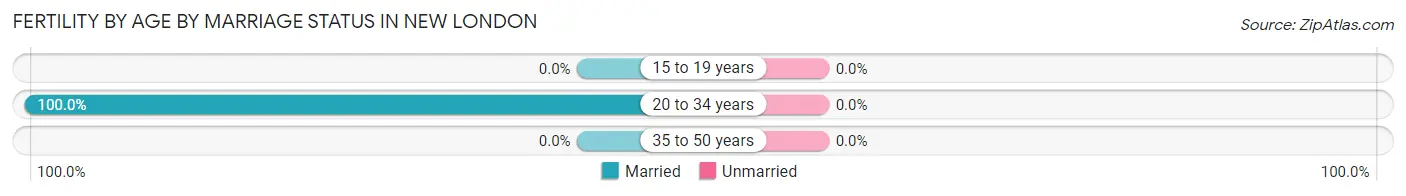
| Age Bracket | Married | Unmarried |
| 15 to 19 years | 0 (0.0%) | 0 (0.0%) |
| 20 to 34 years | 12 (100.0%) | 0 (0.0%) |
| 35 to 50 years | 0 (0.0%) | 0 (0.0%) |
| Total | 12 (100.0%) | 0 (0.0%) |
Fertility by Education in New London
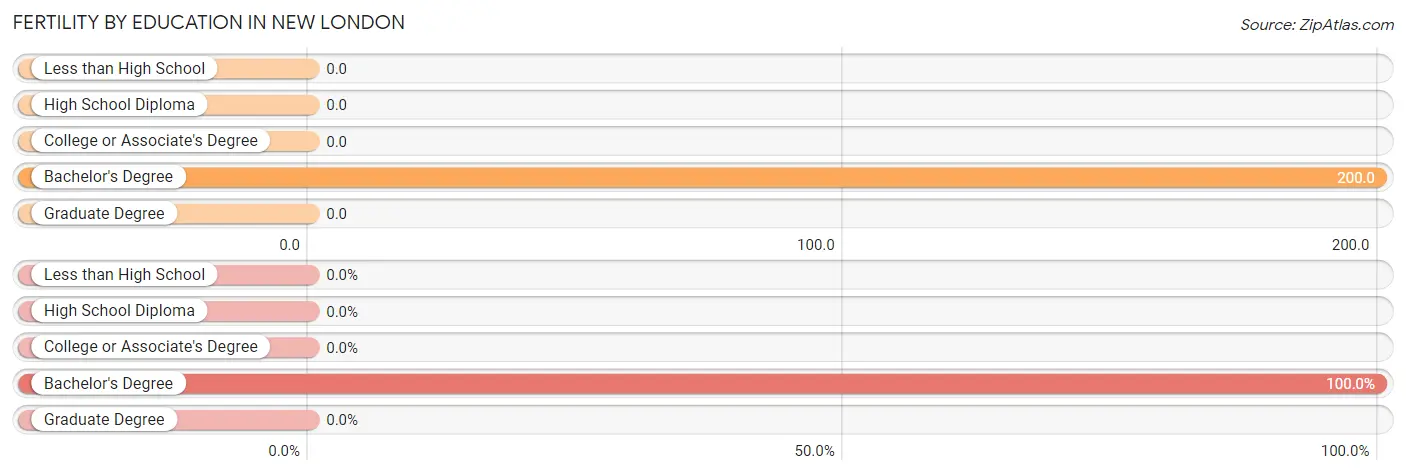
| Educational Attainment | Women with Births | Births / 1,000 Women |
| Less than High School | 0 (0.0%) | 0.0 |
| High School Diploma | 0 (0.0%) | 0.0 |
| College or Associate's Degree | 0 (0.0%) | 0.0 |
| Bachelor's Degree | 12 (100.0%) | 200.0 |
| Graduate Degree | 0 (0.0%) | 0.0 |
| Total | 12 (100.0%) | 23.0 |
Fertility by Education by Marriage Status in New London
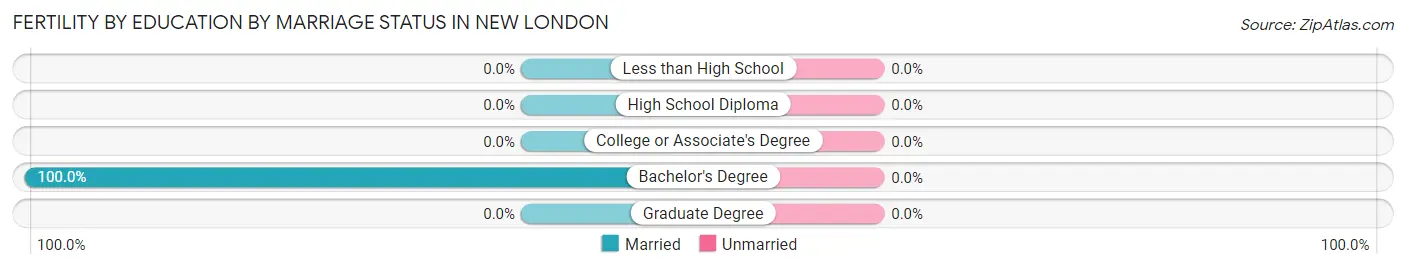
| Educational Attainment | Married | Unmarried |
| Less than High School | 0 (0.0%) | 0 (0.0%) |
| High School Diploma | 0 (0.0%) | 0 (0.0%) |
| College or Associate's Degree | 0 (0.0%) | 0 (0.0%) |
| Bachelor's Degree | 12 (100.0%) | 0 (0.0%) |
| Graduate Degree | 0 (0.0%) | 0 (0.0%) |
| Total | 12 (100.0%) | 0 (0.0%) |
Employment Characteristics in New London
Employment by Class of Employer in New London
Among the 376 employed individuals in New London, private company employees (230 | 61.2%), not-for-profit organizations (72 | 19.2%), and state government employees (30 | 8.0%) make up the most common classes of employment.
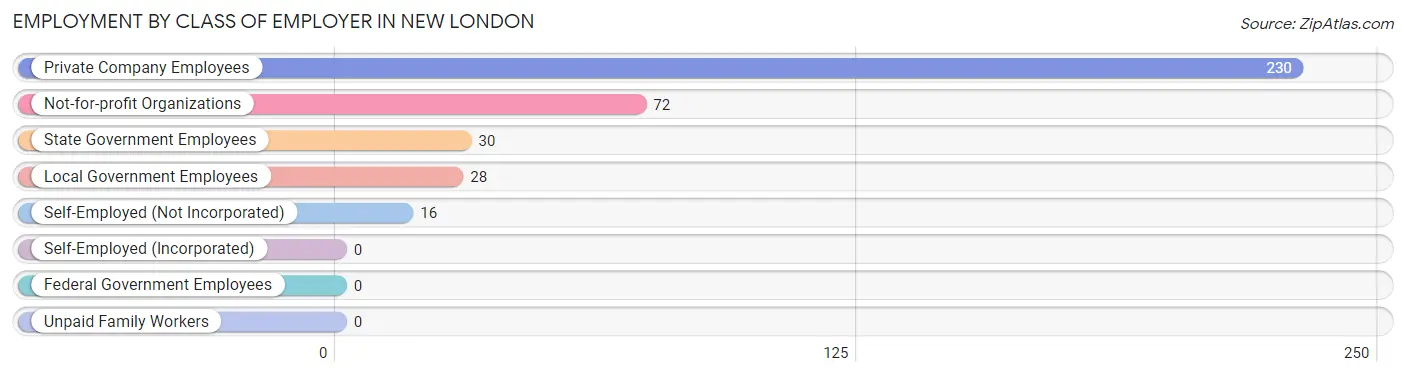
| Employer Class | # Employees | % Employees |
| Private Company Employees | 230 | 61.2% |
| Self-Employed (Incorporated) | 0 | 0.0% |
| Self-Employed (Not Incorporated) | 16 | 4.3% |
| Not-for-profit Organizations | 72 | 19.2% |
| Local Government Employees | 28 | 7.4% |
| State Government Employees | 30 | 8.0% |
| Federal Government Employees | 0 | 0.0% |
| Unpaid Family Workers | 0 | 0.0% |
| Total | 376 | 100.0% |
Employment Status by Age in New London
According to the labor force statistics for New London, out of the total population over 16 years of age (1,260), 30.5% or 384 individuals are in the labor force, with 0.8% or 3 of them unemployed. The age group with the highest labor force participation rate is 35 to 44 years, with 100.0% or 42 individuals in the labor force. Within the labor force, the 16 to 19 years age range has the highest percentage of unemployed individuals, with 8.3% or 3 of them being unemployed.
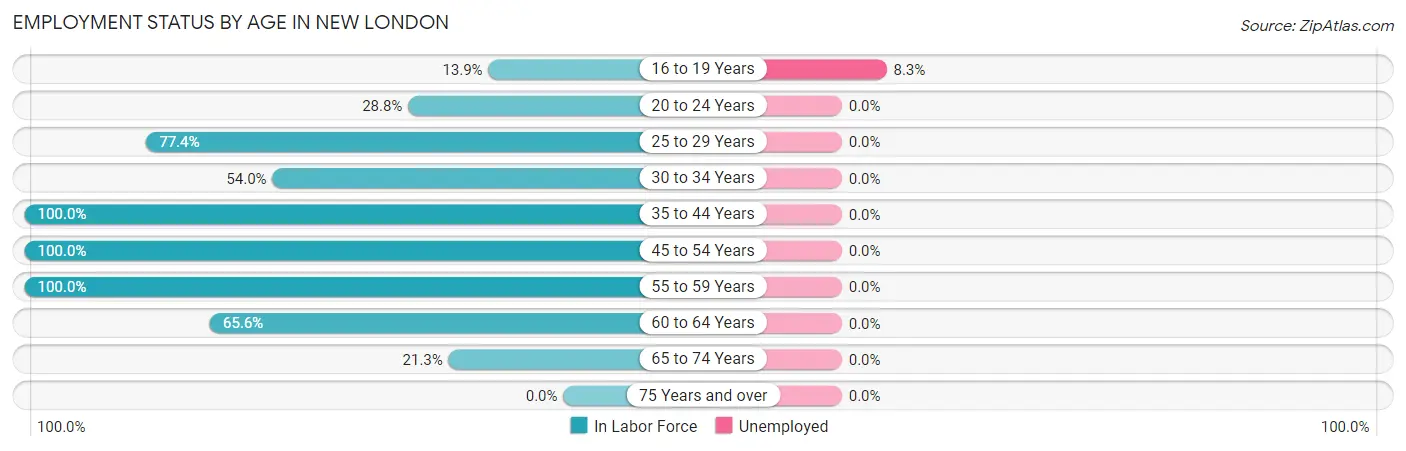
| Age Bracket | In Labor Force | Unemployed |
| 16 to 19 Years | 36 (13.9%) | 3 (8.3%) |
| 20 to 24 Years | 131 (28.8%) | 0 (0.0%) |
| 25 to 29 Years | 41 (77.4%) | 0 (0.0%) |
| 30 to 34 Years | 27 (54.0%) | 0 (0.0%) |
| 35 to 44 Years | 42 (100.0%) | 0 (0.0%) |
| 45 to 54 Years | 36 (100.0%) | 0 (0.0%) |
| 55 to 59 Years | 16 (100.0%) | 0 (0.0%) |
| 60 to 64 Years | 21 (65.6%) | 0 (0.0%) |
| 65 to 74 Years | 34 (21.3%) | 0 (0.0%) |
| 75 Years and over | 0 (0.0%) | 0 (0.0%) |
| Total | 384 (30.5%) | 3 (0.8%) |
Employment Status by Educational Attainment in New London
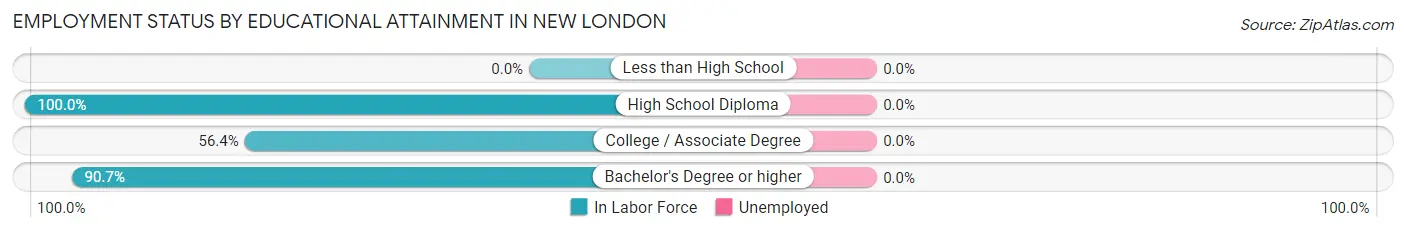
| Educational Attainment | In Labor Force | Unemployed |
| Less than High School | 0 (0.0%) | 0 (0.0%) |
| High School Diploma | 22 (100.0%) | 0 (0.0%) |
| College / Associate Degree | 44 (56.4%) | 0 (0.0%) |
| Bachelor's Degree or higher | 117 (90.7%) | 0 (0.0%) |
| Total | 183 (79.9%) | 0 (0.0%) |
Employment Occupations by Sex in New London
Management, Business, Science and Arts Occupations
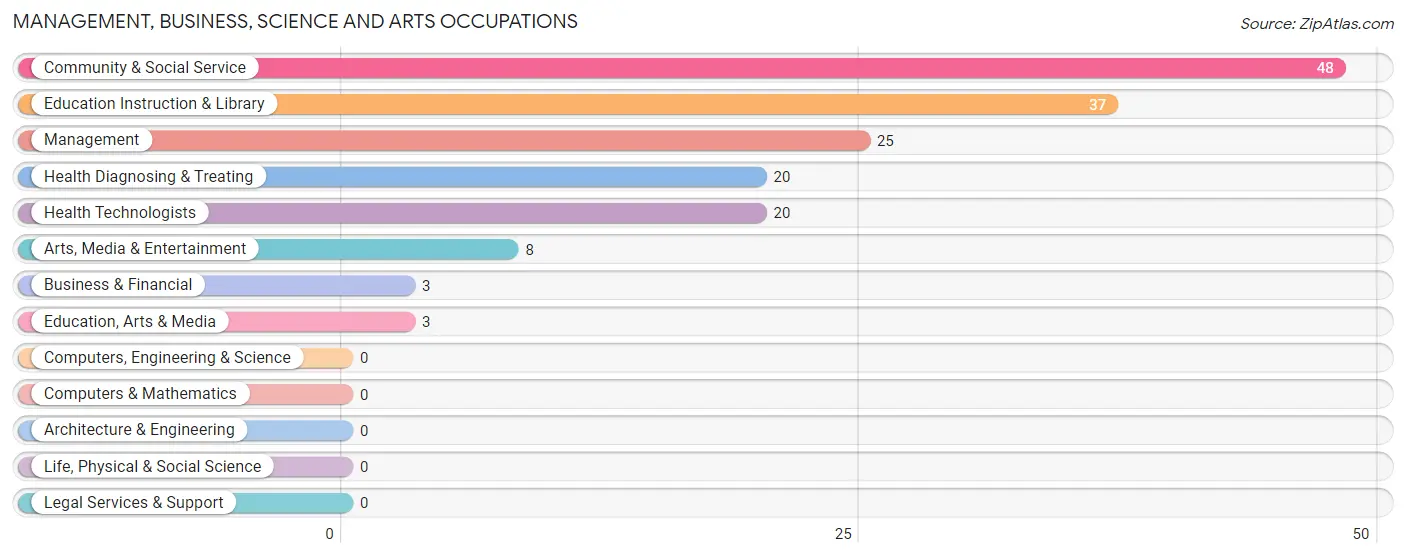
The most common Management, Business, Science and Arts occupations in New London are Community & Social Service (48 | 12.6%), Education Instruction & Library (37 | 9.7%), Management (25 | 6.6%), Health Diagnosing & Treating (20 | 5.2%), and Health Technologists (20 | 5.2%).
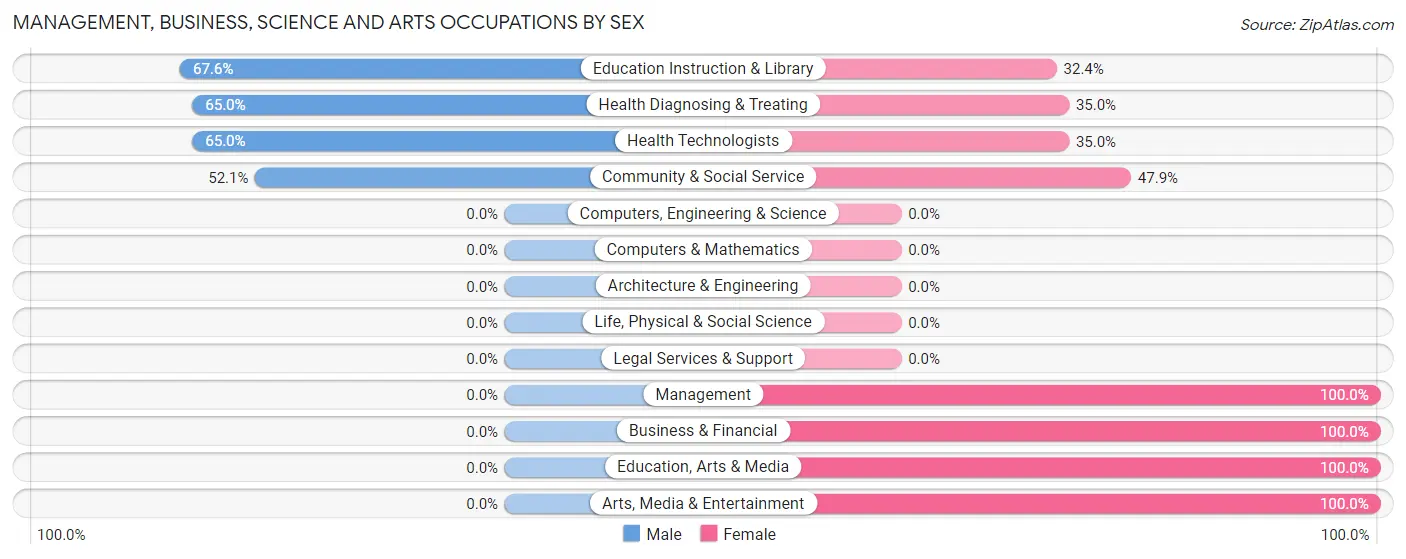
Management, Business, Science and Arts Occupations by Sex
Within the Management, Business, Science and Arts occupations in New London, the most male-oriented occupations are Education Instruction & Library (67.6%), Health Diagnosing & Treating (65.0%), and Health Technologists (65.0%), while the most female-oriented occupations are Management (100.0%), Business & Financial (100.0%), and Education, Arts & Media (100.0%).
| Occupation | Male | Female |
| Management | 0 (0.0%) | 25 (100.0%) |
| Business & Financial | 0 (0.0%) | 3 (100.0%) |
| Computers, Engineering & Science | 0 (0.0%) | 0 (0.0%) |
| Computers & Mathematics | 0 (0.0%) | 0 (0.0%) |
| Architecture & Engineering | 0 (0.0%) | 0 (0.0%) |
| Life, Physical & Social Science | 0 (0.0%) | 0 (0.0%) |
| Community & Social Service | 25 (52.1%) | 23 (47.9%) |
| Education, Arts & Media | 0 (0.0%) | 3 (100.0%) |
| Legal Services & Support | 0 (0.0%) | 0 (0.0%) |
| Education Instruction & Library | 25 (67.6%) | 12 (32.4%) |
| Arts, Media & Entertainment | 0 (0.0%) | 8 (100.0%) |
| Health Diagnosing & Treating | 13 (65.0%) | 7 (35.0%) |
| Health Technologists | 13 (65.0%) | 7 (35.0%) |
| Total (Category) | 38 (39.6%) | 58 (60.4%) |
| Total (Overall) | 152 (39.9%) | 229 (60.1%) |
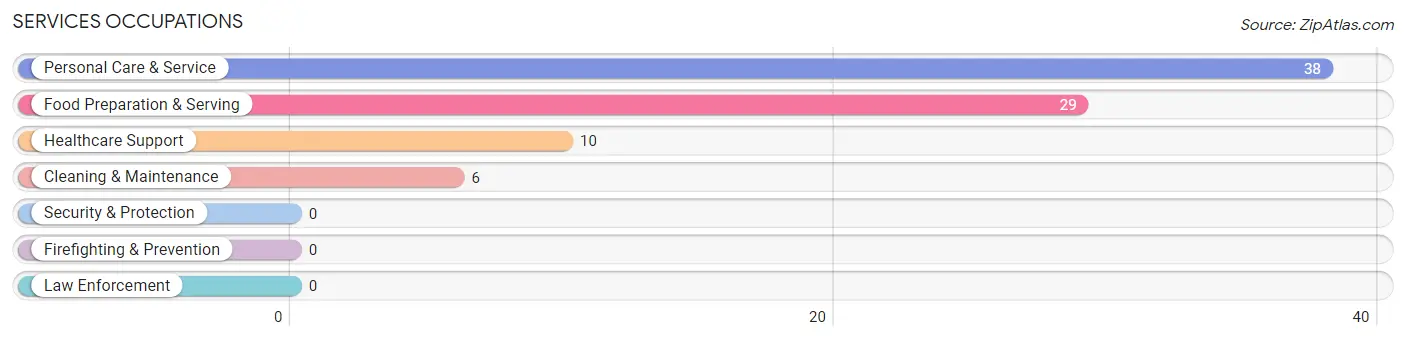
Services Occupations
The most common Services occupations in New London are Personal Care & Service (38 | 10.0%), Food Preparation & Serving (29 | 7.6%), Healthcare Support (10 | 2.6%), and Cleaning & Maintenance (6 | 1.6%).
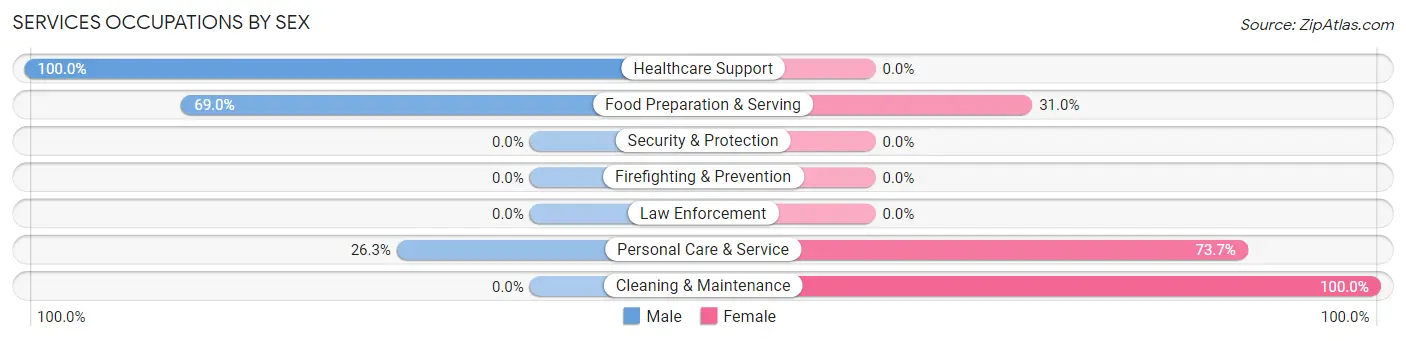
Services Occupations by Sex
Within the Services occupations in New London, the most male-oriented occupations are Healthcare Support (100.0%), Food Preparation & Serving (69.0%), and Personal Care & Service (26.3%), while the most female-oriented occupations are Cleaning & Maintenance (100.0%), Personal Care & Service (73.7%), and Food Preparation & Serving (31.0%).
| Occupation | Male | Female |
| Healthcare Support | 10 (100.0%) | 0 (0.0%) |
| Security & Protection | 0 (0.0%) | 0 (0.0%) |
| Firefighting & Prevention | 0 (0.0%) | 0 (0.0%) |
| Law Enforcement | 0 (0.0%) | 0 (0.0%) |
| Food Preparation & Serving | 20 (69.0%) | 9 (31.0%) |
| Cleaning & Maintenance | 0 (0.0%) | 6 (100.0%) |
| Personal Care & Service | 10 (26.3%) | 28 (73.7%) |
| Total (Category) | 40 (48.2%) | 43 (51.8%) |
| Total (Overall) | 152 (39.9%) | 229 (60.1%) |
Sales and Office Occupations
The most common Sales and Office occupations in New London are Sales & Related (76 | 20.0%), and Office & Administration (49 | 12.9%).
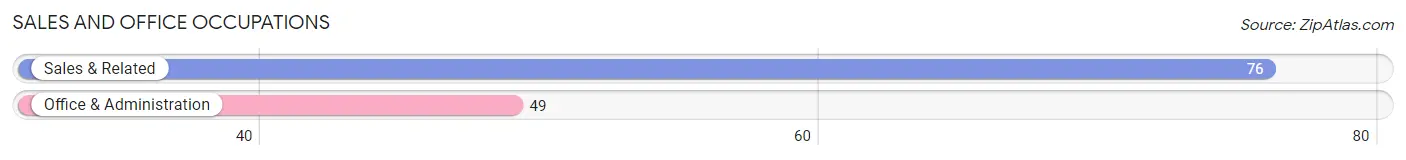
Sales and Office Occupations by Sex
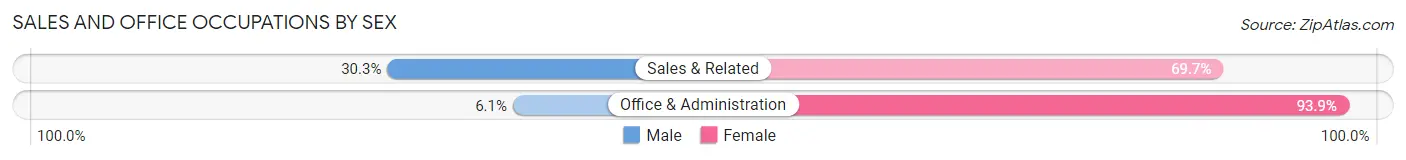
| Occupation | Male | Female |
| Sales & Related | 23 (30.3%) | 53 (69.7%) |
| Office & Administration | 3 (6.1%) | 46 (93.9%) |
| Total (Category) | 26 (20.8%) | 99 (79.2%) |
| Total (Overall) | 152 (39.9%) | 229 (60.1%) |
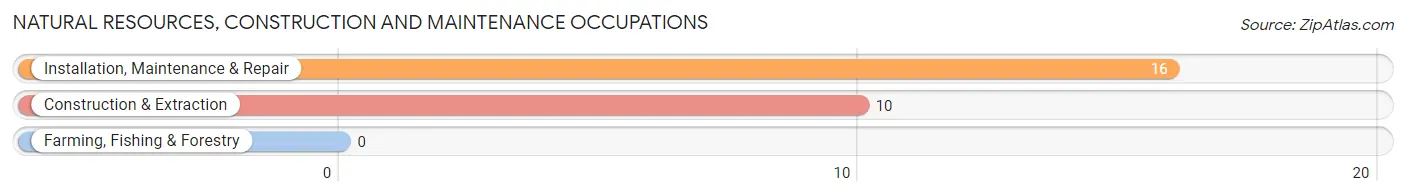
Natural Resources, Construction and Maintenance Occupations
The most common Natural Resources, Construction and Maintenance occupations in New London are Installation, Maintenance & Repair (16 | 4.2%), and Construction & Extraction (10 | 2.6%).
Natural Resources, Construction and Maintenance Occupations by Sex
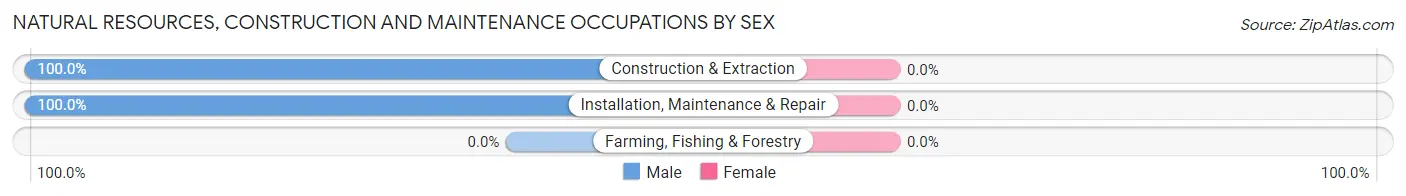
| Occupation | Male | Female |
| Farming, Fishing & Forestry | 0 (0.0%) | 0 (0.0%) |
| Construction & Extraction | 10 (100.0%) | 0 (0.0%) |
| Installation, Maintenance & Repair | 16 (100.0%) | 0 (0.0%) |
| Total (Category) | 26 (100.0%) | 0 (0.0%) |
| Total (Overall) | 152 (39.9%) | 229 (60.1%) |
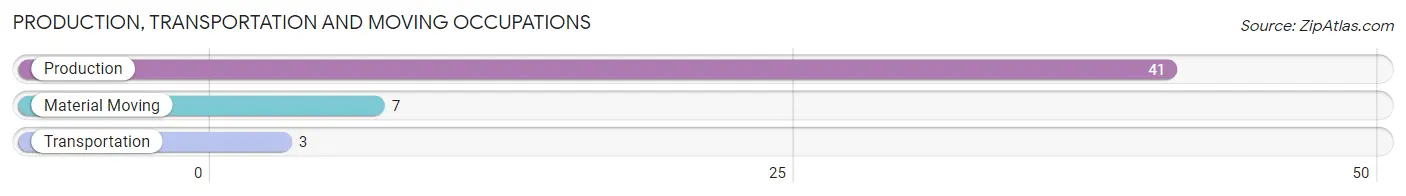
Production, Transportation and Moving Occupations
The most common Production, Transportation and Moving occupations in New London are Production (41 | 10.8%), Material Moving (7 | 1.8%), and Transportation (3 | 0.8%).
Production, Transportation and Moving Occupations by Sex
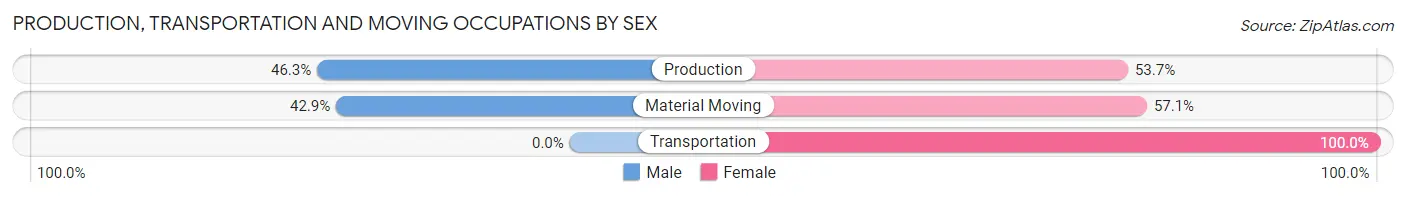
| Occupation | Male | Female |
| Production | 19 (46.3%) | 22 (53.7%) |
| Transportation | 0 (0.0%) | 3 (100.0%) |
| Material Moving | 3 (42.9%) | 4 (57.1%) |
| Total (Category) | 22 (43.1%) | 29 (56.9%) |
| Total (Overall) | 152 (39.9%) | 229 (60.1%) |
Employment Industries by Sex in New London
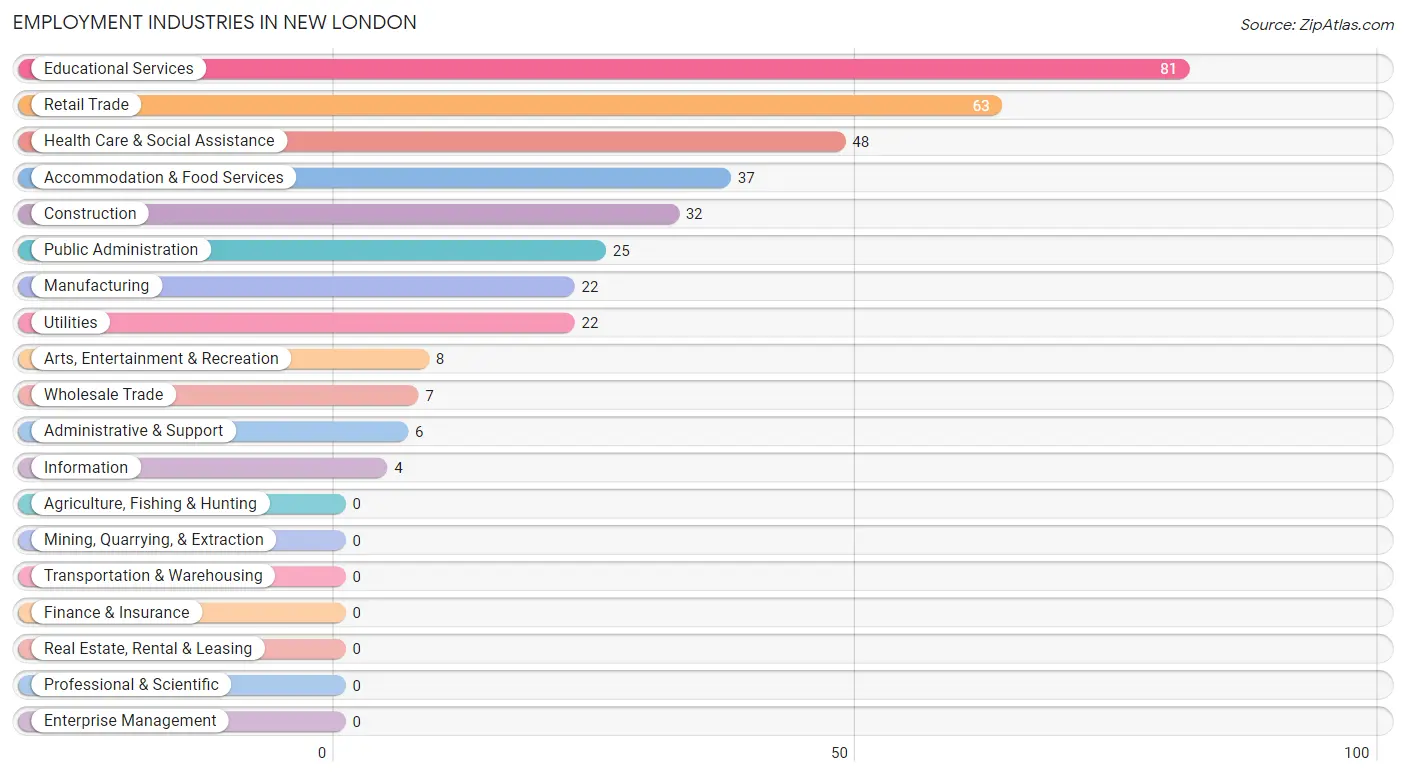
Employment Industries in New London
The major employment industries in New London include Educational Services (81 | 21.3%), Retail Trade (63 | 16.5%), Health Care & Social Assistance (48 | 12.6%), Accommodation & Food Services (37 | 9.7%), and Construction (32 | 8.4%).
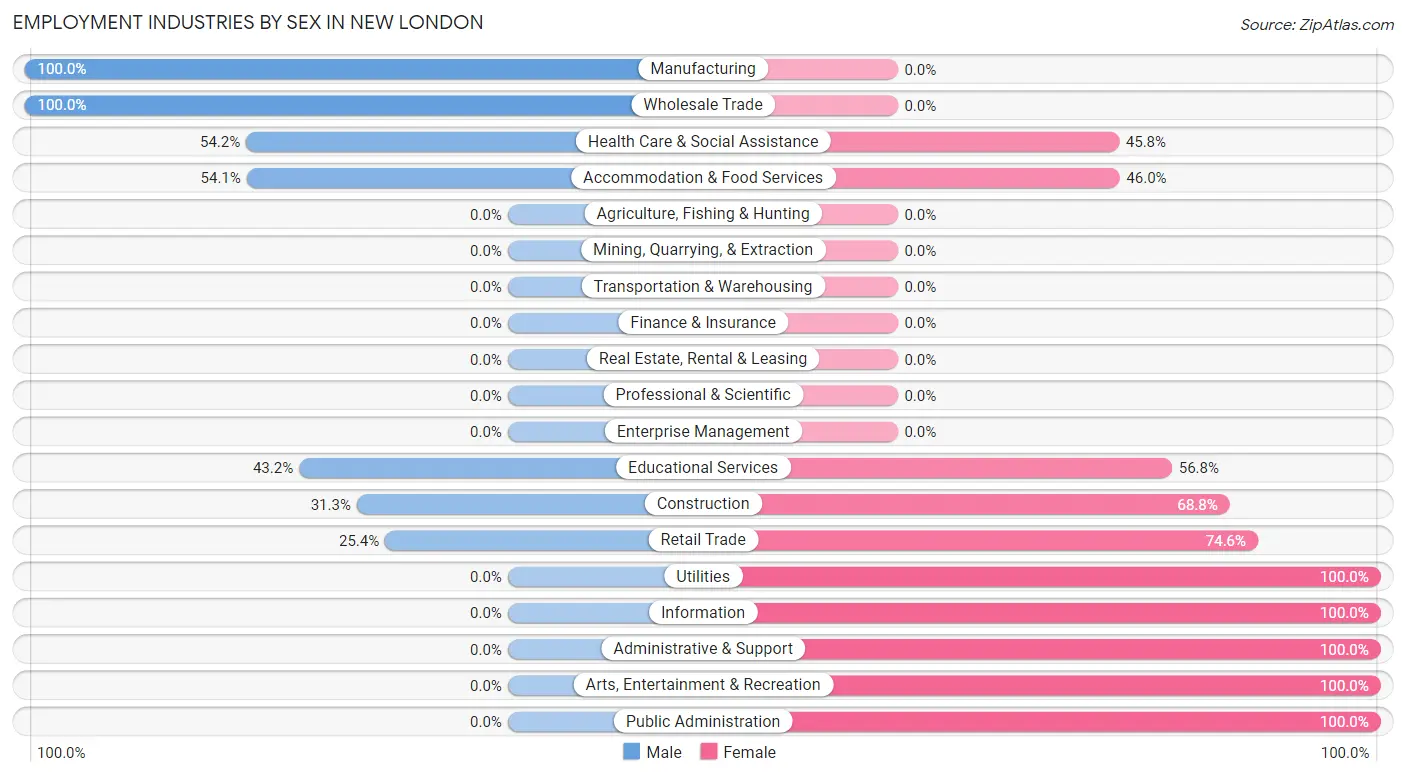
Employment Industries by Sex in New London
The New London industries that see more men than women are Manufacturing (100.0%), Wholesale Trade (100.0%), and Health Care & Social Assistance (54.2%), whereas the industries that tend to have a higher number of women are Utilities (100.0%), Information (100.0%), and Administrative & Support (100.0%).
| Industry | Male | Female |
| Agriculture, Fishing & Hunting | 0 (0.0%) | 0 (0.0%) |
| Mining, Quarrying, & Extraction | 0 (0.0%) | 0 (0.0%) |
| Construction | 10 (31.2%) | 22 (68.8%) |
| Manufacturing | 22 (100.0%) | 0 (0.0%) |
| Wholesale Trade | 7 (100.0%) | 0 (0.0%) |
| Retail Trade | 16 (25.4%) | 47 (74.6%) |
| Transportation & Warehousing | 0 (0.0%) | 0 (0.0%) |
| Utilities | 0 (0.0%) | 22 (100.0%) |
| Information | 0 (0.0%) | 4 (100.0%) |
| Finance & Insurance | 0 (0.0%) | 0 (0.0%) |
| Real Estate, Rental & Leasing | 0 (0.0%) | 0 (0.0%) |
| Professional & Scientific | 0 (0.0%) | 0 (0.0%) |
| Enterprise Management | 0 (0.0%) | 0 (0.0%) |
| Administrative & Support | 0 (0.0%) | 6 (100.0%) |
| Educational Services | 35 (43.2%) | 46 (56.8%) |
| Health Care & Social Assistance | 26 (54.2%) | 22 (45.8%) |
| Arts, Entertainment & Recreation | 0 (0.0%) | 8 (100.0%) |
| Accommodation & Food Services | 20 (54.0%) | 17 (46.0%) |
| Public Administration | 0 (0.0%) | 25 (100.0%) |
| Total | 152 (39.9%) | 229 (60.1%) |
Education in New London
School Enrollment in New London
The most common levels of schooling among the 822 students in New London are college / undergraduate (709 | 86.3%), high school (51 | 6.2%), and elementary school (25 | 3.0%).
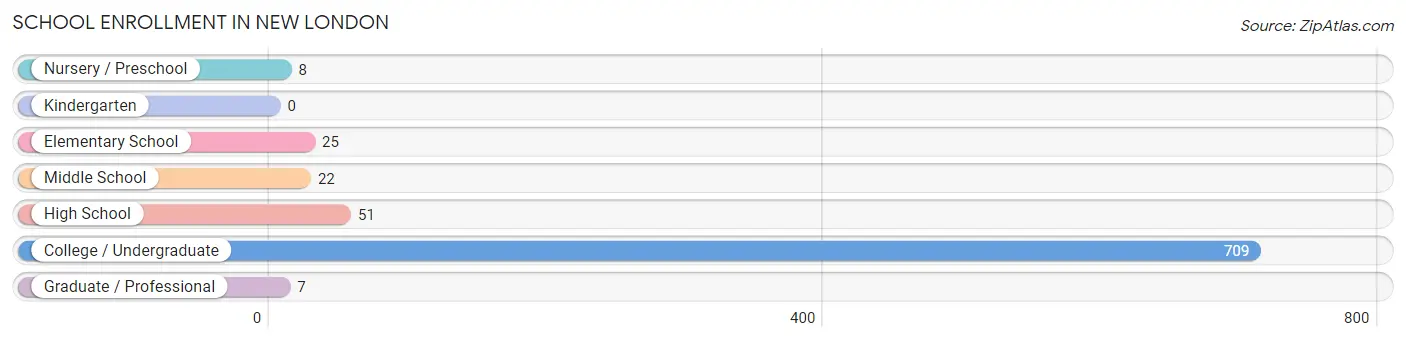
| School Level | # Students | % Students |
| Nursery / Preschool | 8 | 1.0% |
| Kindergarten | 0 | 0.0% |
| Elementary School | 25 | 3.0% |
| Middle School | 22 | 2.7% |
| High School | 51 | 6.2% |
| College / Undergraduate | 709 | 86.3% |
| Graduate / Professional | 7 | 0.9% |
| Total | 822 | 100.0% |
School Enrollment by Age by Funding Source in New London
Out of a total of 822 students who are enrolled in schools in New London, 517 (62.9%) attend a private institution, while the remaining 305 (37.1%) are enrolled in public schools. The age group of 25 to 34 year olds has the highest likelihood of being enrolled in private schools, with 31 (100.0% in the age bracket) enrolled. Conversely, the age group of 10 to 14 year olds has the lowest likelihood of being enrolled in a private school, with 22 (100.0% in the age bracket) attending a public institution.
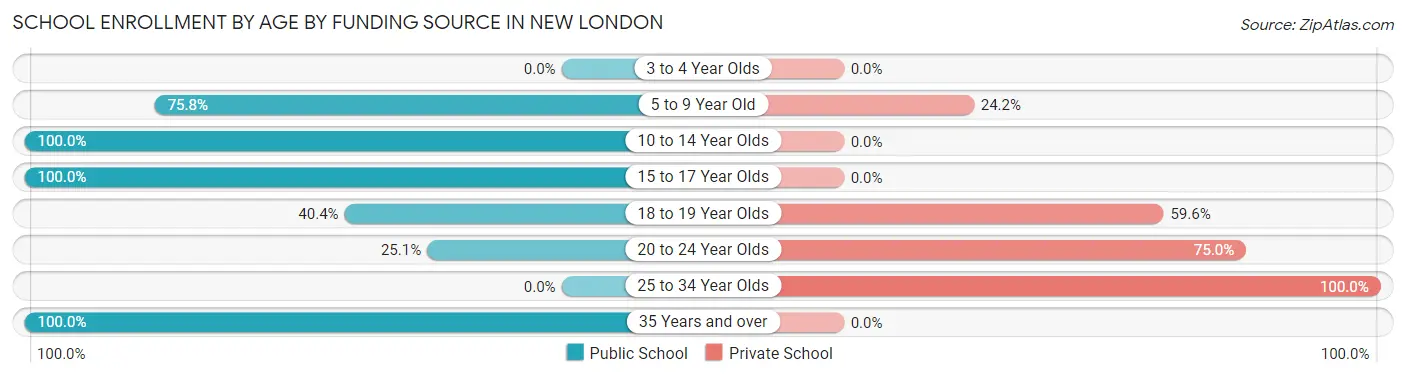
| Age Bracket | Public School | Private School |
| 3 to 4 Year Olds | 0 (0.0%) | 0 (0.0%) |
| 5 to 9 Year Old | 25 (75.8%) | 8 (24.2%) |
| 10 to 14 Year Olds | 22 (100.0%) | 0 (0.0%) |
| 15 to 17 Year Olds | 29 (100.0%) | 0 (0.0%) |
| 18 to 19 Year Olds | 93 (40.4%) | 137 (59.6%) |
| 20 to 24 Year Olds | 114 (25.1%) | 341 (75.0%) |
| 25 to 34 Year Olds | 0 (0.0%) | 31 (100.0%) |
| 35 Years and over | 22 (100.0%) | 0 (0.0%) |
| Total | 305 (37.1%) | 517 (62.9%) |
Educational Attainment by Field of Study in New London
Business (61 | 19.1%), education (60 | 18.8%), science & technology (58 | 18.1%), arts & humanities (58 | 18.1%), and literature & languages (26 | 8.1%) are the most common fields of study among 320 individuals in New London who have obtained a bachelor's degree or higher.
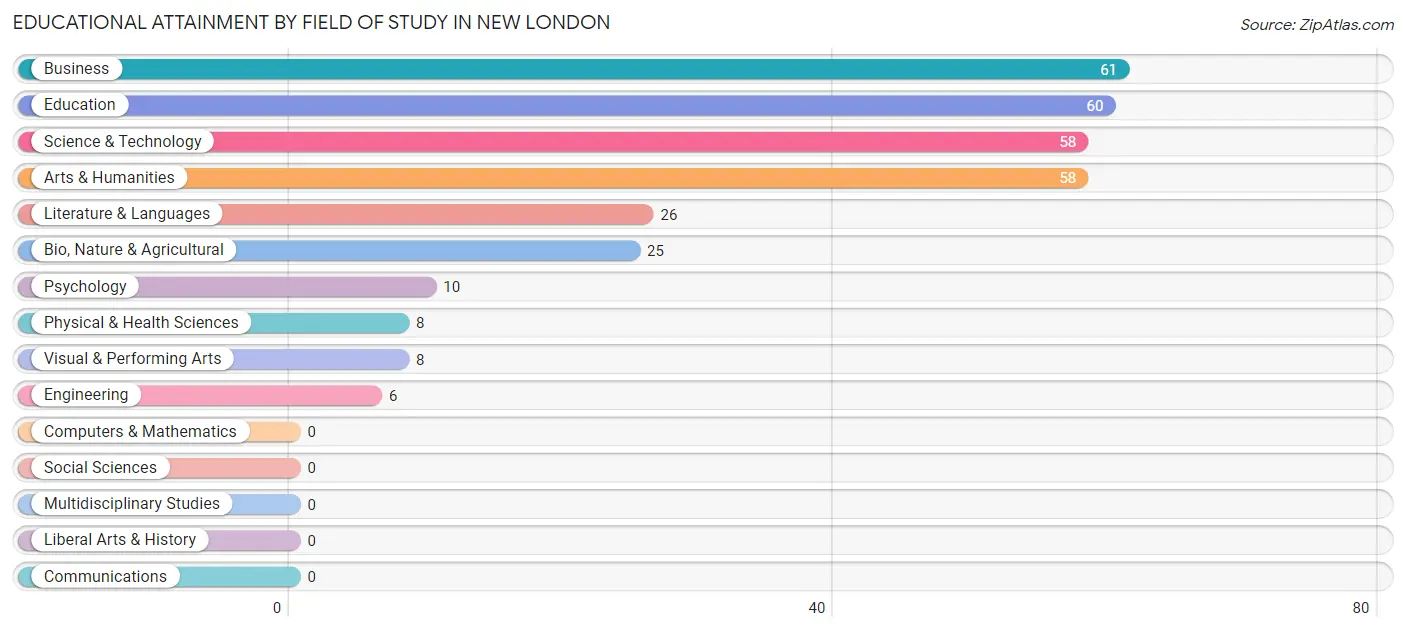
| Field of Study | # Graduates | % Graduates |
| Computers & Mathematics | 0 | 0.0% |
| Bio, Nature & Agricultural | 25 | 7.8% |
| Physical & Health Sciences | 8 | 2.5% |
| Psychology | 10 | 3.1% |
| Social Sciences | 0 | 0.0% |
| Engineering | 6 | 1.9% |
| Multidisciplinary Studies | 0 | 0.0% |
| Science & Technology | 58 | 18.1% |
| Business | 61 | 19.1% |
| Education | 60 | 18.8% |
| Literature & Languages | 26 | 8.1% |
| Liberal Arts & History | 0 | 0.0% |
| Visual & Performing Arts | 8 | 2.5% |
| Communications | 0 | 0.0% |
| Arts & Humanities | 58 | 18.1% |
| Total | 320 | 100.0% |
Transportation & Commute in New London
Vehicle Availability by Sex in New London
The most prevalent vehicle ownership categories in New London are males with 3 vehicles (49, accounting for 40.5%) and females with 3 vehicles (64, making up 55.7%).
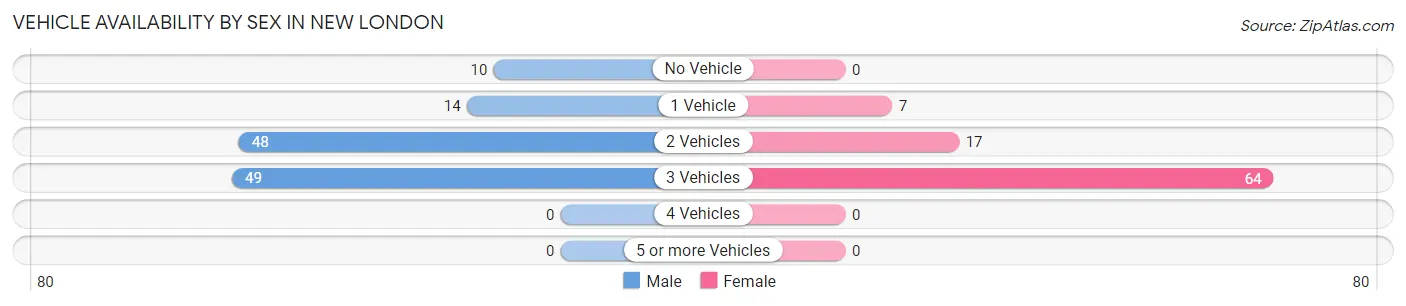
| Vehicles Available | Male | Female |
| No Vehicle | 10 (8.3%) | 0 (0.0%) |
| 1 Vehicle | 14 (11.6%) | 7 (8.0%) |
| 2 Vehicles | 48 (39.7%) | 17 (19.3%) |
| 3 Vehicles | 49 (40.5%) | 64 (72.7%) |
| 4 Vehicles | 0 (0.0%) | 0 (0.0%) |
| 5 or more Vehicles | 0 (0.0%) | 0 (0.0%) |
| Total | 121 (100.0%) | 88 (100.0%) |
Commute Time in New London
The most frequently occuring commute durations in New London are 5 to 9 minutes (61 commuters, 19.8%), 20 to 24 minutes (55 commuters, 17.9%), and 60 to 89 minutes (50 commuters, 16.2%).
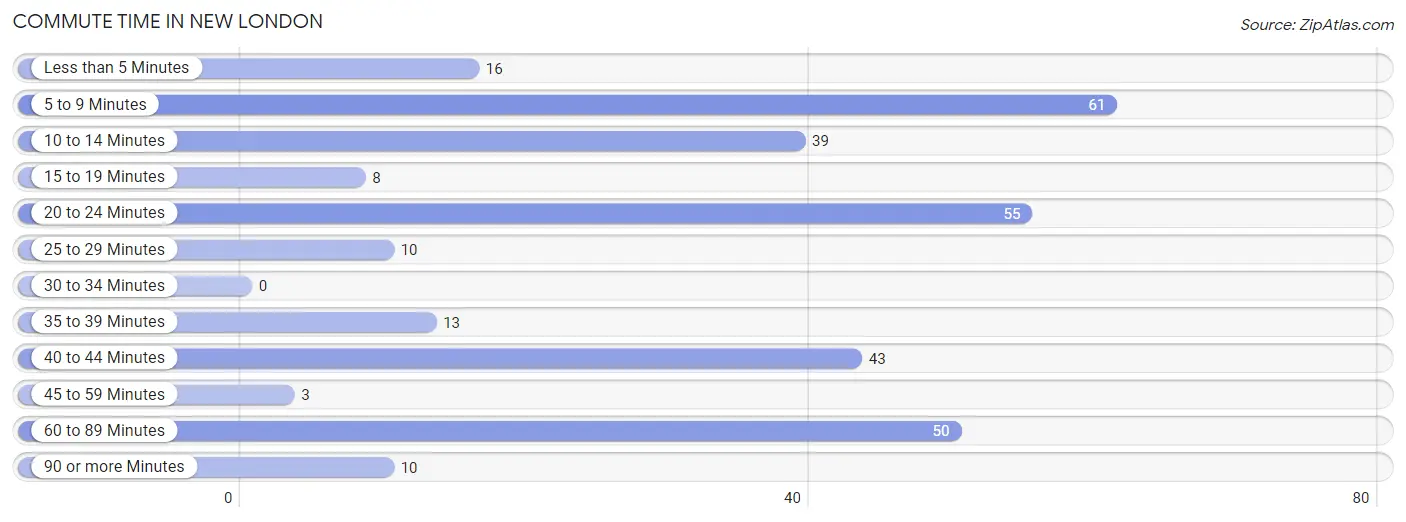
| Commute Time | # Commuters | % Commuters |
| Less than 5 Minutes | 16 | 5.2% |
| 5 to 9 Minutes | 61 | 19.8% |
| 10 to 14 Minutes | 39 | 12.7% |
| 15 to 19 Minutes | 8 | 2.6% |
| 20 to 24 Minutes | 55 | 17.9% |
| 25 to 29 Minutes | 10 | 3.3% |
| 30 to 34 Minutes | 0 | 0.0% |
| 35 to 39 Minutes | 13 | 4.2% |
| 40 to 44 Minutes | 43 | 14.0% |
| 45 to 59 Minutes | 3 | 1.0% |
| 60 to 89 Minutes | 50 | 16.2% |
| 90 or more Minutes | 10 | 3.3% |
Commute Time by Sex in New London
The most common commute times in New London are 20 to 24 minutes (29 commuters, 19.1%) for males and 5 to 9 minutes (39 commuters, 25.0%) for females.
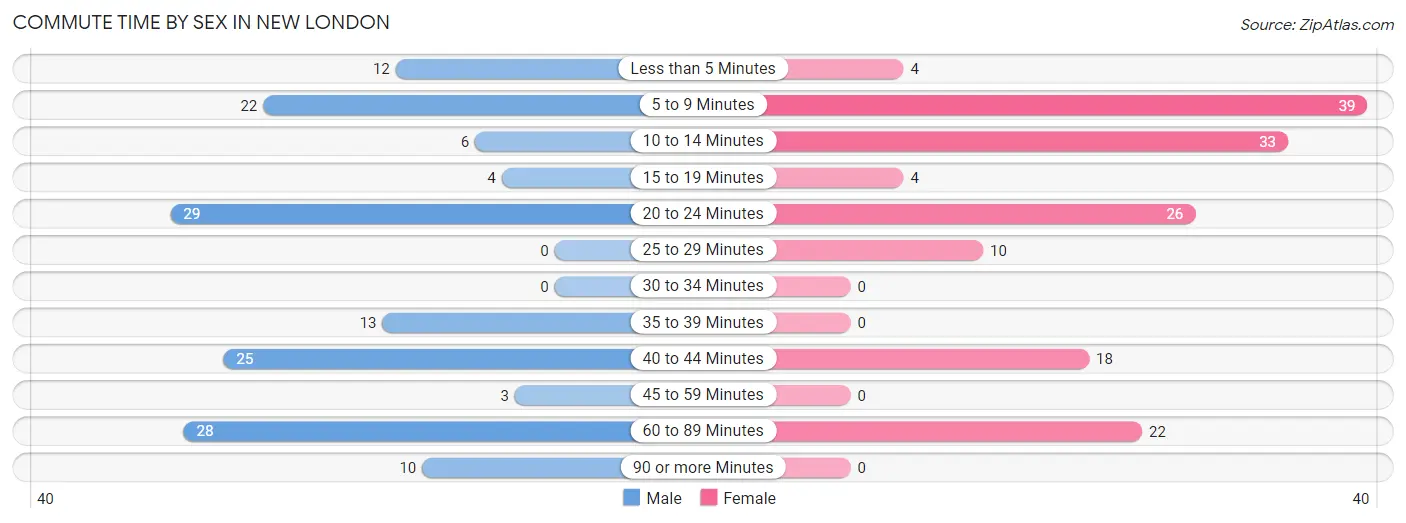
| Commute Time | Male | Female |
| Less than 5 Minutes | 12 (7.9%) | 4 (2.6%) |
| 5 to 9 Minutes | 22 (14.5%) | 39 (25.0%) |
| 10 to 14 Minutes | 6 (4.0%) | 33 (21.1%) |
| 15 to 19 Minutes | 4 (2.6%) | 4 (2.6%) |
| 20 to 24 Minutes | 29 (19.1%) | 26 (16.7%) |
| 25 to 29 Minutes | 0 (0.0%) | 10 (6.4%) |
| 30 to 34 Minutes | 0 (0.0%) | 0 (0.0%) |
| 35 to 39 Minutes | 13 (8.6%) | 0 (0.0%) |
| 40 to 44 Minutes | 25 (16.5%) | 18 (11.5%) |
| 45 to 59 Minutes | 3 (2.0%) | 0 (0.0%) |
| 60 to 89 Minutes | 28 (18.4%) | 22 (14.1%) |
| 90 or more Minutes | 10 (6.6%) | 0 (0.0%) |
Time of Departure to Work by Sex in New London
The most frequent times of departure to work in New London are 7:00 AM to 7:29 AM (25, 16.5%) for males and 4:00 PM to 11:59 PM (43, 27.6%) for females.
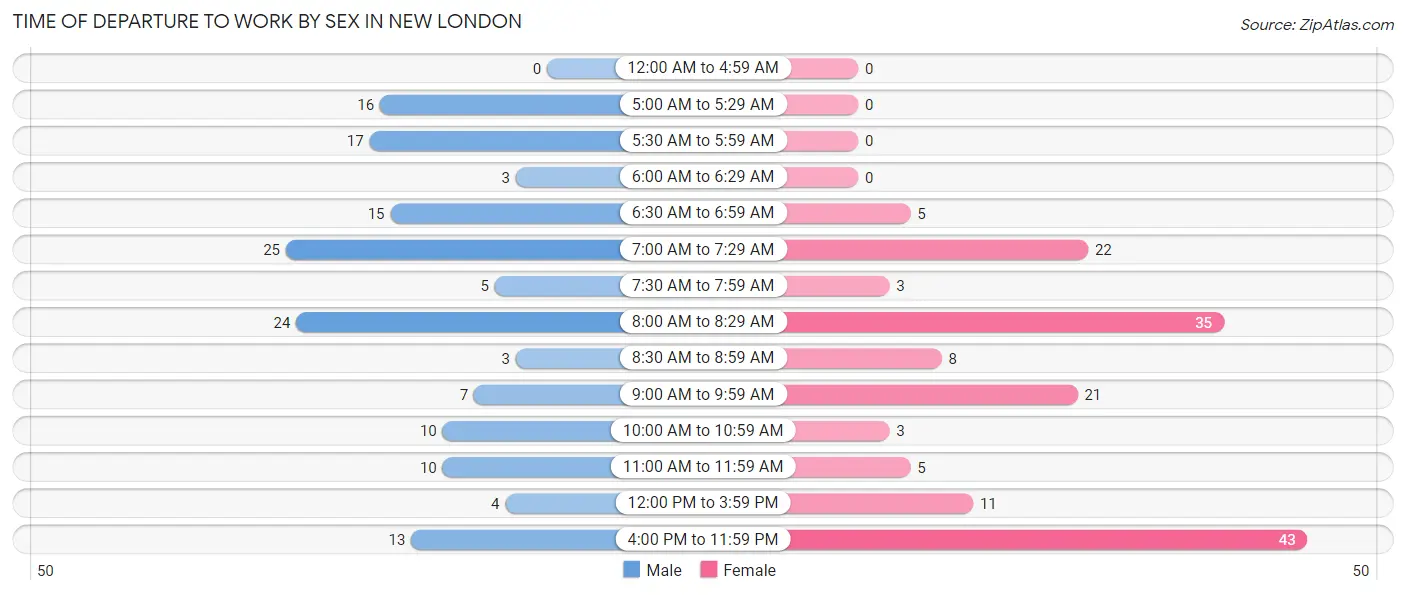
| Time of Departure | Male | Female |
| 12:00 AM to 4:59 AM | 0 (0.0%) | 0 (0.0%) |
| 5:00 AM to 5:29 AM | 16 (10.5%) | 0 (0.0%) |
| 5:30 AM to 5:59 AM | 17 (11.2%) | 0 (0.0%) |
| 6:00 AM to 6:29 AM | 3 (2.0%) | 0 (0.0%) |
| 6:30 AM to 6:59 AM | 15 (9.9%) | 5 (3.2%) |
| 7:00 AM to 7:29 AM | 25 (16.5%) | 22 (14.1%) |
| 7:30 AM to 7:59 AM | 5 (3.3%) | 3 (1.9%) |
| 8:00 AM to 8:29 AM | 24 (15.8%) | 35 (22.4%) |
| 8:30 AM to 8:59 AM | 3 (2.0%) | 8 (5.1%) |
| 9:00 AM to 9:59 AM | 7 (4.6%) | 21 (13.5%) |
| 10:00 AM to 10:59 AM | 10 (6.6%) | 3 (1.9%) |
| 11:00 AM to 11:59 AM | 10 (6.6%) | 5 (3.2%) |
| 12:00 PM to 3:59 PM | 4 (2.6%) | 11 (7.0%) |
| 4:00 PM to 11:59 PM | 13 (8.6%) | 43 (27.6%) |
| Total | 152 (100.0%) | 156 (100.0%) |
Housing Occupancy in New London
Occupancy by Ownership in New London
Of the total 276 dwellings in New London, owner-occupied units account for 219 (79.3%), while renter-occupied units make up 57 (20.6%).
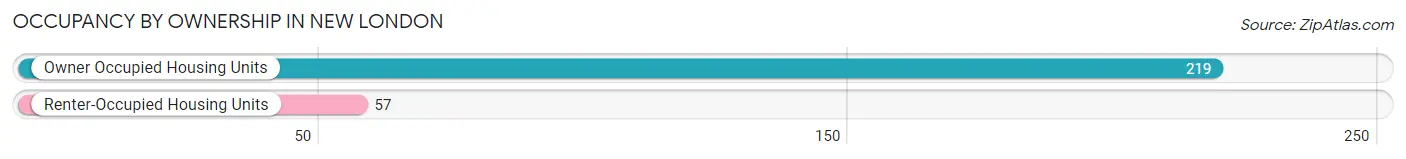
| Occupancy | # Housing Units | % Housing Units |
| Owner Occupied Housing Units | 219 | 79.3% |
| Renter-Occupied Housing Units | 57 | 20.6% |
| Total Occupied Housing Units | 276 | 100.0% |
Occupancy by Household Size in New London
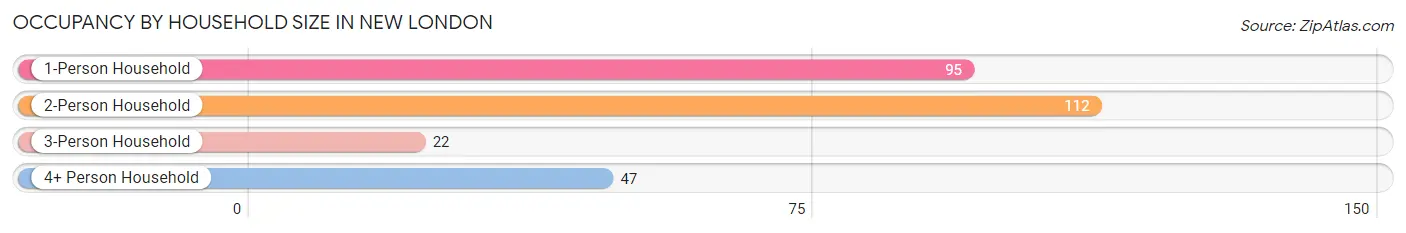
| Household Size | # Housing Units | % Housing Units |
| 1-Person Household | 95 | 34.4% |
| 2-Person Household | 112 | 40.6% |
| 3-Person Household | 22 | 8.0% |
| 4+ Person Household | 47 | 17.0% |
| Total Housing Units | 276 | 100.0% |
Occupancy by Ownership by Household Size in New London
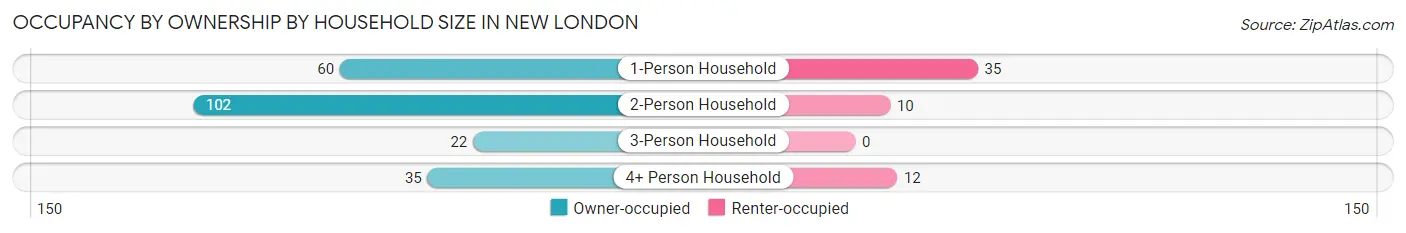
| Household Size | Owner-occupied | Renter-occupied |
| 1-Person Household | 60 (63.2%) | 35 (36.8%) |
| 2-Person Household | 102 (91.1%) | 10 (8.9%) |
| 3-Person Household | 22 (100.0%) | 0 (0.0%) |
| 4+ Person Household | 35 (74.5%) | 12 (25.5%) |
| Total Housing Units | 219 (79.3%) | 57 (20.6%) |
Occupancy by Educational Attainment in New London
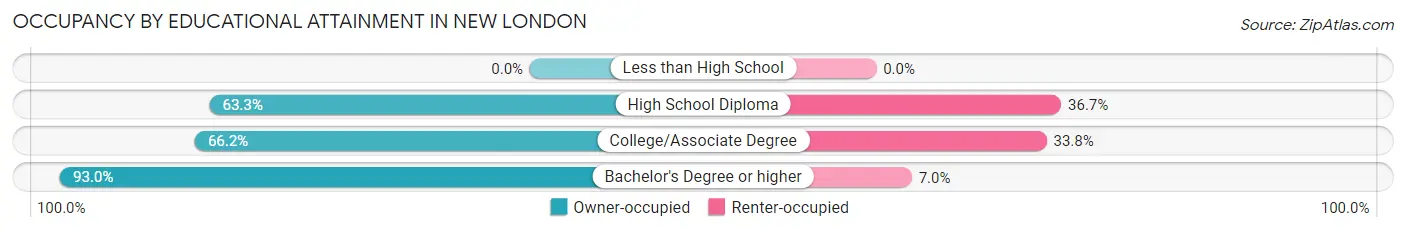
| Household Size | Owner-occupied | Renter-occupied |
| Less than High School | 0 (0.0%) | 0 (0.0%) |
| High School Diploma | 38 (63.3%) | 22 (36.7%) |
| College/Associate Degree | 49 (66.2%) | 25 (33.8%) |
| Bachelor's Degree or higher | 132 (93.0%) | 10 (7.0%) |
Occupancy by Age of Householder in New London
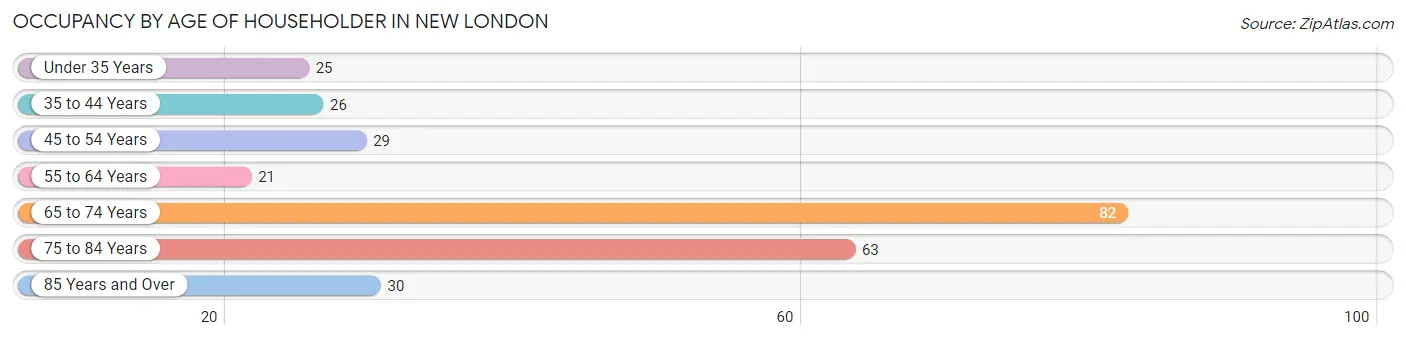
| Age Bracket | # Households | % Households |
| Under 35 Years | 25 | 9.1% |
| 35 to 44 Years | 26 | 9.4% |
| 45 to 54 Years | 29 | 10.5% |
| 55 to 64 Years | 21 | 7.6% |
| 65 to 74 Years | 82 | 29.7% |
| 75 to 84 Years | 63 | 22.8% |
| 85 Years and Over | 30 | 10.9% |
| Total | 276 | 100.0% |
Housing Finances in New London
Median Income by Occupancy in New London
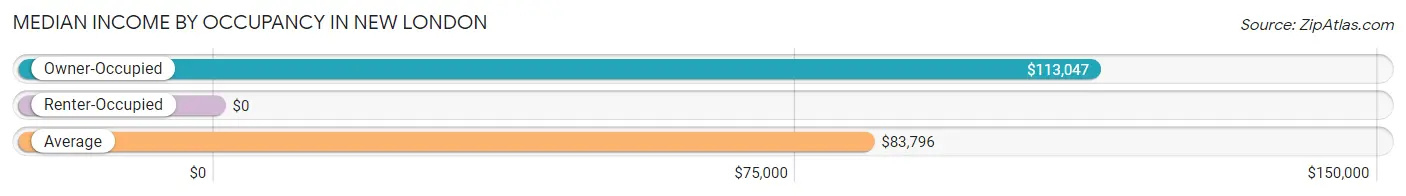
| Occupancy Type | # Households | Median Income |
| Owner-Occupied | 219 (79.3%) | $113,047 |
| Renter-Occupied | 57 (20.6%) | $0 |
| Average | 276 (100.0%) | $83,796 |
Occupancy by Householder Income Bracket in New London
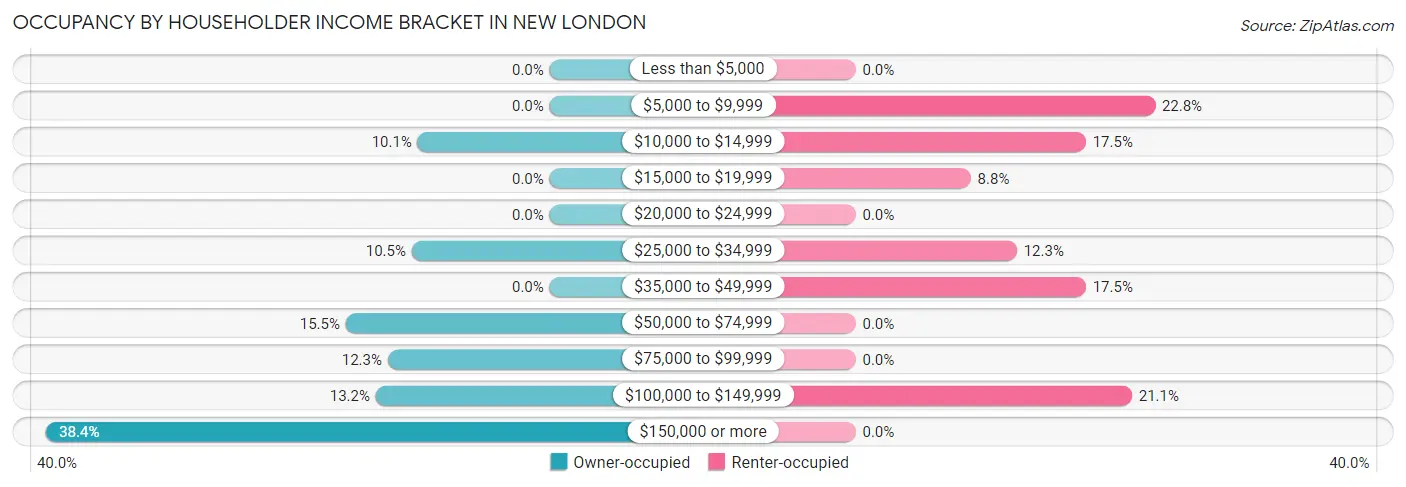
| Income Bracket | Owner-occupied | Renter-occupied |
| Less than $5,000 | 0 (0.0%) | 0 (0.0%) |
| $5,000 to $9,999 | 0 (0.0%) | 13 (22.8%) |
| $10,000 to $14,999 | 22 (10.1%) | 10 (17.5%) |
| $15,000 to $19,999 | 0 (0.0%) | 5 (8.8%) |
| $20,000 to $24,999 | 0 (0.0%) | 0 (0.0%) |
| $25,000 to $34,999 | 23 (10.5%) | 7 (12.3%) |
| $35,000 to $49,999 | 0 (0.0%) | 10 (17.5%) |
| $50,000 to $74,999 | 34 (15.5%) | 0 (0.0%) |
| $75,000 to $99,999 | 27 (12.3%) | 0 (0.0%) |
| $100,000 to $149,999 | 29 (13.2%) | 12 (21.0%) |
| $150,000 or more | 84 (38.4%) | 0 (0.0%) |
| Total | 219 (100.0%) | 57 (100.0%) |
Monthly Housing Cost Tiers in New London
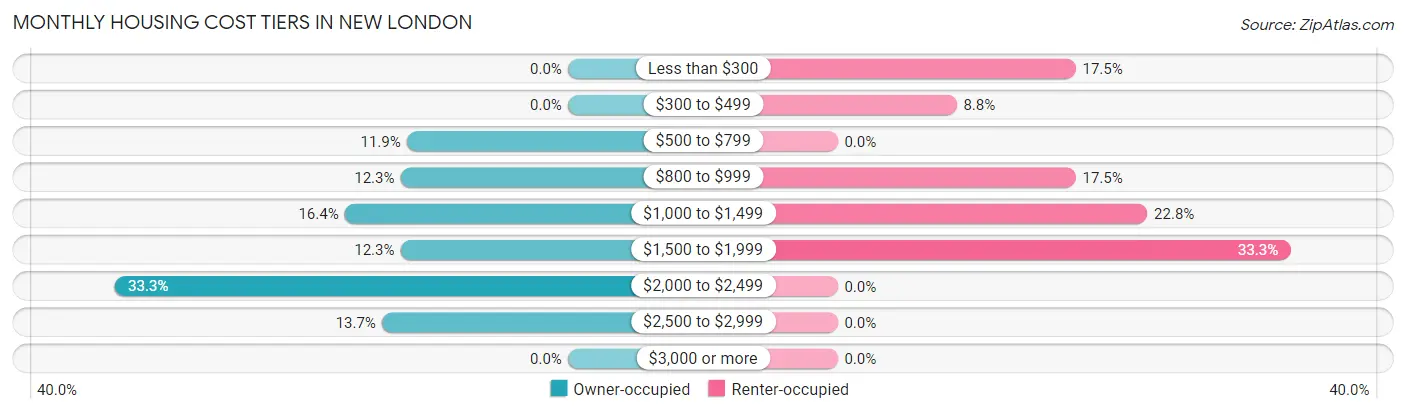
| Monthly Cost | Owner-occupied | Renter-occupied |
| Less than $300 | 0 (0.0%) | 10 (17.5%) |
| $300 to $499 | 0 (0.0%) | 5 (8.8%) |
| $500 to $799 | 26 (11.9%) | 0 (0.0%) |
| $800 to $999 | 27 (12.3%) | 10 (17.5%) |
| $1,000 to $1,499 | 36 (16.4%) | 13 (22.8%) |
| $1,500 to $1,999 | 27 (12.3%) | 19 (33.3%) |
| $2,000 to $2,499 | 73 (33.3%) | 0 (0.0%) |
| $2,500 to $2,999 | 30 (13.7%) | 0 (0.0%) |
| $3,000 or more | 0 (0.0%) | 0 (0.0%) |
| Total | 219 (100.0%) | 57 (100.0%) |
Physical Housing Characteristics in New London
Housing Structures in New London
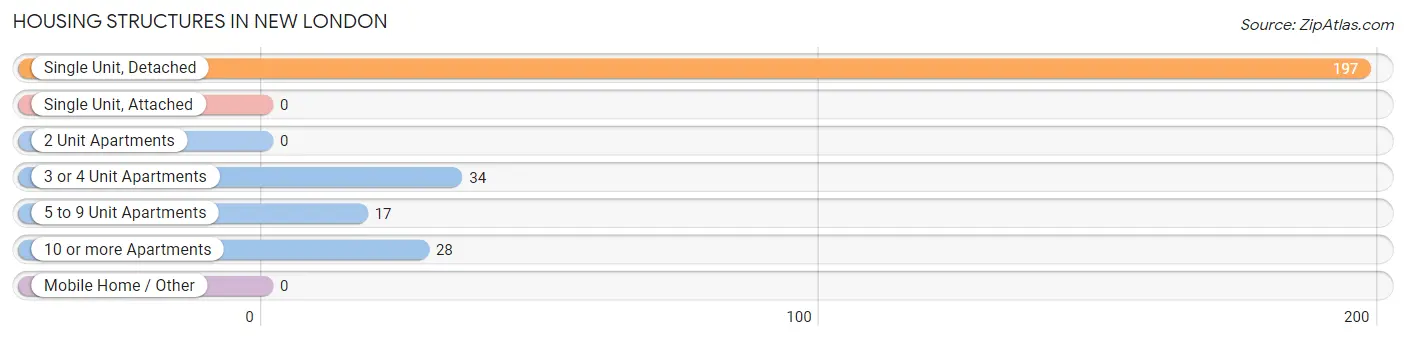
| Structure Type | # Housing Units | % Housing Units |
| Single Unit, Detached | 197 | 71.4% |
| Single Unit, Attached | 0 | 0.0% |
| 2 Unit Apartments | 0 | 0.0% |
| 3 or 4 Unit Apartments | 34 | 12.3% |
| 5 to 9 Unit Apartments | 17 | 6.2% |
| 10 or more Apartments | 28 | 10.1% |
| Mobile Home / Other | 0 | 0.0% |
| Total | 276 | 100.0% |
Housing Structures by Occupancy in New London
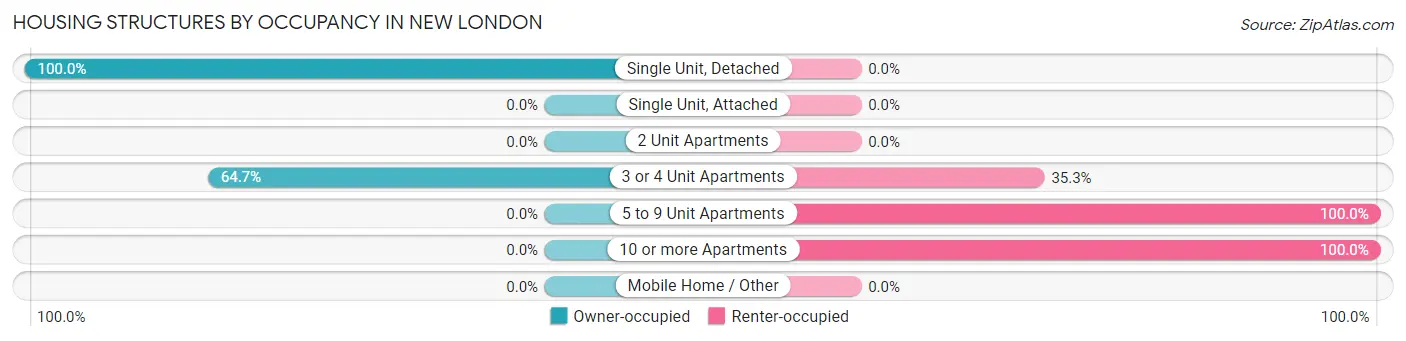
| Structure Type | Owner-occupied | Renter-occupied |
| Single Unit, Detached | 197 (100.0%) | 0 (0.0%) |
| Single Unit, Attached | 0 (0.0%) | 0 (0.0%) |
| 2 Unit Apartments | 0 (0.0%) | 0 (0.0%) |
| 3 or 4 Unit Apartments | 22 (64.7%) | 12 (35.3%) |
| 5 to 9 Unit Apartments | 0 (0.0%) | 17 (100.0%) |
| 10 or more Apartments | 0 (0.0%) | 28 (100.0%) |
| Mobile Home / Other | 0 (0.0%) | 0 (0.0%) |
| Total | 219 (79.3%) | 57 (20.6%) |
Housing Structures by Number of Rooms in New London
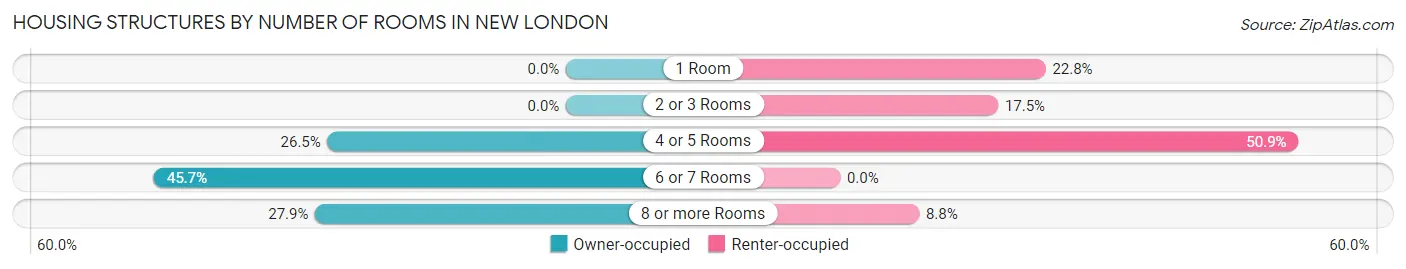
| Number of Rooms | Owner-occupied | Renter-occupied |
| 1 Room | 0 (0.0%) | 13 (22.8%) |
| 2 or 3 Rooms | 0 (0.0%) | 10 (17.5%) |
| 4 or 5 Rooms | 58 (26.5%) | 29 (50.9%) |
| 6 or 7 Rooms | 100 (45.7%) | 0 (0.0%) |
| 8 or more Rooms | 61 (27.9%) | 5 (8.8%) |
| Total | 219 (100.0%) | 57 (100.0%) |
Housing Structure by Heating Type in New London
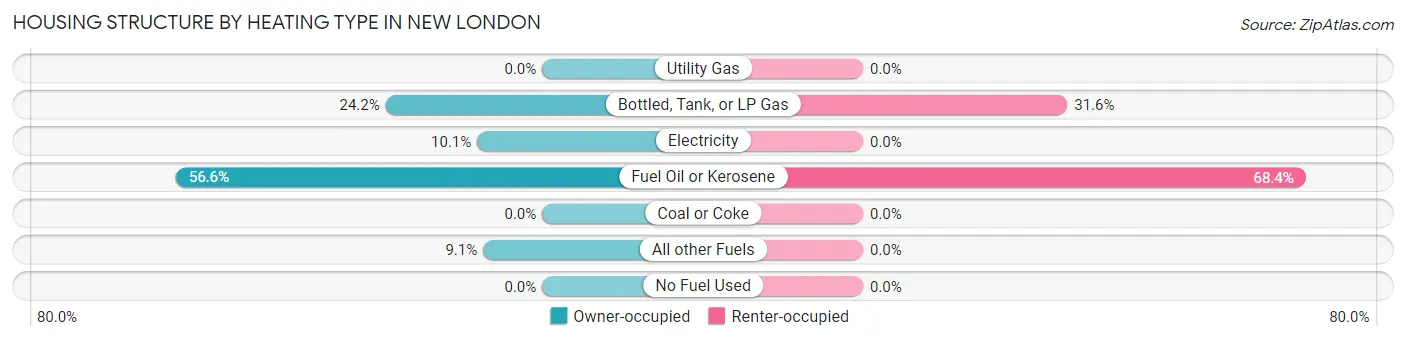
| Heating Type | Owner-occupied | Renter-occupied |
| Utility Gas | 0 (0.0%) | 0 (0.0%) |
| Bottled, Tank, or LP Gas | 53 (24.2%) | 18 (31.6%) |
| Electricity | 22 (10.1%) | 0 (0.0%) |
| Fuel Oil or Kerosene | 124 (56.6%) | 39 (68.4%) |
| Coal or Coke | 0 (0.0%) | 0 (0.0%) |
| All other Fuels | 20 (9.1%) | 0 (0.0%) |
| No Fuel Used | 0 (0.0%) | 0 (0.0%) |
| Total | 219 (100.0%) | 57 (100.0%) |
Household Vehicle Usage in New London
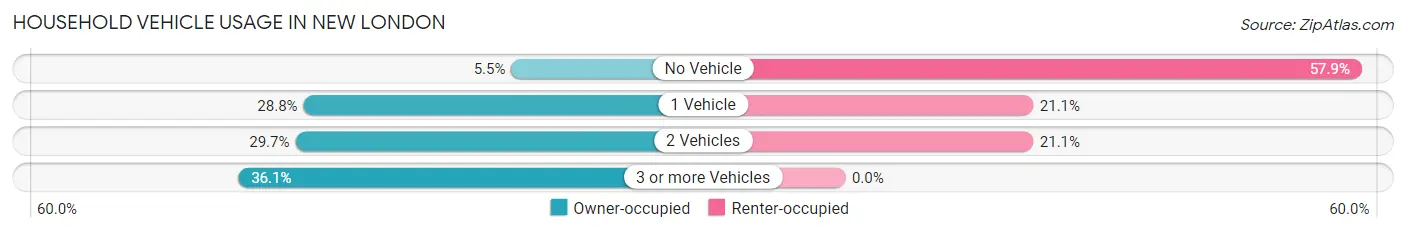
| Vehicles per Household | Owner-occupied | Renter-occupied |
| No Vehicle | 12 (5.5%) | 33 (57.9%) |
| 1 Vehicle | 63 (28.8%) | 12 (21.0%) |
| 2 Vehicles | 65 (29.7%) | 12 (21.0%) |
| 3 or more Vehicles | 79 (36.1%) | 0 (0.0%) |
| Total | 219 (100.0%) | 57 (100.0%) |
Real Estate & Mortgages in New London
Real Estate and Mortgage Overview in New London
| Characteristic | Without Mortgage | With Mortgage |
| Housing Units | 81 | 138 |
| Median Property Value | $508,900 | $314,300 |
| Median Household Income | - | - |
| Monthly Housing Costs | $1,017 | $0 |
| Real Estate Taxes | $5,139 | $0 |
Property Value by Mortgage Status in New London
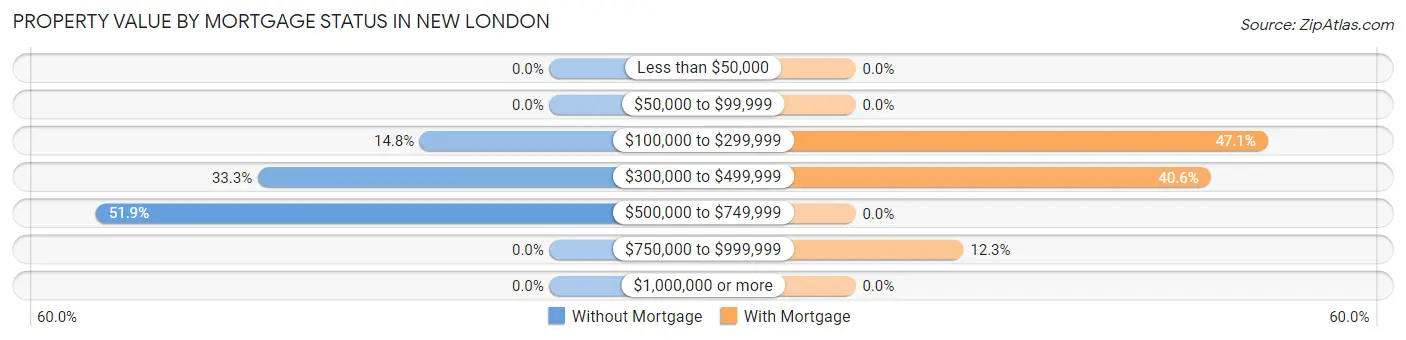
| Property Value | Without Mortgage | With Mortgage |
| Less than $50,000 | 0 (0.0%) | 0 (0.0%) |
| $50,000 to $99,999 | 0 (0.0%) | 0 (0.0%) |
| $100,000 to $299,999 | 12 (14.8%) | 65 (47.1%) |
| $300,000 to $499,999 | 27 (33.3%) | 56 (40.6%) |
| $500,000 to $749,999 | 42 (51.8%) | 0 (0.0%) |
| $750,000 to $999,999 | 0 (0.0%) | 17 (12.3%) |
| $1,000,000 or more | 0 (0.0%) | 0 (0.0%) |
| Total | 81 (100.0%) | 138 (100.0%) |
Household Income by Mortgage Status in New London
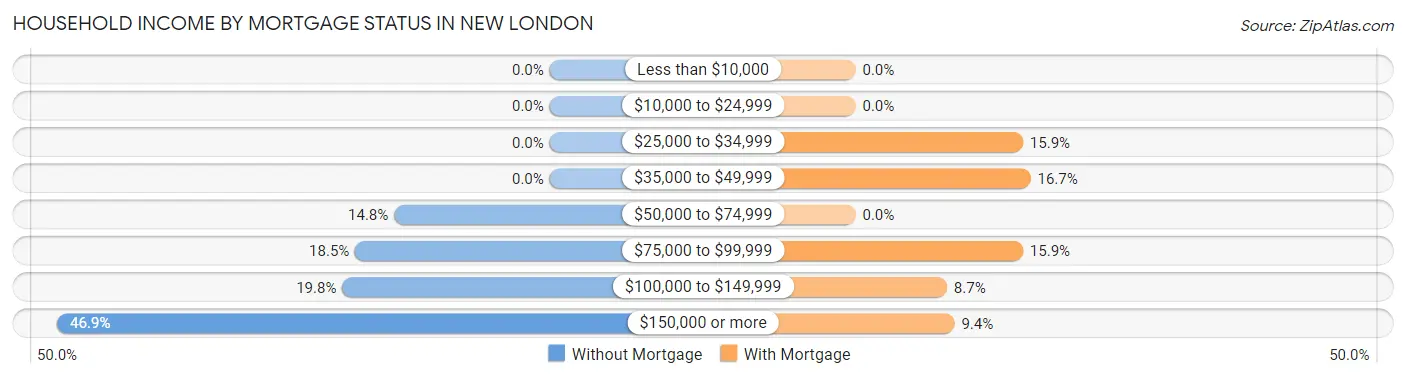
| Household Income | Without Mortgage | With Mortgage |
| Less than $10,000 | 0 (0.0%) | 0 (0.0%) |
| $10,000 to $24,999 | 0 (0.0%) | 0 (0.0%) |
| $25,000 to $34,999 | 0 (0.0%) | 22 (15.9%) |
| $35,000 to $49,999 | 0 (0.0%) | 23 (16.7%) |
| $50,000 to $74,999 | 12 (14.8%) | 0 (0.0%) |
| $75,000 to $99,999 | 15 (18.5%) | 22 (15.9%) |
| $100,000 to $149,999 | 16 (19.8%) | 12 (8.7%) |
| $150,000 or more | 38 (46.9%) | 13 (9.4%) |
| Total | 81 (100.0%) | 138 (100.0%) |
Property Value to Household Income Ratio in New London
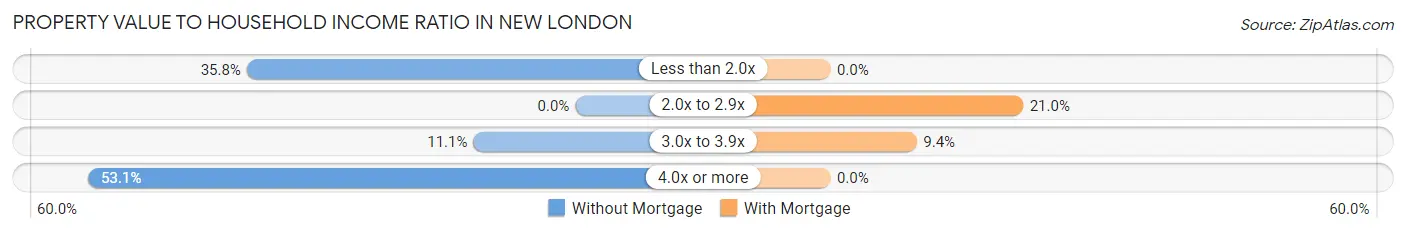
| Value-to-Income Ratio | Without Mortgage | With Mortgage |
| Less than 2.0x | 29 (35.8%) | 0 (0.0%) |
| 2.0x to 2.9x | 0 (0.0%) | 29 (21.0%) |
| 3.0x to 3.9x | 9 (11.1%) | 13 (9.4%) |
| 4.0x or more | 43 (53.1%) | 0 (0.0%) |
| Total | 81 (100.0%) | 138 (100.0%) |
Real Estate Taxes by Mortgage Status in New London
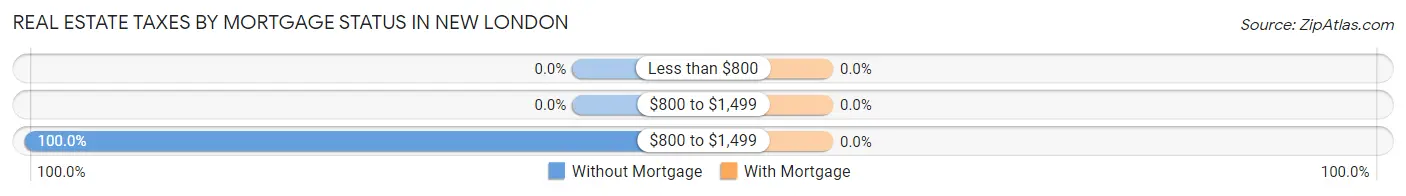
| Property Taxes | Without Mortgage | With Mortgage |
| Less than $800 | 0 (0.0%) | 0 (0.0%) |
| $800 to $1,499 | 0 (0.0%) | 0 (0.0%) |
| $800 to $1,499 | 81 (100.0%) | 0 (0.0%) |
| Total | 81 (100.0%) | 138 (100.0%) |
Health & Disability in New London
Health Insurance Coverage by Age in New London
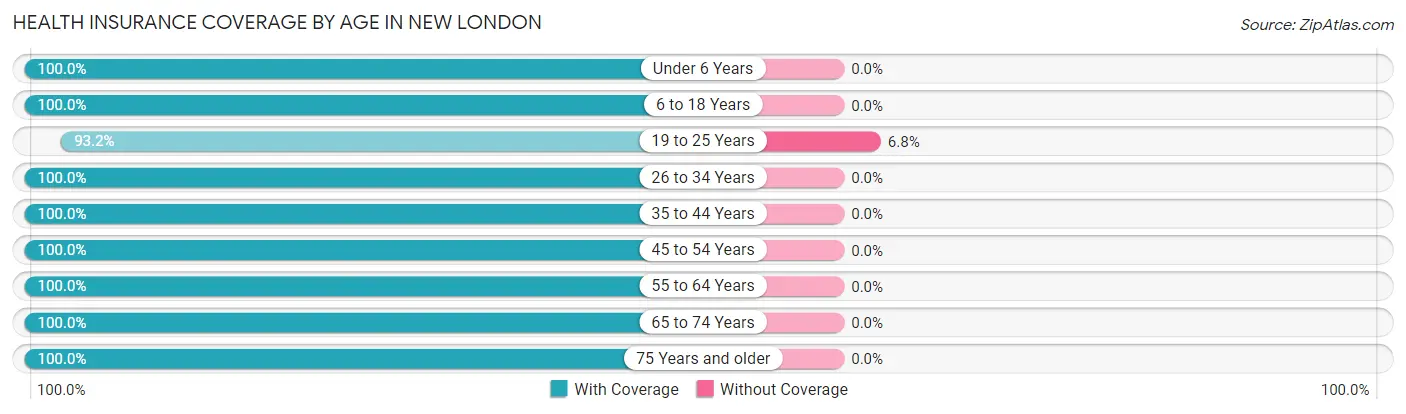
| Age Bracket | With Coverage | Without Coverage |
| Under 6 Years | 33 (100.0%) | 0 (0.0%) |
| 6 to 18 Years | 193 (100.0%) | 0 (0.0%) |
| 19 to 25 Years | 532 (93.2%) | 39 (6.8%) |
| 26 to 34 Years | 100 (100.0%) | 0 (0.0%) |
| 35 to 44 Years | 42 (100.0%) | 0 (0.0%) |
| 45 to 54 Years | 36 (100.0%) | 0 (0.0%) |
| 55 to 64 Years | 37 (100.0%) | 0 (0.0%) |
| 65 to 74 Years | 132 (100.0%) | 0 (0.0%) |
| 75 Years and older | 142 (100.0%) | 0 (0.0%) |
| Total | 1,247 (97.0%) | 39 (3.0%) |
Health Insurance Coverage by Citizenship Status in New London
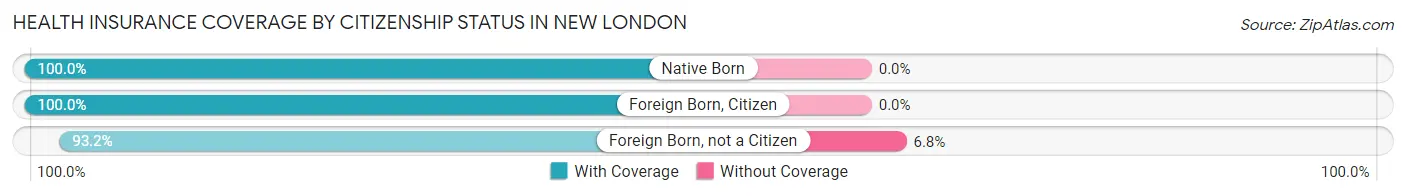
| Citizenship Status | With Coverage | Without Coverage |
| Native Born | 33 (100.0%) | 0 (0.0%) |
| Foreign Born, Citizen | 193 (100.0%) | 0 (0.0%) |
| Foreign Born, not a Citizen | 532 (93.2%) | 39 (6.8%) |
Health Insurance Coverage by Household Income in New London
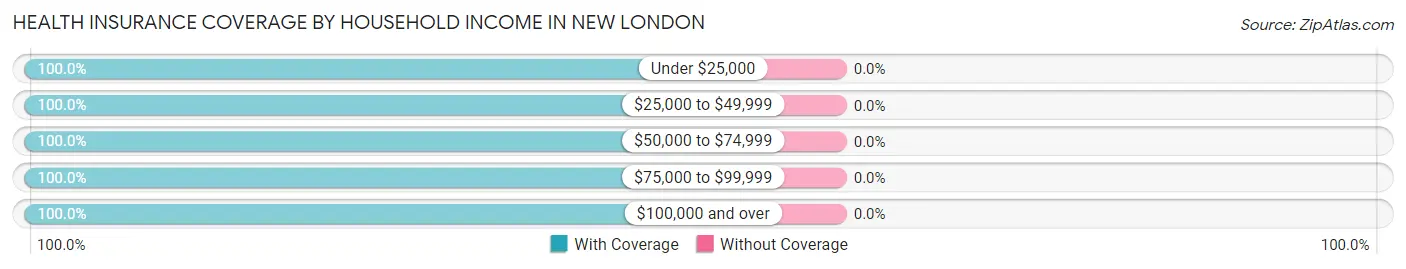
| Household Income | With Coverage | Without Coverage |
| Under $25,000 | 50 (100.0%) | 0 (0.0%) |
| $25,000 to $49,999 | 60 (100.0%) | 0 (0.0%) |
| $50,000 to $74,999 | 94 (100.0%) | 0 (0.0%) |
| $75,000 to $99,999 | 45 (100.0%) | 0 (0.0%) |
| $100,000 and over | 321 (100.0%) | 0 (0.0%) |
Public vs Private Health Insurance Coverage by Age in New London
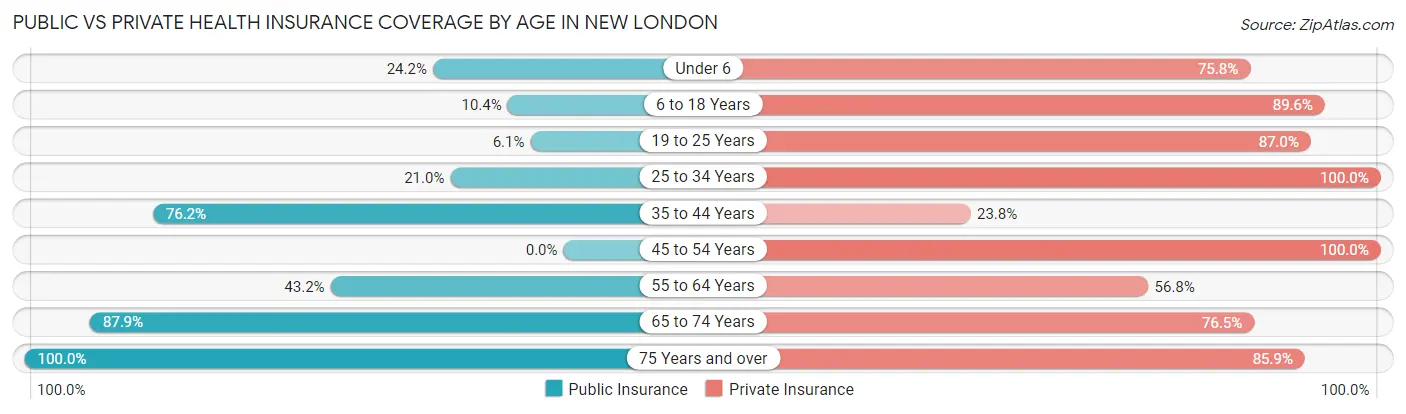
| Age Bracket | Public Insurance | Private Insurance |
| Under 6 | 8 (24.2%) | 25 (75.8%) |
| 6 to 18 Years | 20 (10.4%) | 173 (89.6%) |
| 19 to 25 Years | 35 (6.1%) | 497 (87.0%) |
| 25 to 34 Years | 21 (21.0%) | 100 (100.0%) |
| 35 to 44 Years | 32 (76.2%) | 10 (23.8%) |
| 45 to 54 Years | 0 (0.0%) | 36 (100.0%) |
| 55 to 64 Years | 16 (43.2%) | 21 (56.8%) |
| 65 to 74 Years | 116 (87.9%) | 101 (76.5%) |
| 75 Years and over | 142 (100.0%) | 122 (85.9%) |
| Total | 390 (30.3%) | 1,085 (84.4%) |
Disability Status by Sex by Age in New London
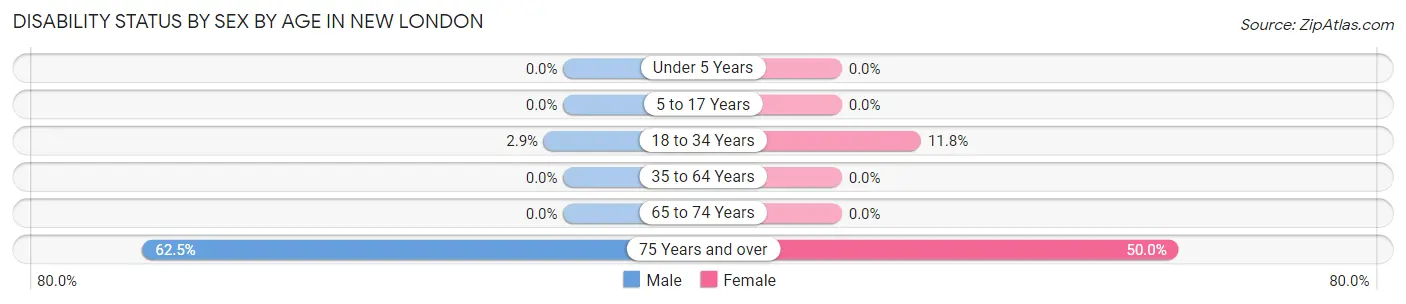
| Age Bracket | Male | Female |
| Under 5 Years | 0 (0.0%) | 0 (0.0%) |
| 5 to 17 Years | 0 (0.0%) | 0 (0.0%) |
| 18 to 34 Years | 9 (2.9%) | 56 (11.8%) |
| 35 to 64 Years | 0 (0.0%) | 0 (0.0%) |
| 65 to 74 Years | 0 (0.0%) | 0 (0.0%) |
| 75 Years and over | 25 (62.5%) | 51 (50.0%) |
Disability Class by Sex by Age in New London
Disability Class: Hearing Difficulty
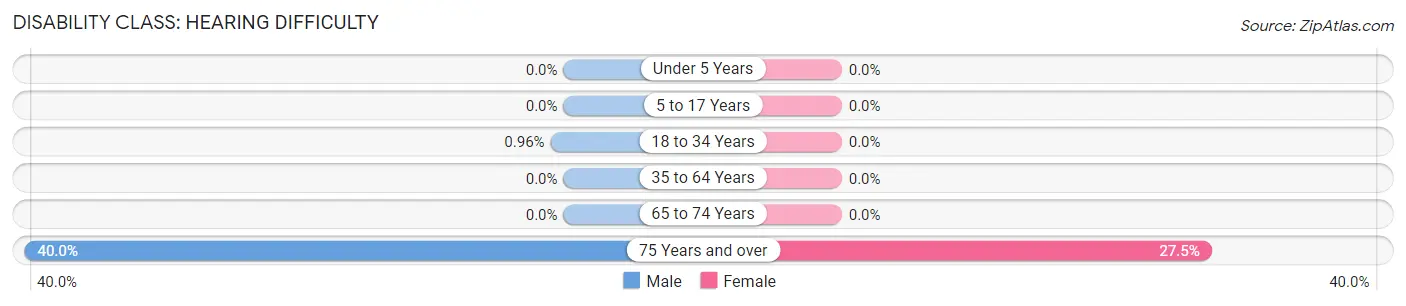
| Age Bracket | Male | Female |
| Under 5 Years | 0 (0.0%) | 0 (0.0%) |
| 5 to 17 Years | 0 (0.0%) | 0 (0.0%) |
| 18 to 34 Years | 3 (1.0%) | 0 (0.0%) |
| 35 to 64 Years | 0 (0.0%) | 0 (0.0%) |
| 65 to 74 Years | 0 (0.0%) | 0 (0.0%) |
| 75 Years and over | 16 (40.0%) | 28 (27.5%) |
Disability Class: Vision Difficulty
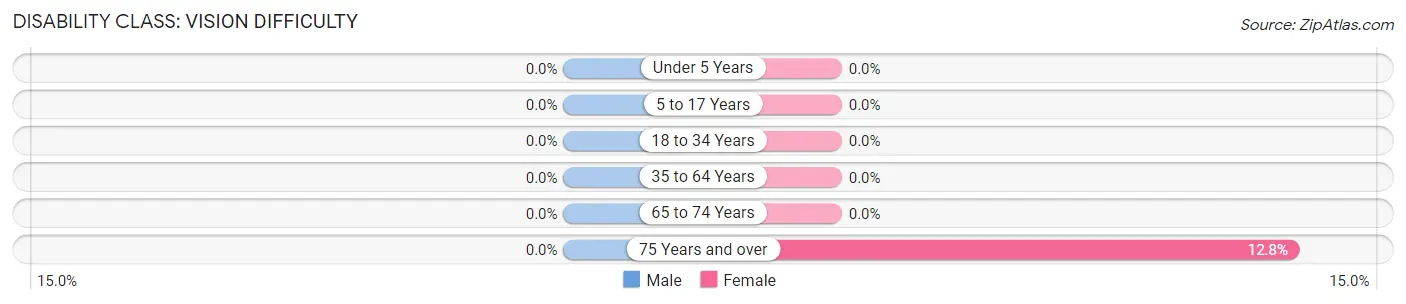
| Age Bracket | Male | Female |
| Under 5 Years | 0 (0.0%) | 0 (0.0%) |
| 5 to 17 Years | 0 (0.0%) | 0 (0.0%) |
| 18 to 34 Years | 0 (0.0%) | 0 (0.0%) |
| 35 to 64 Years | 0 (0.0%) | 0 (0.0%) |
| 65 to 74 Years | 0 (0.0%) | 0 (0.0%) |
| 75 Years and over | 0 (0.0%) | 13 (12.8%) |
Disability Class: Cognitive Difficulty
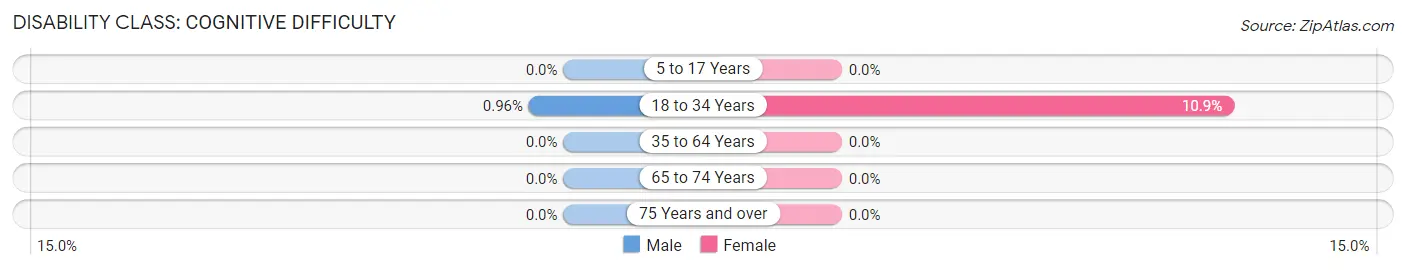
| Age Bracket | Male | Female |
| 5 to 17 Years | 0 (0.0%) | 0 (0.0%) |
| 18 to 34 Years | 3 (1.0%) | 52 (10.9%) |
| 35 to 64 Years | 0 (0.0%) | 0 (0.0%) |
| 65 to 74 Years | 0 (0.0%) | 0 (0.0%) |
| 75 Years and over | 0 (0.0%) | 0 (0.0%) |
Disability Class: Ambulatory Difficulty
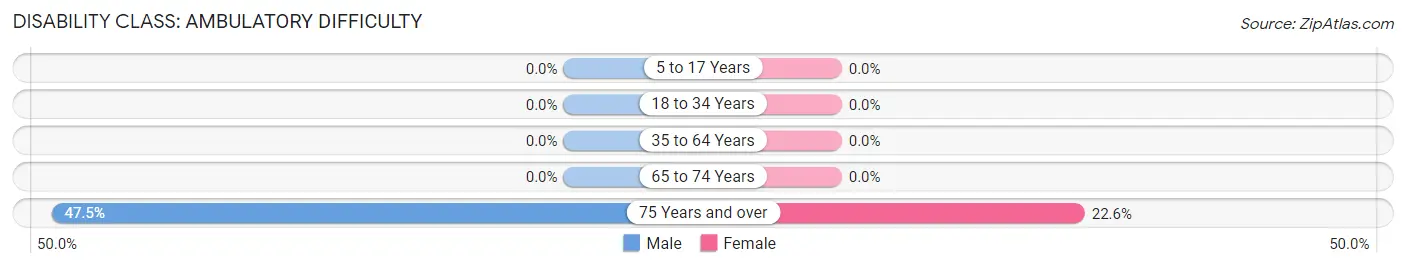
| Age Bracket | Male | Female |
| 5 to 17 Years | 0 (0.0%) | 0 (0.0%) |
| 18 to 34 Years | 0 (0.0%) | 0 (0.0%) |
| 35 to 64 Years | 0 (0.0%) | 0 (0.0%) |
| 65 to 74 Years | 0 (0.0%) | 0 (0.0%) |
| 75 Years and over | 19 (47.5%) | 23 (22.6%) |
Disability Class: Self-Care Difficulty
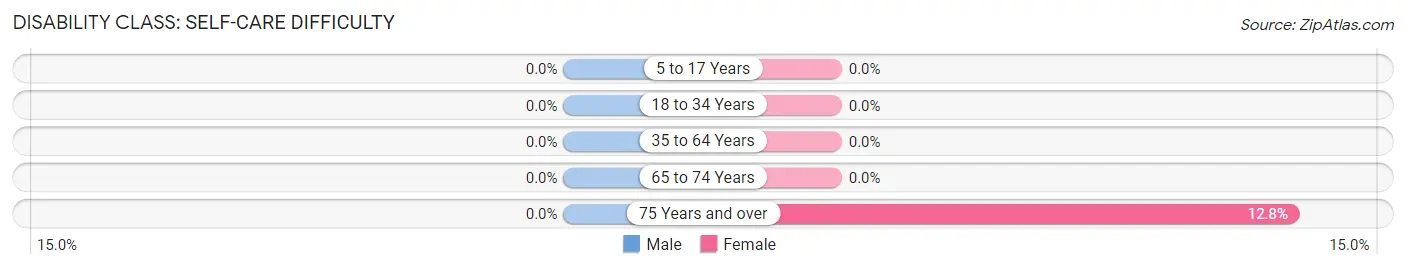
| Age Bracket | Male | Female |
| 5 to 17 Years | 0 (0.0%) | 0 (0.0%) |
| 18 to 34 Years | 0 (0.0%) | 0 (0.0%) |
| 35 to 64 Years | 0 (0.0%) | 0 (0.0%) |
| 65 to 74 Years | 0 (0.0%) | 0 (0.0%) |
| 75 Years and over | 0 (0.0%) | 13 (12.8%) |
Technology Access in New London
Computing Device Access in New London
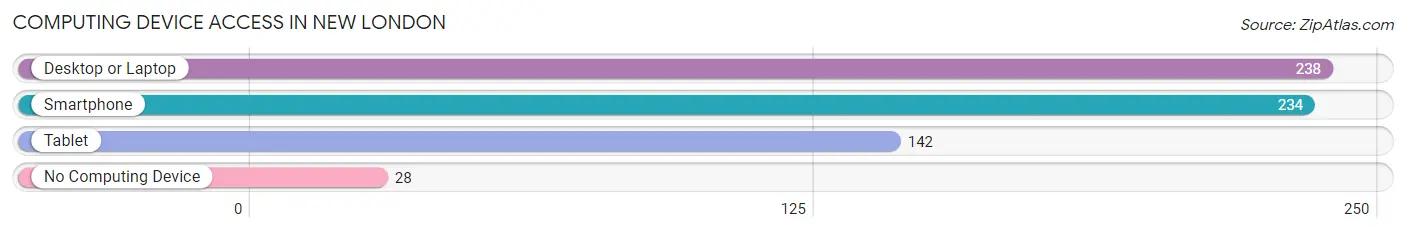
| Device Type | # Households | % Households |
| Desktop or Laptop | 238 | 86.2% |
| Smartphone | 234 | 84.8% |
| Tablet | 142 | 51.4% |
| No Computing Device | 28 | 10.1% |
| Total | 276 | 100.0% |
Internet Access in New London
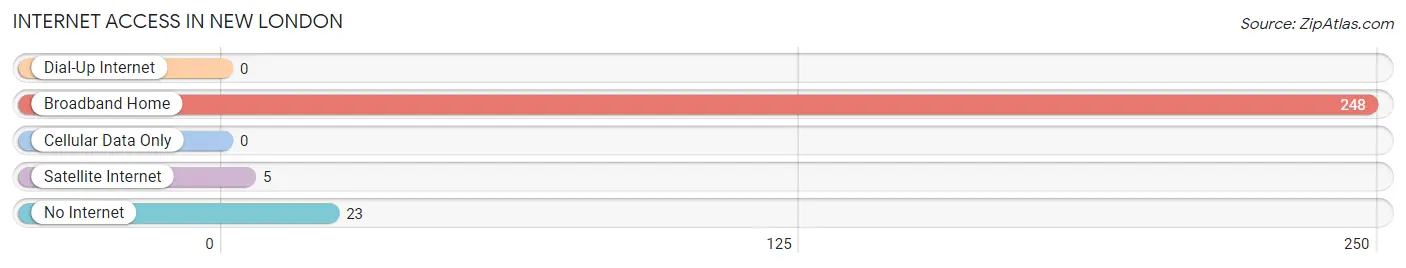
| Internet Type | # Households | % Households |
| Dial-Up Internet | 0 | 0.0% |
| Broadband Home | 248 | 89.9% |
| Cellular Data Only | 0 | 0.0% |
| Satellite Internet | 5 | 1.8% |
| No Internet | 23 | 8.3% |
| Total | 276 | 100.0% |
New London Summary
New London, New Hampshire is a small town located in the Merrimack Valley region of the state. It is situated in the southwestern corner of the state, just north of the Massachusetts border. The town is home to a population of approximately 4,000 people, and is part of the larger town of Sunapee.
History
The area that is now New London was first settled in 1763 by a group of settlers from Massachusetts. The town was originally known as "Newbury," but was later changed to "New London" in 1767. The town was incorporated in 1779, and was named after the city of London in England.
The town was an important center of commerce and industry in the early 19th century. It was home to several mills, including a woolen mill, a paper mill, and a grist mill. The town also had a thriving shipbuilding industry, and was home to several shipyards.
In the late 19th century, the town began to decline in importance as the mills and shipyards closed. The town's economy shifted to focus on tourism, and the town became a popular summer destination for visitors from Boston and New York.
Geography
New London is located in the southwestern corner of New Hampshire, just north of the Massachusetts border. The town is situated in the Merrimack Valley region of the state, and is bordered by the towns of Sunapee, Wilmot, and Springfield.
The town is located in a hilly area, with several small mountains and hills. The highest point in the town is Mount Kearsarge, which has an elevation of 2,937 feet. The town is also home to several lakes, including Sunapee Lake, Pleasant Lake, and Newfound Lake.
Economy
The economy of New London is largely based on tourism. The town is home to several resorts and hotels, as well as a number of restaurants and shops. The town is also home to several small businesses, including a brewery, a winery, and a distillery.
The town is also home to several educational institutions, including Colby-Sawyer College and the New London Hospital. The town is also home to the New London Historical Society, which is dedicated to preserving the town's history.
Demographics
As of the 2010 census, the population of New London was 4,099. The racial makeup of the town was 97.2% White, 0.7% African American, 0.3% Native American, 0.4% Asian, 0.1% Pacific Islander, 0.3% from other races, and 1.0% from two or more races. Hispanic or Latino of any race were 1.2% of the population.
The median household income in the town was $50,938, and the median family income was $62,917. The per capita income for the town was $27,945. About 5.2% of families and 8.2% of the population were below the poverty line, including 8.7% of those under age 18 and 5.3% of those age 65 or over.
New London is a small town with a rich history and a vibrant economy. The town is home to several educational institutions, businesses, and tourist attractions, and is a popular destination for visitors from all over the world. The town is also home to a diverse population, with a variety of racial and ethnic backgrounds.
Common Questions
What is Per Capita Income in New London?
Per Capita income in New London is $27,758.
What is the Median Family Income in New London?
Median Family Income in New London is $116,979.
What is the Median Household income in New London?
Median Household Income in New London is $83,796.
What is Inequality or Gini Index in New London?
Inequality or Gini Index in New London is 0.47.
What is the Total Population of New London?
Total Population of New London is 1,340.
What is the Total Male Population of New London?
Total Male Population of New London is 543.
What is the Total Female Population of New London?
Total Female Population of New London is 797.
What is the Ratio of Males per 100 Females in New London?
There are 68.13 Males per 100 Females in New London.
What is the Ratio of Females per 100 Males in New London?
There are 146.78 Females per 100 Males in New London.
What is the Median Population Age in New London?
Median Population Age in New London is 21.7 Years.
What is the Average Family Size in New London
Average Family Size in New London is 2.7 People.
What is the Average Household Size in New London
Average Household Size in New London is 2.1 People.
How Large is the Labor Force in New London?
There are 384 People in the Labor Forcein in New London.
What is the Percentage of People in the Labor Force in New London?
30.5% of People are in the Labor Force in New London.
What is the Unemployment Rate in New London?
Unemployment Rate in New London is 0.8%.