Winchester, NH Map & Demographics
Winchester Map
Winchester Overview
$31,804
PER CAPITA INCOME
$45,298
AVG HOUSEHOLD INCOME
61.8%
WAGE / INCOME GAP [ % ]
38.2¢/ $1
WAGE / INCOME GAP [ $ ]
0.46
INEQUALITY / GINI INDEX
1,369
TOTAL POPULATION
763
MALE POPULATION
606
FEMALE POPULATION
125.91
MALES / 100 FEMALES
79.42
FEMALES / 100 MALES
42.7
MEDIAN AGE
3.1
AVG FAMILY SIZE
2.2
AVG HOUSEHOLD SIZE
638
LABOR FORCE [ PEOPLE ]
59.0%
PERCENT IN LABOR FORCE
6.0%
UNEMPLOYMENT RATE
Winchester Zip Codes
Winchester Area Codes
Income in Winchester
Income Overview in Winchester
| Characteristic | Number | Measure |
| Per Capita Income | 1,369 | $31,804 |
| Median Family Income | 309 | $0 |
| Mean Family Income | 309 | $84,986 |
| Median Household Income | 627 | $45,298 |
| Mean Household Income | 627 | $66,356 |
| Income Deficit | 309 | $0 |
| Wage / Income Gap (%) | 1,369 | 61.84% |
| Wage / Income Gap ($) | 1,369 | 38.16¢ per $1 |
| Gini / Inequality Index | 1,369 | 0.46 |
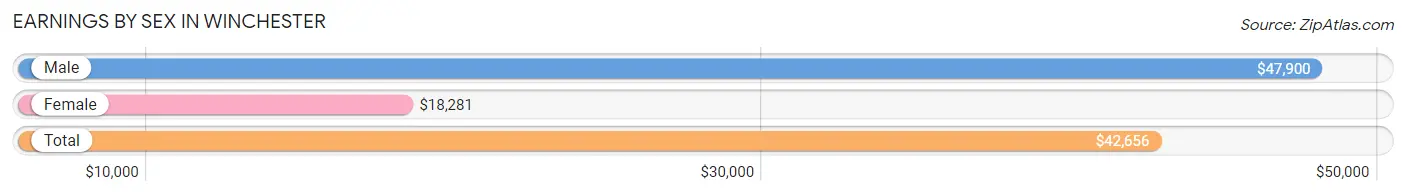
Earnings by Sex in Winchester
Average Earnings in Winchester are $42,656, $47,900 for men and $18,281 for women, a difference of 61.8%.
| Sex | Number | Average Earnings |
| Male | 460 (67.9%) | $47,900 |
| Female | 217 (32.1%) | $18,281 |
| Total | 677 (100.0%) | $42,656 |
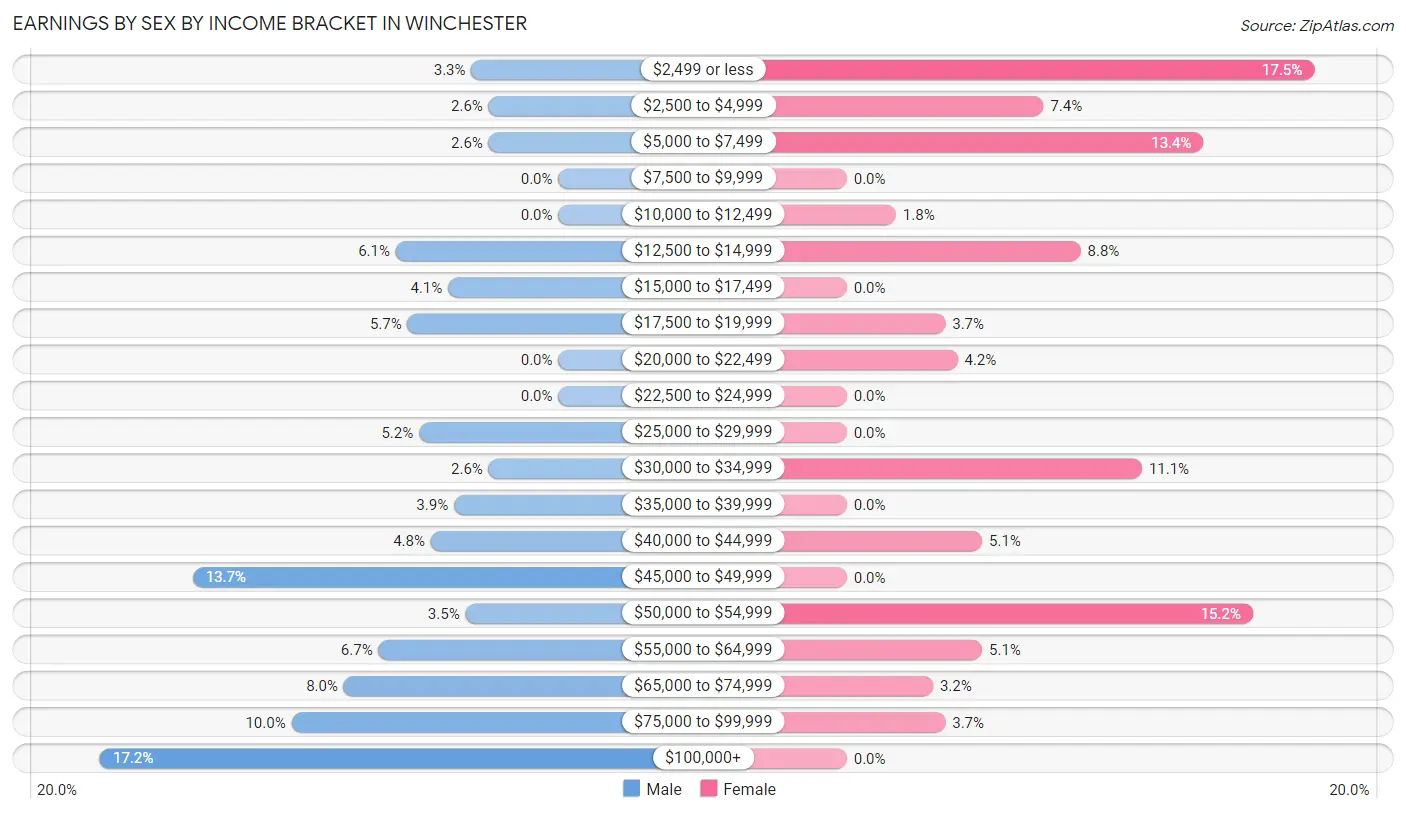
Earnings by Sex by Income Bracket in Winchester
The most common earnings brackets in Winchester are $100,000+ for men (79 | 17.2%) and $2,499 or less for women (38 | 17.5%).
| Income | Male | Female |
| $2,499 or less | 15 (3.3%) | 38 (17.5%) |
| $2,500 to $4,999 | 12 (2.6%) | 16 (7.4%) |
| $5,000 to $7,499 | 12 (2.6%) | 29 (13.4%) |
| $7,500 to $9,999 | 0 (0.0%) | 0 (0.0%) |
| $10,000 to $12,499 | 0 (0.0%) | 4 (1.8%) |
| $12,500 to $14,999 | 28 (6.1%) | 19 (8.8%) |
| $15,000 to $17,499 | 19 (4.1%) | 0 (0.0%) |
| $17,500 to $19,999 | 26 (5.7%) | 8 (3.7%) |
| $20,000 to $22,499 | 0 (0.0%) | 9 (4.2%) |
| $22,500 to $24,999 | 0 (0.0%) | 0 (0.0%) |
| $25,000 to $29,999 | 24 (5.2%) | 0 (0.0%) |
| $30,000 to $34,999 | 12 (2.6%) | 24 (11.1%) |
| $35,000 to $39,999 | 18 (3.9%) | 0 (0.0%) |
| $40,000 to $44,999 | 22 (4.8%) | 11 (5.1%) |
| $45,000 to $49,999 | 63 (13.7%) | 0 (0.0%) |
| $50,000 to $54,999 | 16 (3.5%) | 33 (15.2%) |
| $55,000 to $64,999 | 31 (6.7%) | 11 (5.1%) |
| $65,000 to $74,999 | 37 (8.0%) | 7 (3.2%) |
| $75,000 to $99,999 | 46 (10.0%) | 8 (3.7%) |
| $100,000+ | 79 (17.2%) | 0 (0.0%) |
| Total | 460 (100.0%) | 217 (100.0%) |
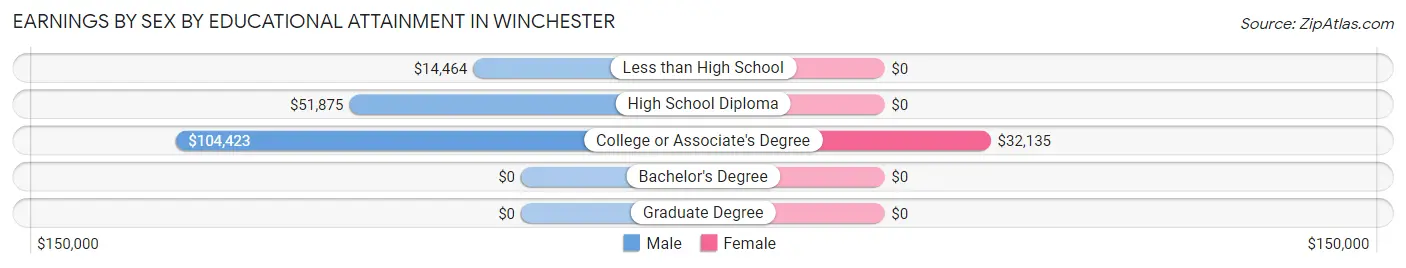
Earnings by Sex by Educational Attainment in Winchester
Average earnings in Winchester are $62,581 for men and $30,208 for women, a difference of 51.7%. Men with an educational attainment of college or associate's degree enjoy the highest average annual earnings of $104,423, while those with less than high school education earn the least with $14,464. Women with an educational attainment of college or associate's degree earn the most with the average annual earnings of $32,135, while those with college or associate's degree education have the smallest earnings of $32,135.
| Educational Attainment | Male Income | Female Income |
| Less than High School | $14,464 | $0 |
| High School Diploma | $51,875 | $0 |
| College or Associate's Degree | $104,423 | $32,135 |
| Bachelor's Degree | - | - |
| Graduate Degree | - | - |
| Total | $62,581 | $30,208 |
Family Income in Winchester
Family Income Brackets in Winchester
According to the Winchester family income data, there are 61 families falling into the $100,000 to $149,999 income range, which is the most common income bracket and makes up 19.7% of all families. Conversely, the $75,000 to $99,999 income bracket is the least frequent group with only 8 families (2.6%) belonging to this category.
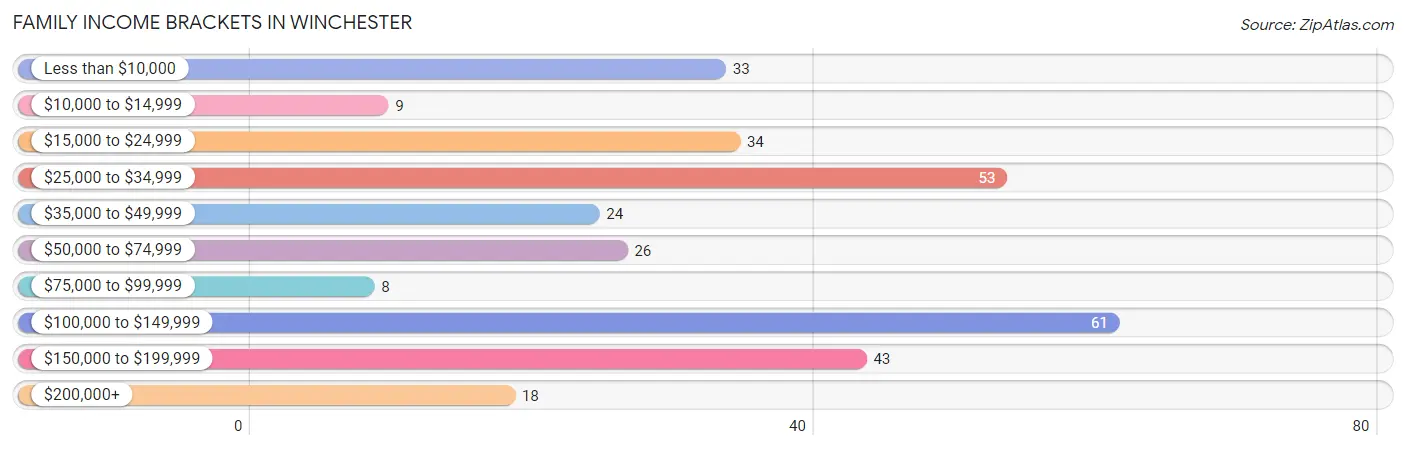
| Income Bracket | # Families | % Families |
| Less than $10,000 | 33 | 10.7% |
| $10,000 to $14,999 | 9 | 2.9% |
| $15,000 to $24,999 | 34 | 11.0% |
| $25,000 to $34,999 | 53 | 17.2% |
| $35,000 to $49,999 | 24 | 7.8% |
| $50,000 to $74,999 | 26 | 8.4% |
| $75,000 to $99,999 | 8 | 2.6% |
| $100,000 to $149,999 | 61 | 19.7% |
| $150,000 to $199,999 | 43 | 13.9% |
| $200,000+ | 18 | 5.8% |
Family Income by Famaliy Size in Winchester
2-person families (171 | 55.3%) account for the highest median family income in Winchester with $103,906 per family, while 2-person families (171 | 55.3%) have the highest median income of $51,953 per family member.
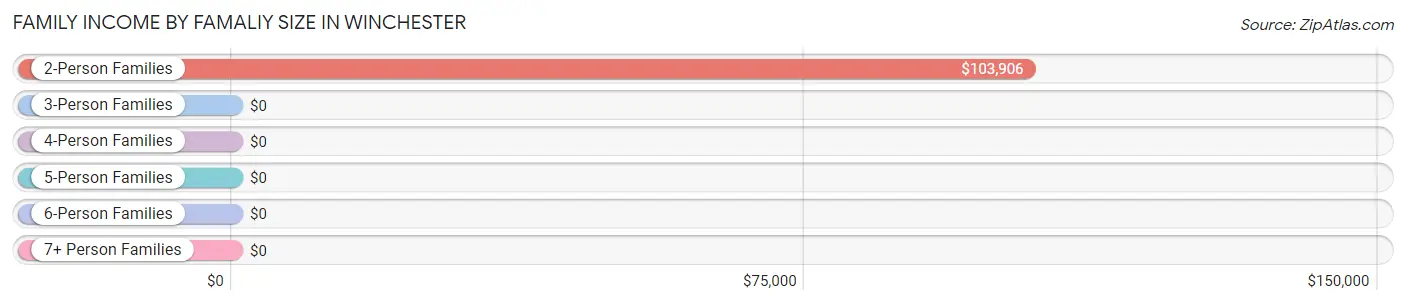
| Income Bracket | # Families | Median Income |
| 2-Person Families | 171 (55.3%) | $103,906 |
| 3-Person Families | 74 (23.9%) | $0 |
| 4-Person Families | 35 (11.3%) | $0 |
| 5-Person Families | 29 (9.4%) | $0 |
| 6-Person Families | 0 (0.0%) | $0 |
| 7+ Person Families | 0 (0.0%) | $0 |
| Total | 309 (100.0%) | $0 |
Family Income by Number of Earners in Winchester
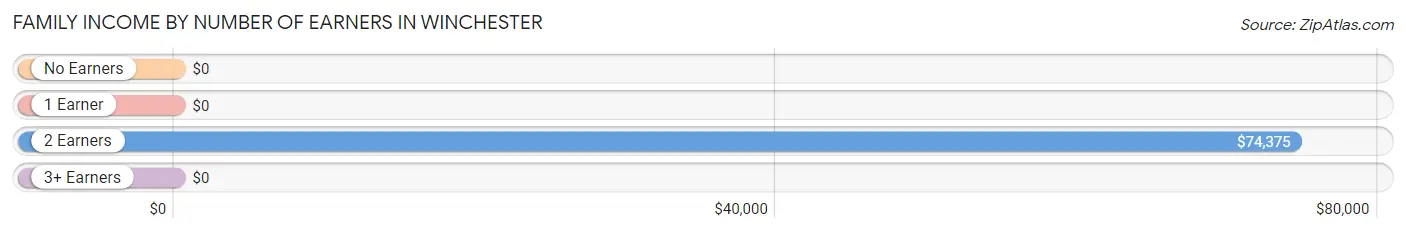
| Number of Earners | # Families | Median Income |
| No Earners | 53 (17.2%) | $0 |
| 1 Earner | 147 (47.6%) | $0 |
| 2 Earners | 93 (30.1%) | $74,375 |
| 3+ Earners | 16 (5.2%) | $0 |
| Total | 309 (100.0%) | $0 |
Household Income in Winchester
Household Income Brackets in Winchester
With 123 households falling in the category, the $15,000 to $24,999 income range is the most frequent in Winchester, accounting for 19.6% of all households. In contrast, only 9 households (1.4%) fall into the $10,000 to $14,999 income bracket, making it the least populous group.
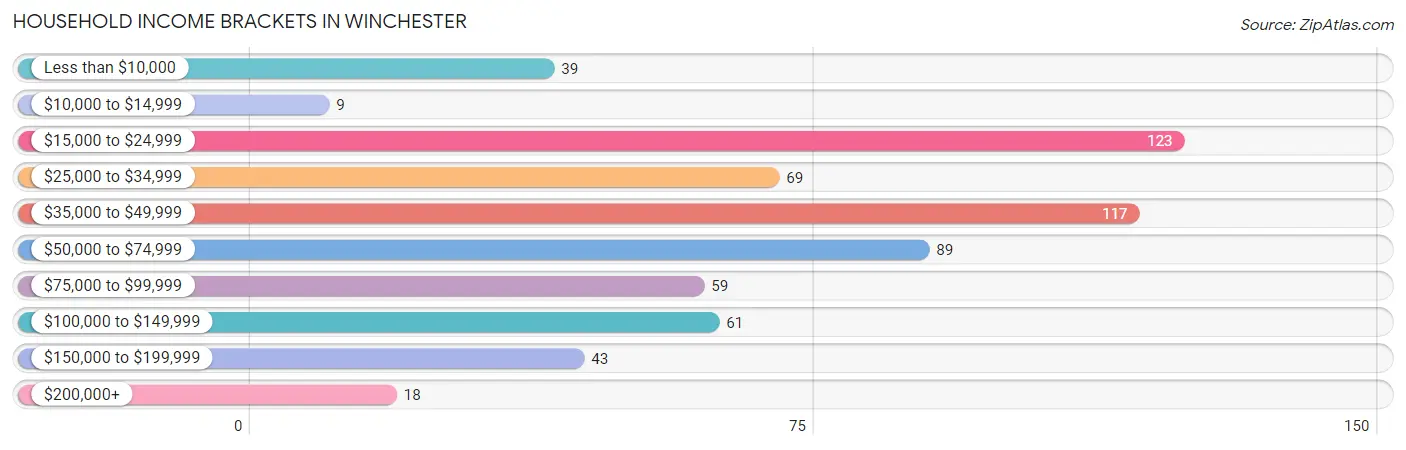
| Income Bracket | # Households | % Households |
| Less than $10,000 | 39 | 6.2% |
| $10,000 to $14,999 | 9 | 1.4% |
| $15,000 to $24,999 | 123 | 19.6% |
| $25,000 to $34,999 | 69 | 11.0% |
| $35,000 to $49,999 | 117 | 18.7% |
| $50,000 to $74,999 | 89 | 14.2% |
| $75,000 to $99,999 | 59 | 9.4% |
| $100,000 to $149,999 | 61 | 9.7% |
| $150,000 to $199,999 | 43 | 6.9% |
| $200,000+ | 18 | 2.9% |
Household Income by Householder Age in Winchester
The median household income in Winchester is $45,298, with the highest median household income of $73,125 found in the 45 to 64 years age bracket for the primary householder. A total of 254 households (40.5%) fall into this category. Meanwhile, the 15 to 24 years age bracket for the primary householder has the lowest median household income of $0, with 51 households (8.1%) in this group.
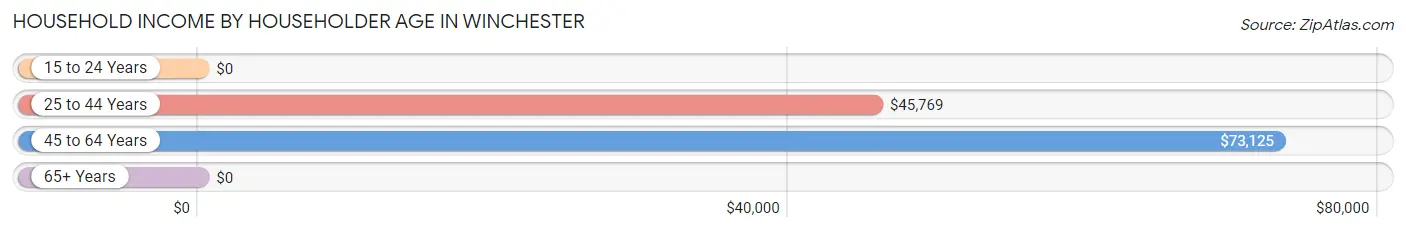
| Income Bracket | # Households | Median Income |
| 15 to 24 Years | 51 (8.1%) | $0 |
| 25 to 44 Years | 176 (28.1%) | $45,769 |
| 45 to 64 Years | 254 (40.5%) | $73,125 |
| 65+ Years | 146 (23.3%) | $0 |
| Total | 627 (100.0%) | $45,298 |
Poverty in Winchester
Income Below Poverty by Sex and Age in Winchester
With 24.5% poverty level for males and 43.9% for females among the residents of Winchester, under 5 year old males and 18 to 24 year old females are the most vulnerable to poverty, with 26 males (100.0%) and 29 females (87.9%) in their respective age groups living below the poverty level.
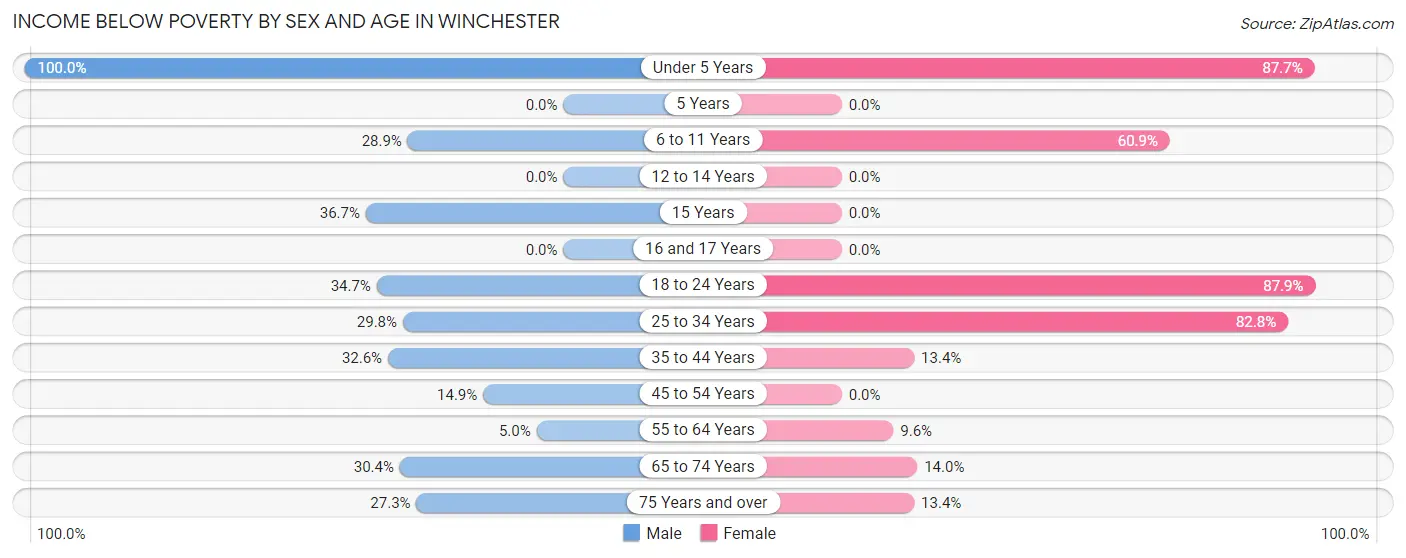
| Age Bracket | Male | Female |
| Under 5 Years | 26 (100.0%) | 136 (87.7%) |
| 5 Years | 0 (0.0%) | 0 (0.0%) |
| 6 to 11 Years | 13 (28.9%) | 14 (60.9%) |
| 12 to 14 Years | 0 (0.0%) | 0 (0.0%) |
| 15 Years | 11 (36.7%) | 0 (0.0%) |
| 16 and 17 Years | 0 (0.0%) | 0 (0.0%) |
| 18 to 24 Years | 35 (34.6%) | 29 (87.9%) |
| 25 to 34 Years | 28 (29.8%) | 53 (82.8%) |
| 35 to 44 Years | 28 (32.6%) | 9 (13.4%) |
| 45 to 54 Years | 14 (14.9%) | 0 (0.0%) |
| 55 to 64 Years | 9 (5.0%) | 9 (9.6%) |
| 65 to 74 Years | 17 (30.4%) | 7 (14.0%) |
| 75 Years and over | 6 (27.3%) | 9 (13.4%) |
| Total | 187 (24.5%) | 266 (43.9%) |
Income Above Poverty by Sex and Age in Winchester
According to the poverty statistics in Winchester, males aged 12 to 14 years and females aged 45 to 54 years are the age groups that are most secure financially, with 100.0% of males and 100.0% of females in these age groups living above the poverty line.
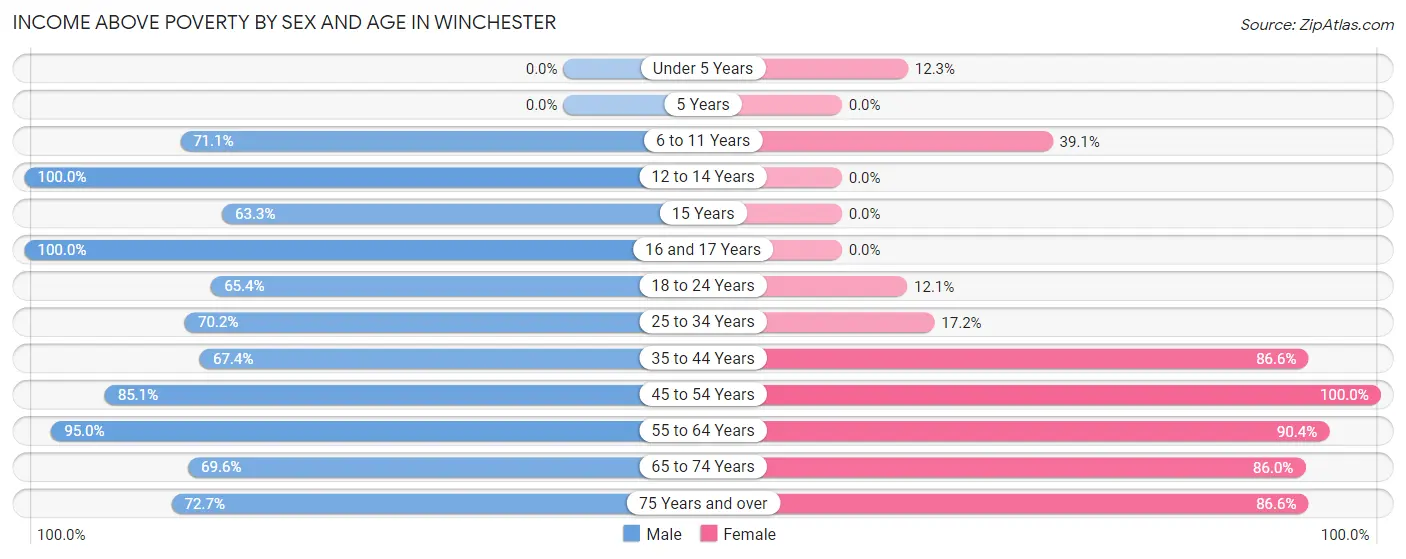
| Age Bracket | Male | Female |
| Under 5 Years | 0 (0.0%) | 19 (12.3%) |
| 5 Years | 0 (0.0%) | 0 (0.0%) |
| 6 to 11 Years | 32 (71.1%) | 9 (39.1%) |
| 12 to 14 Years | 9 (100.0%) | 0 (0.0%) |
| 15 Years | 19 (63.3%) | 0 (0.0%) |
| 16 and 17 Years | 19 (100.0%) | 0 (0.0%) |
| 18 to 24 Years | 66 (65.3%) | 4 (12.1%) |
| 25 to 34 Years | 66 (70.2%) | 11 (17.2%) |
| 35 to 44 Years | 58 (67.4%) | 58 (86.6%) |
| 45 to 54 Years | 80 (85.1%) | 53 (100.0%) |
| 55 to 64 Years | 172 (95.0%) | 85 (90.4%) |
| 65 to 74 Years | 39 (69.6%) | 43 (86.0%) |
| 75 Years and over | 16 (72.7%) | 58 (86.6%) |
| Total | 576 (75.5%) | 340 (56.1%) |
Income Below Poverty Among Married-Couple Families in Winchester
The poverty statistics for married-couple families in Winchester show that 13.8% or 24 of the total 174 families live below the poverty line. Families with 3 or 4 children have the highest poverty rate of 55.2%, comprising of 16 families. On the other hand, families with 1 or 2 children have the lowest poverty rate of 0.0%, which includes 0 families.
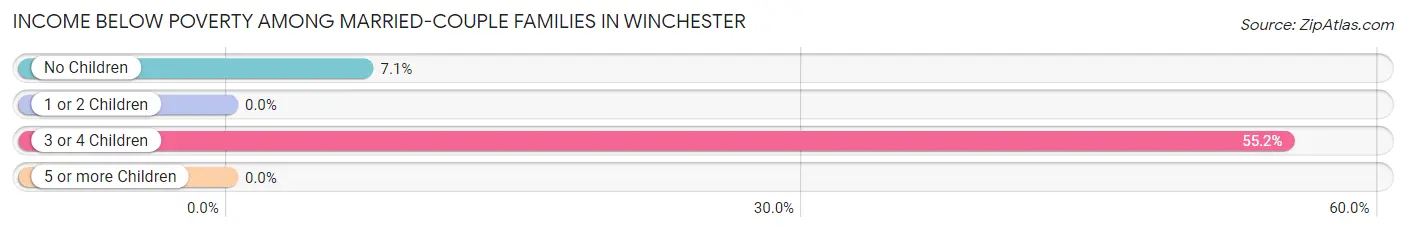
| Children | Above Poverty | Below Poverty |
| No Children | 105 (92.9%) | 8 (7.1%) |
| 1 or 2 Children | 32 (100.0%) | 0 (0.0%) |
| 3 or 4 Children | 13 (44.8%) | 16 (55.2%) |
| 5 or more Children | 0 (0.0%) | 0 (0.0%) |
| Total | 150 (86.2%) | 24 (13.8%) |
Income Below Poverty Among Single-Parent Households in Winchester
According to the poverty data in Winchester, 100.0% or 26 single-father households and 46.8% or 51 single-mother households are living below the poverty line. Among single-father households, those with 1 or 2 children have the highest poverty rate, with 26 households (100.0%) experiencing poverty. Likewise, among single-mother households, those with 3 or 4 children have the highest poverty rate, with 8 households (100.0%) falling below the poverty line.
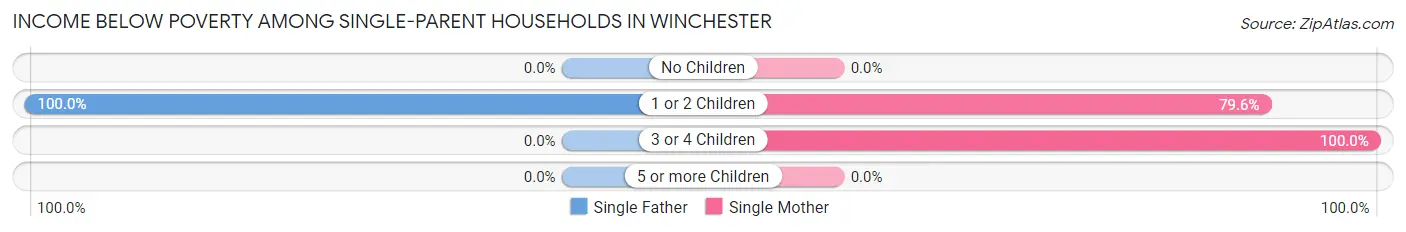
| Children | Single Father | Single Mother |
| No Children | 0 (0.0%) | 0 (0.0%) |
| 1 or 2 Children | 26 (100.0%) | 43 (79.6%) |
| 3 or 4 Children | 0 (0.0%) | 8 (100.0%) |
| 5 or more Children | 0 (0.0%) | 0 (0.0%) |
| Total | 26 (100.0%) | 51 (46.8%) |
Income Below Poverty Among Married-Couple vs Single-Parent Households in Winchester
The poverty data for Winchester shows that 24 of the married-couple family households (13.8%) and 77 of the single-parent households (57.0%) are living below the poverty level. Within the married-couple family households, those with 3 or 4 children have the highest poverty rate, with 16 households (55.2%) falling below the poverty line. Among the single-parent households, those with 3 or 4 children have the highest poverty rate, with 8 household (100.0%) living below poverty.
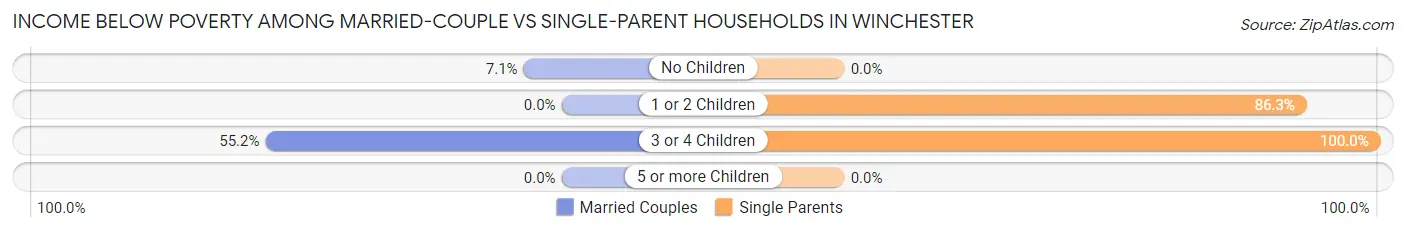
| Children | Married-Couple Families | Single-Parent Households |
| No Children | 8 (7.1%) | 0 (0.0%) |
| 1 or 2 Children | 0 (0.0%) | 69 (86.3%) |
| 3 or 4 Children | 16 (55.2%) | 8 (100.0%) |
| 5 or more Children | 0 (0.0%) | 0 (0.0%) |
| Total | 24 (13.8%) | 77 (57.0%) |
Race in Winchester
The most populous races in Winchester are White / Caucasian (1,273 | 93.0%), Two or more Races (84 | 6.1%), and Hispanic or Latino (20 | 1.5%).
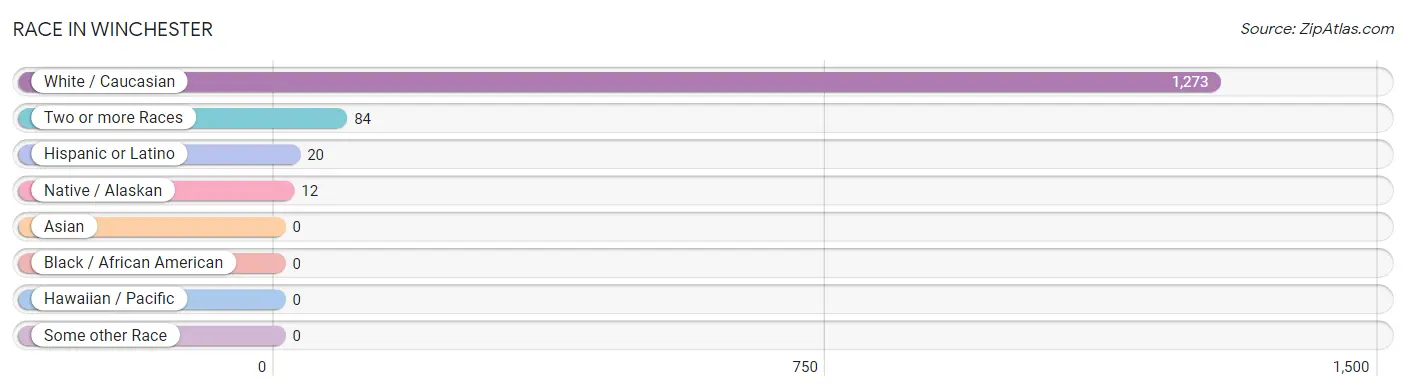
| Race | # Population | % Population |
| Asian | 0 | 0.0% |
| Black / African American | 0 | 0.0% |
| Hawaiian / Pacific | 0 | 0.0% |
| Hispanic or Latino | 20 | 1.5% |
| Native / Alaskan | 12 | 0.9% |
| White / Caucasian | 1,273 | 93.0% |
| Two or more Races | 84 | 6.1% |
| Some other Race | 0 | 0.0% |
| Total | 1,369 | 100.0% |
Ancestry in Winchester
The most populous ancestries reported in Winchester are French (221 | 16.1%), Irish (216 | 15.8%), English (202 | 14.8%), Italian (198 | 14.5%), and French Canadian (160 | 11.7%), together accounting for 72.8% of all Winchester residents.
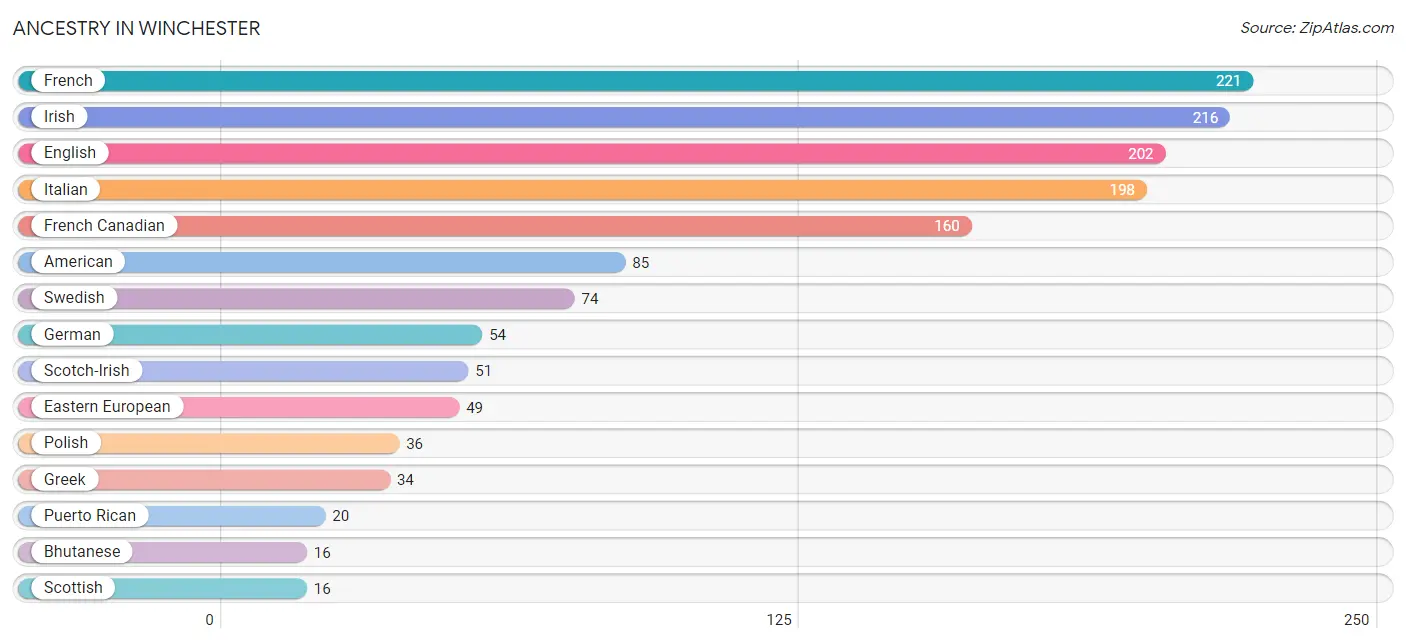
| Ancestry | # Population | % Population |
| American | 85 | 6.2% |
| Bhutanese | 16 | 1.2% |
| British | 9 | 0.7% |
| Cherokee | 12 | 0.9% |
| Dutch | 8 | 0.6% |
| Eastern European | 49 | 3.6% |
| English | 202 | 14.8% |
| Finnish | 12 | 0.9% |
| French | 221 | 16.1% |
| French Canadian | 160 | 11.7% |
| German | 54 | 3.9% |
| Greek | 34 | 2.5% |
| Irish | 216 | 15.8% |
| Italian | 198 | 14.5% |
| Lithuanian | 14 | 1.0% |
| Northern European | 13 | 0.9% |
| Polish | 36 | 2.6% |
| Puerto Rican | 20 | 1.5% |
| Russian | 6 | 0.4% |
| Scotch-Irish | 51 | 3.7% |
| Scottish | 16 | 1.2% |
| Swedish | 74 | 5.4% | View All 22 Rows |
Immigrants in Winchester
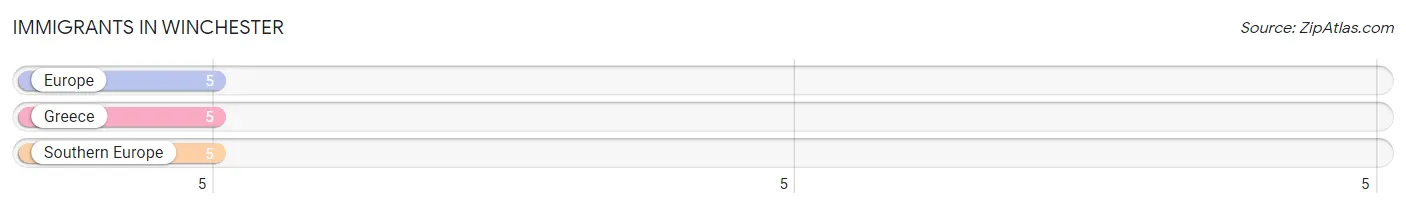
The most numerous immigrant groups reported in Winchester came from Europe (5 | 0.4%), Greece (5 | 0.4%), and Southern Europe (5 | 0.4%), together accounting for 1.1% of all Winchester residents.
| Immigration Origin | # Population | % Population |
| Europe | 5 | 0.4% |
| Greece | 5 | 0.4% |
| Southern Europe | 5 | 0.4% | View All 3 Rows |
Sex and Age in Winchester
Sex and Age in Winchester
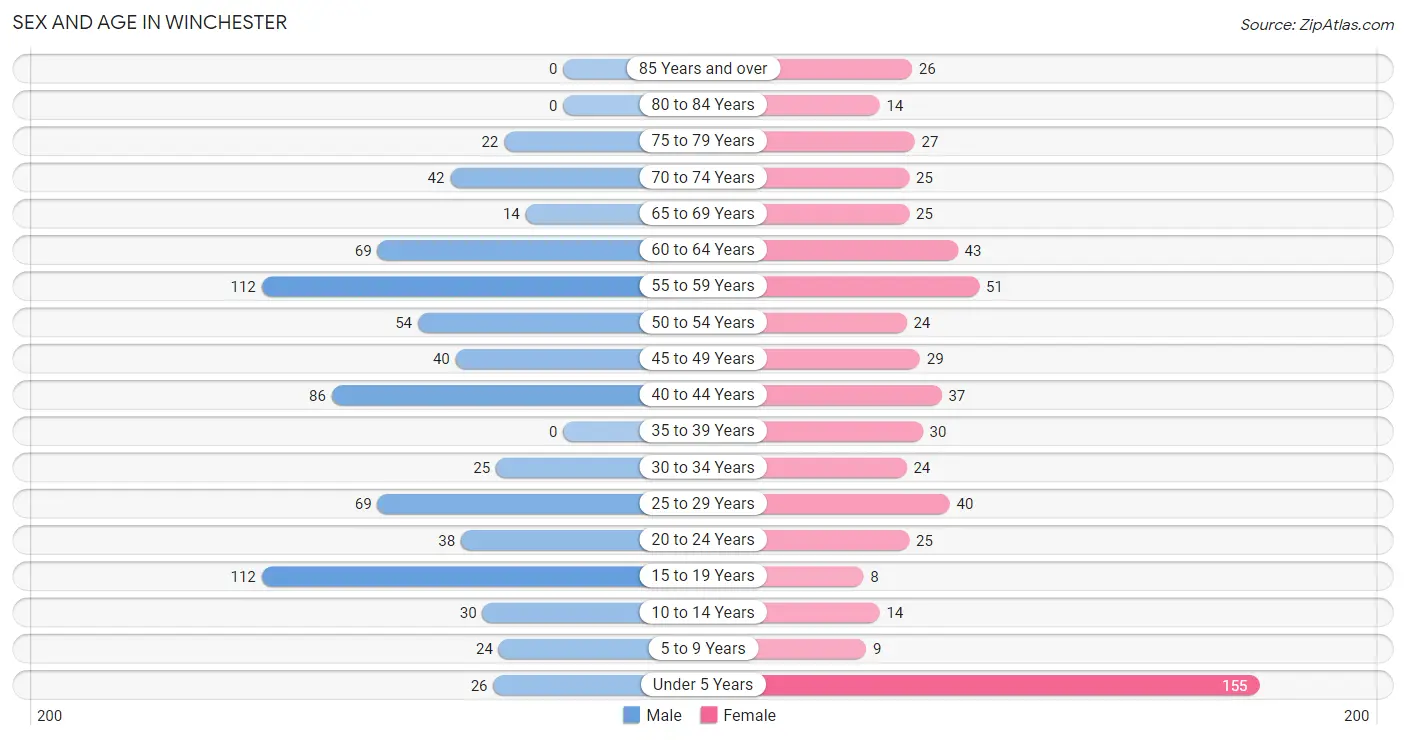
The most populous age groups in Winchester are 15 to 19 Years (112 | 14.7%) for men and Under 5 Years (155 | 25.6%) for women.
| Age Bracket | Male | Female |
| Under 5 Years | 26 (3.4%) | 155 (25.6%) |
| 5 to 9 Years | 24 (3.2%) | 9 (1.5%) |
| 10 to 14 Years | 30 (3.9%) | 14 (2.3%) |
| 15 to 19 Years | 112 (14.7%) | 8 (1.3%) |
| 20 to 24 Years | 38 (5.0%) | 25 (4.1%) |
| 25 to 29 Years | 69 (9.0%) | 40 (6.6%) |
| 30 to 34 Years | 25 (3.3%) | 24 (4.0%) |
| 35 to 39 Years | 0 (0.0%) | 30 (5.0%) |
| 40 to 44 Years | 86 (11.3%) | 37 (6.1%) |
| 45 to 49 Years | 40 (5.2%) | 29 (4.8%) |
| 50 to 54 Years | 54 (7.1%) | 24 (4.0%) |
| 55 to 59 Years | 112 (14.7%) | 51 (8.4%) |
| 60 to 64 Years | 69 (9.0%) | 43 (7.1%) |
| 65 to 69 Years | 14 (1.8%) | 25 (4.1%) |
| 70 to 74 Years | 42 (5.5%) | 25 (4.1%) |
| 75 to 79 Years | 22 (2.9%) | 27 (4.5%) |
| 80 to 84 Years | 0 (0.0%) | 14 (2.3%) |
| 85 Years and over | 0 (0.0%) | 26 (4.3%) |
| Total | 763 (100.0%) | 606 (100.0%) |
Families and Households in Winchester
Median Family Size in Winchester
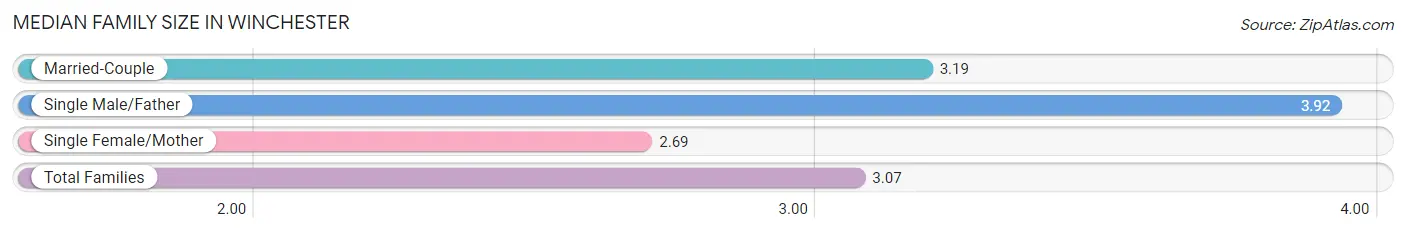
The median family size in Winchester is 3.07 persons per family, with single male/father families (26 | 8.4%) accounting for the largest median family size of 3.92 persons per family. On the other hand, single female/mother families (109 | 35.3%) represent the smallest median family size with 2.69 persons per family.
| Family Type | # Families | Family Size |
| Married-Couple | 174 (56.3%) | 3.19 |
| Single Male/Father | 26 (8.4%) | 3.92 |
| Single Female/Mother | 109 (35.3%) | 2.69 |
| Total Families | 309 (100.0%) | 3.07 |
Median Household Size in Winchester
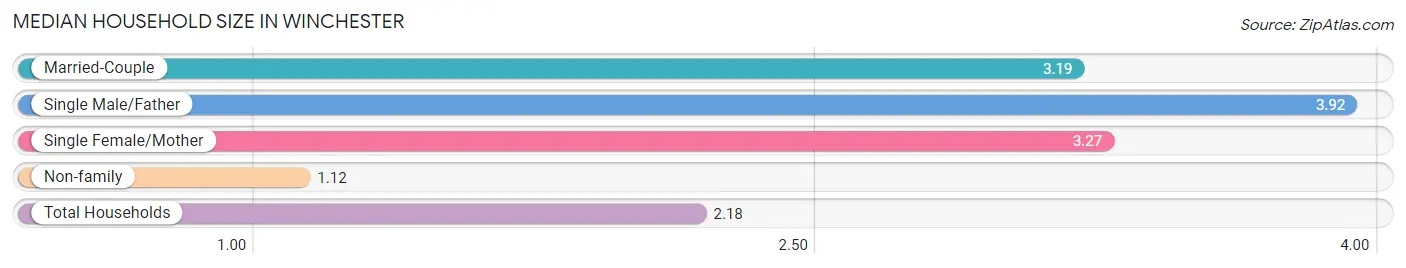
The median household size in Winchester is 2.18 persons per household, with single male/father households (26 | 4.2%) accounting for the largest median household size of 3.92 persons per household. non-family households (318 | 50.7%) represent the smallest median household size with 1.12 persons per household.
| Household Type | # Households | Household Size |
| Married-Couple | 174 (27.8%) | 3.19 |
| Single Male/Father | 26 (4.2%) | 3.92 |
| Single Female/Mother | 109 (17.4%) | 3.27 |
| Non-family | 318 (50.7%) | 1.12 |
| Total Households | 627 (100.0%) | 2.18 |
Household Size by Marriage Status in Winchester
Out of a total of 627 households in Winchester, 309 (49.3%) are family households, while 318 (50.7%) are nonfamily households. The most numerous type of family households are 2-person households, comprising 137, and the most common type of nonfamily households are 1-person households, comprising 288.
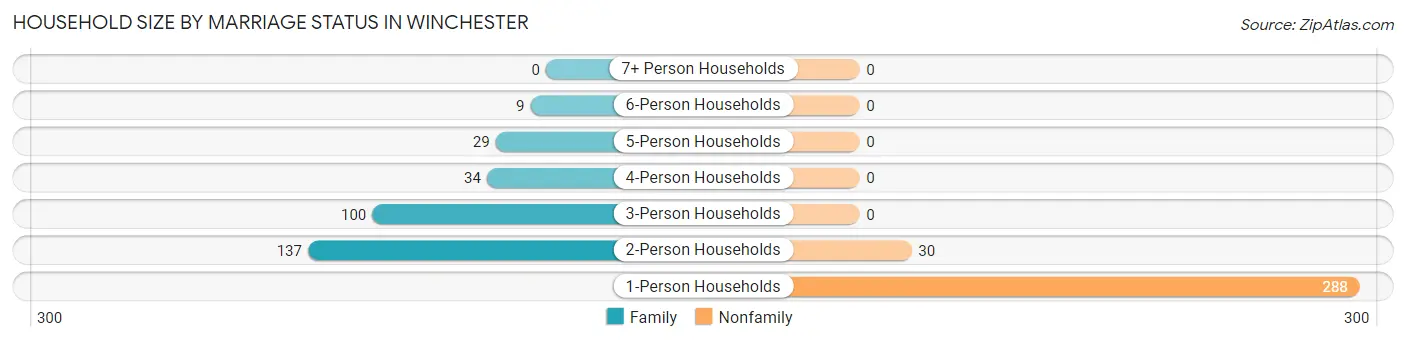
| Household Size | Family Households | Nonfamily Households |
| 1-Person Households | - | 288 (45.9%) |
| 2-Person Households | 137 (21.8%) | 30 (4.8%) |
| 3-Person Households | 100 (16.0%) | 0 (0.0%) |
| 4-Person Households | 34 (5.4%) | 0 (0.0%) |
| 5-Person Households | 29 (4.6%) | 0 (0.0%) |
| 6-Person Households | 9 (1.4%) | 0 (0.0%) |
| 7+ Person Households | 0 (0.0%) | 0 (0.0%) |
| Total | 309 (49.3%) | 318 (50.7%) |
Female Fertility in Winchester
Fertility by Age in Winchester
| Age Bracket | Women with Births | Births / 1,000 Women |
| 15 to 19 years | 0 (0.0%) | 0.0 |
| 20 to 34 years | 0 (0.0%) | 0.0 |
| 35 to 50 years | 0 (0.0%) | 0.0 |
| Total | 0 (0.0%) | 0.0 |
Fertility by Age by Marriage Status in Winchester
| Age Bracket | Married | Unmarried |
| 15 to 19 years | 0 (0.0%) | 0 (0.0%) |
| 20 to 34 years | 0 (0.0%) | 0 (0.0%) |
| 35 to 50 years | 0 (0.0%) | 0 (0.0%) |
| Total | 0 (0.0%) | 0 (0.0%) |
Fertility by Education in Winchester
| Educational Attainment | Women with Births | Births / 1,000 Women |
| Less than High School | 0 (0.0%) | 0.0 |
| High School Diploma | 0 (0.0%) | 0.0 |
| College or Associate's Degree | 0 (0.0%) | 0.0 |
| Bachelor's Degree | 0 (0.0%) | 0.0 |
| Graduate Degree | 0 (0.0%) | 0.0 |
| Total | 0 (0.0%) | 0.0 |
Fertility by Education by Marriage Status in Winchester
| Educational Attainment | Married | Unmarried |
| Less than High School | 0 (0.0%) | 0 (0.0%) |
| High School Diploma | 0 (0.0%) | 0 (0.0%) |
| College or Associate's Degree | 0 (0.0%) | 0 (0.0%) |
| Bachelor's Degree | 0 (0.0%) | 0 (0.0%) |
| Graduate Degree | 0 (0.0%) | 0 (0.0%) |
| Total | 0 (0.0%) | 0 (0.0%) |
Employment Characteristics in Winchester
Employment by Class of Employer in Winchester
Among the 600 employed individuals in Winchester, private company employees (504 | 84.0%), not-for-profit organizations (33 | 5.5%), and self-employed (not incorporated) (30 | 5.0%) make up the most common classes of employment.
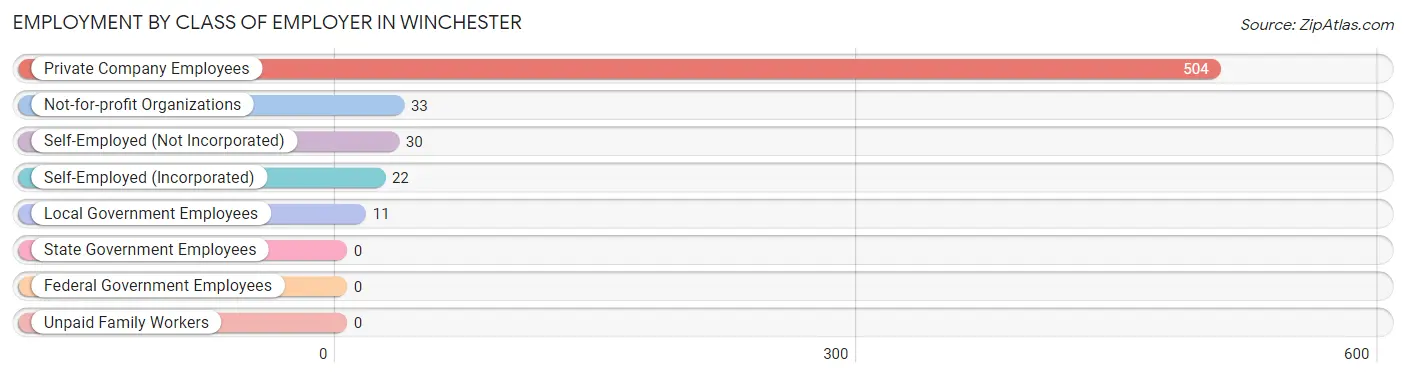
| Employer Class | # Employees | % Employees |
| Private Company Employees | 504 | 84.0% |
| Self-Employed (Incorporated) | 22 | 3.7% |
| Self-Employed (Not Incorporated) | 30 | 5.0% |
| Not-for-profit Organizations | 33 | 5.5% |
| Local Government Employees | 11 | 1.8% |
| State Government Employees | 0 | 0.0% |
| Federal Government Employees | 0 | 0.0% |
| Unpaid Family Workers | 0 | 0.0% |
| Total | 600 | 100.0% |
Employment Status by Age in Winchester
According to the labor force statistics for Winchester, out of the total population over 16 years of age (1,081), 59.0% or 638 individuals are in the labor force, with 6.0% or 38 of them unemployed. The age group with the highest labor force participation rate is 30 to 34 years, with 100.0% or 49 individuals in the labor force. Within the labor force, the 16 to 19 years age range has the highest percentage of unemployed individuals, with 68.4% or 26 of them being unemployed.
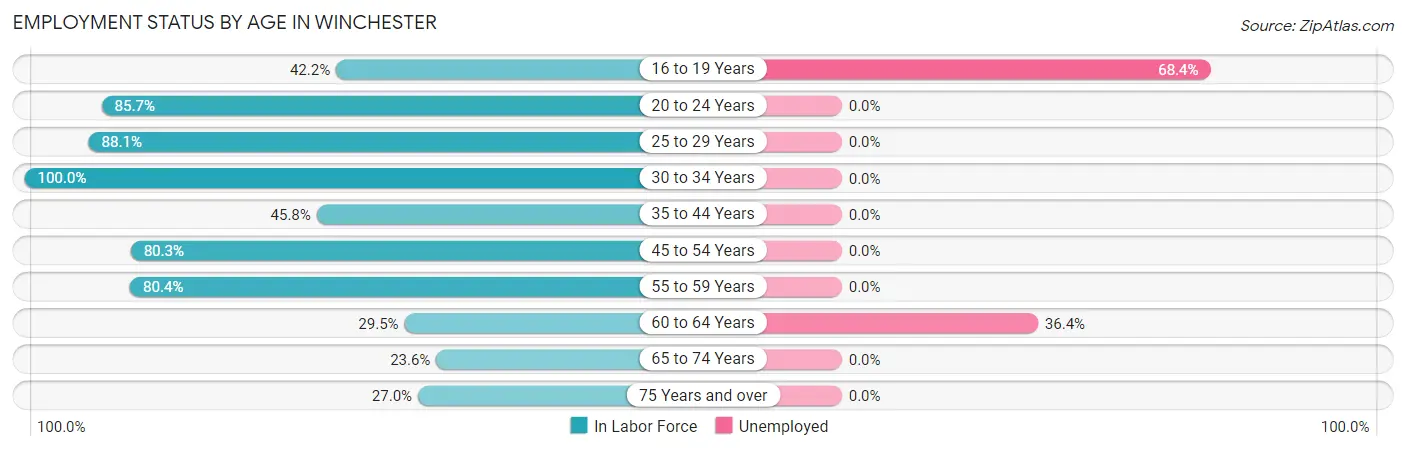
| Age Bracket | In Labor Force | Unemployed |
| 16 to 19 Years | 38 (42.2%) | 26 (68.4%) |
| 20 to 24 Years | 54 (85.7%) | 0 (0.0%) |
| 25 to 29 Years | 96 (88.1%) | 0 (0.0%) |
| 30 to 34 Years | 49 (100.0%) | 0 (0.0%) |
| 35 to 44 Years | 70 (45.8%) | 0 (0.0%) |
| 45 to 54 Years | 118 (80.3%) | 0 (0.0%) |
| 55 to 59 Years | 131 (80.4%) | 0 (0.0%) |
| 60 to 64 Years | 33 (29.5%) | 12 (36.4%) |
| 65 to 74 Years | 25 (23.6%) | 0 (0.0%) |
| 75 Years and over | 24 (27.0%) | 0 (0.0%) |
| Total | 638 (59.0%) | 38 (6.0%) |
Employment Status by Educational Attainment in Winchester
According to labor force statistics for Winchester, 67.8% of individuals (497) out of the total population between 25 and 64 years of age (733) are in the labor force, with 2.4% or 12 of them being unemployed. The group with the highest labor force participation rate are those with the educational attainment of bachelor's degree or higher, with 83.0% or 44 individuals in the labor force. Within the labor force, individuals with high school diploma education have the highest percentage of unemployment, with 3.8% or 12 of them being unemployed.
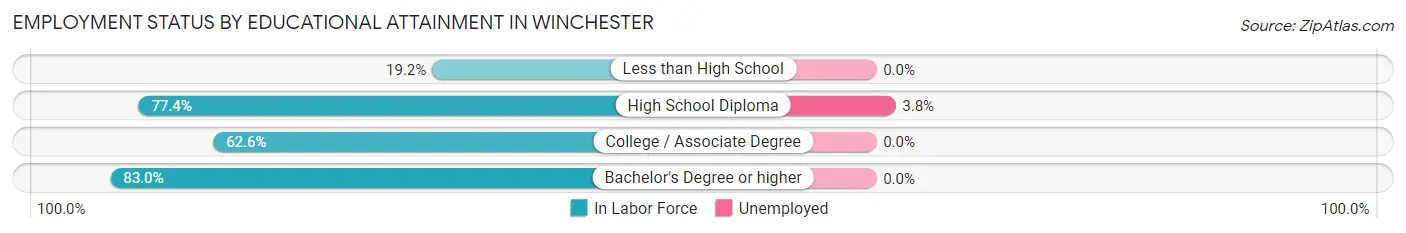
| Educational Attainment | In Labor Force | Unemployed |
| Less than High School | 15 (19.2%) | 0 (0.0%) |
| High School Diploma | 319 (77.4%) | 16 (3.8%) |
| College / Associate Degree | 119 (62.6%) | 0 (0.0%) |
| Bachelor's Degree or higher | 44 (83.0%) | 0 (0.0%) |
| Total | 497 (67.8%) | 18 (2.4%) |
Employment Occupations by Sex in Winchester
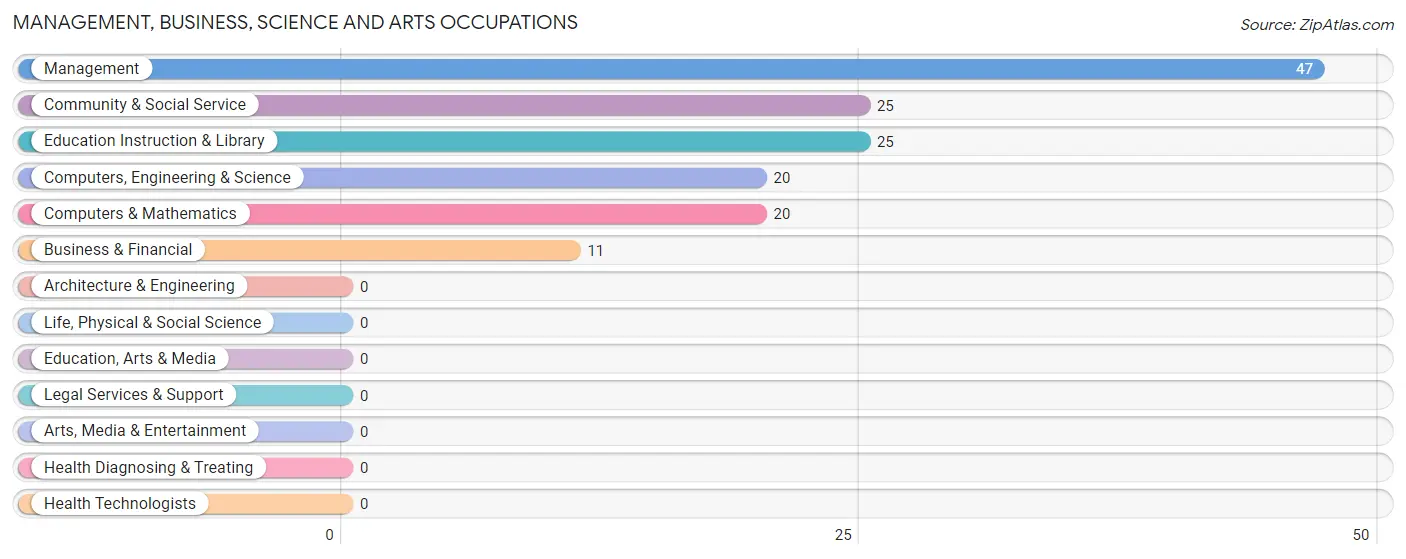
Management, Business, Science and Arts Occupations
The most common Management, Business, Science and Arts occupations in Winchester are Management (47 | 7.8%), Community & Social Service (25 | 4.2%), Education Instruction & Library (25 | 4.2%), Computers, Engineering & Science (20 | 3.3%), and Computers & Mathematics (20 | 3.3%).
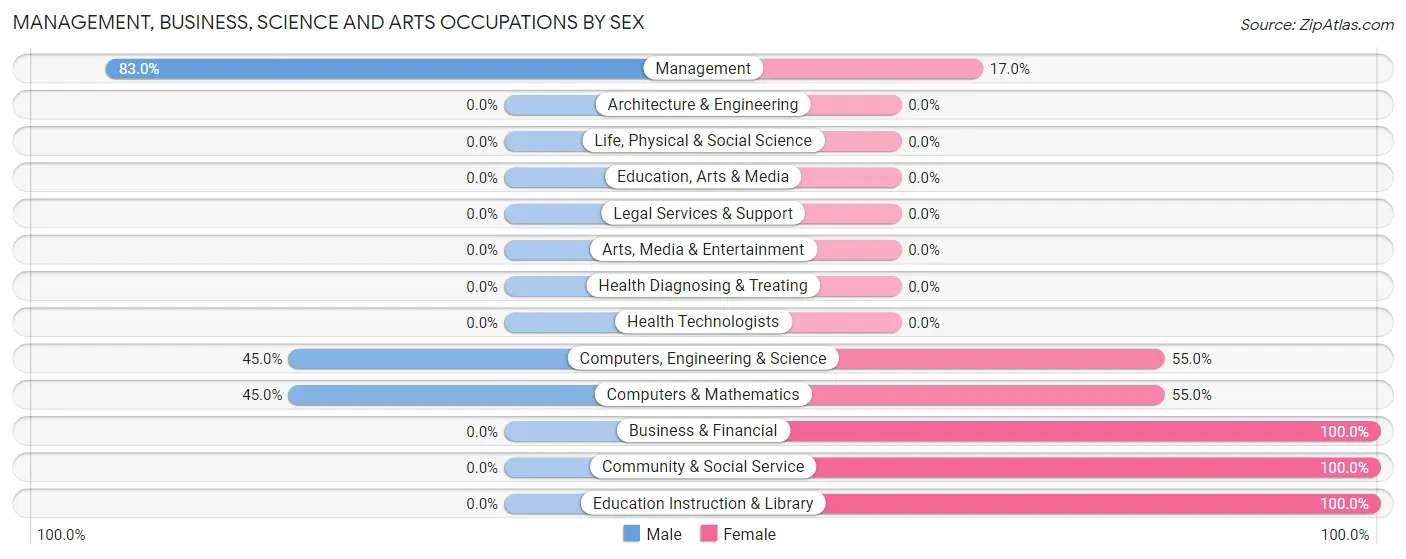
Management, Business, Science and Arts Occupations by Sex
Within the Management, Business, Science and Arts occupations in Winchester, the most male-oriented occupations are Management (83.0%), Computers, Engineering & Science (45.0%), and Computers & Mathematics (45.0%), while the most female-oriented occupations are Business & Financial (100.0%), Community & Social Service (100.0%), and Education Instruction & Library (100.0%).
| Occupation | Male | Female |
| Management | 39 (83.0%) | 8 (17.0%) |
| Business & Financial | 0 (0.0%) | 11 (100.0%) |
| Computers, Engineering & Science | 9 (45.0%) | 11 (55.0%) |
| Computers & Mathematics | 9 (45.0%) | 11 (55.0%) |
| Architecture & Engineering | 0 (0.0%) | 0 (0.0%) |
| Life, Physical & Social Science | 0 (0.0%) | 0 (0.0%) |
| Community & Social Service | 0 (0.0%) | 25 (100.0%) |
| Education, Arts & Media | 0 (0.0%) | 0 (0.0%) |
| Legal Services & Support | 0 (0.0%) | 0 (0.0%) |
| Education Instruction & Library | 0 (0.0%) | 25 (100.0%) |
| Arts, Media & Entertainment | 0 (0.0%) | 0 (0.0%) |
| Health Diagnosing & Treating | 0 (0.0%) | 0 (0.0%) |
| Health Technologists | 0 (0.0%) | 0 (0.0%) |
| Total (Category) | 48 (46.6%) | 55 (53.4%) |
| Total (Overall) | 400 (66.7%) | 200 (33.3%) |
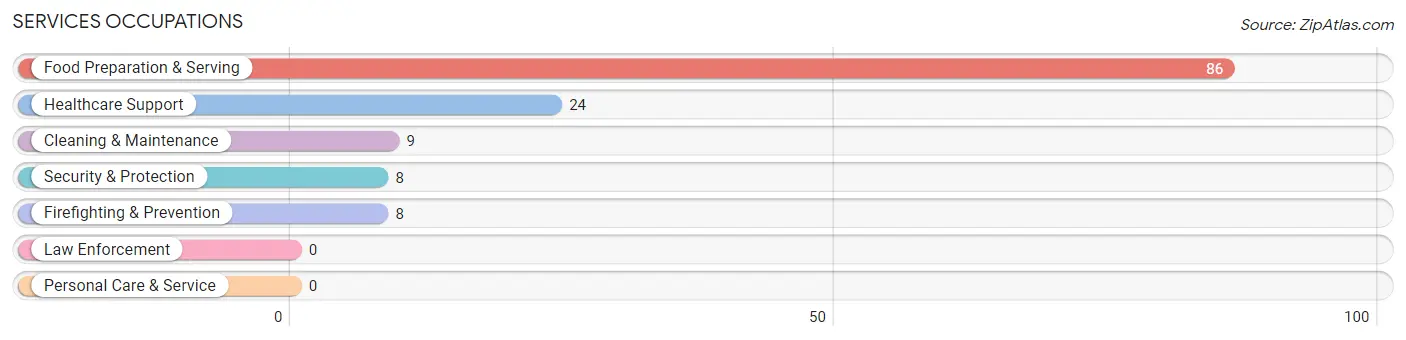
Services Occupations
The most common Services occupations in Winchester are Food Preparation & Serving (86 | 14.3%), Healthcare Support (24 | 4.0%), Cleaning & Maintenance (9 | 1.5%), Security & Protection (8 | 1.3%), and Firefighting & Prevention (8 | 1.3%).
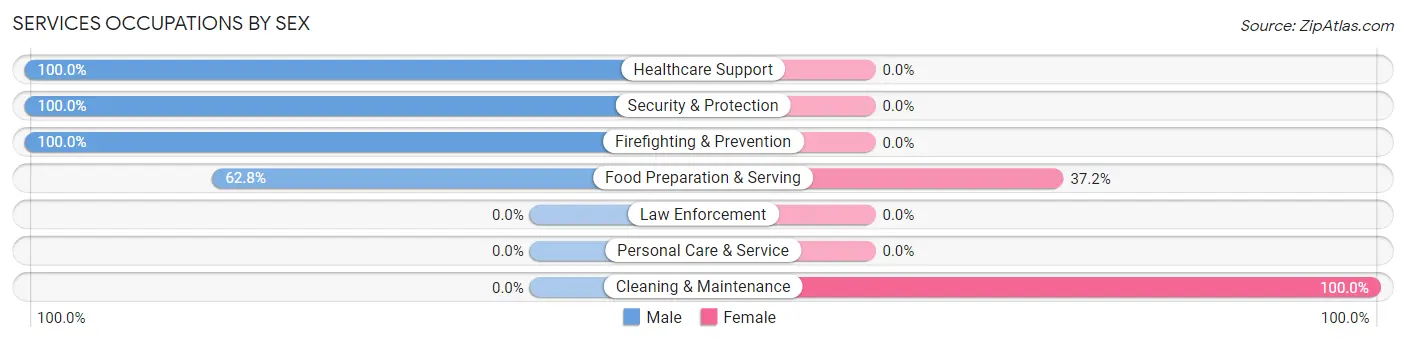
Services Occupations by Sex
Within the Services occupations in Winchester, the most male-oriented occupations are Healthcare Support (100.0%), Security & Protection (100.0%), and Firefighting & Prevention (100.0%), while the most female-oriented occupations are Cleaning & Maintenance (100.0%), and Food Preparation & Serving (37.2%).
| Occupation | Male | Female |
| Healthcare Support | 24 (100.0%) | 0 (0.0%) |
| Security & Protection | 8 (100.0%) | 0 (0.0%) |
| Firefighting & Prevention | 8 (100.0%) | 0 (0.0%) |
| Law Enforcement | 0 (0.0%) | 0 (0.0%) |
| Food Preparation & Serving | 54 (62.8%) | 32 (37.2%) |
| Cleaning & Maintenance | 0 (0.0%) | 9 (100.0%) |
| Personal Care & Service | 0 (0.0%) | 0 (0.0%) |
| Total (Category) | 86 (67.7%) | 41 (32.3%) |
| Total (Overall) | 400 (66.7%) | 200 (33.3%) |
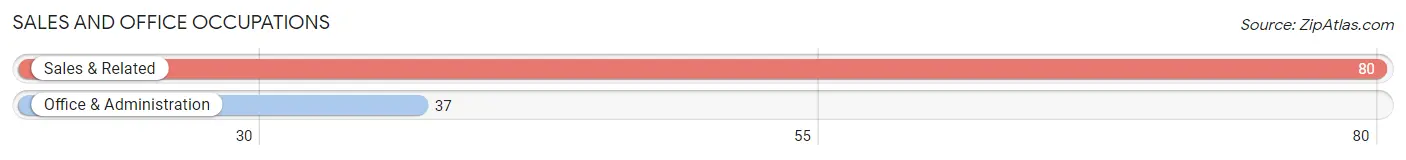
Sales and Office Occupations
The most common Sales and Office occupations in Winchester are Sales & Related (80 | 13.3%), and Office & Administration (37 | 6.2%).
Sales and Office Occupations by Sex
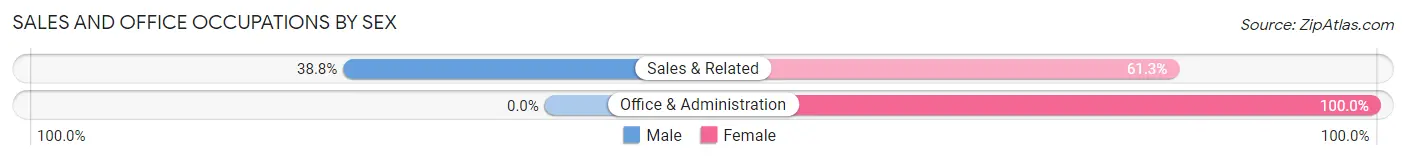
| Occupation | Male | Female |
| Sales & Related | 31 (38.8%) | 49 (61.3%) |
| Office & Administration | 0 (0.0%) | 37 (100.0%) |
| Total (Category) | 31 (26.5%) | 86 (73.5%) |
| Total (Overall) | 400 (66.7%) | 200 (33.3%) |
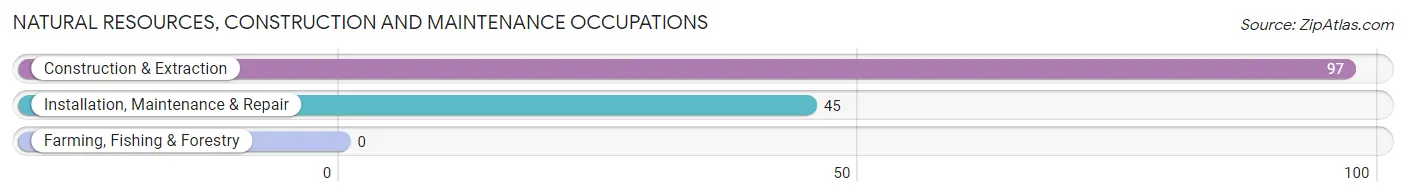
Natural Resources, Construction and Maintenance Occupations
The most common Natural Resources, Construction and Maintenance occupations in Winchester are Construction & Extraction (97 | 16.2%), and Installation, Maintenance & Repair (45 | 7.5%).
Natural Resources, Construction and Maintenance Occupations by Sex
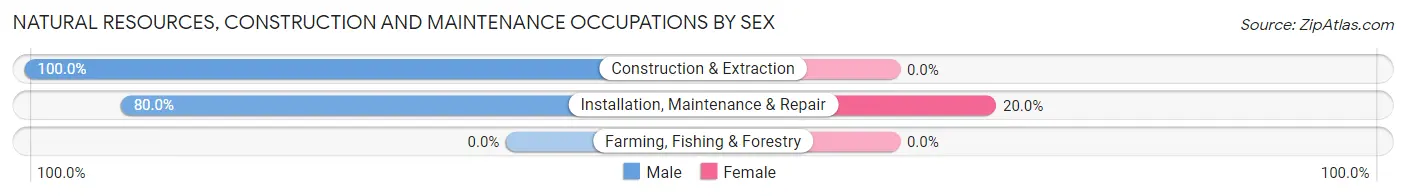
| Occupation | Male | Female |
| Farming, Fishing & Forestry | 0 (0.0%) | 0 (0.0%) |
| Construction & Extraction | 97 (100.0%) | 0 (0.0%) |
| Installation, Maintenance & Repair | 36 (80.0%) | 9 (20.0%) |
| Total (Category) | 133 (93.7%) | 9 (6.3%) |
| Total (Overall) | 400 (66.7%) | 200 (33.3%) |
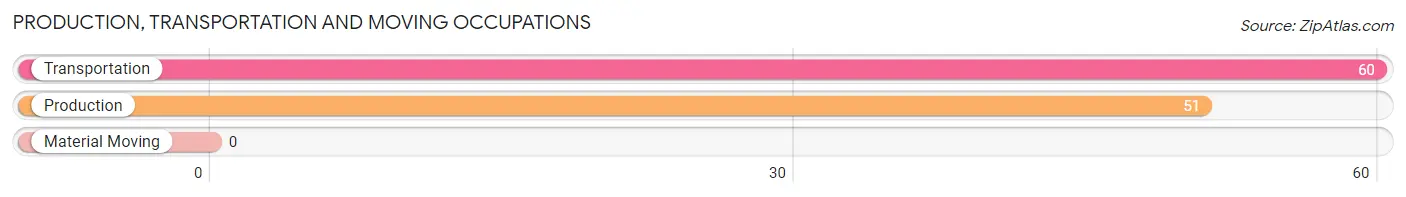
Production, Transportation and Moving Occupations
The most common Production, Transportation and Moving occupations in Winchester are Transportation (60 | 10.0%), and Production (51 | 8.5%).
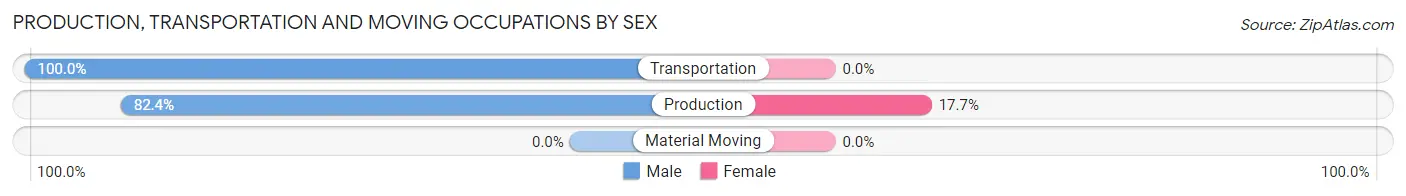
Production, Transportation and Moving Occupations by Sex
| Occupation | Male | Female |
| Production | 42 (82.4%) | 9 (17.6%) |
| Transportation | 60 (100.0%) | 0 (0.0%) |
| Material Moving | 0 (0.0%) | 0 (0.0%) |
| Total (Category) | 102 (91.9%) | 9 (8.1%) |
| Total (Overall) | 400 (66.7%) | 200 (33.3%) |
Employment Industries by Sex in Winchester
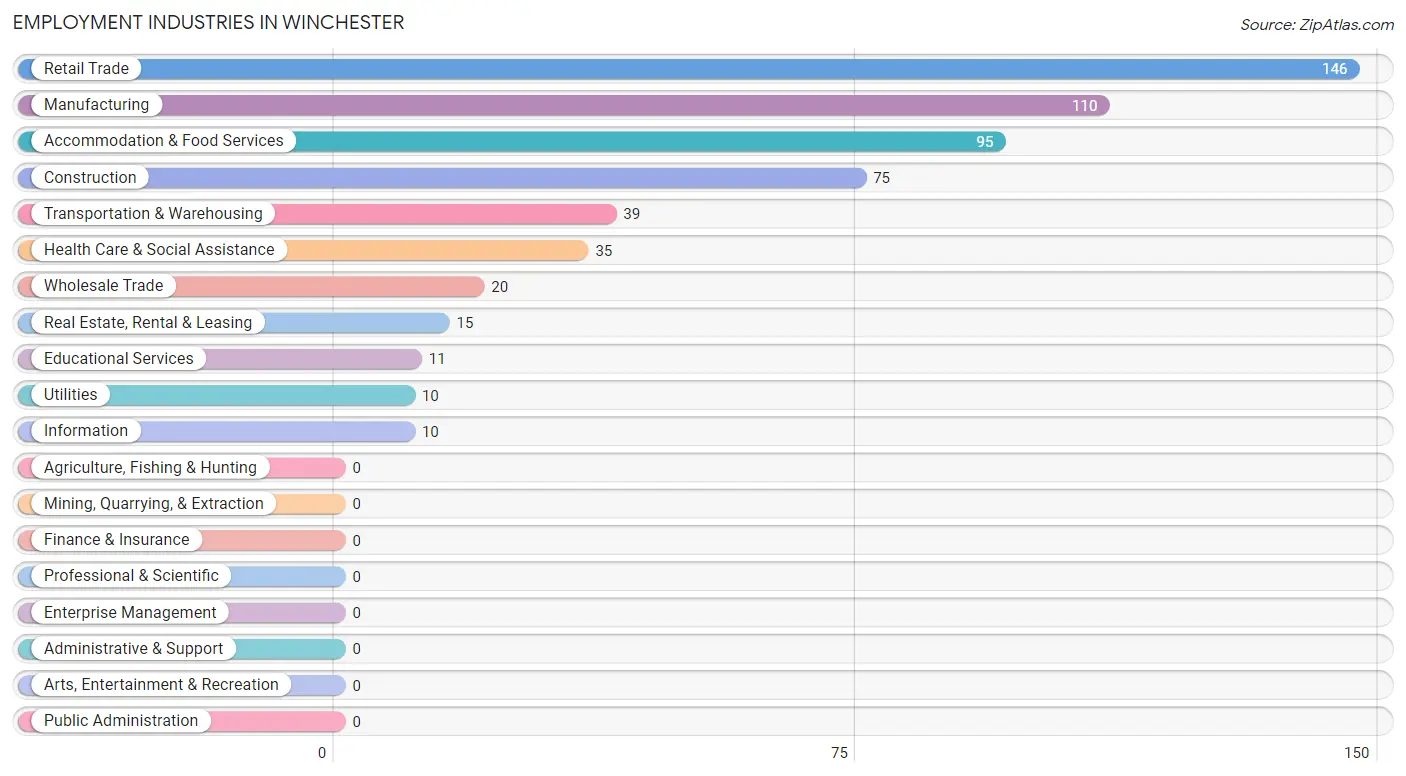
Employment Industries in Winchester
The major employment industries in Winchester include Retail Trade (146 | 24.3%), Manufacturing (110 | 18.3%), Accommodation & Food Services (95 | 15.8%), Construction (75 | 12.5%), and Transportation & Warehousing (39 | 6.5%).
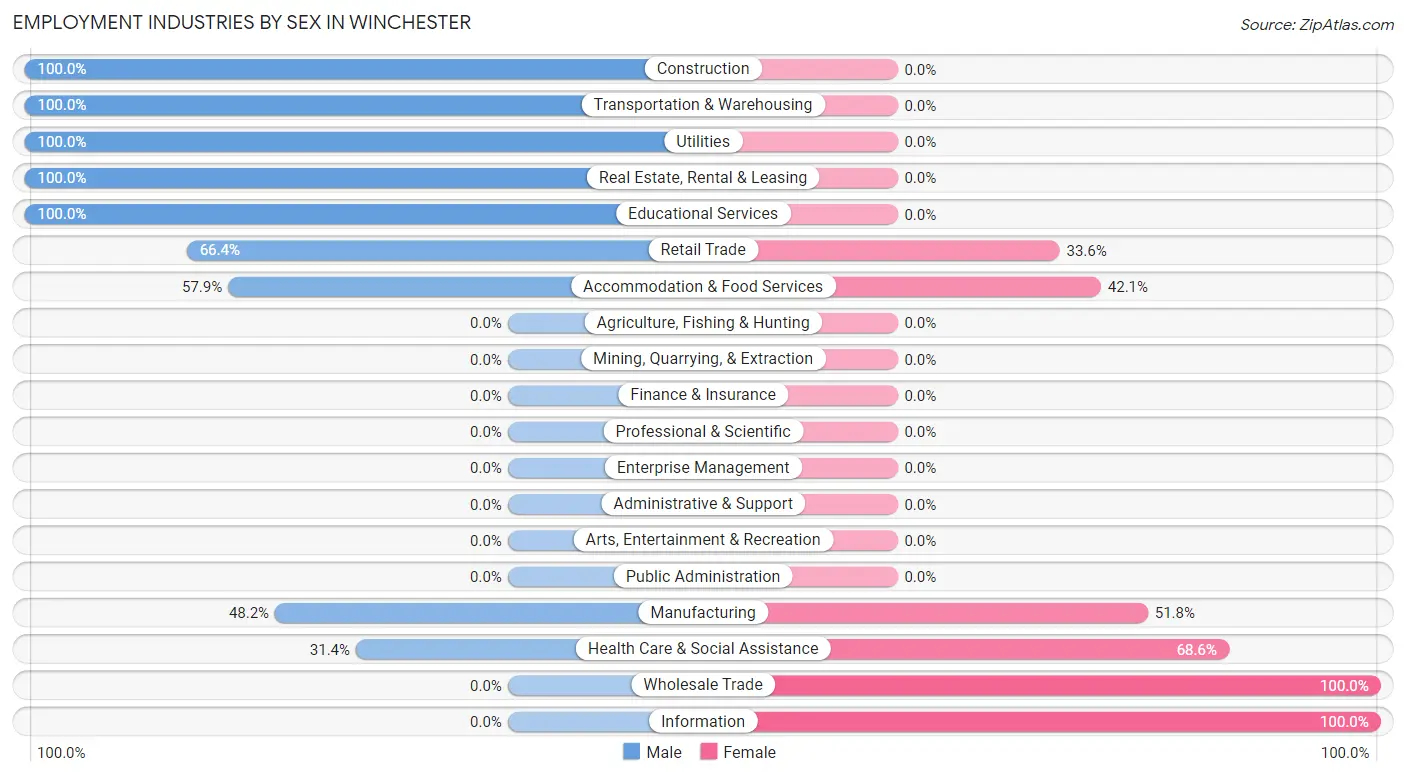
Employment Industries by Sex in Winchester
The Winchester industries that see more men than women are Construction (100.0%), Transportation & Warehousing (100.0%), and Utilities (100.0%), whereas the industries that tend to have a higher number of women are Wholesale Trade (100.0%), Information (100.0%), and Health Care & Social Assistance (68.6%).
| Industry | Male | Female |
| Agriculture, Fishing & Hunting | 0 (0.0%) | 0 (0.0%) |
| Mining, Quarrying, & Extraction | 0 (0.0%) | 0 (0.0%) |
| Construction | 75 (100.0%) | 0 (0.0%) |
| Manufacturing | 53 (48.2%) | 57 (51.8%) |
| Wholesale Trade | 0 (0.0%) | 20 (100.0%) |
| Retail Trade | 97 (66.4%) | 49 (33.6%) |
| Transportation & Warehousing | 39 (100.0%) | 0 (0.0%) |
| Utilities | 10 (100.0%) | 0 (0.0%) |
| Information | 0 (0.0%) | 10 (100.0%) |
| Finance & Insurance | 0 (0.0%) | 0 (0.0%) |
| Real Estate, Rental & Leasing | 15 (100.0%) | 0 (0.0%) |
| Professional & Scientific | 0 (0.0%) | 0 (0.0%) |
| Enterprise Management | 0 (0.0%) | 0 (0.0%) |
| Administrative & Support | 0 (0.0%) | 0 (0.0%) |
| Educational Services | 11 (100.0%) | 0 (0.0%) |
| Health Care & Social Assistance | 11 (31.4%) | 24 (68.6%) |
| Arts, Entertainment & Recreation | 0 (0.0%) | 0 (0.0%) |
| Accommodation & Food Services | 55 (57.9%) | 40 (42.1%) |
| Public Administration | 0 (0.0%) | 0 (0.0%) |
| Total | 400 (66.7%) | 200 (33.3%) |
Education in Winchester
School Enrollment in Winchester
The most common levels of schooling among the 197 students in Winchester are high school (65 | 33.0%), elementary school (47 | 23.9%), and middle school (30 | 15.2%).
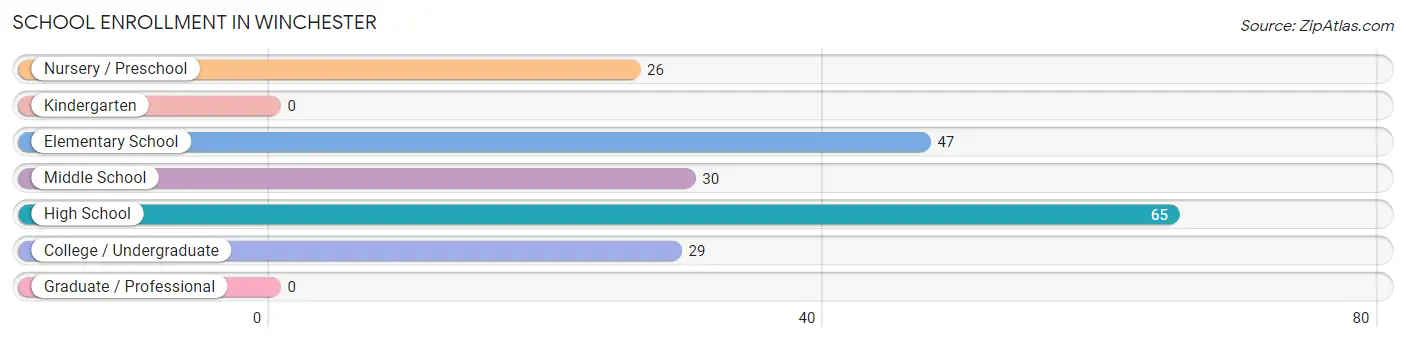
| School Level | # Students | % Students |
| Nursery / Preschool | 26 | 13.2% |
| Kindergarten | 0 | 0.0% |
| Elementary School | 47 | 23.9% |
| Middle School | 30 | 15.2% |
| High School | 65 | 33.0% |
| College / Undergraduate | 29 | 14.7% |
| Graduate / Professional | 0 | 0.0% |
| Total | 197 | 100.0% |
School Enrollment by Age by Funding Source in Winchester
Out of a total of 197 students who are enrolled in schools in Winchester, 30 (15.2%) attend a private institution, while the remaining 167 (84.8%) are enrolled in public schools. The age group of 5 to 9 year old has the highest likelihood of being enrolled in private schools, with 11 (33.3% in the age bracket) enrolled. Conversely, the age group of 15 to 17 year olds has the lowest likelihood of being enrolled in a private school, with 49 (100.0% in the age bracket) attending a public institution.
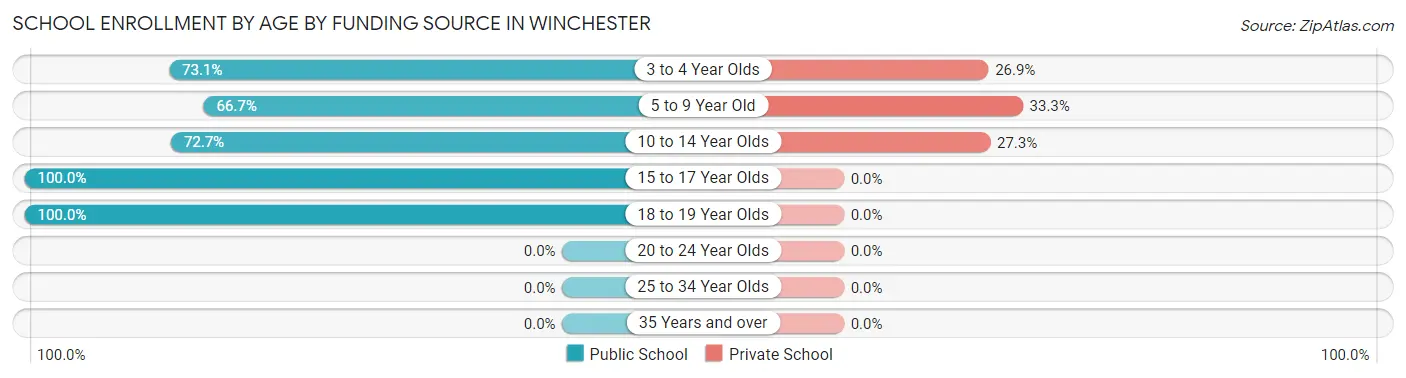
| Age Bracket | Public School | Private School |
| 3 to 4 Year Olds | 19 (73.1%) | 7 (26.9%) |
| 5 to 9 Year Old | 22 (66.7%) | 11 (33.3%) |
| 10 to 14 Year Olds | 32 (72.7%) | 12 (27.3%) |
| 15 to 17 Year Olds | 49 (100.0%) | 0 (0.0%) |
| 18 to 19 Year Olds | 45 (100.0%) | 0 (0.0%) |
| 20 to 24 Year Olds | 0 (0.0%) | 0 (0.0%) |
| 25 to 34 Year Olds | 0 (0.0%) | 0 (0.0%) |
| 35 Years and over | 0 (0.0%) | 0 (0.0%) |
| Total | 167 (84.8%) | 30 (15.2%) |
Educational Attainment by Field of Study in Winchester
Education (18 | 23.4%), engineering (14 | 18.2%), business (11 | 14.3%), liberal arts & history (10 | 13.0%), and psychology (9 | 11.7%) are the most common fields of study among 77 individuals in Winchester who have obtained a bachelor's degree or higher.
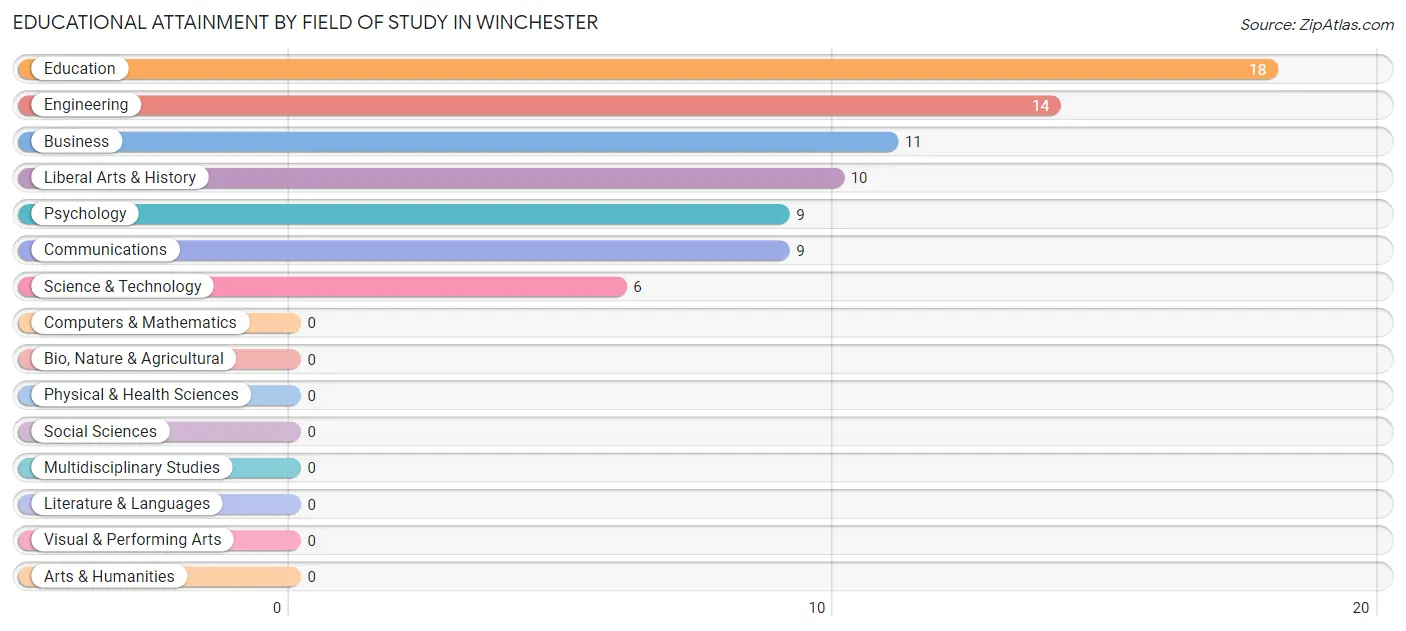
| Field of Study | # Graduates | % Graduates |
| Computers & Mathematics | 0 | 0.0% |
| Bio, Nature & Agricultural | 0 | 0.0% |
| Physical & Health Sciences | 0 | 0.0% |
| Psychology | 9 | 11.7% |
| Social Sciences | 0 | 0.0% |
| Engineering | 14 | 18.2% |
| Multidisciplinary Studies | 0 | 0.0% |
| Science & Technology | 6 | 7.8% |
| Business | 11 | 14.3% |
| Education | 18 | 23.4% |
| Literature & Languages | 0 | 0.0% |
| Liberal Arts & History | 10 | 13.0% |
| Visual & Performing Arts | 0 | 0.0% |
| Communications | 9 | 11.7% |
| Arts & Humanities | 0 | 0.0% |
| Total | 77 | 100.0% |
Transportation & Commute in Winchester
Vehicle Availability by Sex in Winchester
The most prevalent vehicle ownership categories in Winchester are males with 2 vehicles (182, accounting for 45.5%) and females with 2 vehicles (106, making up 91.0%).
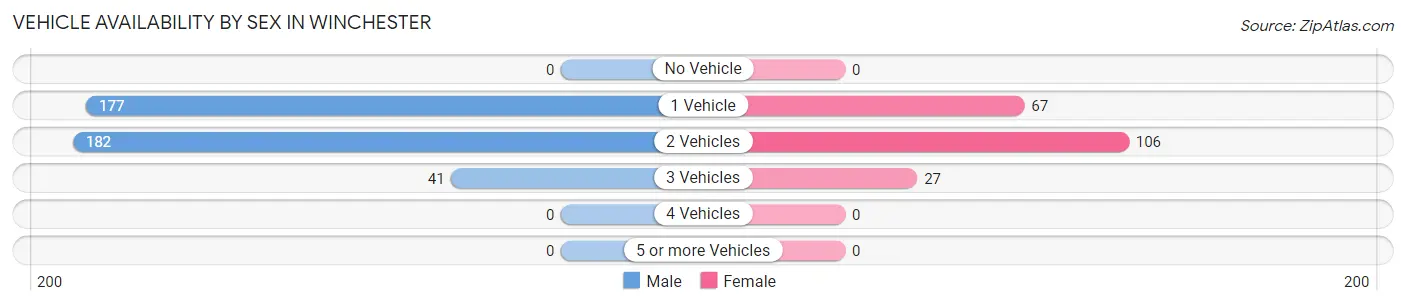
| Vehicles Available | Male | Female |
| No Vehicle | 0 (0.0%) | 0 (0.0%) |
| 1 Vehicle | 177 (44.3%) | 67 (33.5%) |
| 2 Vehicles | 182 (45.5%) | 106 (53.0%) |
| 3 Vehicles | 41 (10.2%) | 27 (13.5%) |
| 4 Vehicles | 0 (0.0%) | 0 (0.0%) |
| 5 or more Vehicles | 0 (0.0%) | 0 (0.0%) |
| Total | 400 (100.0%) | 200 (100.0%) |
Commute Time in Winchester
The most frequently occuring commute durations in Winchester are 20 to 24 minutes (188 commuters, 33.3%), 30 to 34 minutes (135 commuters, 23.9%), and 25 to 29 minutes (50 commuters, 8.9%).
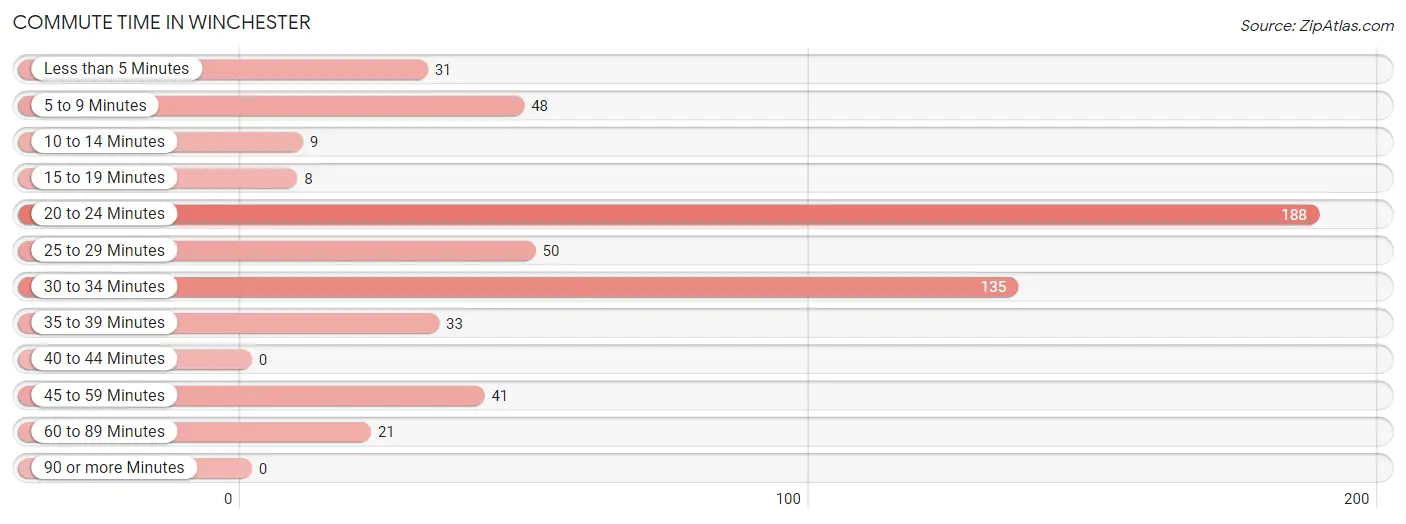
| Commute Time | # Commuters | % Commuters |
| Less than 5 Minutes | 31 | 5.5% |
| 5 to 9 Minutes | 48 | 8.5% |
| 10 to 14 Minutes | 9 | 1.6% |
| 15 to 19 Minutes | 8 | 1.4% |
| 20 to 24 Minutes | 188 | 33.3% |
| 25 to 29 Minutes | 50 | 8.9% |
| 30 to 34 Minutes | 135 | 23.9% |
| 35 to 39 Minutes | 33 | 5.9% |
| 40 to 44 Minutes | 0 | 0.0% |
| 45 to 59 Minutes | 41 | 7.3% |
| 60 to 89 Minutes | 21 | 3.7% |
| 90 or more Minutes | 0 | 0.0% |
Commute Time by Sex in Winchester
The most common commute times in Winchester are 20 to 24 minutes (114 commuters, 29.5%) for males and 20 to 24 minutes (74 commuters, 41.6%) for females.
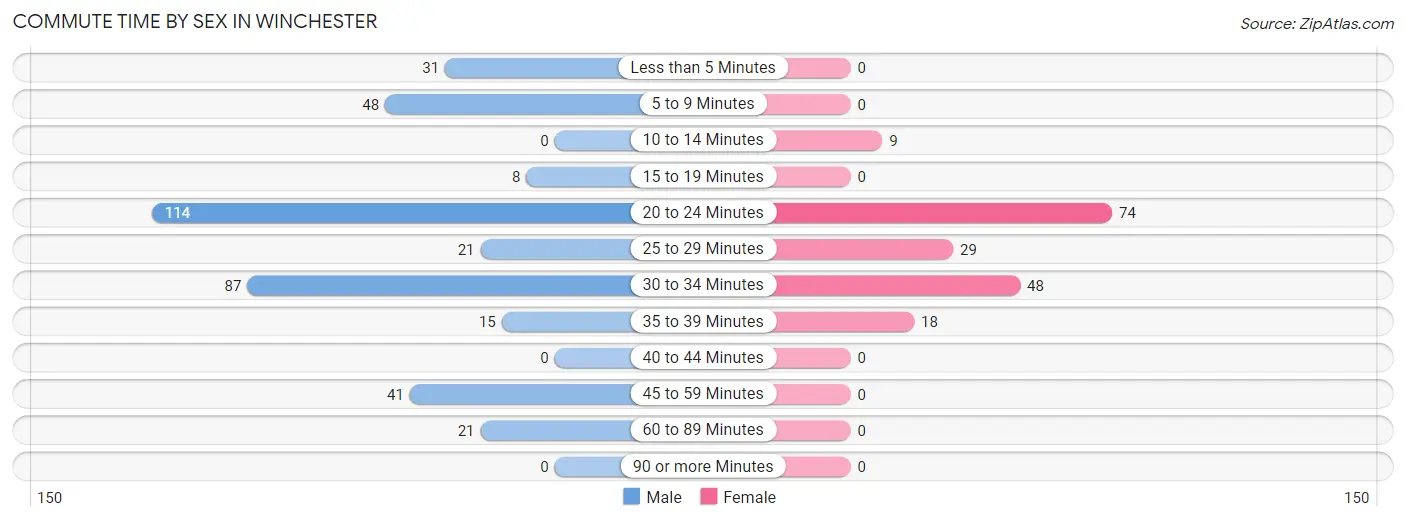
| Commute Time | Male | Female |
| Less than 5 Minutes | 31 (8.0%) | 0 (0.0%) |
| 5 to 9 Minutes | 48 (12.4%) | 0 (0.0%) |
| 10 to 14 Minutes | 0 (0.0%) | 9 (5.1%) |
| 15 to 19 Minutes | 8 (2.1%) | 0 (0.0%) |
| 20 to 24 Minutes | 114 (29.5%) | 74 (41.6%) |
| 25 to 29 Minutes | 21 (5.4%) | 29 (16.3%) |
| 30 to 34 Minutes | 87 (22.5%) | 48 (27.0%) |
| 35 to 39 Minutes | 15 (3.9%) | 18 (10.1%) |
| 40 to 44 Minutes | 0 (0.0%) | 0 (0.0%) |
| 45 to 59 Minutes | 41 (10.6%) | 0 (0.0%) |
| 60 to 89 Minutes | 21 (5.4%) | 0 (0.0%) |
| 90 or more Minutes | 0 (0.0%) | 0 (0.0%) |
Time of Departure to Work by Sex in Winchester
The most frequent times of departure to work in Winchester are 7:00 AM to 7:29 AM (71, 18.4%) for males and 7:30 AM to 7:59 AM (53, 29.8%) for females.
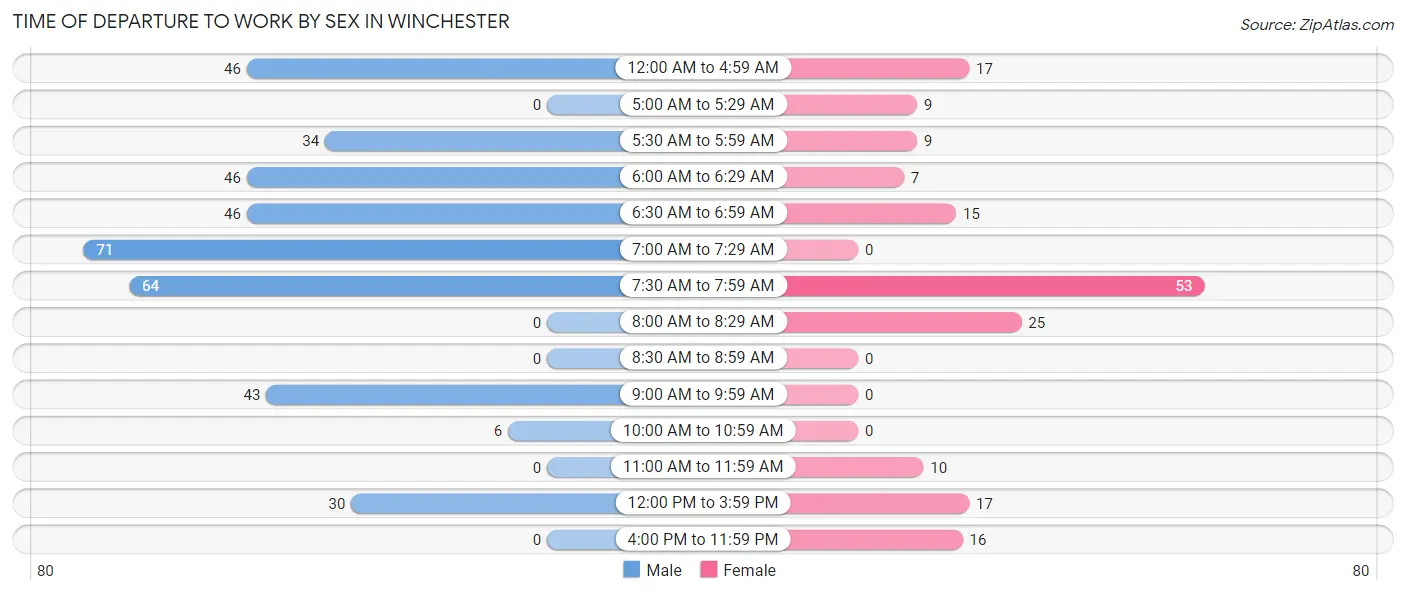
| Time of Departure | Male | Female |
| 12:00 AM to 4:59 AM | 46 (11.9%) | 17 (9.6%) |
| 5:00 AM to 5:29 AM | 0 (0.0%) | 9 (5.1%) |
| 5:30 AM to 5:59 AM | 34 (8.8%) | 9 (5.1%) |
| 6:00 AM to 6:29 AM | 46 (11.9%) | 7 (3.9%) |
| 6:30 AM to 6:59 AM | 46 (11.9%) | 15 (8.4%) |
| 7:00 AM to 7:29 AM | 71 (18.4%) | 0 (0.0%) |
| 7:30 AM to 7:59 AM | 64 (16.6%) | 53 (29.8%) |
| 8:00 AM to 8:29 AM | 0 (0.0%) | 25 (14.0%) |
| 8:30 AM to 8:59 AM | 0 (0.0%) | 0 (0.0%) |
| 9:00 AM to 9:59 AM | 43 (11.1%) | 0 (0.0%) |
| 10:00 AM to 10:59 AM | 6 (1.5%) | 0 (0.0%) |
| 11:00 AM to 11:59 AM | 0 (0.0%) | 10 (5.6%) |
| 12:00 PM to 3:59 PM | 30 (7.8%) | 17 (9.6%) |
| 4:00 PM to 11:59 PM | 0 (0.0%) | 16 (9.0%) |
| Total | 386 (100.0%) | 178 (100.0%) |
Housing Occupancy in Winchester
Occupancy by Ownership in Winchester
Of the total 627 dwellings in Winchester, owner-occupied units account for 332 (52.9%), while renter-occupied units make up 295 (47.0%).
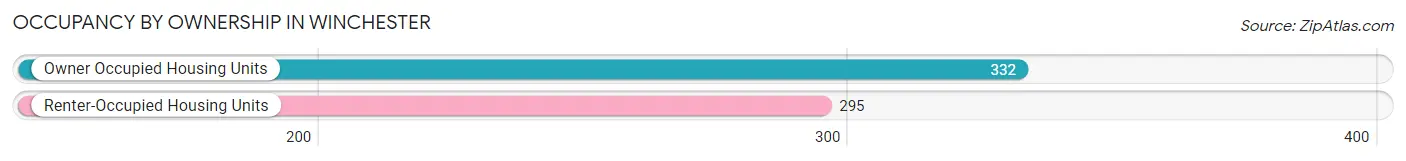
| Occupancy | # Housing Units | % Housing Units |
| Owner Occupied Housing Units | 332 | 52.9% |
| Renter-Occupied Housing Units | 295 | 47.0% |
| Total Occupied Housing Units | 627 | 100.0% |
Occupancy by Household Size in Winchester
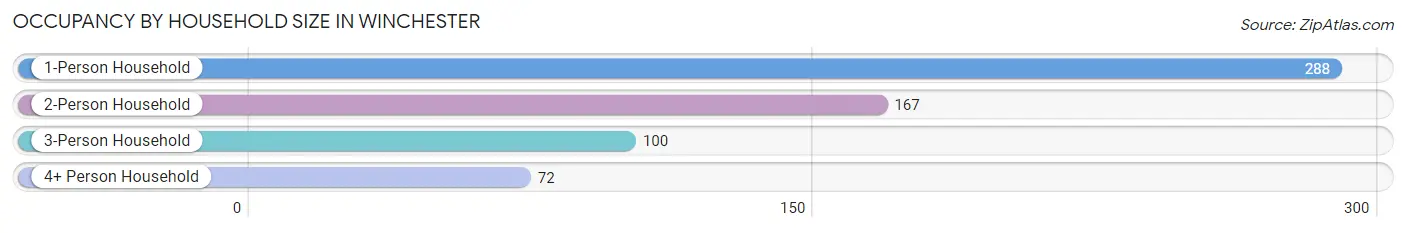
| Household Size | # Housing Units | % Housing Units |
| 1-Person Household | 288 | 45.9% |
| 2-Person Household | 167 | 26.6% |
| 3-Person Household | 100 | 16.0% |
| 4+ Person Household | 72 | 11.5% |
| Total Housing Units | 627 | 100.0% |
Occupancy by Ownership by Household Size in Winchester
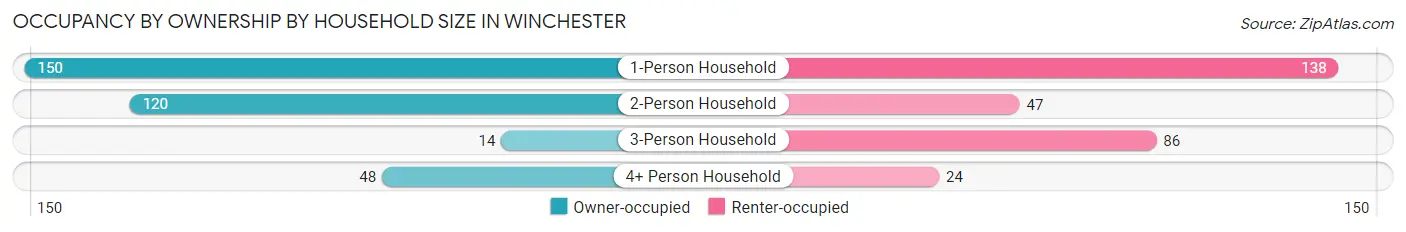
| Household Size | Owner-occupied | Renter-occupied |
| 1-Person Household | 150 (52.1%) | 138 (47.9%) |
| 2-Person Household | 120 (71.9%) | 47 (28.1%) |
| 3-Person Household | 14 (14.0%) | 86 (86.0%) |
| 4+ Person Household | 48 (66.7%) | 24 (33.3%) |
| Total Housing Units | 332 (52.9%) | 295 (47.0%) |
Occupancy by Educational Attainment in Winchester
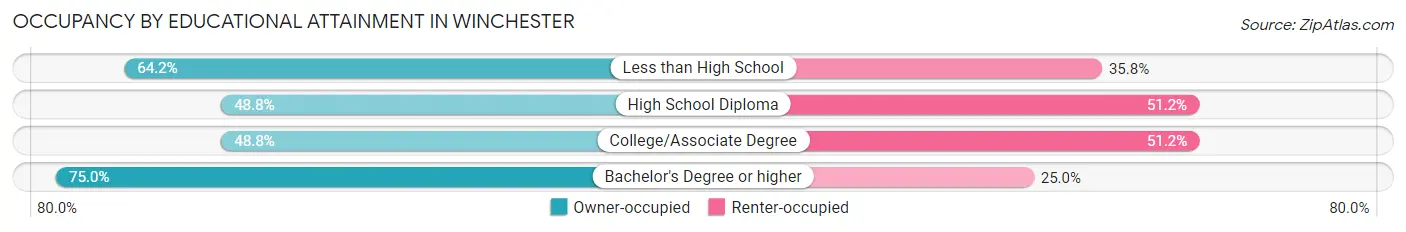
| Household Size | Owner-occupied | Renter-occupied |
| Less than High School | 43 (64.2%) | 24 (35.8%) |
| High School Diploma | 164 (48.8%) | 172 (51.2%) |
| College/Associate Degree | 80 (48.8%) | 84 (51.2%) |
| Bachelor's Degree or higher | 45 (75.0%) | 15 (25.0%) |
Occupancy by Age of Householder in Winchester
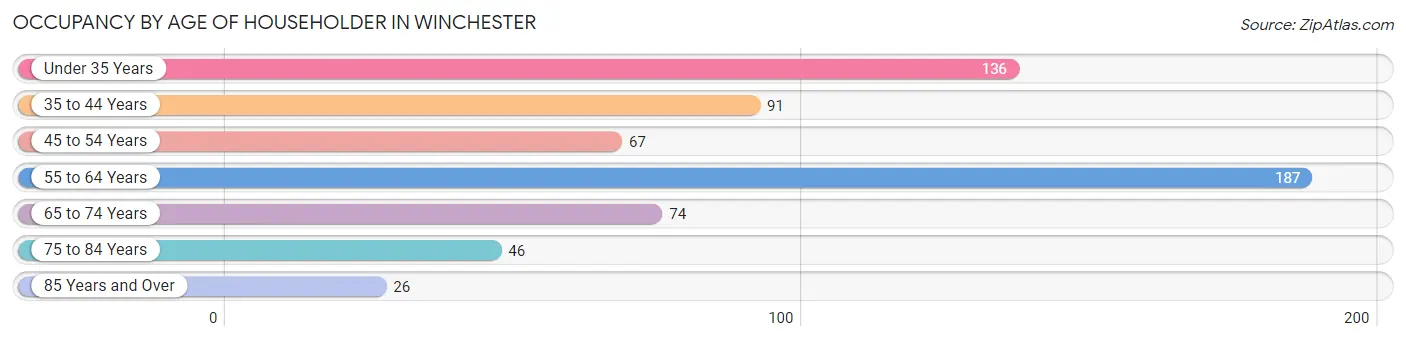
| Age Bracket | # Households | % Households |
| Under 35 Years | 136 | 21.7% |
| 35 to 44 Years | 91 | 14.5% |
| 45 to 54 Years | 67 | 10.7% |
| 55 to 64 Years | 187 | 29.8% |
| 65 to 74 Years | 74 | 11.8% |
| 75 to 84 Years | 46 | 7.3% |
| 85 Years and Over | 26 | 4.2% |
| Total | 627 | 100.0% |
Housing Finances in Winchester
Median Income by Occupancy in Winchester
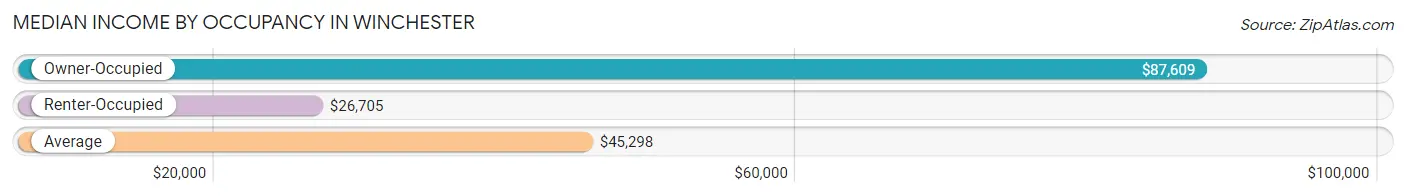
| Occupancy Type | # Households | Median Income |
| Owner-Occupied | 332 (52.9%) | $87,609 |
| Renter-Occupied | 295 (47.0%) | $26,705 |
| Average | 627 (100.0%) | $45,298 |
Occupancy by Householder Income Bracket in Winchester
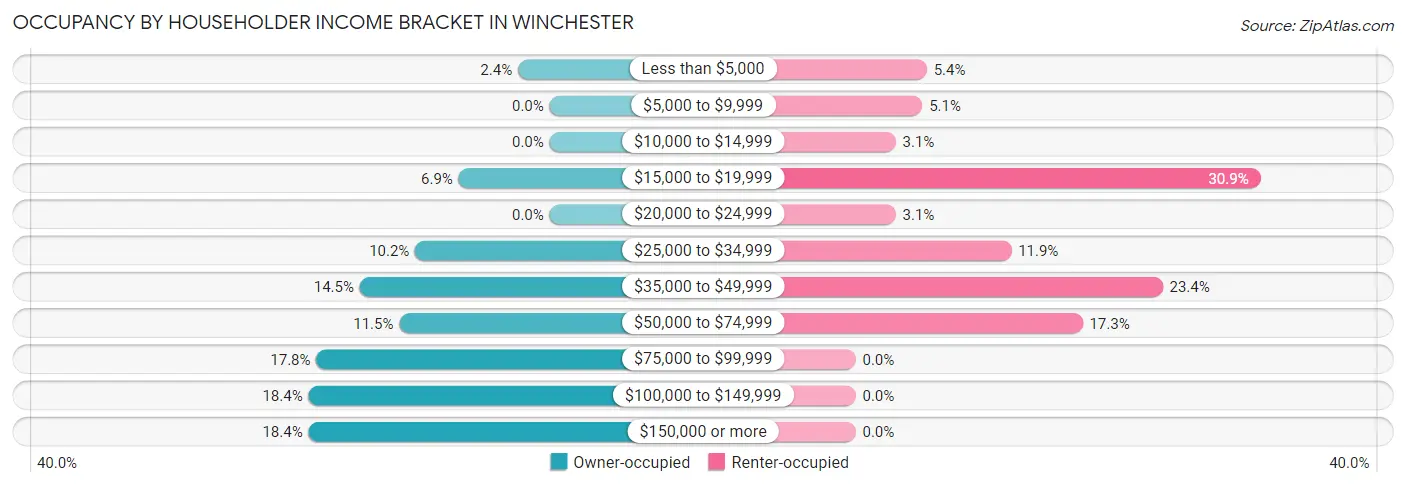
| Income Bracket | Owner-occupied | Renter-occupied |
| Less than $5,000 | 8 (2.4%) | 16 (5.4%) |
| $5,000 to $9,999 | 0 (0.0%) | 15 (5.1%) |
| $10,000 to $14,999 | 0 (0.0%) | 9 (3.0%) |
| $15,000 to $19,999 | 23 (6.9%) | 91 (30.8%) |
| $20,000 to $24,999 | 0 (0.0%) | 9 (3.0%) |
| $25,000 to $34,999 | 34 (10.2%) | 35 (11.9%) |
| $35,000 to $49,999 | 48 (14.5%) | 69 (23.4%) |
| $50,000 to $74,999 | 38 (11.5%) | 51 (17.3%) |
| $75,000 to $99,999 | 59 (17.8%) | 0 (0.0%) |
| $100,000 to $149,999 | 61 (18.4%) | 0 (0.0%) |
| $150,000 or more | 61 (18.4%) | 0 (0.0%) |
| Total | 332 (100.0%) | 295 (100.0%) |
Monthly Housing Cost Tiers in Winchester
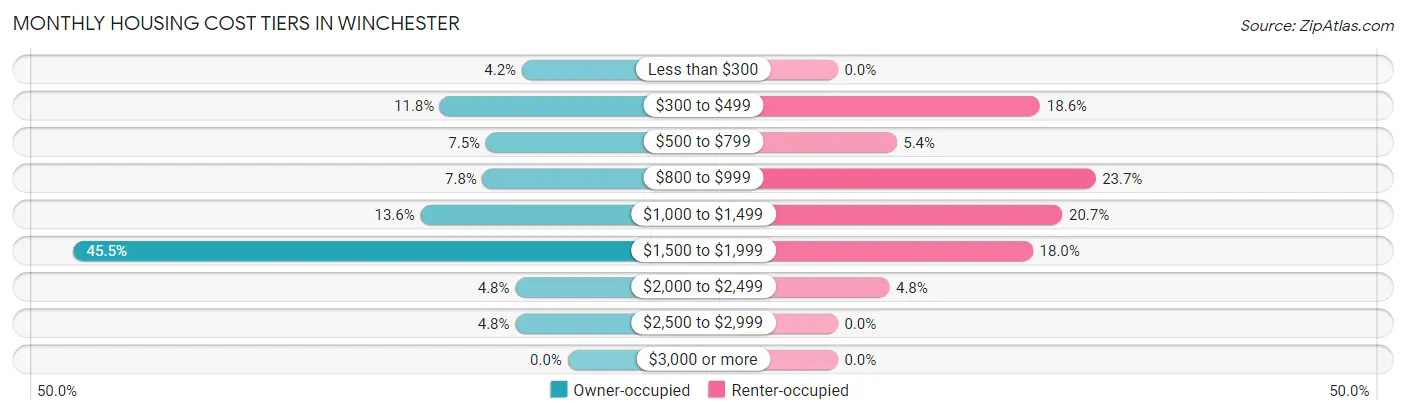
| Monthly Cost | Owner-occupied | Renter-occupied |
| Less than $300 | 14 (4.2%) | 0 (0.0%) |
| $300 to $499 | 39 (11.7%) | 55 (18.6%) |
| $500 to $799 | 25 (7.5%) | 16 (5.4%) |
| $800 to $999 | 26 (7.8%) | 70 (23.7%) |
| $1,000 to $1,499 | 45 (13.6%) | 61 (20.7%) |
| $1,500 to $1,999 | 151 (45.5%) | 53 (18.0%) |
| $2,000 to $2,499 | 16 (4.8%) | 14 (4.8%) |
| $2,500 to $2,999 | 16 (4.8%) | 0 (0.0%) |
| $3,000 or more | 0 (0.0%) | 0 (0.0%) |
| Total | 332 (100.0%) | 295 (100.0%) |
Physical Housing Characteristics in Winchester
Housing Structures in Winchester
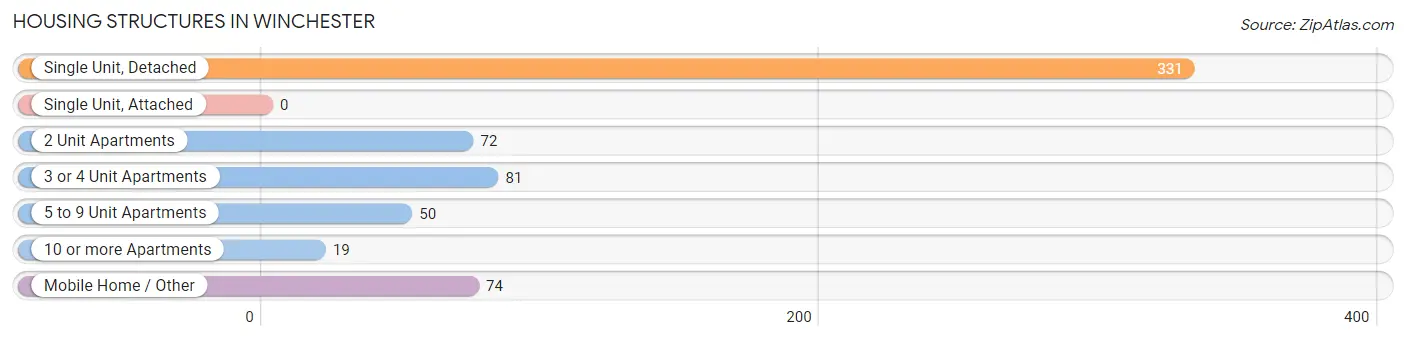
| Structure Type | # Housing Units | % Housing Units |
| Single Unit, Detached | 331 | 52.8% |
| Single Unit, Attached | 0 | 0.0% |
| 2 Unit Apartments | 72 | 11.5% |
| 3 or 4 Unit Apartments | 81 | 12.9% |
| 5 to 9 Unit Apartments | 50 | 8.0% |
| 10 or more Apartments | 19 | 3.0% |
| Mobile Home / Other | 74 | 11.8% |
| Total | 627 | 100.0% |
Housing Structures by Occupancy in Winchester
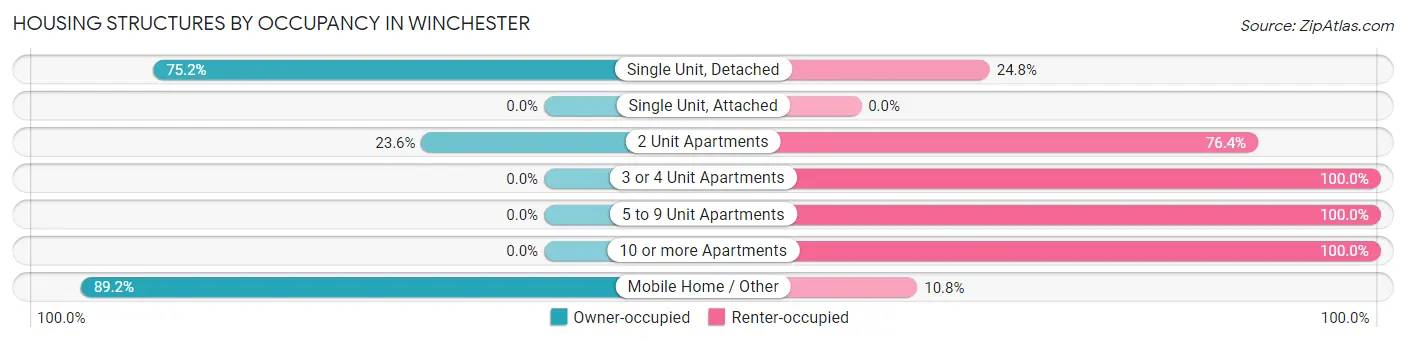
| Structure Type | Owner-occupied | Renter-occupied |
| Single Unit, Detached | 249 (75.2%) | 82 (24.8%) |
| Single Unit, Attached | 0 (0.0%) | 0 (0.0%) |
| 2 Unit Apartments | 17 (23.6%) | 55 (76.4%) |
| 3 or 4 Unit Apartments | 0 (0.0%) | 81 (100.0%) |
| 5 to 9 Unit Apartments | 0 (0.0%) | 50 (100.0%) |
| 10 or more Apartments | 0 (0.0%) | 19 (100.0%) |
| Mobile Home / Other | 66 (89.2%) | 8 (10.8%) |
| Total | 332 (52.9%) | 295 (47.0%) |
Housing Structures by Number of Rooms in Winchester
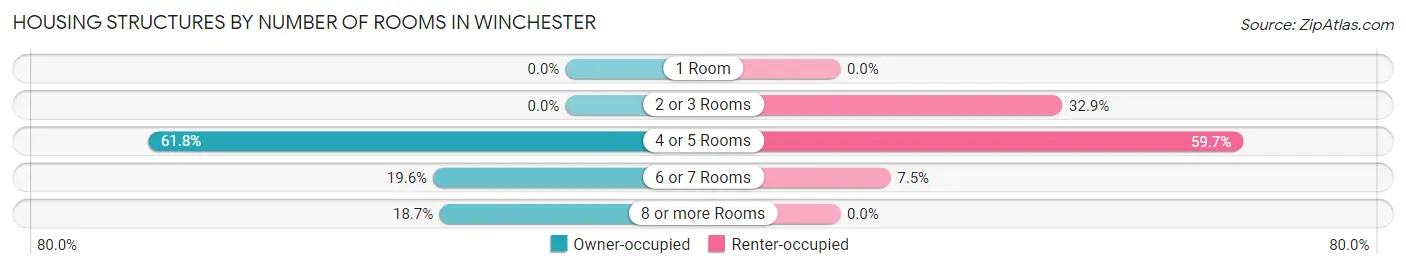
| Number of Rooms | Owner-occupied | Renter-occupied |
| 1 Room | 0 (0.0%) | 0 (0.0%) |
| 2 or 3 Rooms | 0 (0.0%) | 97 (32.9%) |
| 4 or 5 Rooms | 205 (61.8%) | 176 (59.7%) |
| 6 or 7 Rooms | 65 (19.6%) | 22 (7.5%) |
| 8 or more Rooms | 62 (18.7%) | 0 (0.0%) |
| Total | 332 (100.0%) | 295 (100.0%) |
Housing Structure by Heating Type in Winchester
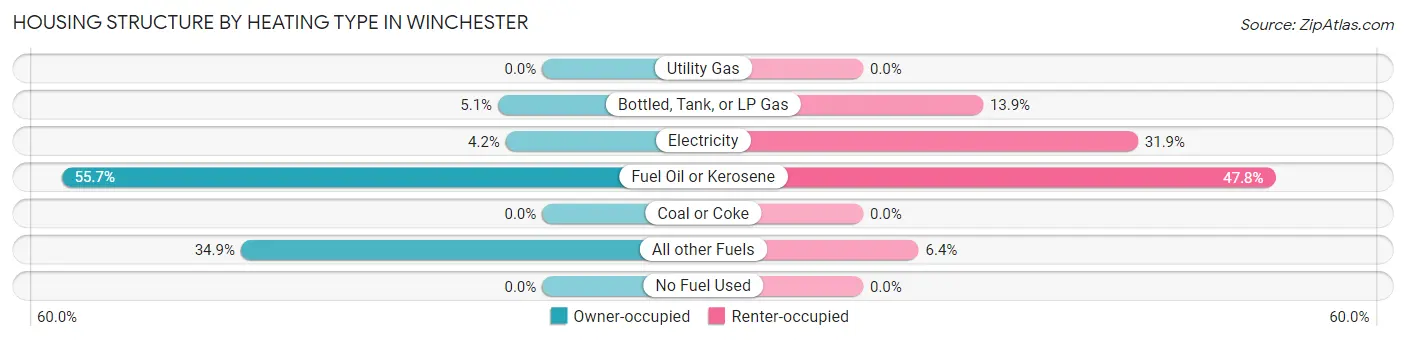
| Heating Type | Owner-occupied | Renter-occupied |
| Utility Gas | 0 (0.0%) | 0 (0.0%) |
| Bottled, Tank, or LP Gas | 17 (5.1%) | 41 (13.9%) |
| Electricity | 14 (4.2%) | 94 (31.9%) |
| Fuel Oil or Kerosene | 185 (55.7%) | 141 (47.8%) |
| Coal or Coke | 0 (0.0%) | 0 (0.0%) |
| All other Fuels | 116 (34.9%) | 19 (6.4%) |
| No Fuel Used | 0 (0.0%) | 0 (0.0%) |
| Total | 332 (100.0%) | 295 (100.0%) |
Household Vehicle Usage in Winchester
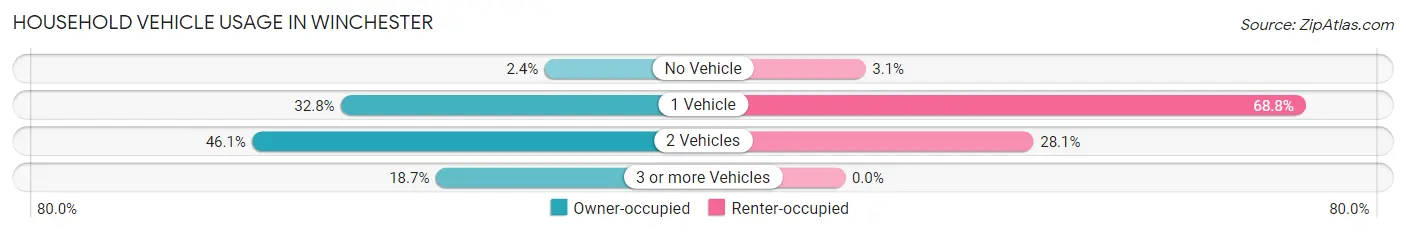
| Vehicles per Household | Owner-occupied | Renter-occupied |
| No Vehicle | 8 (2.4%) | 9 (3.0%) |
| 1 Vehicle | 109 (32.8%) | 203 (68.8%) |
| 2 Vehicles | 153 (46.1%) | 83 (28.1%) |
| 3 or more Vehicles | 62 (18.7%) | 0 (0.0%) |
| Total | 332 (100.0%) | 295 (100.0%) |
Real Estate & Mortgages in Winchester
Real Estate and Mortgage Overview in Winchester
| Characteristic | Without Mortgage | With Mortgage |
| Housing Units | 129 | 203 |
| Median Property Value | - | - |
| Median Household Income | $71,417 | $41 |
| Monthly Housing Costs | $646 | $0 |
| Real Estate Taxes | - | - |
Property Value by Mortgage Status in Winchester
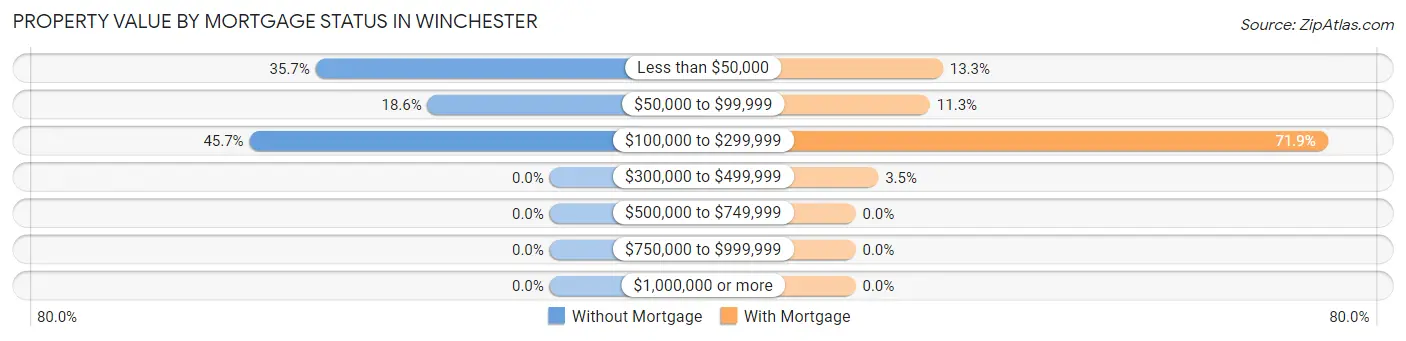
| Property Value | Without Mortgage | With Mortgage |
| Less than $50,000 | 46 (35.7%) | 27 (13.3%) |
| $50,000 to $99,999 | 24 (18.6%) | 23 (11.3%) |
| $100,000 to $299,999 | 59 (45.7%) | 146 (71.9%) |
| $300,000 to $499,999 | 0 (0.0%) | 7 (3.5%) |
| $500,000 to $749,999 | 0 (0.0%) | 0 (0.0%) |
| $750,000 to $999,999 | 0 (0.0%) | 0 (0.0%) |
| $1,000,000 or more | 0 (0.0%) | 0 (0.0%) |
| Total | 129 (100.0%) | 203 (100.0%) |
Household Income by Mortgage Status in Winchester
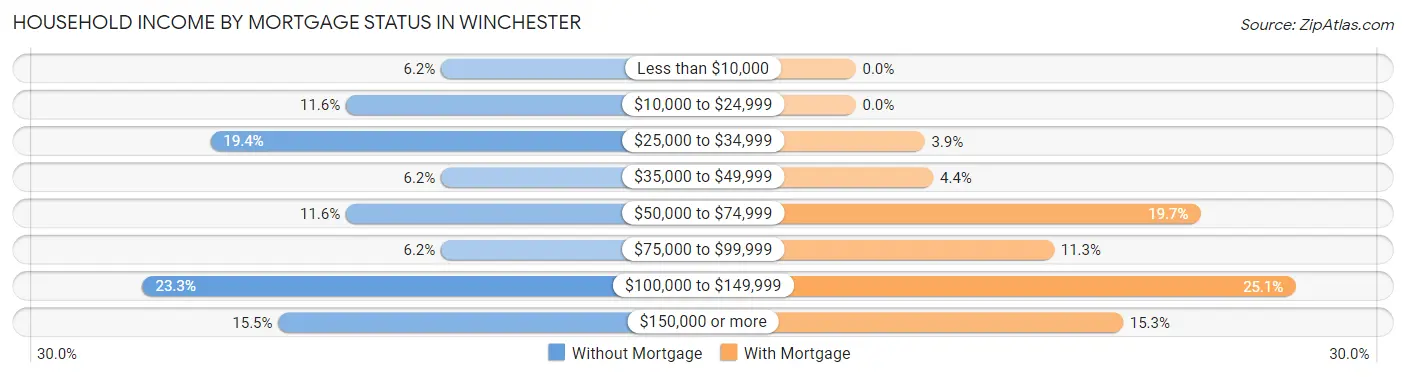
| Household Income | Without Mortgage | With Mortgage |
| Less than $10,000 | 8 (6.2%) | 0 (0.0%) |
| $10,000 to $24,999 | 15 (11.6%) | 0 (0.0%) |
| $25,000 to $34,999 | 25 (19.4%) | 8 (3.9%) |
| $35,000 to $49,999 | 8 (6.2%) | 9 (4.4%) |
| $50,000 to $74,999 | 15 (11.6%) | 40 (19.7%) |
| $75,000 to $99,999 | 8 (6.2%) | 23 (11.3%) |
| $100,000 to $149,999 | 30 (23.3%) | 51 (25.1%) |
| $150,000 or more | 20 (15.5%) | 31 (15.3%) |
| Total | 129 (100.0%) | 203 (100.0%) |
Property Value to Household Income Ratio in Winchester
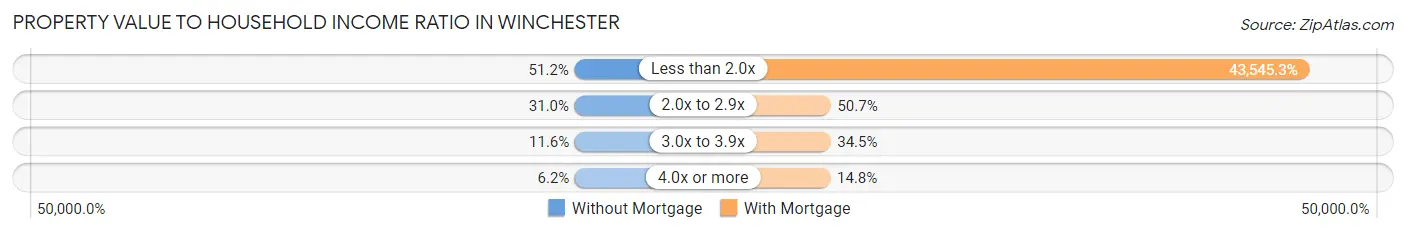
| Value-to-Income Ratio | Without Mortgage | With Mortgage |
| Less than 2.0x | 66 (51.2%) | 88,397 (43,545.3%) |
| 2.0x to 2.9x | 40 (31.0%) | 103 (50.7%) |
| 3.0x to 3.9x | 15 (11.6%) | 70 (34.5%) |
| 4.0x or more | 8 (6.2%) | 30 (14.8%) |
| Total | 129 (100.0%) | 203 (100.0%) |
Real Estate Taxes by Mortgage Status in Winchester
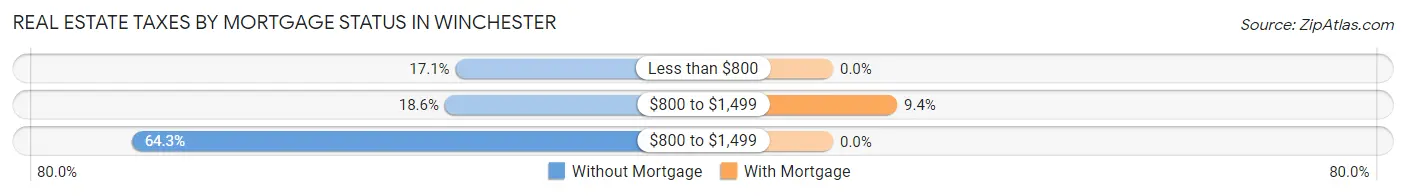
| Property Taxes | Without Mortgage | With Mortgage |
| Less than $800 | 22 (17.1%) | 0 (0.0%) |
| $800 to $1,499 | 24 (18.6%) | 19 (9.4%) |
| $800 to $1,499 | 83 (64.3%) | 0 (0.0%) |
| Total | 129 (100.0%) | 203 (100.0%) |
Health & Disability in Winchester
Health Insurance Coverage by Age in Winchester
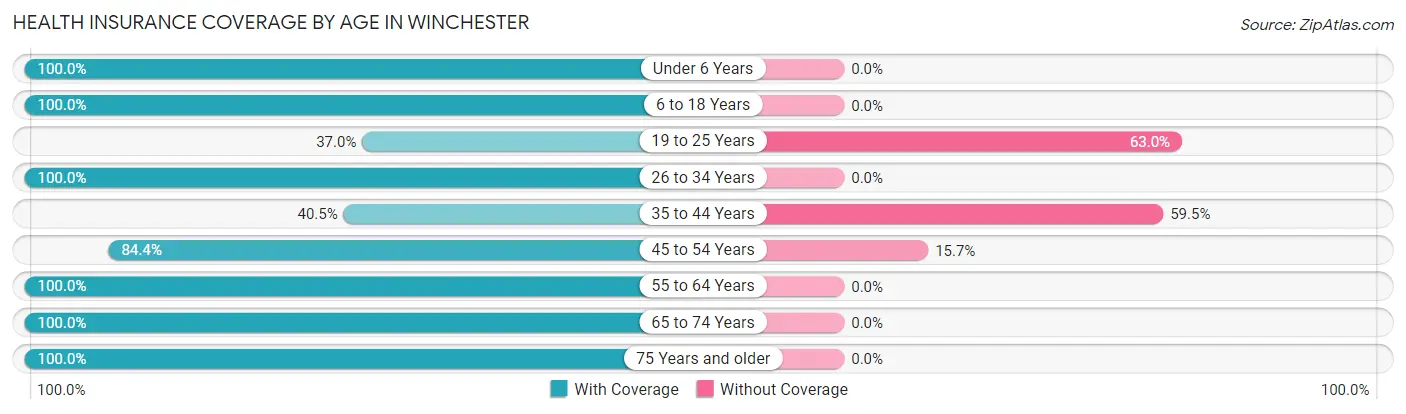
| Age Bracket | With Coverage | Without Coverage |
| Under 6 Years | 181 (100.0%) | 0 (0.0%) |
| 6 to 18 Years | 167 (100.0%) | 0 (0.0%) |
| 19 to 25 Years | 40 (37.0%) | 68 (63.0%) |
| 26 to 34 Years | 143 (100.0%) | 0 (0.0%) |
| 35 to 44 Years | 62 (40.5%) | 91 (59.5%) |
| 45 to 54 Years | 124 (84.4%) | 23 (15.7%) |
| 55 to 64 Years | 275 (100.0%) | 0 (0.0%) |
| 65 to 74 Years | 106 (100.0%) | 0 (0.0%) |
| 75 Years and older | 89 (100.0%) | 0 (0.0%) |
| Total | 1,187 (86.7%) | 182 (13.3%) |
Health Insurance Coverage by Citizenship Status in Winchester
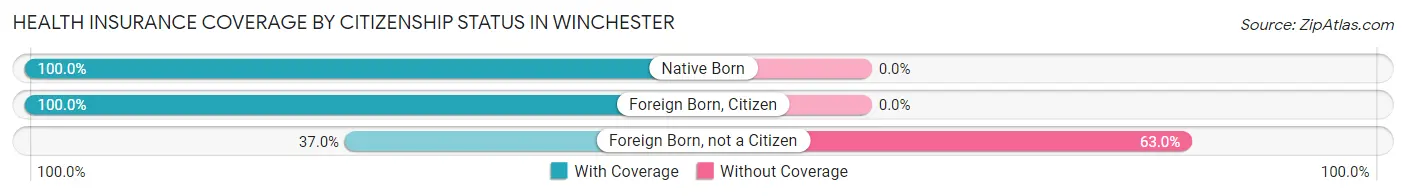
| Citizenship Status | With Coverage | Without Coverage |
| Native Born | 181 (100.0%) | 0 (0.0%) |
| Foreign Born, Citizen | 167 (100.0%) | 0 (0.0%) |
| Foreign Born, not a Citizen | 40 (37.0%) | 68 (63.0%) |
Health Insurance Coverage by Household Income in Winchester
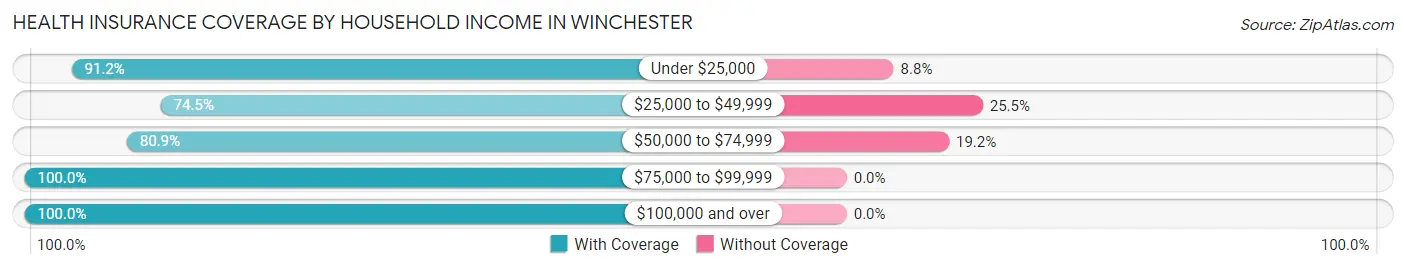
| Household Income | With Coverage | Without Coverage |
| Under $25,000 | 270 (91.2%) | 26 (8.8%) |
| $25,000 to $49,999 | 351 (74.5%) | 120 (25.5%) |
| $50,000 to $74,999 | 152 (80.8%) | 36 (19.2%) |
| $75,000 to $99,999 | 77 (100.0%) | 0 (0.0%) |
| $100,000 and over | 337 (100.0%) | 0 (0.0%) |
Public vs Private Health Insurance Coverage by Age in Winchester
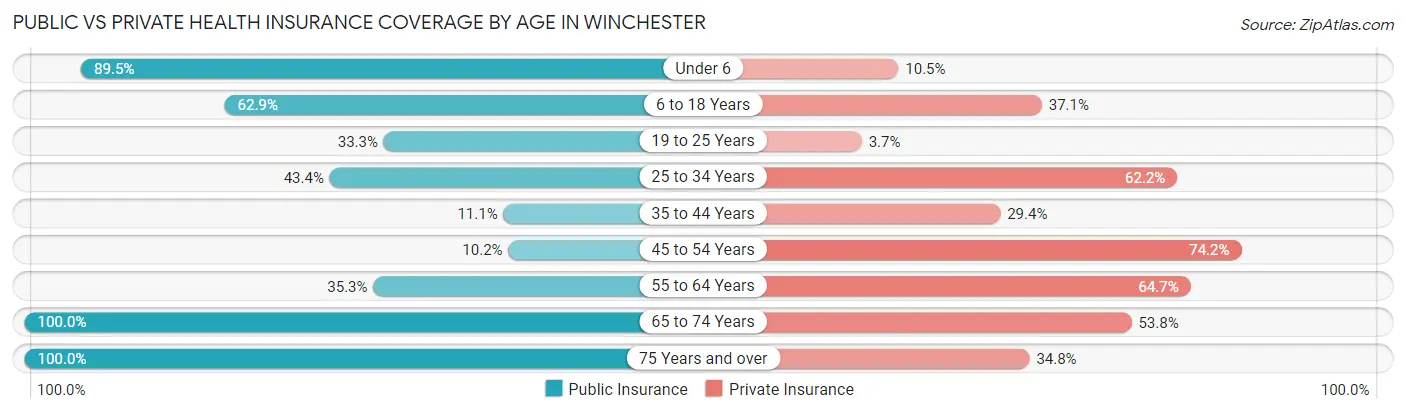
| Age Bracket | Public Insurance | Private Insurance |
| Under 6 | 162 (89.5%) | 19 (10.5%) |
| 6 to 18 Years | 105 (62.9%) | 62 (37.1%) |
| 19 to 25 Years | 36 (33.3%) | 4 (3.7%) |
| 25 to 34 Years | 62 (43.4%) | 89 (62.2%) |
| 35 to 44 Years | 17 (11.1%) | 45 (29.4%) |
| 45 to 54 Years | 15 (10.2%) | 109 (74.2%) |
| 55 to 64 Years | 97 (35.3%) | 178 (64.7%) |
| 65 to 74 Years | 106 (100.0%) | 57 (53.8%) |
| 75 Years and over | 89 (100.0%) | 31 (34.8%) |
| Total | 689 (50.3%) | 594 (43.4%) |
Disability Status by Sex by Age in Winchester
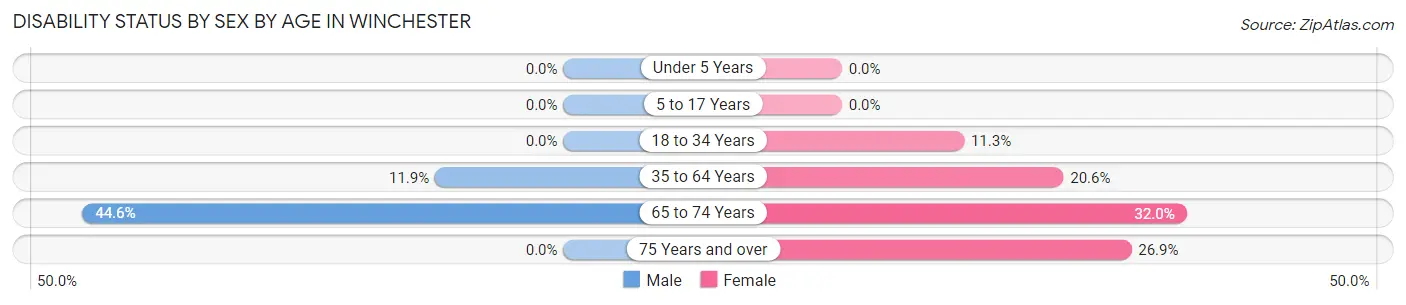
| Age Bracket | Male | Female |
| Under 5 Years | 0 (0.0%) | 0 (0.0%) |
| 5 to 17 Years | 0 (0.0%) | 0 (0.0%) |
| 18 to 34 Years | 0 (0.0%) | 11 (11.3%) |
| 35 to 64 Years | 43 (11.9%) | 44 (20.6%) |
| 65 to 74 Years | 25 (44.6%) | 16 (32.0%) |
| 75 Years and over | 0 (0.0%) | 18 (26.9%) |
Disability Class by Sex by Age in Winchester
Disability Class: Hearing Difficulty
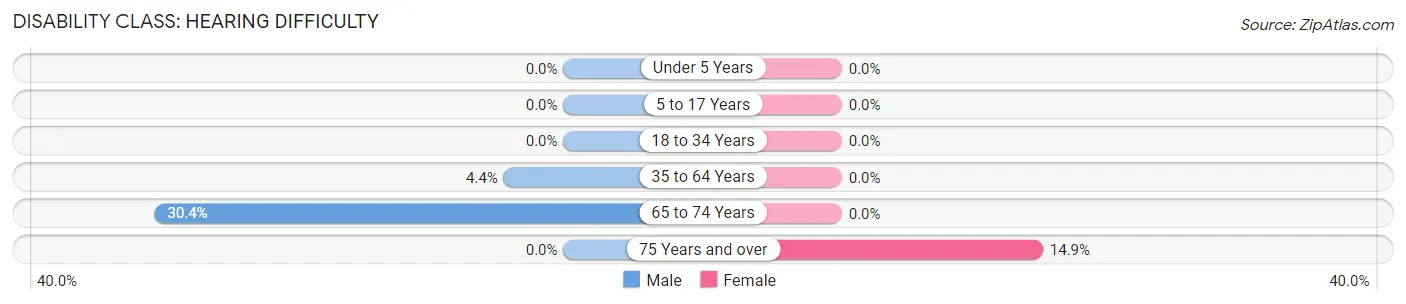
| Age Bracket | Male | Female |
| Under 5 Years | 0 (0.0%) | 0 (0.0%) |
| 5 to 17 Years | 0 (0.0%) | 0 (0.0%) |
| 18 to 34 Years | 0 (0.0%) | 0 (0.0%) |
| 35 to 64 Years | 16 (4.4%) | 0 (0.0%) |
| 65 to 74 Years | 17 (30.4%) | 0 (0.0%) |
| 75 Years and over | 0 (0.0%) | 10 (14.9%) |
Disability Class: Vision Difficulty
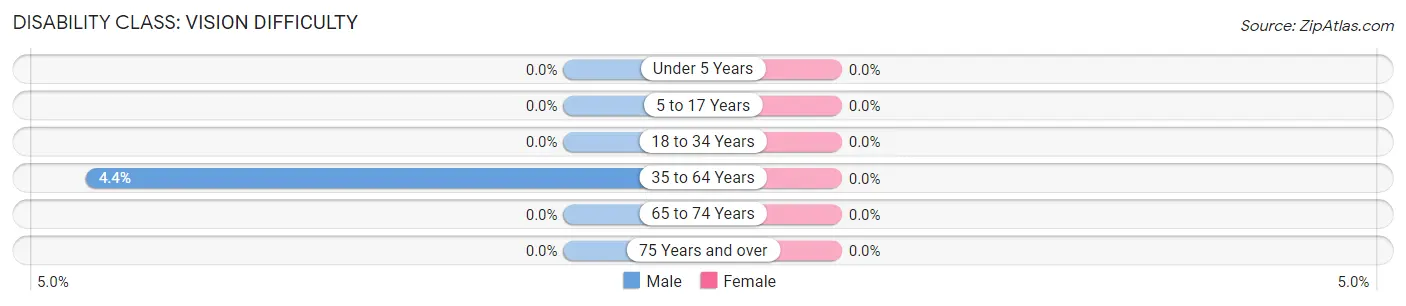
| Age Bracket | Male | Female |
| Under 5 Years | 0 (0.0%) | 0 (0.0%) |
| 5 to 17 Years | 0 (0.0%) | 0 (0.0%) |
| 18 to 34 Years | 0 (0.0%) | 0 (0.0%) |
| 35 to 64 Years | 16 (4.4%) | 0 (0.0%) |
| 65 to 74 Years | 0 (0.0%) | 0 (0.0%) |
| 75 Years and over | 0 (0.0%) | 0 (0.0%) |
Disability Class: Cognitive Difficulty
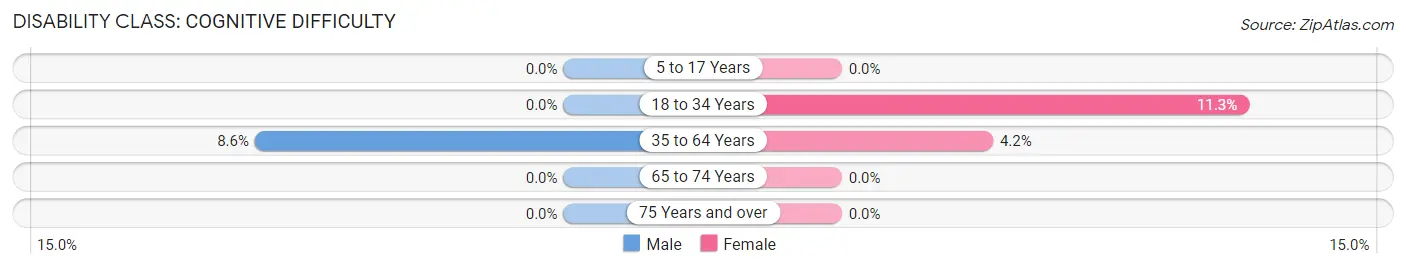
| Age Bracket | Male | Female |
| 5 to 17 Years | 0 (0.0%) | 0 (0.0%) |
| 18 to 34 Years | 0 (0.0%) | 11 (11.3%) |
| 35 to 64 Years | 31 (8.6%) | 9 (4.2%) |
| 65 to 74 Years | 0 (0.0%) | 0 (0.0%) |
| 75 Years and over | 0 (0.0%) | 0 (0.0%) |
Disability Class: Ambulatory Difficulty
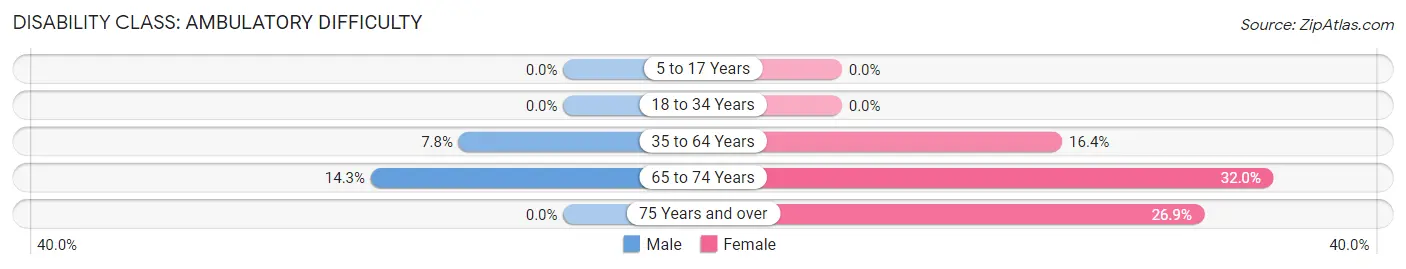
| Age Bracket | Male | Female |
| 5 to 17 Years | 0 (0.0%) | 0 (0.0%) |
| 18 to 34 Years | 0 (0.0%) | 0 (0.0%) |
| 35 to 64 Years | 28 (7.8%) | 35 (16.4%) |
| 65 to 74 Years | 8 (14.3%) | 16 (32.0%) |
| 75 Years and over | 0 (0.0%) | 18 (26.9%) |
Disability Class: Self-Care Difficulty
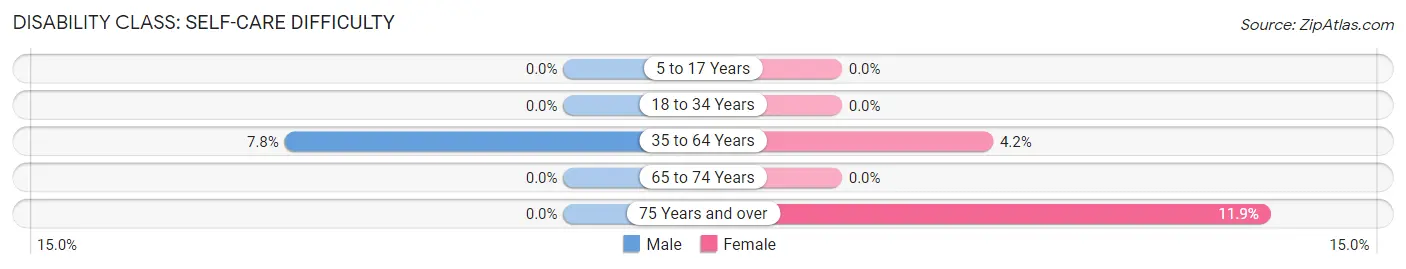
| Age Bracket | Male | Female |
| 5 to 17 Years | 0 (0.0%) | 0 (0.0%) |
| 18 to 34 Years | 0 (0.0%) | 0 (0.0%) |
| 35 to 64 Years | 28 (7.8%) | 9 (4.2%) |
| 65 to 74 Years | 0 (0.0%) | 0 (0.0%) |
| 75 Years and over | 0 (0.0%) | 8 (11.9%) |
Technology Access in Winchester
Computing Device Access in Winchester
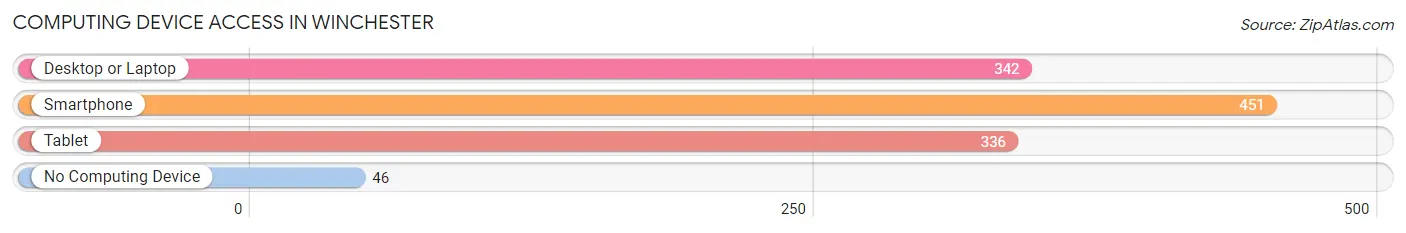
| Device Type | # Households | % Households |
| Desktop or Laptop | 342 | 54.5% |
| Smartphone | 451 | 71.9% |
| Tablet | 336 | 53.6% |
| No Computing Device | 46 | 7.3% |
| Total | 627 | 100.0% |
Internet Access in Winchester
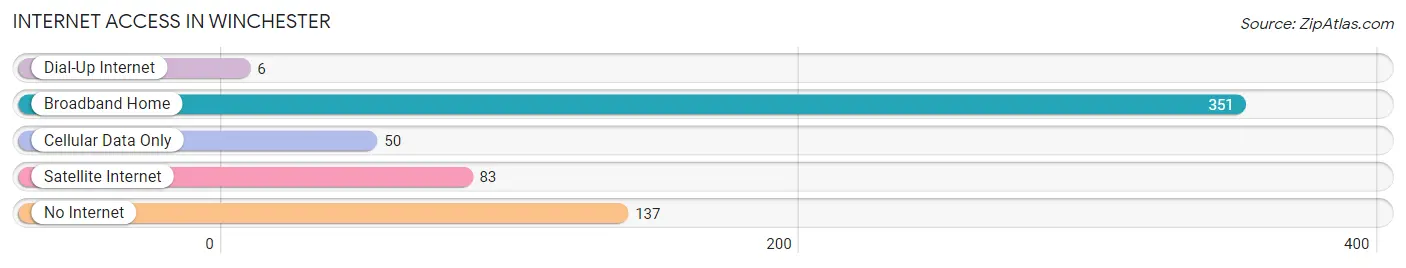
| Internet Type | # Households | % Households |
| Dial-Up Internet | 6 | 1.0% |
| Broadband Home | 351 | 56.0% |
| Cellular Data Only | 50 | 8.0% |
| Satellite Internet | 83 | 13.2% |
| No Internet | 137 | 21.8% |
| Total | 627 | 100.0% |
Winchester Summary
Winchester, New Hampshire is a small town located in Cheshire County in the southwestern corner of the state. It is bordered by the towns of Swanzey, Keene, and Fitzwilliam. The town has a population of 1,717 people, according to the 2010 census.
Geography
Winchester is located in the Monadnock Region of New Hampshire, which is known for its rolling hills and picturesque landscapes. The town is situated in the Connecticut River Valley, with the Ashuelot River running through it. The town is mostly rural, with a few small villages scattered throughout. The highest point in the town is the summit of Mount Monadnock, which stands at 3,165 feet.
The town is home to several lakes, including Lake Monomonac, Lake Contoocook, and Lake Warren. The town also has several streams, including the Ashuelot River, which runs through the center of town.
History
Winchester was first settled in 1753 by settlers from Massachusetts. The town was originally part of the town of Swanzey, but was incorporated as its own town in 1771. The town was named after Winchester, Massachusetts, which was the hometown of many of the original settlers.
The town was an agricultural community for much of its history, with dairy farming being the primary industry. The town also had several mills, including a sawmill, gristmill, and a woolen mill.
In the late 19th century, the town began to develop a tourism industry, with several hotels and resorts being built in the area. The town also had a thriving summer camp industry, with several camps located in the area.
Economy
Today, Winchester is a largely rural community, with a few small businesses located in the town. The town is home to several small farms, as well as a few small businesses, such as a general store, a hardware store, and a few restaurants.
The town is also home to several small manufacturing companies, including a furniture manufacturer, a plastics manufacturer, and a printing company. The town also has a few small retail stores, including a grocery store and a few clothing stores.
Demographics
According to the 2010 census, the population of Winchester was 1,717 people. The town has a median household income of $50,945, and a median family income of $60,945. The town has a poverty rate of 8.3%, which is lower than the state average of 9.2%.
The town is predominantly white, with 95.3% of the population being white. The town also has a small Hispanic population, with 2.2% of the population being Hispanic or Latino. The town also has a small African American population, with 0.7% of the population being African American.
Conclusion
Winchester, New Hampshire is a small town located in the Monadnock Region of the state. The town has a population of 1,717 people, and is mostly rural, with a few small villages scattered throughout. The town has a median household income of $50,945, and a poverty rate of 8.3%. The town is predominantly white, with 95.3% of the population being white. The town also has a small Hispanic population, with 2.2% of the population being Hispanic or Latino. The town is home to several small businesses, as well as a few small manufacturing companies. Winchester is a picturesque town with a rich history and a bright future.
Common Questions
What is Per Capita Income in Winchester?
Per Capita income in Winchester is $31,804.
What is the Median Household income in Winchester?
Median Household Income in Winchester is $45,298.
What is Income or Wage Gap in Winchester?
Income or Wage Gap in Winchester is 61.8%.
Women in Winchester earn 38.2 cents for every dollar earned by a man.
What is Inequality or Gini Index in Winchester?
Inequality or Gini Index in Winchester is 0.46.
What is the Total Population of Winchester?
Total Population of Winchester is 1,369.
What is the Total Male Population of Winchester?
Total Male Population of Winchester is 763.
What is the Total Female Population of Winchester?
Total Female Population of Winchester is 606.
What is the Ratio of Males per 100 Females in Winchester?
There are 125.91 Males per 100 Females in Winchester.
What is the Ratio of Females per 100 Males in Winchester?
There are 79.42 Females per 100 Males in Winchester.
What is the Median Population Age in Winchester?
Median Population Age in Winchester is 42.7 Years.
What is the Average Family Size in Winchester
Average Family Size in Winchester is 3.1 People.
What is the Average Household Size in Winchester
Average Household Size in Winchester is 2.2 People.
How Large is the Labor Force in Winchester?
There are 638 People in the Labor Forcein in Winchester.
What is the Percentage of People in the Labor Force in Winchester?
59.0% of People are in the Labor Force in Winchester.
What is the Unemployment Rate in Winchester?
Unemployment Rate in Winchester is 6.0%.