Bethlehem, NH Map & Demographics
Bethlehem Map
Bethlehem Overview
$30,199
PER CAPITA INCOME
$80,329
AVG FAMILY INCOME
$62,647
AVG HOUSEHOLD INCOME
44.1%
WAGE / INCOME GAP [ % ]
55.9¢/ $1
WAGE / INCOME GAP [ $ ]
0.41
INEQUALITY / GINI INDEX
957
TOTAL POPULATION
402
MALE POPULATION
555
FEMALE POPULATION
72.43
MALES / 100 FEMALES
138.06
FEMALES / 100 MALES
47.1
MEDIAN AGE
3.2
AVG FAMILY SIZE
2.6
AVG HOUSEHOLD SIZE
512
LABOR FORCE [ PEOPLE ]
63.9%
PERCENT IN LABOR FORCE
1.8%
UNEMPLOYMENT RATE
Bethlehem Zip Codes
Bethlehem Area Codes
Income in Bethlehem
Income Overview in Bethlehem
Per Capita Income in Bethlehem is $30,199, while median incomes of families and households are $80,329 and $62,647 respectively.
| Characteristic | Number | Measure |
| Per Capita Income | 957 | $30,199 |
| Median Family Income | 255 | $80,329 |
| Mean Family Income | 255 | $82,638 |
| Median Household Income | 368 | $62,647 |
| Mean Household Income | 368 | $68,802 |
| Income Deficit | 255 | $0 |
| Wage / Income Gap (%) | 957 | 44.07% |
| Wage / Income Gap ($) | 957 | 55.93¢ per $1 |
| Gini / Inequality Index | 957 | 0.41 |
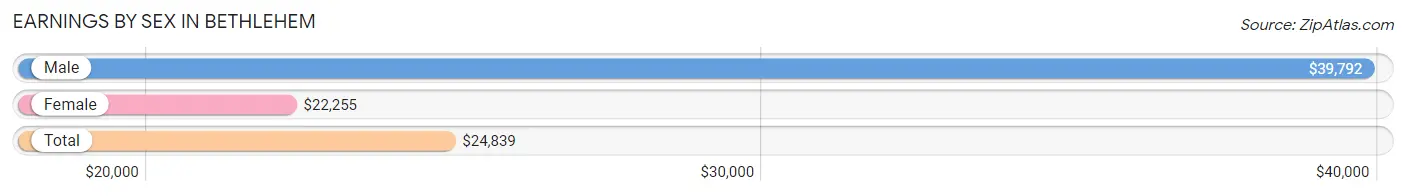
Earnings by Sex in Bethlehem
Average Earnings in Bethlehem are $24,839, $39,792 for men and $22,255 for women, a difference of 44.1%.
| Sex | Number | Average Earnings |
| Male | 147 (26.9%) | $39,792 |
| Female | 399 (73.1%) | $22,255 |
| Total | 546 (100.0%) | $24,839 |
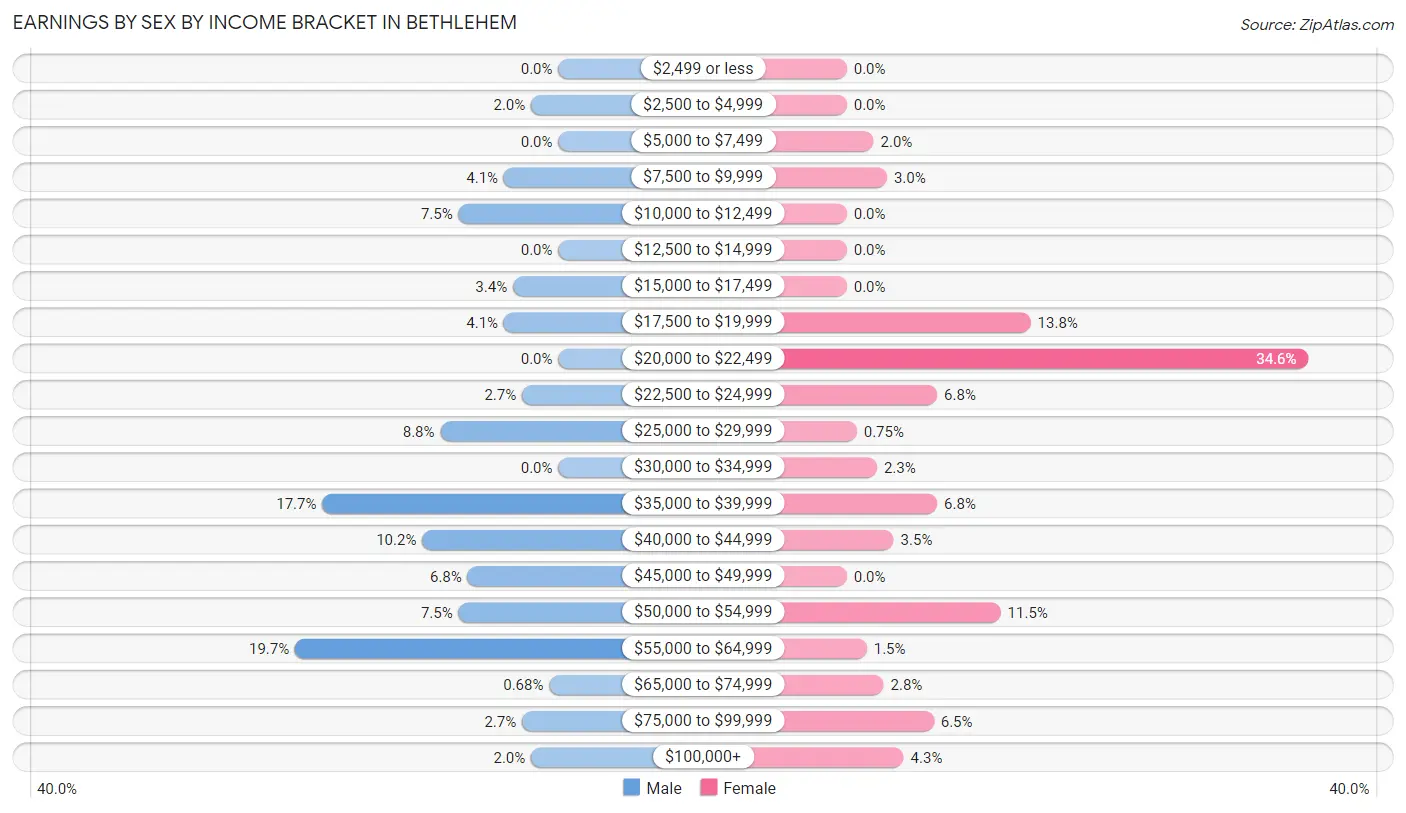
Earnings by Sex by Income Bracket in Bethlehem
The most common earnings brackets in Bethlehem are $55,000 to $64,999 for men (29 | 19.7%) and $20,000 to $22,499 for women (138 | 34.6%).
| Income | Male | Female |
| $2,499 or less | 0 (0.0%) | 0 (0.0%) |
| $2,500 to $4,999 | 3 (2.0%) | 0 (0.0%) |
| $5,000 to $7,499 | 0 (0.0%) | 8 (2.0%) |
| $7,500 to $9,999 | 6 (4.1%) | 12 (3.0%) |
| $10,000 to $12,499 | 11 (7.5%) | 0 (0.0%) |
| $12,500 to $14,999 | 0 (0.0%) | 0 (0.0%) |
| $15,000 to $17,499 | 5 (3.4%) | 0 (0.0%) |
| $17,500 to $19,999 | 6 (4.1%) | 55 (13.8%) |
| $20,000 to $22,499 | 0 (0.0%) | 138 (34.6%) |
| $22,500 to $24,999 | 4 (2.7%) | 27 (6.8%) |
| $25,000 to $29,999 | 13 (8.8%) | 3 (0.7%) |
| $30,000 to $34,999 | 0 (0.0%) | 9 (2.3%) |
| $35,000 to $39,999 | 26 (17.7%) | 27 (6.8%) |
| $40,000 to $44,999 | 15 (10.2%) | 14 (3.5%) |
| $45,000 to $49,999 | 10 (6.8%) | 0 (0.0%) |
| $50,000 to $54,999 | 11 (7.5%) | 46 (11.5%) |
| $55,000 to $64,999 | 29 (19.7%) | 6 (1.5%) |
| $65,000 to $74,999 | 1 (0.7%) | 11 (2.8%) |
| $75,000 to $99,999 | 4 (2.7%) | 26 (6.5%) |
| $100,000+ | 3 (2.0%) | 17 (4.3%) |
| Total | 147 (100.0%) | 399 (100.0%) |
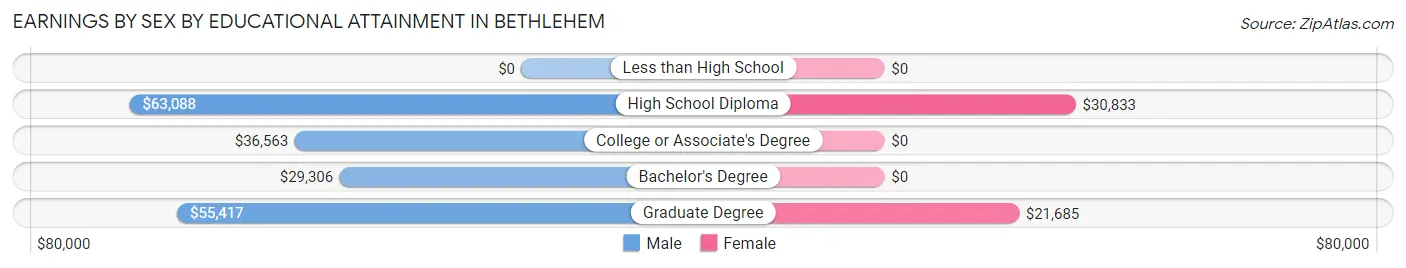
Earnings by Sex by Educational Attainment in Bethlehem
| Educational Attainment | Male Income | Female Income |
| Less than High School | - | - |
| High School Diploma | $63,088 | $30,833 |
| College or Associate's Degree | $36,563 | $0 |
| Bachelor's Degree | $29,306 | $0 |
| Graduate Degree | $55,417 | $21,685 |
| Total | $42,321 | $0 |
Family Income in Bethlehem
Family Income Brackets in Bethlehem
According to the Bethlehem family income data, there are 73 families falling into the $100,000 to $149,999 income range, which is the most common income bracket and makes up 28.6% of all families.
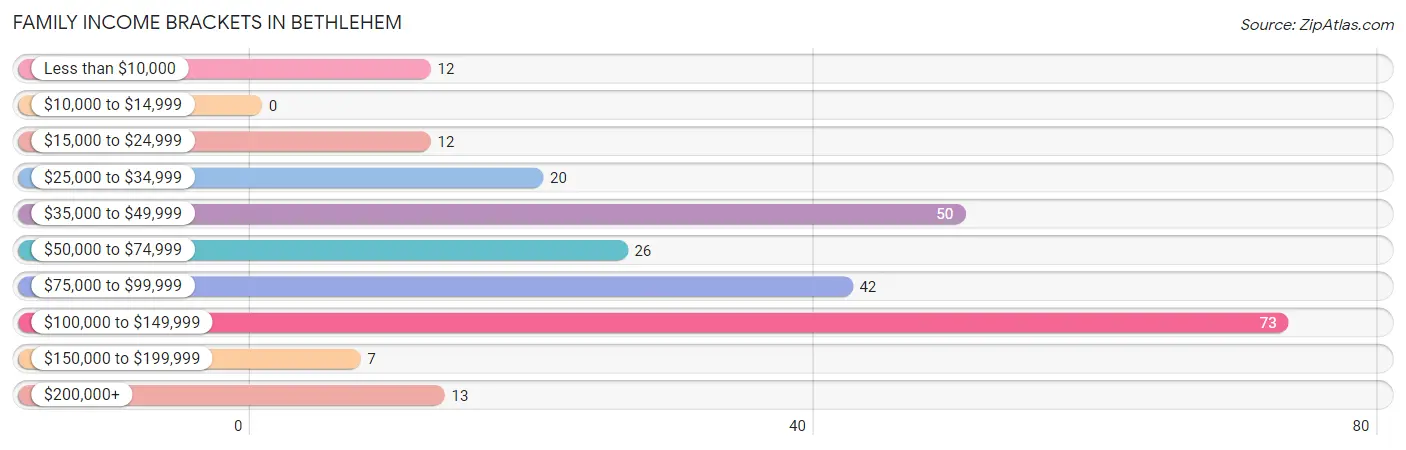
| Income Bracket | # Families | % Families |
| Less than $10,000 | 12 | 4.7% |
| $10,000 to $14,999 | 0 | 0.0% |
| $15,000 to $24,999 | 12 | 4.7% |
| $25,000 to $34,999 | 20 | 7.8% |
| $35,000 to $49,999 | 50 | 19.6% |
| $50,000 to $74,999 | 26 | 10.2% |
| $75,000 to $99,999 | 42 | 16.5% |
| $100,000 to $149,999 | 73 | 28.6% |
| $150,000 to $199,999 | 7 | 2.7% |
| $200,000+ | 13 | 5.1% |
Family Income by Famaliy Size in Bethlehem
2-person families (165 | 64.7%) account for the highest median family income in Bethlehem with $81,645 per family, while 2-person families (165 | 64.7%) have the highest median income of $40,822 per family member.
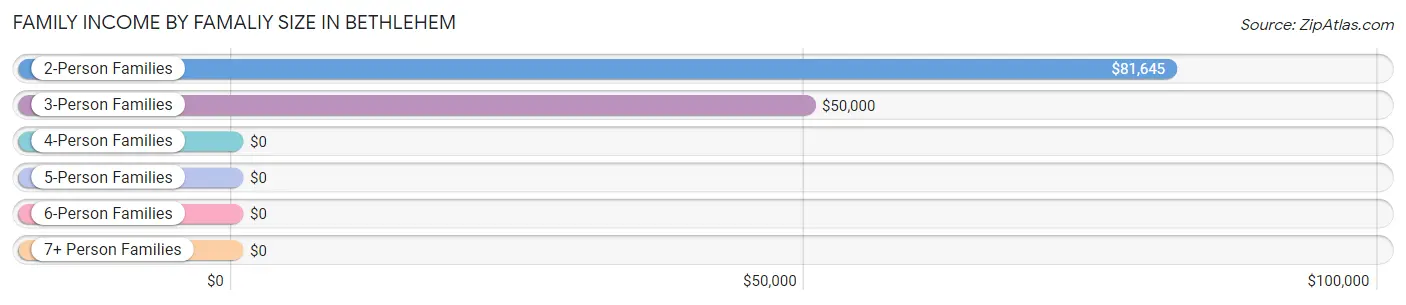
| Income Bracket | # Families | Median Income |
| 2-Person Families | 165 (64.7%) | $81,645 |
| 3-Person Families | 62 (24.3%) | $50,000 |
| 4-Person Families | 28 (11.0%) | $0 |
| 5-Person Families | 0 (0.0%) | $0 |
| 6-Person Families | 0 (0.0%) | $0 |
| 7+ Person Families | 0 (0.0%) | $0 |
| Total | 255 (100.0%) | $80,329 |
Family Income by Number of Earners in Bethlehem
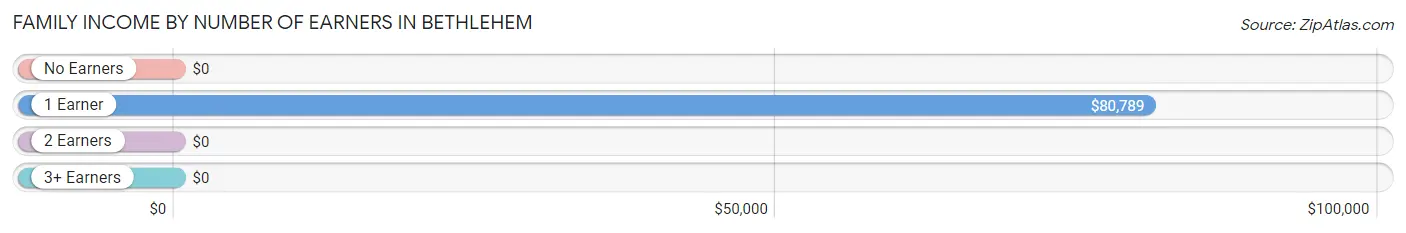
| Number of Earners | # Families | Median Income |
| No Earners | 38 (14.9%) | $0 |
| 1 Earner | 134 (52.5%) | $80,789 |
| 2 Earners | 54 (21.2%) | $0 |
| 3+ Earners | 29 (11.4%) | $0 |
| Total | 255 (100.0%) | $80,329 |
Household Income in Bethlehem
Household Income Brackets in Bethlehem
With 73 households falling in the category, the $100,000 to $149,999 income range is the most frequent in Bethlehem, accounting for 19.8% of all households. In contrast, only 7 households (1.9%) fall into the $150,000 to $199,999 income bracket, making it the least populous group.
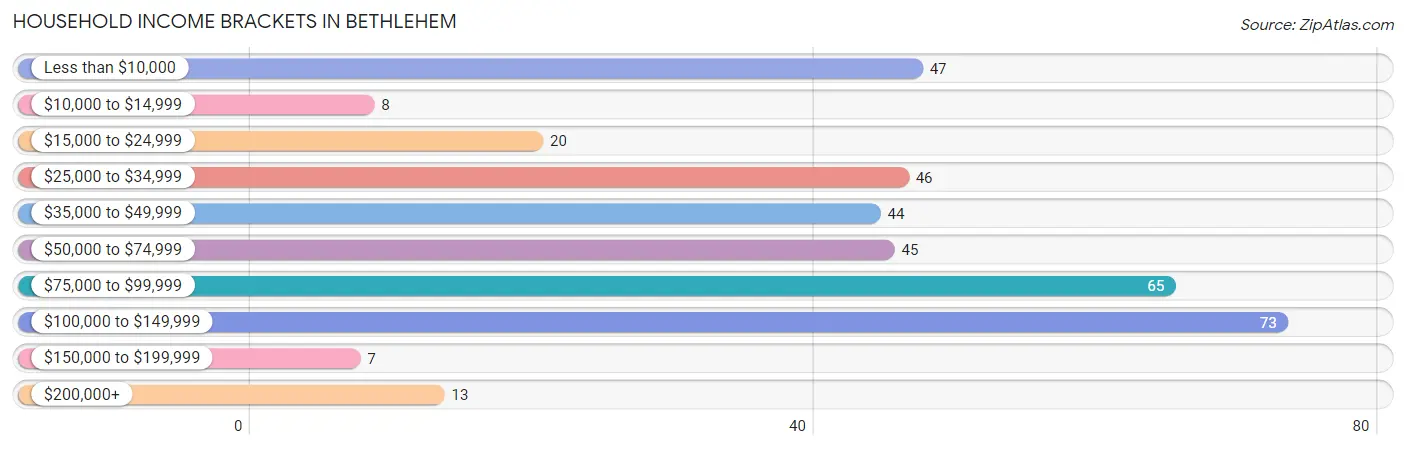
| Income Bracket | # Households | % Households |
| Less than $10,000 | 47 | 12.8% |
| $10,000 to $14,999 | 8 | 2.2% |
| $15,000 to $24,999 | 20 | 5.4% |
| $25,000 to $34,999 | 46 | 12.5% |
| $35,000 to $49,999 | 44 | 12.0% |
| $50,000 to $74,999 | 45 | 12.2% |
| $75,000 to $99,999 | 65 | 17.7% |
| $100,000 to $149,999 | 73 | 19.8% |
| $150,000 to $199,999 | 7 | 1.9% |
| $200,000+ | 13 | 3.5% |
Household Income by Householder Age in Bethlehem
The median household income in Bethlehem is $62,647, with the highest median household income of $63,456 found in the 45 to 64 years age bracket for the primary householder. A total of 171 households (46.5%) fall into this category.
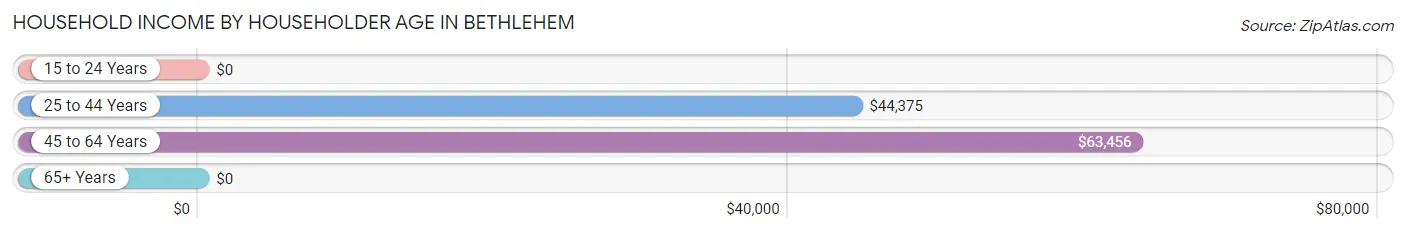
| Income Bracket | # Households | Median Income |
| 15 to 24 Years | 0 (0.0%) | $0 |
| 25 to 44 Years | 46 (12.5%) | $44,375 |
| 45 to 64 Years | 171 (46.5%) | $63,456 |
| 65+ Years | 151 (41.0%) | $0 |
| Total | 368 (100.0%) | $62,647 |
Poverty in Bethlehem
Income Below Poverty by Sex and Age in Bethlehem
With 12.8% poverty level for males and 8.9% for females among the residents of Bethlehem, 16 and 17 year old males and 35 to 44 year old females are the most vulnerable to poverty, with 3 males (100.0%) and 16 females (64.0%) in their respective age groups living below the poverty level.
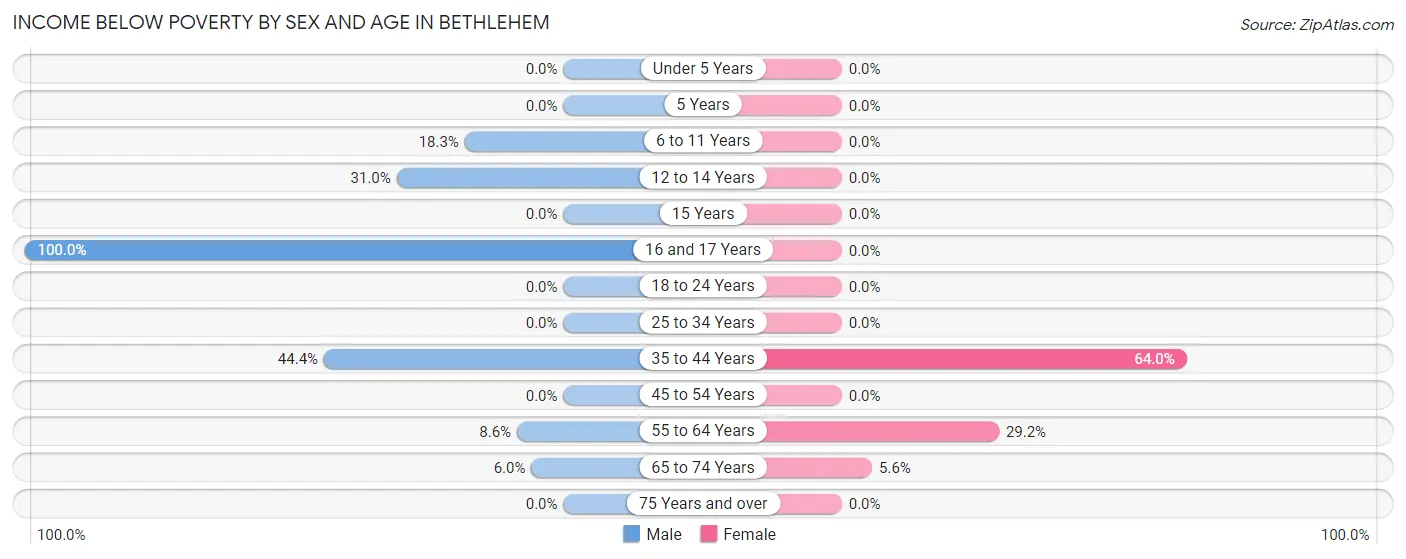
| Age Bracket | Male | Female |
| Under 5 Years | 0 (0.0%) | 0 (0.0%) |
| 5 Years | 0 (0.0%) | 0 (0.0%) |
| 6 to 11 Years | 13 (18.3%) | 0 (0.0%) |
| 12 to 14 Years | 13 (30.9%) | 0 (0.0%) |
| 15 Years | 0 (0.0%) | 0 (0.0%) |
| 16 and 17 Years | 3 (100.0%) | 0 (0.0%) |
| 18 to 24 Years | 0 (0.0%) | 0 (0.0%) |
| 25 to 34 Years | 0 (0.0%) | 0 (0.0%) |
| 35 to 44 Years | 12 (44.4%) | 16 (64.0%) |
| 45 to 54 Years | 0 (0.0%) | 0 (0.0%) |
| 55 to 64 Years | 5 (8.6%) | 28 (29.2%) |
| 65 to 74 Years | 5 (5.9%) | 5 (5.6%) |
| 75 Years and over | 0 (0.0%) | 0 (0.0%) |
| Total | 51 (12.8%) | 49 (8.9%) |
Income Above Poverty by Sex and Age in Bethlehem
According to the poverty statistics in Bethlehem, males aged under 5 years and females aged under 5 years are the age groups that are most secure financially, with 100.0% of males and 100.0% of females in these age groups living above the poverty line.
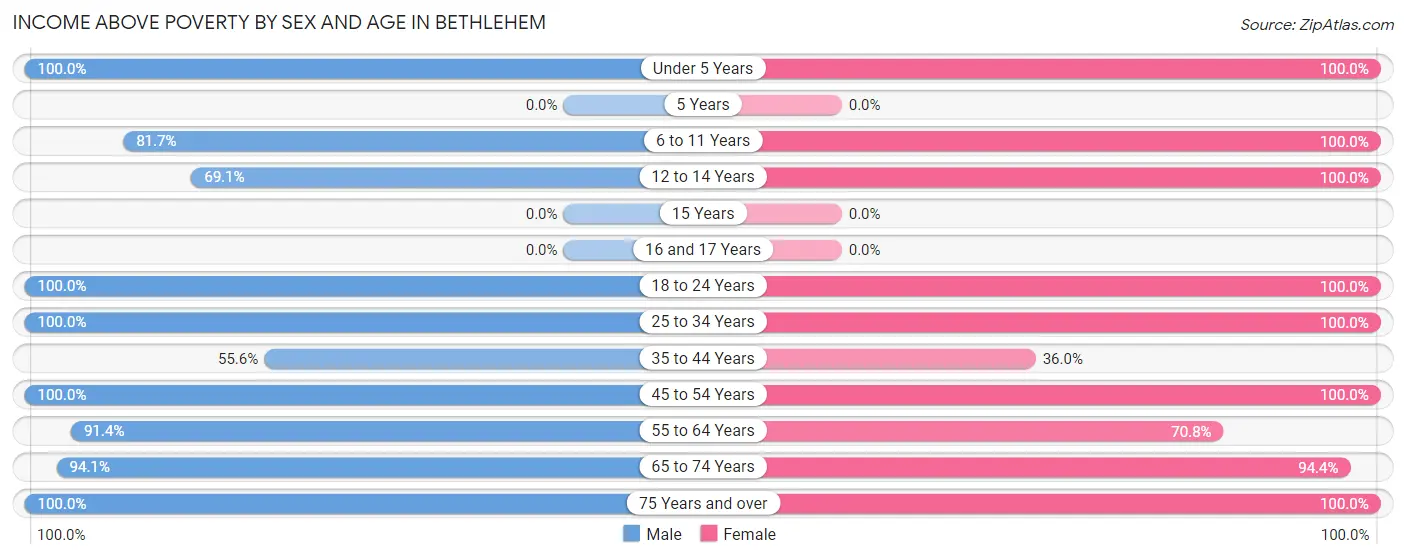
| Age Bracket | Male | Female |
| Under 5 Years | 10 (100.0%) | 12 (100.0%) |
| 5 Years | 0 (0.0%) | 0 (0.0%) |
| 6 to 11 Years | 58 (81.7%) | 7 (100.0%) |
| 12 to 14 Years | 29 (69.1%) | 9 (100.0%) |
| 15 Years | 0 (0.0%) | 0 (0.0%) |
| 16 and 17 Years | 0 (0.0%) | 0 (0.0%) |
| 18 to 24 Years | 11 (100.0%) | 49 (100.0%) |
| 25 to 34 Years | 21 (100.0%) | 36 (100.0%) |
| 35 to 44 Years | 15 (55.6%) | 9 (36.0%) |
| 45 to 54 Years | 45 (100.0%) | 206 (100.0%) |
| 55 to 64 Years | 53 (91.4%) | 68 (70.8%) |
| 65 to 74 Years | 79 (94.1%) | 84 (94.4%) |
| 75 Years and over | 28 (100.0%) | 23 (100.0%) |
| Total | 349 (87.3%) | 503 (91.1%) |
Income Below Poverty Among Married-Couple Families in Bethlehem
The poverty statistics for married-couple families in Bethlehem show that 6.5% or 12 of the total 184 families live below the poverty line. Families with 1 or 2 children have the highest poverty rate of 31.6%, comprising of 12 families. On the other hand, families with no children have the lowest poverty rate of 0.0%, which includes 0 families.
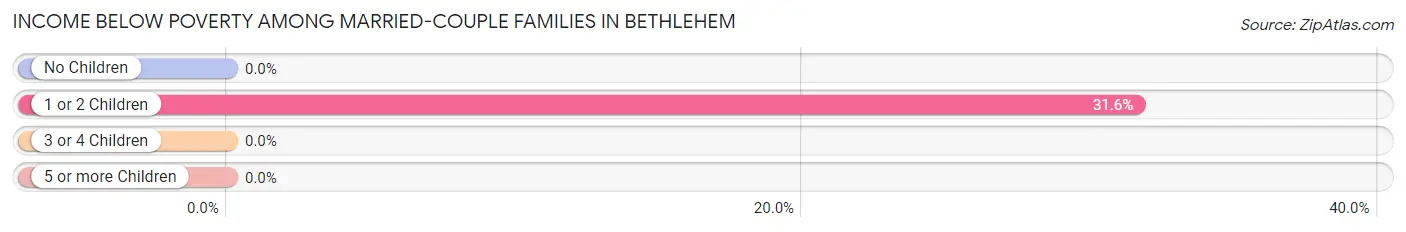
| Children | Above Poverty | Below Poverty |
| No Children | 146 (100.0%) | 0 (0.0%) |
| 1 or 2 Children | 26 (68.4%) | 12 (31.6%) |
| 3 or 4 Children | 0 (0.0%) | 0 (0.0%) |
| 5 or more Children | 0 (0.0%) | 0 (0.0%) |
| Total | 172 (93.5%) | 12 (6.5%) |
Income Below Poverty Among Single-Parent Households in Bethlehem
| Children | Single Father | Single Mother |
| No Children | 0 (0.0%) | 0 (0.0%) |
| 1 or 2 Children | 0 (0.0%) | 0 (0.0%) |
| 3 or 4 Children | 0 (0.0%) | 0 (0.0%) |
| 5 or more Children | 0 (0.0%) | 0 (0.0%) |
| Total | 0 (0.0%) | 0 (0.0%) |
Income Below Poverty Among Married-Couple vs Single-Parent Households in Bethlehem
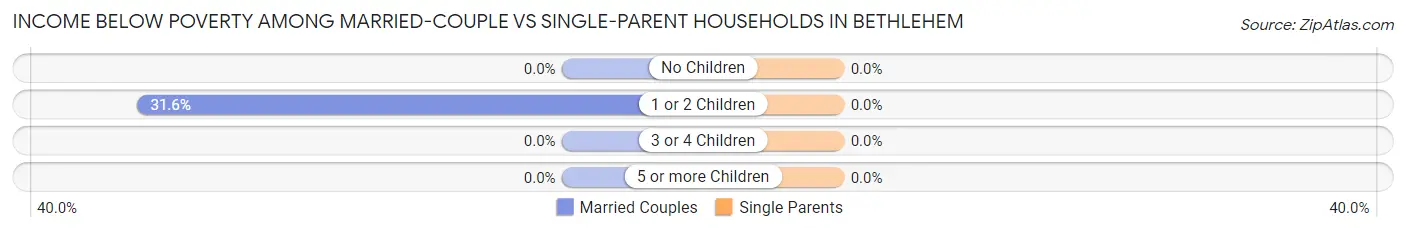
| Children | Married-Couple Families | Single-Parent Households |
| No Children | 0 (0.0%) | 0 (0.0%) |
| 1 or 2 Children | 12 (31.6%) | 0 (0.0%) |
| 3 or 4 Children | 0 (0.0%) | 0 (0.0%) |
| 5 or more Children | 0 (0.0%) | 0 (0.0%) |
| Total | 12 (6.5%) | 0 (0.0%) |
Race in Bethlehem
The most populous races in Bethlehem are White / Caucasian (950 | 99.3%), Two or more Races (7 | 0.7%), and Hispanic or Latino (6 | 0.6%).
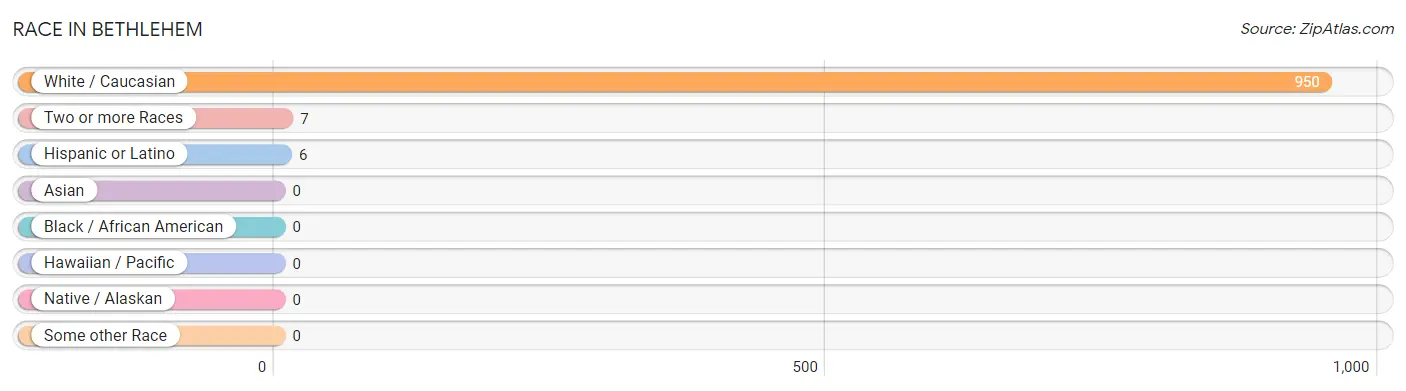
| Race | # Population | % Population |
| Asian | 0 | 0.0% |
| Black / African American | 0 | 0.0% |
| Hawaiian / Pacific | 0 | 0.0% |
| Hispanic or Latino | 6 | 0.6% |
| Native / Alaskan | 0 | 0.0% |
| White / Caucasian | 950 | 99.3% |
| Two or more Races | 7 | 0.7% |
| Some other Race | 0 | 0.0% |
| Total | 957 | 100.0% |
Ancestry in Bethlehem
The most populous ancestries reported in Bethlehem are English (319 | 33.3%), Irish (194 | 20.3%), Scotch-Irish (161 | 16.8%), French (114 | 11.9%), and German (111 | 11.6%), together accounting for 93.9% of all Bethlehem residents.
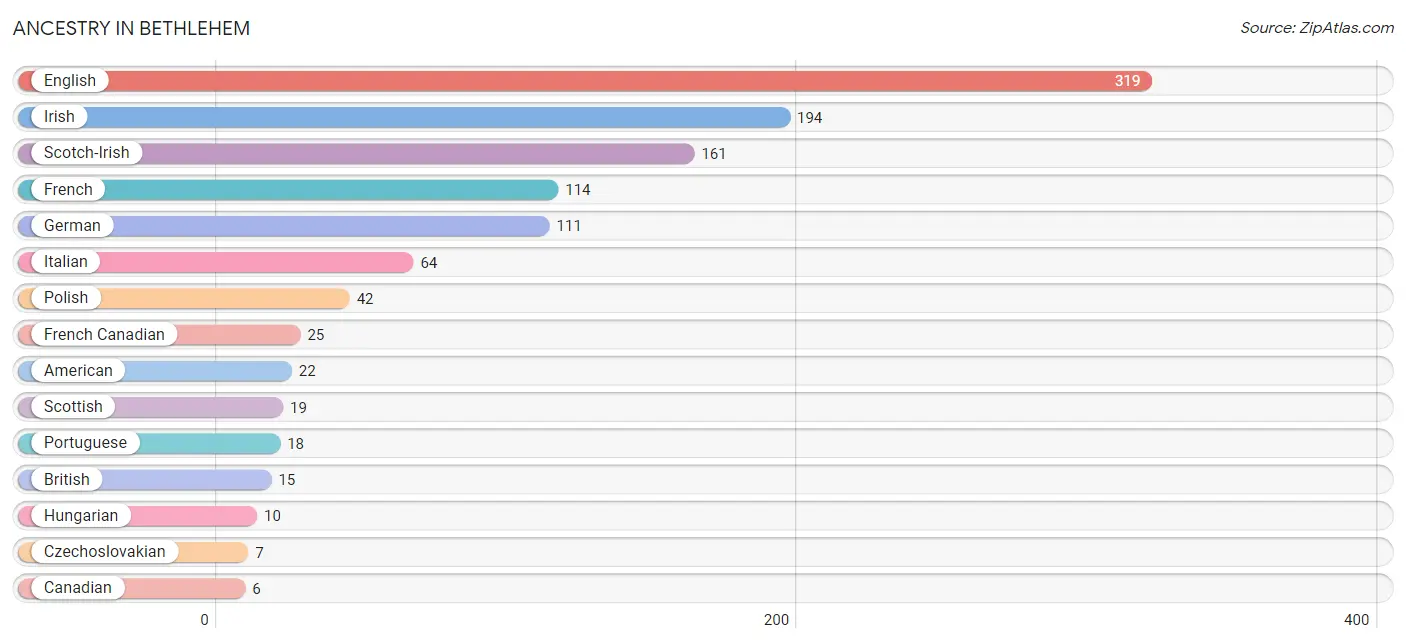
| Ancestry | # Population | % Population |
| American | 22 | 2.3% |
| Bhutanese | 1 | 0.1% |
| British | 15 | 1.6% |
| Canadian | 6 | 0.6% |
| Central American | 6 | 0.6% |
| Czechoslovakian | 7 | 0.7% |
| English | 319 | 33.3% |
| French | 114 | 11.9% |
| French Canadian | 25 | 2.6% |
| German | 111 | 11.6% |
| Greek | 3 | 0.3% |
| Guatemalan | 6 | 0.6% |
| Hungarian | 10 | 1.0% |
| Irish | 194 | 20.3% |
| Italian | 64 | 6.7% |
| Norwegian | 6 | 0.6% |
| Polish | 42 | 4.4% |
| Portuguese | 18 | 1.9% |
| Romanian | 4 | 0.4% |
| Scotch-Irish | 161 | 16.8% |
| Scottish | 19 | 2.0% |
| Ukrainian | 5 | 0.5% | View All 22 Rows |
Immigrants in Bethlehem
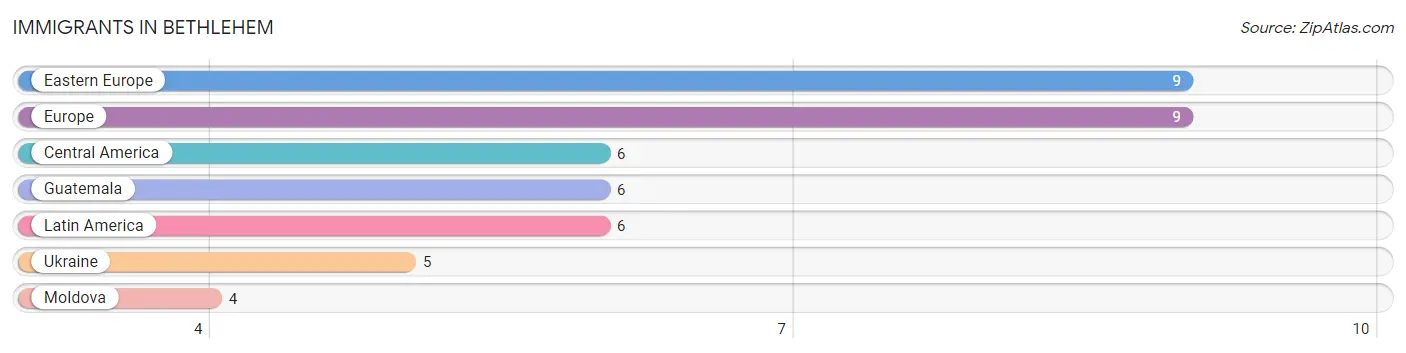
The most numerous immigrant groups reported in Bethlehem came from Eastern Europe (9 | 0.9%), Europe (9 | 0.9%), Central America (6 | 0.6%), Guatemala (6 | 0.6%), and Latin America (6 | 0.6%), together accounting for 3.8% of all Bethlehem residents.
| Immigration Origin | # Population | % Population |
| Central America | 6 | 0.6% |
| Eastern Europe | 9 | 0.9% |
| Europe | 9 | 0.9% |
| Guatemala | 6 | 0.6% |
| Latin America | 6 | 0.6% |
| Moldova | 4 | 0.4% |
| Ukraine | 5 | 0.5% | View All 7 Rows |
Sex and Age in Bethlehem
Sex and Age in Bethlehem
The most populous age groups in Bethlehem are 5 to 9 Years (73 | 18.2%) for men and 45 to 49 Years (184 | 33.2%) for women.
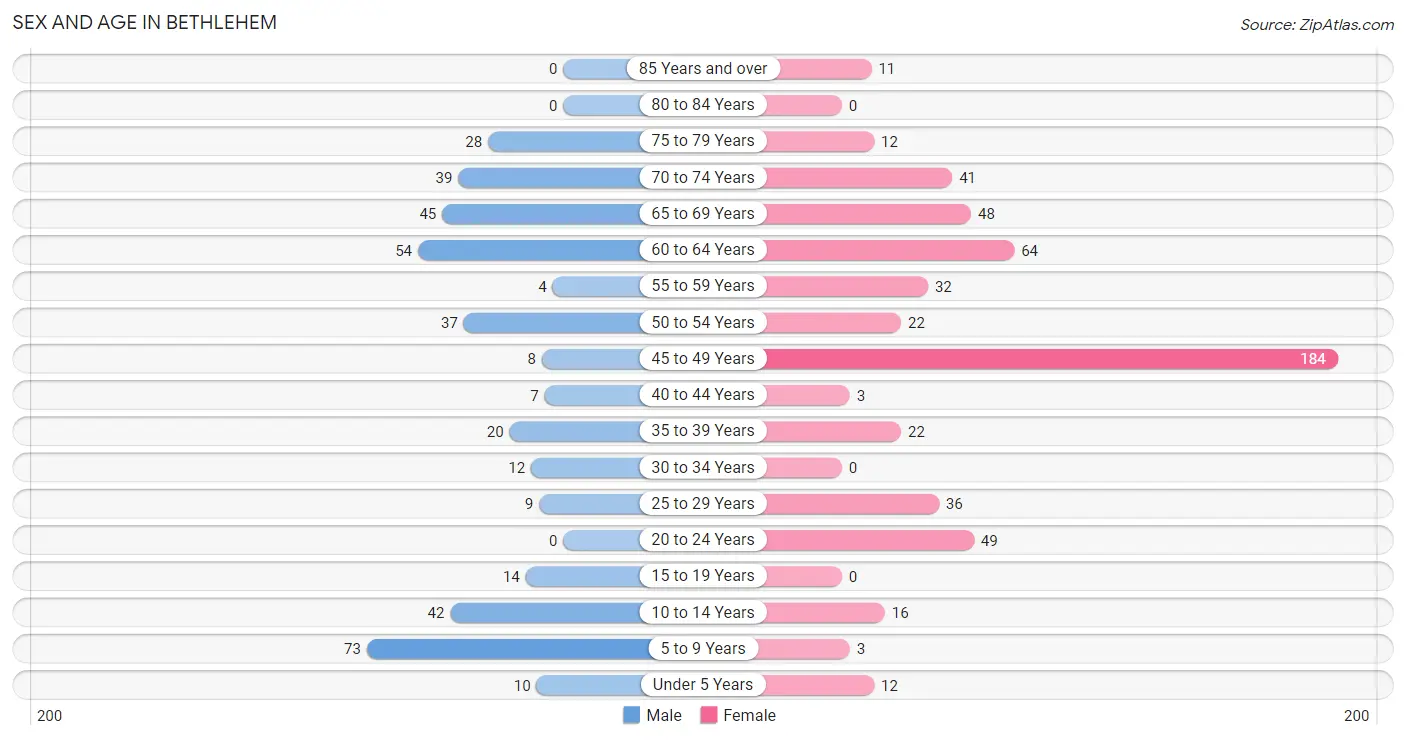
| Age Bracket | Male | Female |
| Under 5 Years | 10 (2.5%) | 12 (2.2%) |
| 5 to 9 Years | 73 (18.2%) | 3 (0.5%) |
| 10 to 14 Years | 42 (10.4%) | 16 (2.9%) |
| 15 to 19 Years | 14 (3.5%) | 0 (0.0%) |
| 20 to 24 Years | 0 (0.0%) | 49 (8.8%) |
| 25 to 29 Years | 9 (2.2%) | 36 (6.5%) |
| 30 to 34 Years | 12 (3.0%) | 0 (0.0%) |
| 35 to 39 Years | 20 (5.0%) | 22 (4.0%) |
| 40 to 44 Years | 7 (1.7%) | 3 (0.5%) |
| 45 to 49 Years | 8 (2.0%) | 184 (33.2%) |
| 50 to 54 Years | 37 (9.2%) | 22 (4.0%) |
| 55 to 59 Years | 4 (1.0%) | 32 (5.8%) |
| 60 to 64 Years | 54 (13.4%) | 64 (11.5%) |
| 65 to 69 Years | 45 (11.2%) | 48 (8.6%) |
| 70 to 74 Years | 39 (9.7%) | 41 (7.4%) |
| 75 to 79 Years | 28 (7.0%) | 12 (2.2%) |
| 80 to 84 Years | 0 (0.0%) | 0 (0.0%) |
| 85 Years and over | 0 (0.0%) | 11 (2.0%) |
| Total | 402 (100.0%) | 555 (100.0%) |
Families and Households in Bethlehem
Median Family Size in Bethlehem
The median family size in Bethlehem is 3.21 persons per family, with single female/mother families (61 | 23.9%) accounting for the largest median family size of 5 persons per family. On the other hand, married-couple families (184 | 72.2%) represent the smallest median family size with 2.61 persons per family.
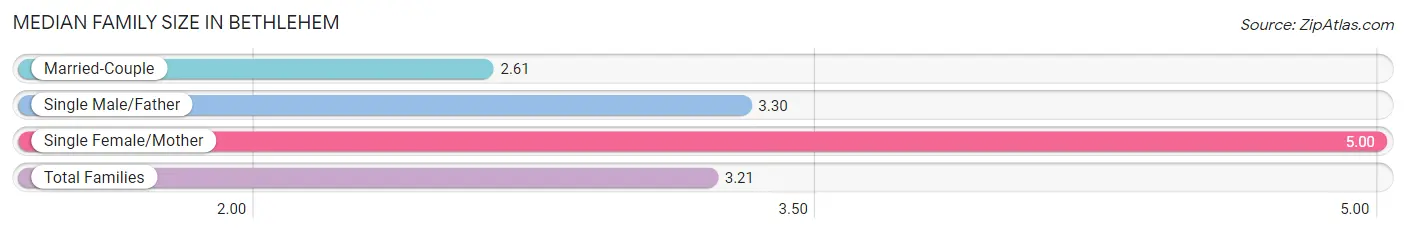
| Family Type | # Families | Family Size |
| Married-Couple | 184 (72.2%) | 2.61 |
| Single Male/Father | 10 (3.9%) | 3.30 |
| Single Female/Mother | 61 (23.9%) | 5.00 |
| Total Families | 255 (100.0%) | 3.21 |
Median Household Size in Bethlehem
The median household size in Bethlehem is 2.60 persons per household, with single female/mother households (61 | 16.6%) accounting for the largest median household size of 5.08 persons per household. non-family households (113 | 30.7%) represent the smallest median household size with 1.07 persons per household.
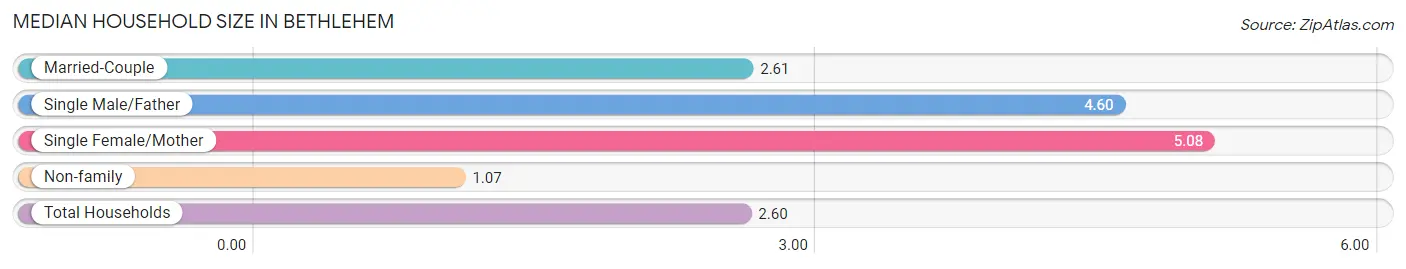
| Household Type | # Households | Household Size |
| Married-Couple | 184 (50.0%) | 2.61 |
| Single Male/Father | 10 (2.7%) | 4.60 |
| Single Female/Mother | 61 (16.6%) | 5.08 |
| Non-family | 113 (30.7%) | 1.07 |
| Total Households | 368 (100.0%) | 2.60 |
Household Size by Marriage Status in Bethlehem
Out of a total of 368 households in Bethlehem, 255 (69.3%) are family households, while 113 (30.7%) are nonfamily households. The most numerous type of family households are 2-person households, comprising 159, and the most common type of nonfamily households are 1-person households, comprising 104.
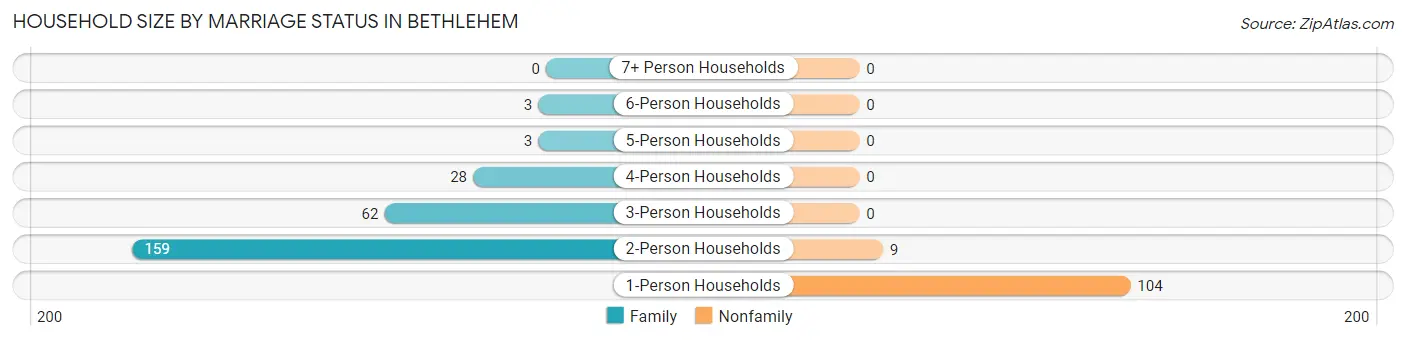
| Household Size | Family Households | Nonfamily Households |
| 1-Person Households | - | 104 (28.3%) |
| 2-Person Households | 159 (43.2%) | 9 (2.5%) |
| 3-Person Households | 62 (16.9%) | 0 (0.0%) |
| 4-Person Households | 28 (7.6%) | 0 (0.0%) |
| 5-Person Households | 3 (0.8%) | 0 (0.0%) |
| 6-Person Households | 3 (0.8%) | 0 (0.0%) |
| 7+ Person Households | 0 (0.0%) | 0 (0.0%) |
| Total | 255 (69.3%) | 113 (30.7%) |
Female Fertility in Bethlehem
Fertility by Age in Bethlehem
| Age Bracket | Women with Births | Births / 1,000 Women |
| 15 to 19 years | 0 (0.0%) | 0.0 |
| 20 to 34 years | 0 (0.0%) | 0.0 |
| 35 to 50 years | 0 (0.0%) | 0.0 |
| Total | 0 (0.0%) | 0.0 |
Fertility by Age by Marriage Status in Bethlehem
| Age Bracket | Married | Unmarried |
| 15 to 19 years | 0 (0.0%) | 0 (0.0%) |
| 20 to 34 years | 0 (0.0%) | 0 (0.0%) |
| 35 to 50 years | 0 (0.0%) | 0 (0.0%) |
| Total | 0 (0.0%) | 0 (0.0%) |
Fertility by Education in Bethlehem
| Educational Attainment | Women with Births | Births / 1,000 Women |
| Less than High School | 0 (0.0%) | 0.0 |
| High School Diploma | 0 (0.0%) | 0.0 |
| College or Associate's Degree | 0 (0.0%) | 0.0 |
| Bachelor's Degree | 0 (0.0%) | 0.0 |
| Graduate Degree | 0 (0.0%) | 0.0 |
| Total | 0 (0.0%) | 0.0 |
Fertility by Education by Marriage Status in Bethlehem
| Educational Attainment | Married | Unmarried |
| Less than High School | 0 (0.0%) | 0 (0.0%) |
| High School Diploma | 0 (0.0%) | 0 (0.0%) |
| College or Associate's Degree | 0 (0.0%) | 0 (0.0%) |
| Bachelor's Degree | 0 (0.0%) | 0 (0.0%) |
| Graduate Degree | 0 (0.0%) | 0 (0.0%) |
| Total | 0 (0.0%) | 0 (0.0%) |
Employment Characteristics in Bethlehem
Employment by Class of Employer in Bethlehem
Among the 494 employed individuals in Bethlehem, private company employees (361 | 73.1%), self-employed (not incorporated) (36 | 7.3%), and not-for-profit organizations (33 | 6.7%) make up the most common classes of employment.
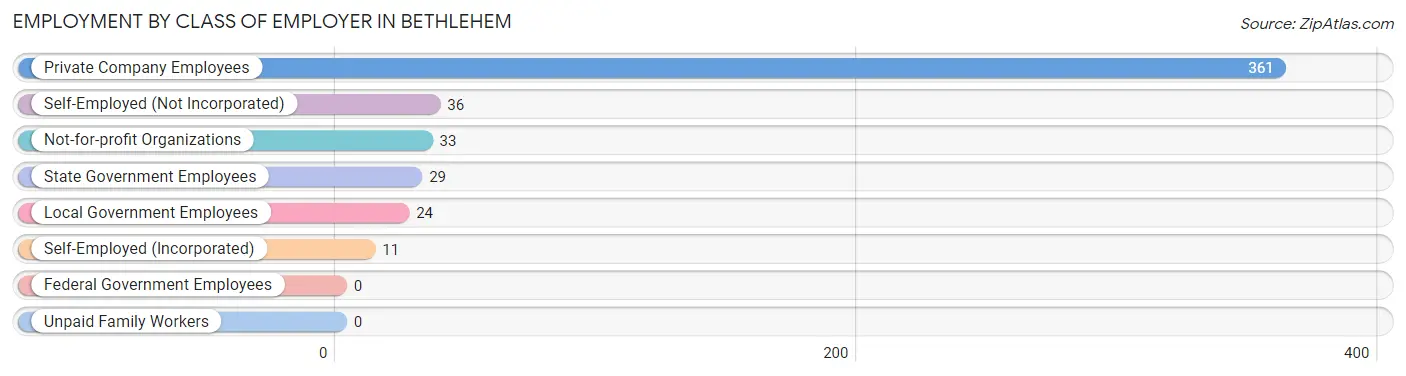
| Employer Class | # Employees | % Employees |
| Private Company Employees | 361 | 73.1% |
| Self-Employed (Incorporated) | 11 | 2.2% |
| Self-Employed (Not Incorporated) | 36 | 7.3% |
| Not-for-profit Organizations | 33 | 6.7% |
| Local Government Employees | 24 | 4.9% |
| State Government Employees | 29 | 5.9% |
| Federal Government Employees | 0 | 0.0% |
| Unpaid Family Workers | 0 | 0.0% |
| Total | 494 | 100.0% |
Employment Status by Age in Bethlehem
According to the labor force statistics for Bethlehem, out of the total population over 16 years of age (801), 63.9% or 512 individuals are in the labor force, with 1.8% or 9 of them unemployed. The age group with the highest labor force participation rate is 20 to 24 years, with 100.0% or 49 individuals in the labor force. Within the labor force, the 35 to 44 years age range has the highest percentage of unemployed individuals, with 14.3% or 4 of them being unemployed.
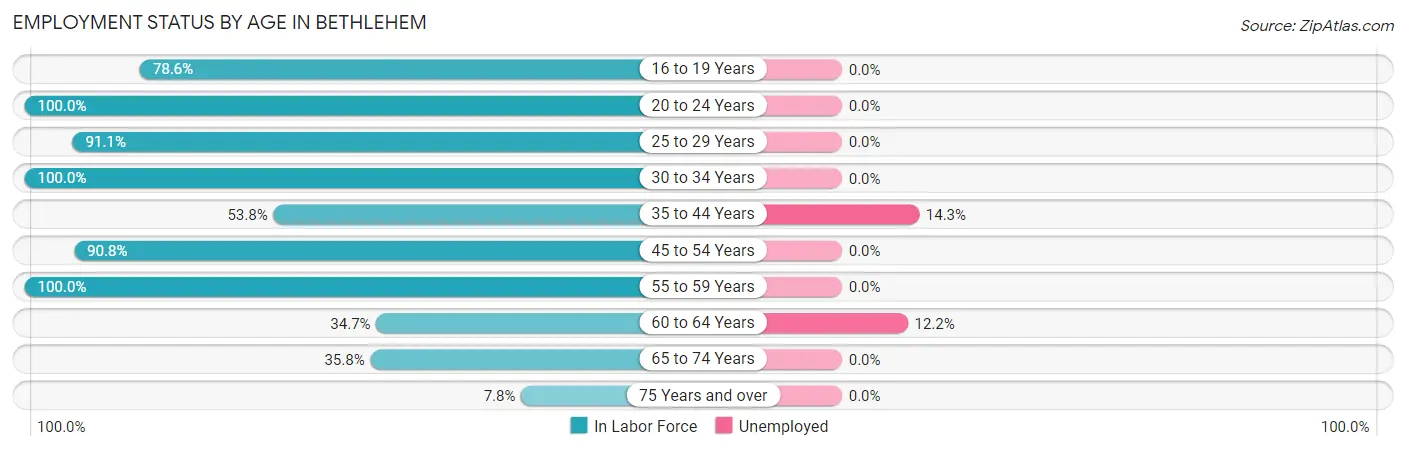
| Age Bracket | In Labor Force | Unemployed |
| 16 to 19 Years | 11 (78.6%) | 0 (0.0%) |
| 20 to 24 Years | 49 (100.0%) | 0 (0.0%) |
| 25 to 29 Years | 41 (91.1%) | 0 (0.0%) |
| 30 to 34 Years | 12 (100.0%) | 0 (0.0%) |
| 35 to 44 Years | 28 (53.8%) | 4 (14.3%) |
| 45 to 54 Years | 228 (90.8%) | 0 (0.0%) |
| 55 to 59 Years | 36 (100.0%) | 0 (0.0%) |
| 60 to 64 Years | 41 (34.7%) | 5 (12.2%) |
| 65 to 74 Years | 62 (35.8%) | 0 (0.0%) |
| 75 Years and over | 4 (7.8%) | 0 (0.0%) |
| Total | 512 (63.9%) | 9 (1.8%) |
Employment Status by Educational Attainment in Bethlehem
According to labor force statistics for Bethlehem, 75.1% of individuals (386) out of the total population between 25 and 64 years of age (514) are in the labor force, with 2.3% or 9 of them being unemployed. The group with the highest labor force participation rate are those with the educational attainment of bachelor's degree or higher, with 81.6% or 235 individuals in the labor force. Within the labor force, individuals with bachelor's degree or higher education have the highest percentage of unemployment, with 3.8% or 9 of them being unemployed.
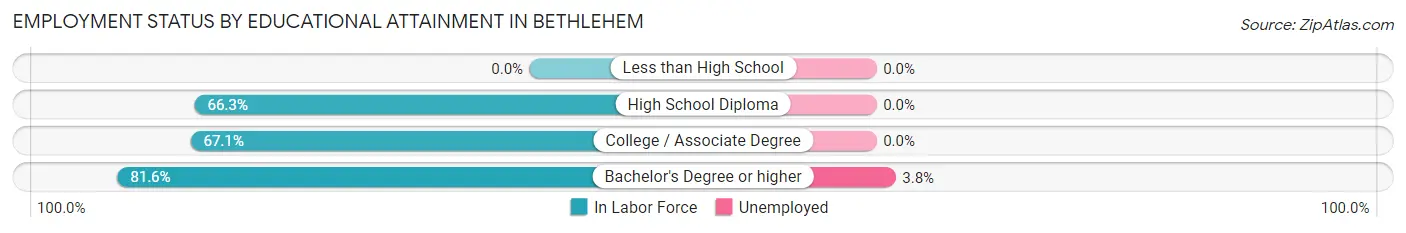
| Educational Attainment | In Labor Force | Unemployed |
| Less than High School | 0 (0.0%) | 0 (0.0%) |
| High School Diploma | 55 (66.3%) | 0 (0.0%) |
| College / Associate Degree | 96 (67.1%) | 0 (0.0%) |
| Bachelor's Degree or higher | 235 (81.6%) | 11 (3.8%) |
| Total | 386 (75.1%) | 12 (2.3%) |
Employment Occupations by Sex in Bethlehem
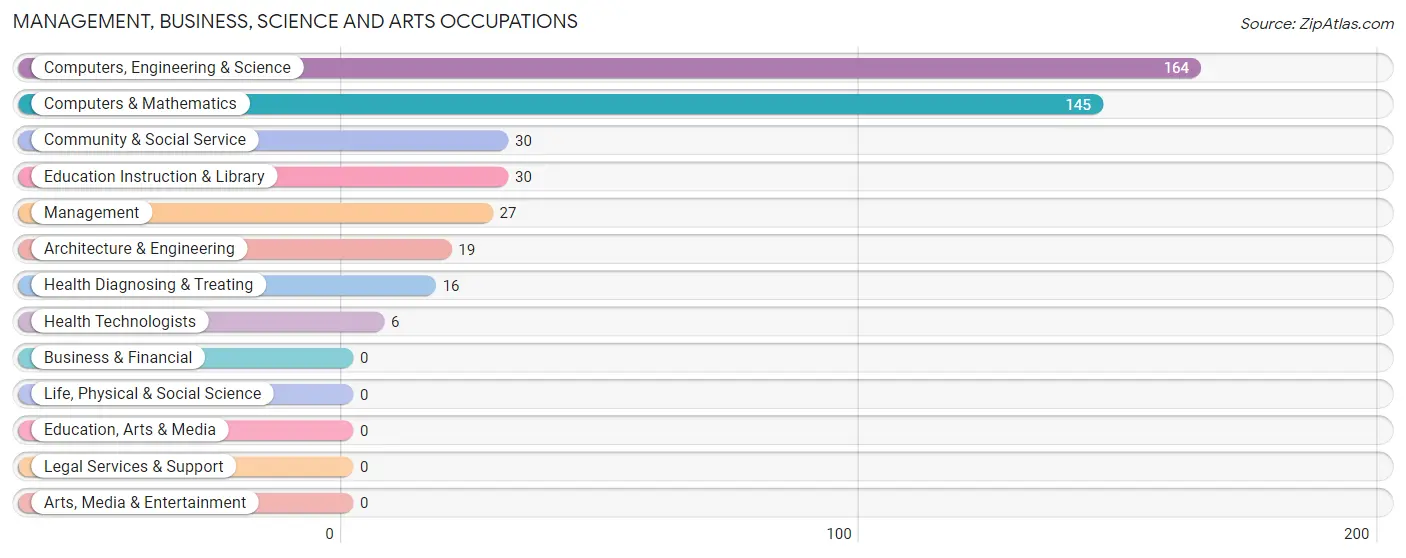
Management, Business, Science and Arts Occupations
The most common Management, Business, Science and Arts occupations in Bethlehem are Computers, Engineering & Science (164 | 32.6%), Computers & Mathematics (145 | 28.8%), Community & Social Service (30 | 6.0%), Education Instruction & Library (30 | 6.0%), and Management (27 | 5.4%).
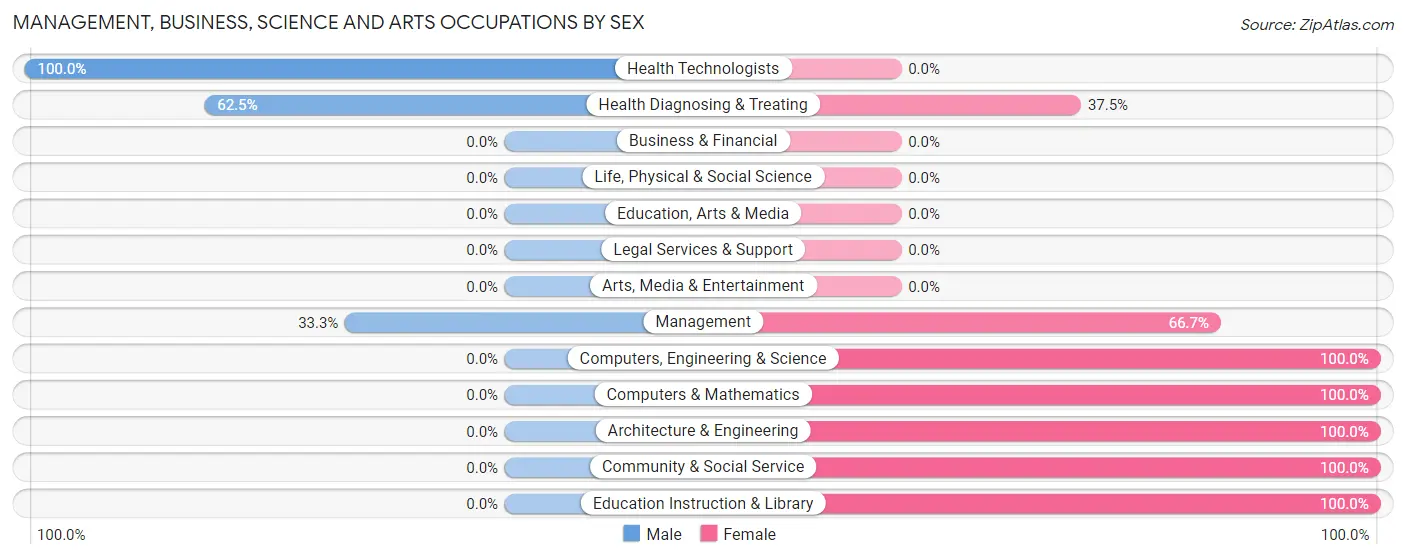
Management, Business, Science and Arts Occupations by Sex
Within the Management, Business, Science and Arts occupations in Bethlehem, the most male-oriented occupations are Health Technologists (100.0%), Health Diagnosing & Treating (62.5%), and Management (33.3%), while the most female-oriented occupations are Computers, Engineering & Science (100.0%), Computers & Mathematics (100.0%), and Architecture & Engineering (100.0%).
| Occupation | Male | Female |
| Management | 9 (33.3%) | 18 (66.7%) |
| Business & Financial | 0 (0.0%) | 0 (0.0%) |
| Computers, Engineering & Science | 0 (0.0%) | 164 (100.0%) |
| Computers & Mathematics | 0 (0.0%) | 145 (100.0%) |
| Architecture & Engineering | 0 (0.0%) | 19 (100.0%) |
| Life, Physical & Social Science | 0 (0.0%) | 0 (0.0%) |
| Community & Social Service | 0 (0.0%) | 30 (100.0%) |
| Education, Arts & Media | 0 (0.0%) | 0 (0.0%) |
| Legal Services & Support | 0 (0.0%) | 0 (0.0%) |
| Education Instruction & Library | 0 (0.0%) | 30 (100.0%) |
| Arts, Media & Entertainment | 0 (0.0%) | 0 (0.0%) |
| Health Diagnosing & Treating | 10 (62.5%) | 6 (37.5%) |
| Health Technologists | 6 (100.0%) | 0 (0.0%) |
| Total (Category) | 19 (8.0%) | 218 (92.0%) |
| Total (Overall) | 127 (25.3%) | 376 (74.8%) |
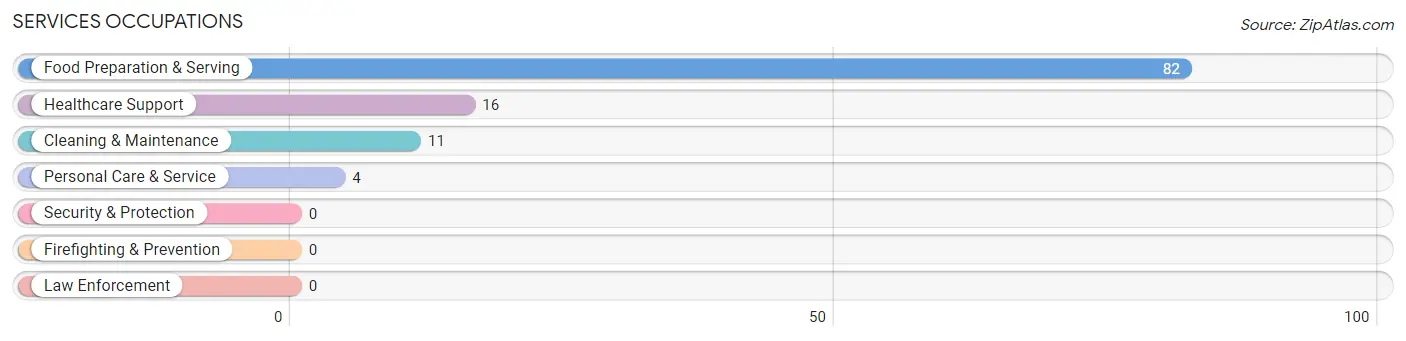
Services Occupations
The most common Services occupations in Bethlehem are Food Preparation & Serving (82 | 16.3%), Healthcare Support (16 | 3.2%), Cleaning & Maintenance (11 | 2.2%), and Personal Care & Service (4 | 0.8%).
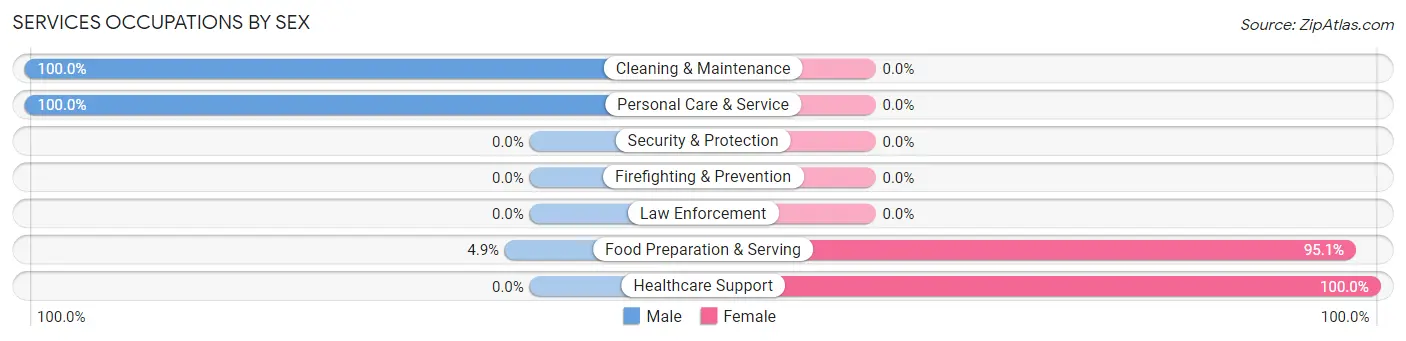
Services Occupations by Sex
Within the Services occupations in Bethlehem, the most male-oriented occupations are Cleaning & Maintenance (100.0%), Personal Care & Service (100.0%), and Food Preparation & Serving (4.9%), while the most female-oriented occupations are Healthcare Support (100.0%), and Food Preparation & Serving (95.1%).
| Occupation | Male | Female |
| Healthcare Support | 0 (0.0%) | 16 (100.0%) |
| Security & Protection | 0 (0.0%) | 0 (0.0%) |
| Firefighting & Prevention | 0 (0.0%) | 0 (0.0%) |
| Law Enforcement | 0 (0.0%) | 0 (0.0%) |
| Food Preparation & Serving | 4 (4.9%) | 78 (95.1%) |
| Cleaning & Maintenance | 11 (100.0%) | 0 (0.0%) |
| Personal Care & Service | 4 (100.0%) | 0 (0.0%) |
| Total (Category) | 19 (16.8%) | 94 (83.2%) |
| Total (Overall) | 127 (25.3%) | 376 (74.8%) |
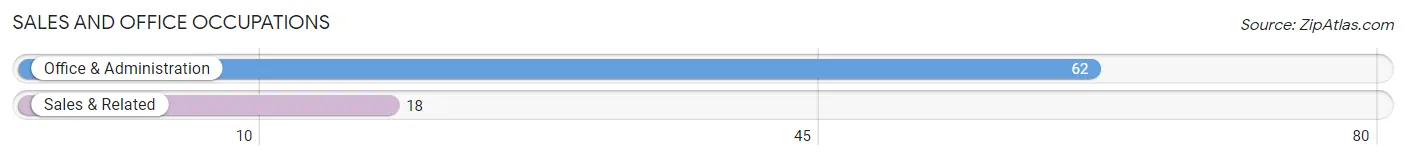
Sales and Office Occupations
The most common Sales and Office occupations in Bethlehem are Office & Administration (62 | 12.3%), and Sales & Related (18 | 3.6%).
Sales and Office Occupations by Sex
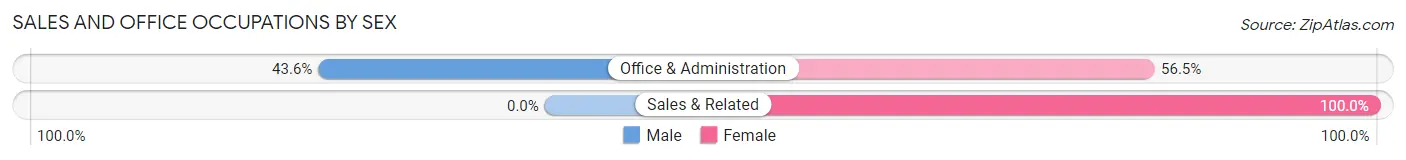
| Occupation | Male | Female |
| Sales & Related | 0 (0.0%) | 18 (100.0%) |
| Office & Administration | 27 (43.5%) | 35 (56.5%) |
| Total (Category) | 27 (33.8%) | 53 (66.2%) |
| Total (Overall) | 127 (25.3%) | 376 (74.8%) |
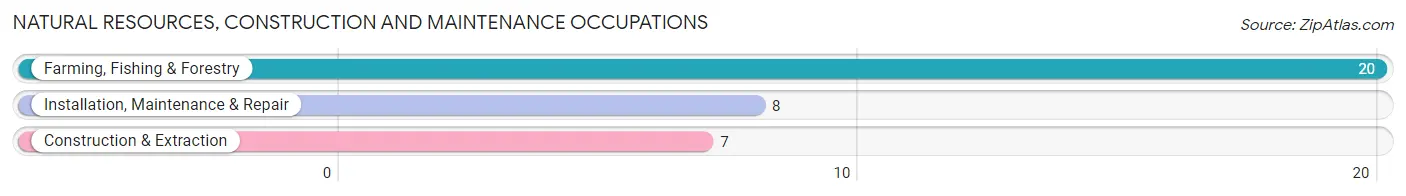
Natural Resources, Construction and Maintenance Occupations
The most common Natural Resources, Construction and Maintenance occupations in Bethlehem are Farming, Fishing & Forestry (20 | 4.0%), Installation, Maintenance & Repair (8 | 1.6%), and Construction & Extraction (7 | 1.4%).
Natural Resources, Construction and Maintenance Occupations by Sex
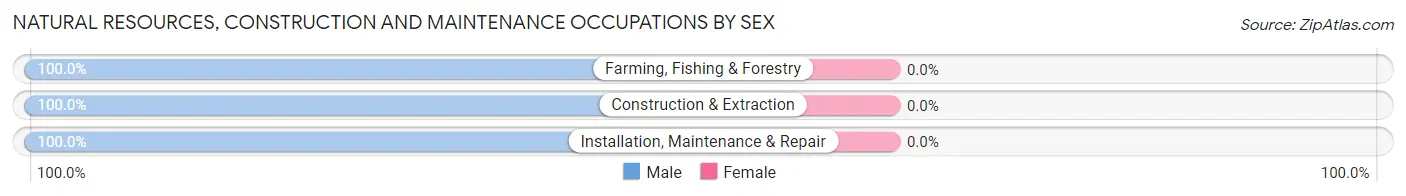
| Occupation | Male | Female |
| Farming, Fishing & Forestry | 20 (100.0%) | 0 (0.0%) |
| Construction & Extraction | 7 (100.0%) | 0 (0.0%) |
| Installation, Maintenance & Repair | 8 (100.0%) | 0 (0.0%) |
| Total (Category) | 35 (100.0%) | 0 (0.0%) |
| Total (Overall) | 127 (25.3%) | 376 (74.8%) |
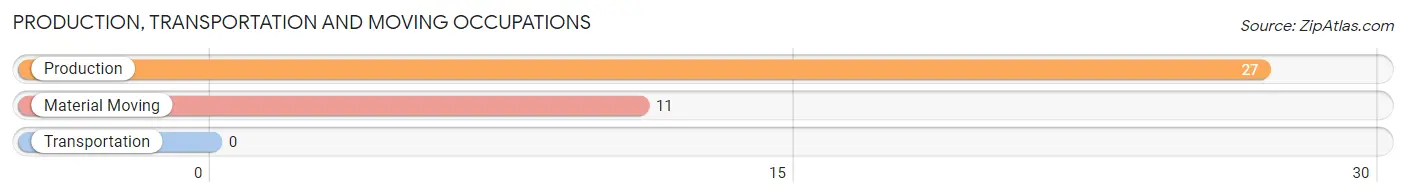
Production, Transportation and Moving Occupations
The most common Production, Transportation and Moving occupations in Bethlehem are Production (27 | 5.4%), and Material Moving (11 | 2.2%).
Production, Transportation and Moving Occupations by Sex
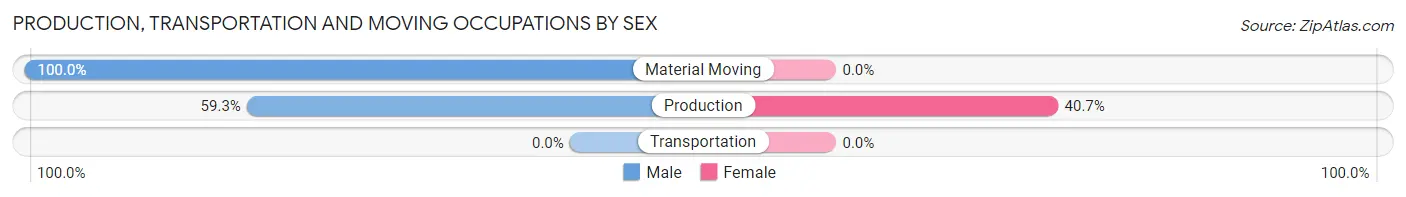
| Occupation | Male | Female |
| Production | 16 (59.3%) | 11 (40.7%) |
| Transportation | 0 (0.0%) | 0 (0.0%) |
| Material Moving | 11 (100.0%) | 0 (0.0%) |
| Total (Category) | 27 (71.1%) | 11 (28.9%) |
| Total (Overall) | 127 (25.3%) | 376 (74.8%) |
Employment Industries by Sex in Bethlehem
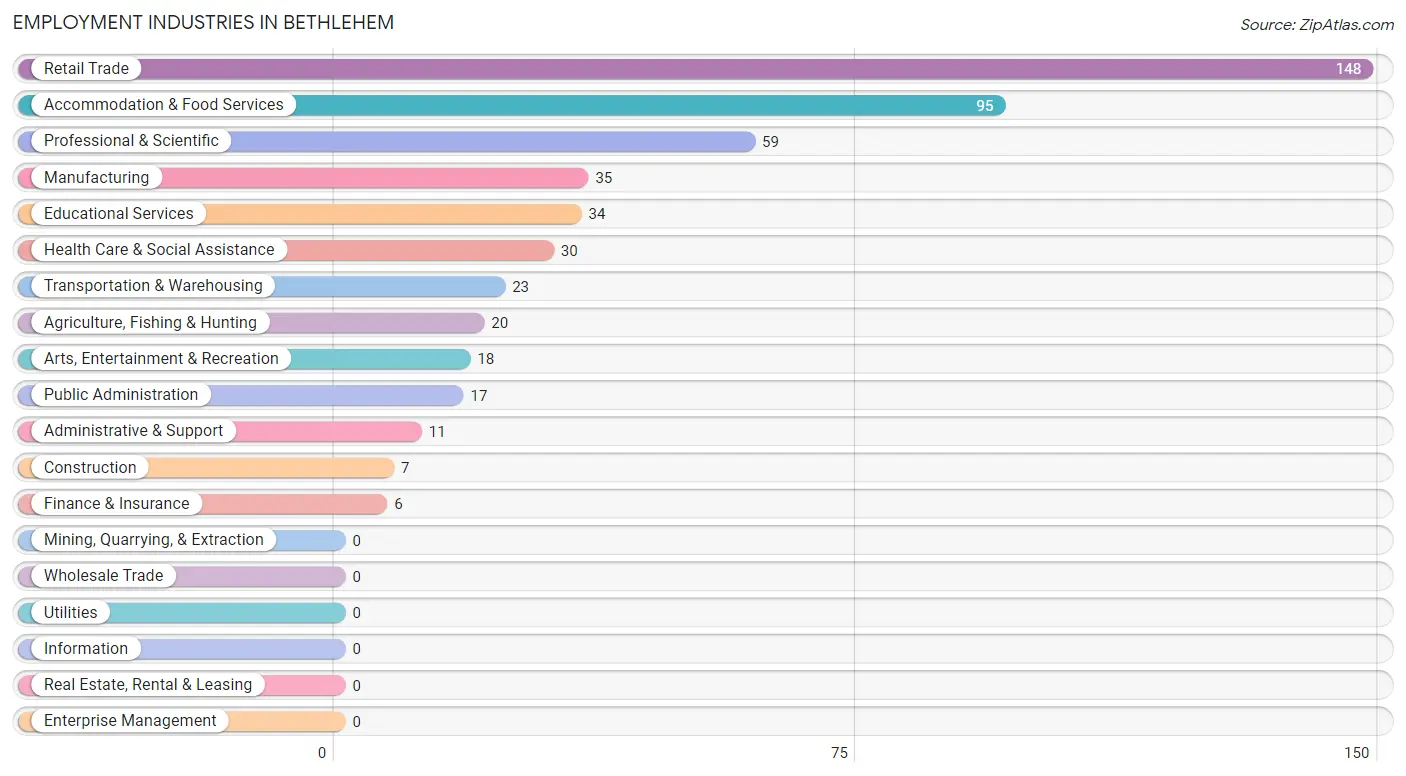
Employment Industries in Bethlehem
The major employment industries in Bethlehem include Retail Trade (148 | 29.4%), Accommodation & Food Services (95 | 18.9%), Professional & Scientific (59 | 11.7%), Manufacturing (35 | 7.0%), and Educational Services (34 | 6.8%).
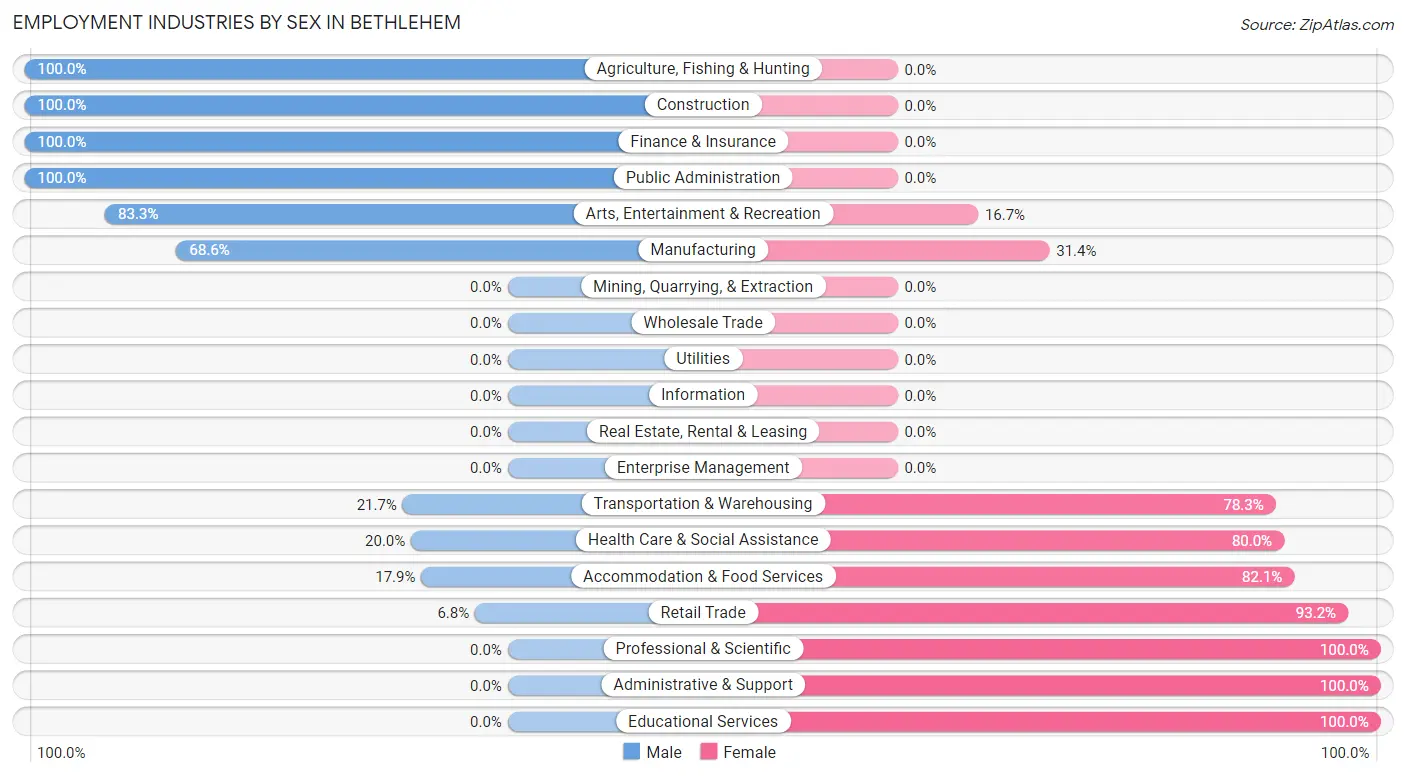
Employment Industries by Sex in Bethlehem
The Bethlehem industries that see more men than women are Agriculture, Fishing & Hunting (100.0%), Construction (100.0%), and Finance & Insurance (100.0%), whereas the industries that tend to have a higher number of women are Professional & Scientific (100.0%), Administrative & Support (100.0%), and Educational Services (100.0%).
| Industry | Male | Female |
| Agriculture, Fishing & Hunting | 20 (100.0%) | 0 (0.0%) |
| Mining, Quarrying, & Extraction | 0 (0.0%) | 0 (0.0%) |
| Construction | 7 (100.0%) | 0 (0.0%) |
| Manufacturing | 24 (68.6%) | 11 (31.4%) |
| Wholesale Trade | 0 (0.0%) | 0 (0.0%) |
| Retail Trade | 10 (6.8%) | 138 (93.2%) |
| Transportation & Warehousing | 5 (21.7%) | 18 (78.3%) |
| Utilities | 0 (0.0%) | 0 (0.0%) |
| Information | 0 (0.0%) | 0 (0.0%) |
| Finance & Insurance | 6 (100.0%) | 0 (0.0%) |
| Real Estate, Rental & Leasing | 0 (0.0%) | 0 (0.0%) |
| Professional & Scientific | 0 (0.0%) | 59 (100.0%) |
| Enterprise Management | 0 (0.0%) | 0 (0.0%) |
| Administrative & Support | 0 (0.0%) | 11 (100.0%) |
| Educational Services | 0 (0.0%) | 34 (100.0%) |
| Health Care & Social Assistance | 6 (20.0%) | 24 (80.0%) |
| Arts, Entertainment & Recreation | 15 (83.3%) | 3 (16.7%) |
| Accommodation & Food Services | 17 (17.9%) | 78 (82.1%) |
| Public Administration | 17 (100.0%) | 0 (0.0%) |
| Total | 127 (25.3%) | 376 (74.8%) |
Education in Bethlehem
School Enrollment in Bethlehem
The most common levels of schooling among the 135 students in Bethlehem are kindergarten (61 | 45.2%), middle school (51 | 37.8%), and elementary school (15 | 11.1%).
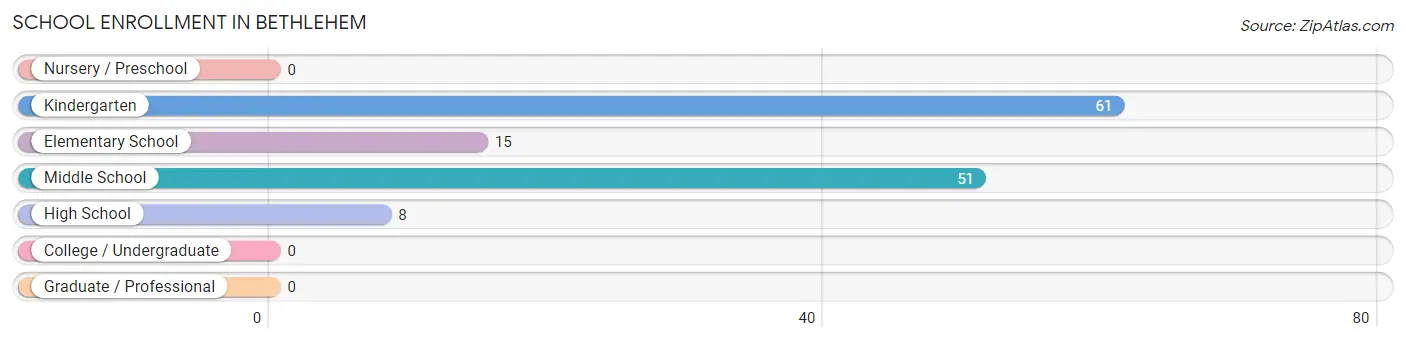
| School Level | # Students | % Students |
| Nursery / Preschool | 0 | 0.0% |
| Kindergarten | 61 | 45.2% |
| Elementary School | 15 | 11.1% |
| Middle School | 51 | 37.8% |
| High School | 8 | 5.9% |
| College / Undergraduate | 0 | 0.0% |
| Graduate / Professional | 0 | 0.0% |
| Total | 135 | 100.0% |
School Enrollment by Age by Funding Source in Bethlehem
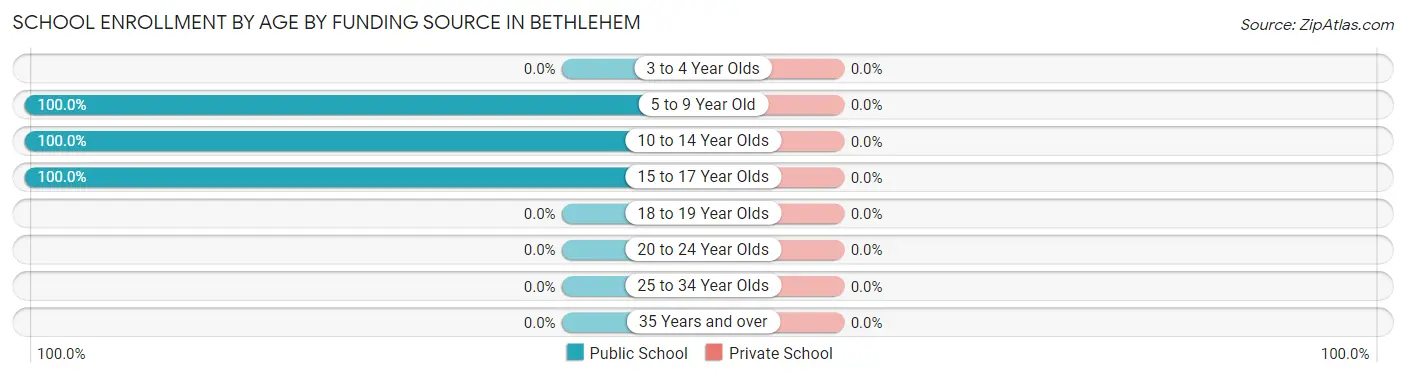
| Age Bracket | Public School | Private School |
| 3 to 4 Year Olds | 0 (0.0%) | 0 (0.0%) |
| 5 to 9 Year Old | 76 (100.0%) | 0 (0.0%) |
| 10 to 14 Year Olds | 56 (100.0%) | 0 (0.0%) |
| 15 to 17 Year Olds | 3 (100.0%) | 0 (0.0%) |
| 18 to 19 Year Olds | 0 (0.0%) | 0 (0.0%) |
| 20 to 24 Year Olds | 0 (0.0%) | 0 (0.0%) |
| 25 to 34 Year Olds | 0 (0.0%) | 0 (0.0%) |
| 35 Years and over | 0 (0.0%) | 0 (0.0%) |
| Total | 135 (100.0%) | 0 (0.0%) |
Educational Attainment by Field of Study in Bethlehem
Education (150 | 34.6%), business (68 | 15.7%), engineering (43 | 9.9%), bio, nature & agricultural (34 | 7.9%), and literature & languages (27 | 6.2%) are the most common fields of study among 433 individuals in Bethlehem who have obtained a bachelor's degree or higher.
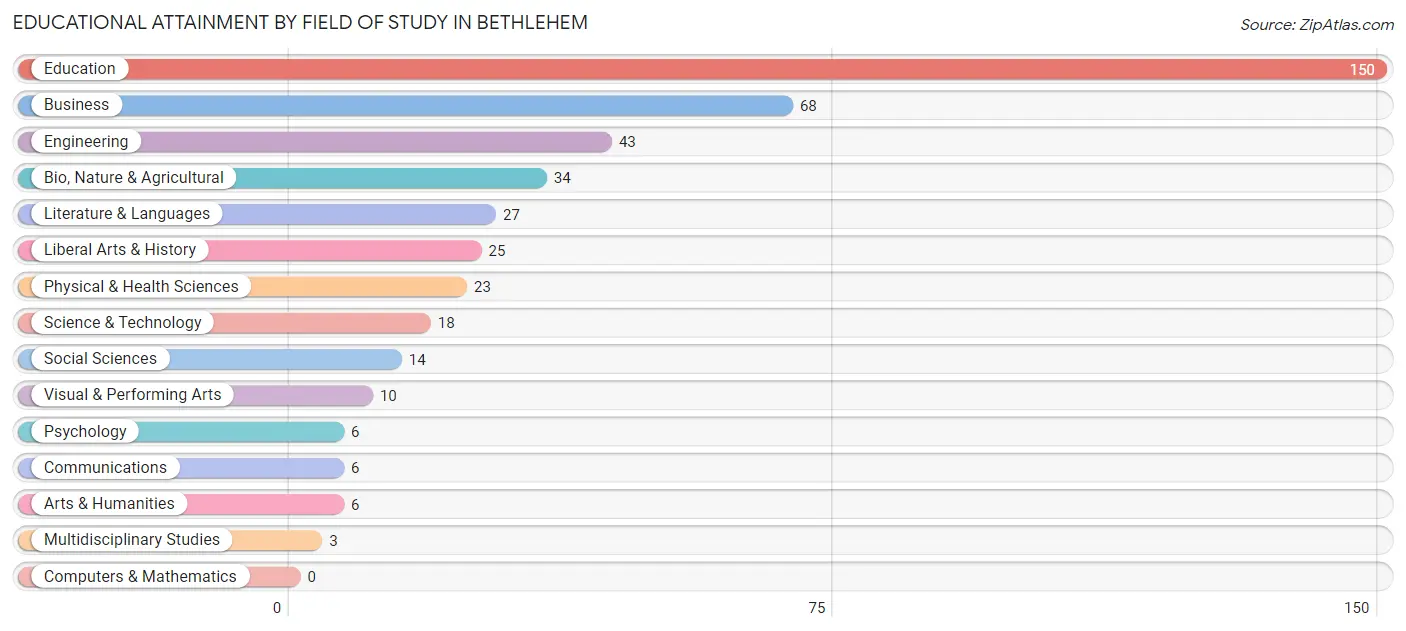
| Field of Study | # Graduates | % Graduates |
| Computers & Mathematics | 0 | 0.0% |
| Bio, Nature & Agricultural | 34 | 7.9% |
| Physical & Health Sciences | 23 | 5.3% |
| Psychology | 6 | 1.4% |
| Social Sciences | 14 | 3.2% |
| Engineering | 43 | 9.9% |
| Multidisciplinary Studies | 3 | 0.7% |
| Science & Technology | 18 | 4.2% |
| Business | 68 | 15.7% |
| Education | 150 | 34.6% |
| Literature & Languages | 27 | 6.2% |
| Liberal Arts & History | 25 | 5.8% |
| Visual & Performing Arts | 10 | 2.3% |
| Communications | 6 | 1.4% |
| Arts & Humanities | 6 | 1.4% |
| Total | 433 | 100.0% |
Transportation & Commute in Bethlehem
Vehicle Availability by Sex in Bethlehem
The most prevalent vehicle ownership categories in Bethlehem are males with 2 vehicles (61, accounting for 49.6%) and females with 2 vehicles (224, making up 16.4%).
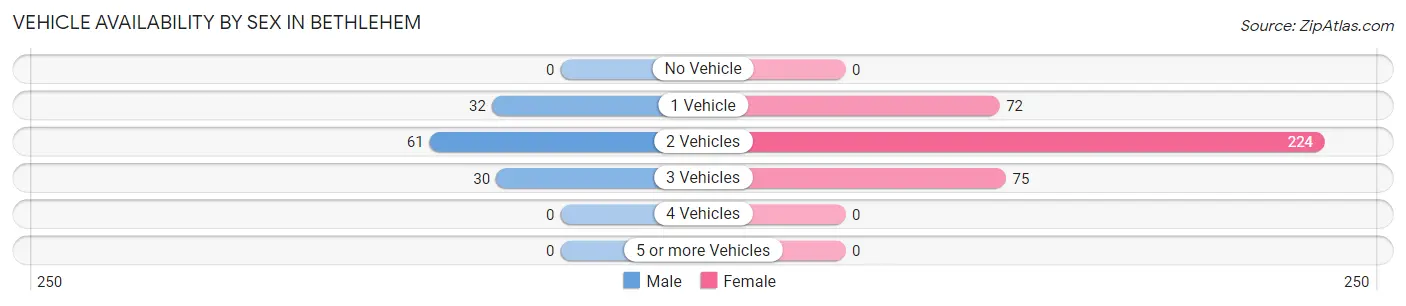
| Vehicles Available | Male | Female |
| No Vehicle | 0 (0.0%) | 0 (0.0%) |
| 1 Vehicle | 32 (26.0%) | 72 (19.4%) |
| 2 Vehicles | 61 (49.6%) | 224 (60.4%) |
| 3 Vehicles | 30 (24.4%) | 75 (20.2%) |
| 4 Vehicles | 0 (0.0%) | 0 (0.0%) |
| 5 or more Vehicles | 0 (0.0%) | 0 (0.0%) |
| Total | 123 (100.0%) | 371 (100.0%) |
Commute Time in Bethlehem
The most frequently occuring commute durations in Bethlehem are 25 to 29 minutes (87 commuters, 31.3%), 10 to 14 minutes (54 commuters, 19.4%), and 15 to 19 minutes (53 commuters, 19.1%).
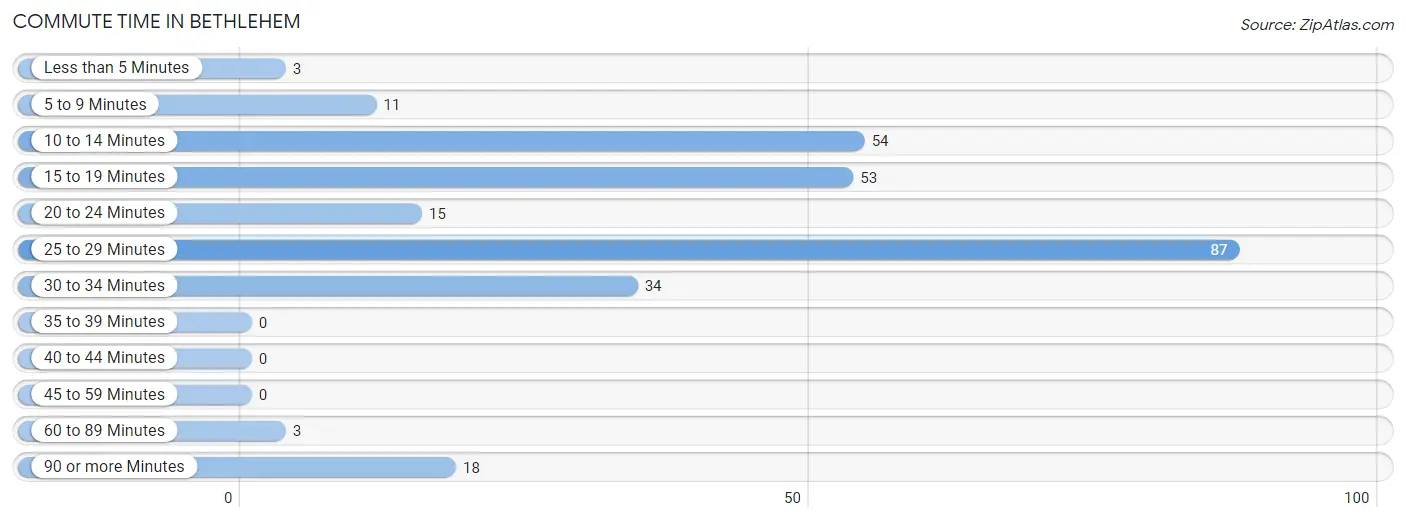
| Commute Time | # Commuters | % Commuters |
| Less than 5 Minutes | 3 | 1.1% |
| 5 to 9 Minutes | 11 | 4.0% |
| 10 to 14 Minutes | 54 | 19.4% |
| 15 to 19 Minutes | 53 | 19.1% |
| 20 to 24 Minutes | 15 | 5.4% |
| 25 to 29 Minutes | 87 | 31.3% |
| 30 to 34 Minutes | 34 | 12.2% |
| 35 to 39 Minutes | 0 | 0.0% |
| 40 to 44 Minutes | 0 | 0.0% |
| 45 to 59 Minutes | 0 | 0.0% |
| 60 to 89 Minutes | 3 | 1.1% |
| 90 or more Minutes | 18 | 6.5% |
Commute Time by Sex in Bethlehem
The most common commute times in Bethlehem are 25 to 29 minutes (40 commuters, 38.8%) for males and 25 to 29 minutes (47 commuters, 26.9%) for females.
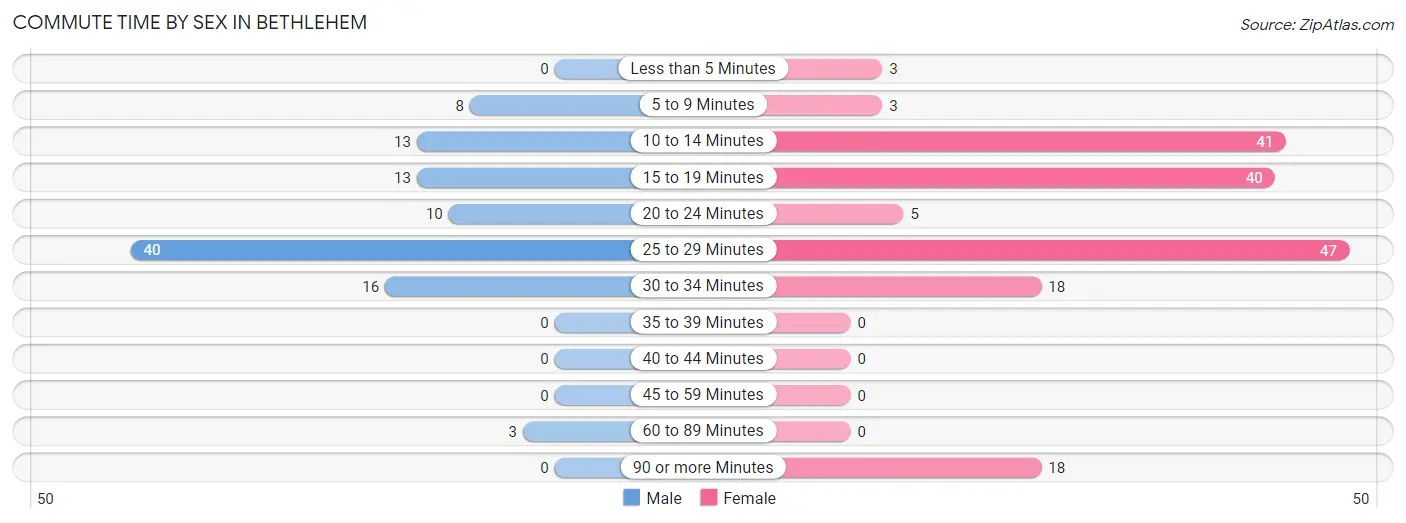
| Commute Time | Male | Female |
| Less than 5 Minutes | 0 (0.0%) | 3 (1.7%) |
| 5 to 9 Minutes | 8 (7.8%) | 3 (1.7%) |
| 10 to 14 Minutes | 13 (12.6%) | 41 (23.4%) |
| 15 to 19 Minutes | 13 (12.6%) | 40 (22.9%) |
| 20 to 24 Minutes | 10 (9.7%) | 5 (2.9%) |
| 25 to 29 Minutes | 40 (38.8%) | 47 (26.9%) |
| 30 to 34 Minutes | 16 (15.5%) | 18 (10.3%) |
| 35 to 39 Minutes | 0 (0.0%) | 0 (0.0%) |
| 40 to 44 Minutes | 0 (0.0%) | 0 (0.0%) |
| 45 to 59 Minutes | 0 (0.0%) | 0 (0.0%) |
| 60 to 89 Minutes | 3 (2.9%) | 0 (0.0%) |
| 90 or more Minutes | 0 (0.0%) | 18 (10.3%) |
Time of Departure to Work by Sex in Bethlehem
The most frequent times of departure to work in Bethlehem are 12:00 PM to 3:59 PM (23, 22.3%) for males and 7:30 AM to 7:59 AM (60, 34.3%) for females.
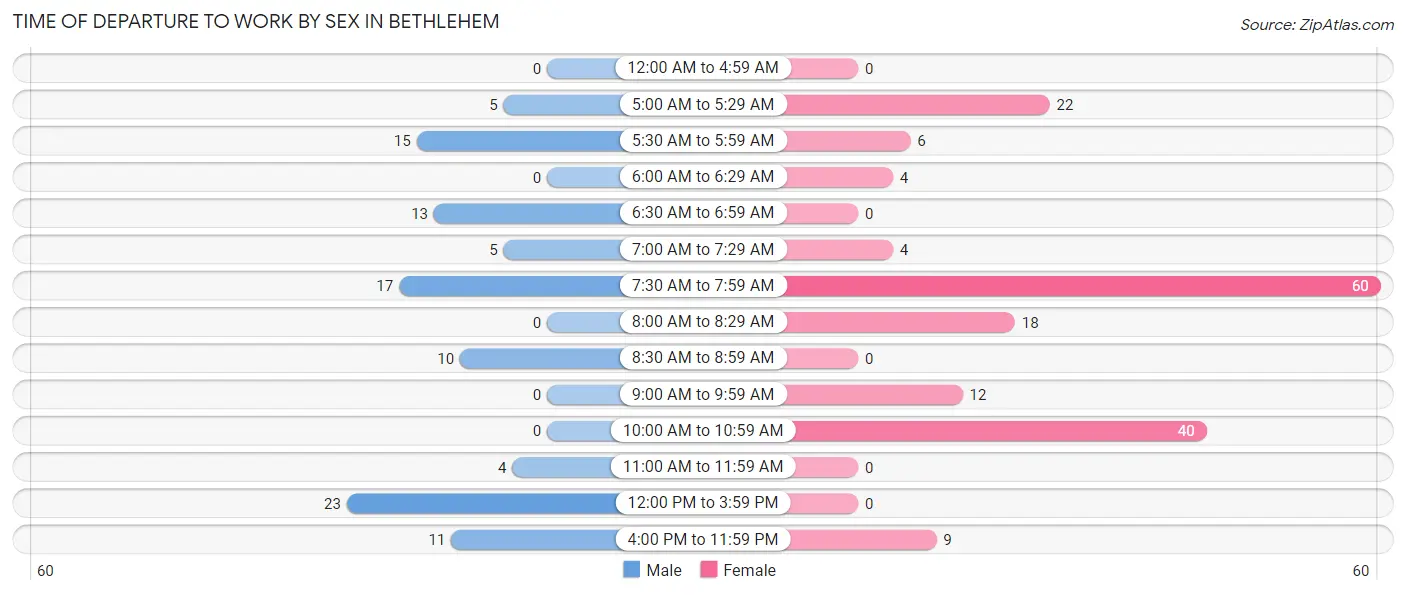
| Time of Departure | Male | Female |
| 12:00 AM to 4:59 AM | 0 (0.0%) | 0 (0.0%) |
| 5:00 AM to 5:29 AM | 5 (4.9%) | 22 (12.6%) |
| 5:30 AM to 5:59 AM | 15 (14.6%) | 6 (3.4%) |
| 6:00 AM to 6:29 AM | 0 (0.0%) | 4 (2.3%) |
| 6:30 AM to 6:59 AM | 13 (12.6%) | 0 (0.0%) |
| 7:00 AM to 7:29 AM | 5 (4.9%) | 4 (2.3%) |
| 7:30 AM to 7:59 AM | 17 (16.5%) | 60 (34.3%) |
| 8:00 AM to 8:29 AM | 0 (0.0%) | 18 (10.3%) |
| 8:30 AM to 8:59 AM | 10 (9.7%) | 0 (0.0%) |
| 9:00 AM to 9:59 AM | 0 (0.0%) | 12 (6.9%) |
| 10:00 AM to 10:59 AM | 0 (0.0%) | 40 (22.9%) |
| 11:00 AM to 11:59 AM | 4 (3.9%) | 0 (0.0%) |
| 12:00 PM to 3:59 PM | 23 (22.3%) | 0 (0.0%) |
| 4:00 PM to 11:59 PM | 11 (10.7%) | 9 (5.1%) |
| Total | 103 (100.0%) | 175 (100.0%) |
Housing Occupancy in Bethlehem
Occupancy by Ownership in Bethlehem
Of the total 368 dwellings in Bethlehem, owner-occupied units account for 276 (75.0%), while renter-occupied units make up 92 (25.0%).
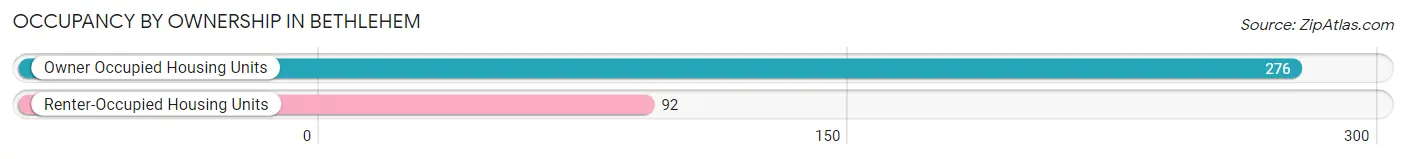
| Occupancy | # Housing Units | % Housing Units |
| Owner Occupied Housing Units | 276 | 75.0% |
| Renter-Occupied Housing Units | 92 | 25.0% |
| Total Occupied Housing Units | 368 | 100.0% |
Occupancy by Household Size in Bethlehem
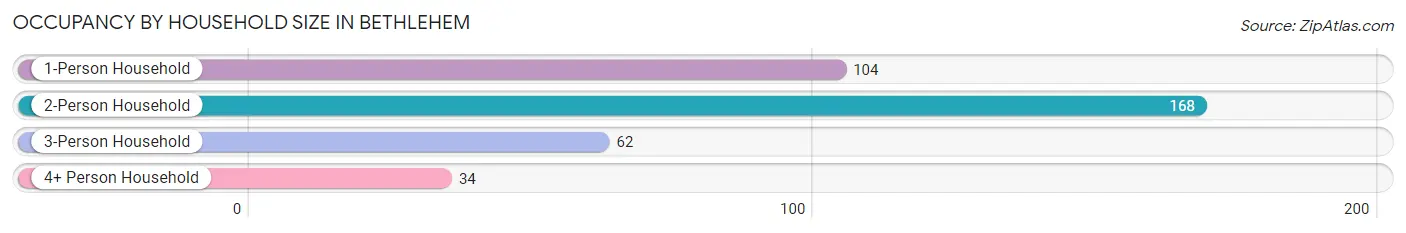
| Household Size | # Housing Units | % Housing Units |
| 1-Person Household | 104 | 28.3% |
| 2-Person Household | 168 | 45.7% |
| 3-Person Household | 62 | 16.9% |
| 4+ Person Household | 34 | 9.2% |
| Total Housing Units | 368 | 100.0% |
Occupancy by Ownership by Household Size in Bethlehem
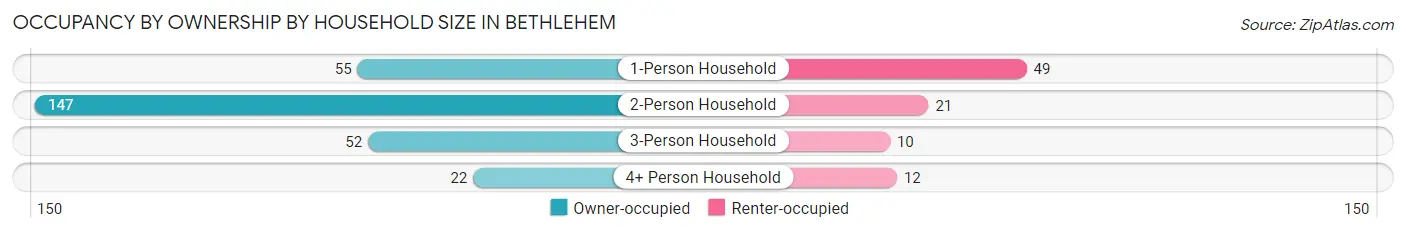
| Household Size | Owner-occupied | Renter-occupied |
| 1-Person Household | 55 (52.9%) | 49 (47.1%) |
| 2-Person Household | 147 (87.5%) | 21 (12.5%) |
| 3-Person Household | 52 (83.9%) | 10 (16.1%) |
| 4+ Person Household | 22 (64.7%) | 12 (35.3%) |
| Total Housing Units | 276 (75.0%) | 92 (25.0%) |
Occupancy by Educational Attainment in Bethlehem
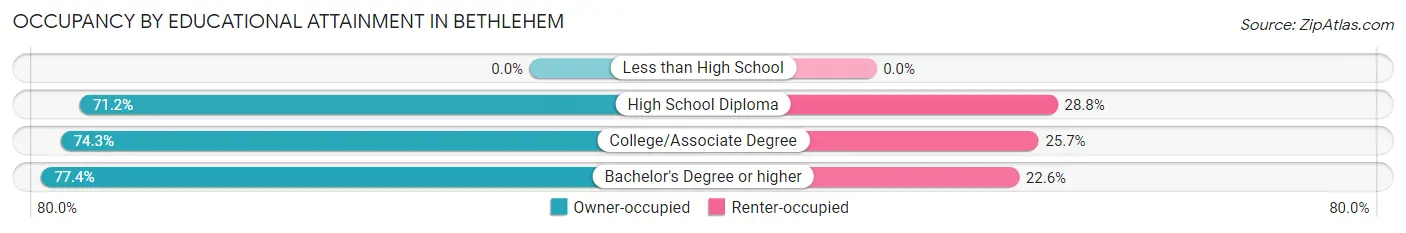
| Household Size | Owner-occupied | Renter-occupied |
| Less than High School | 0 (0.0%) | 0 (0.0%) |
| High School Diploma | 52 (71.2%) | 21 (28.8%) |
| College/Associate Degree | 101 (74.3%) | 35 (25.7%) |
| Bachelor's Degree or higher | 123 (77.4%) | 36 (22.6%) |
Occupancy by Age of Householder in Bethlehem
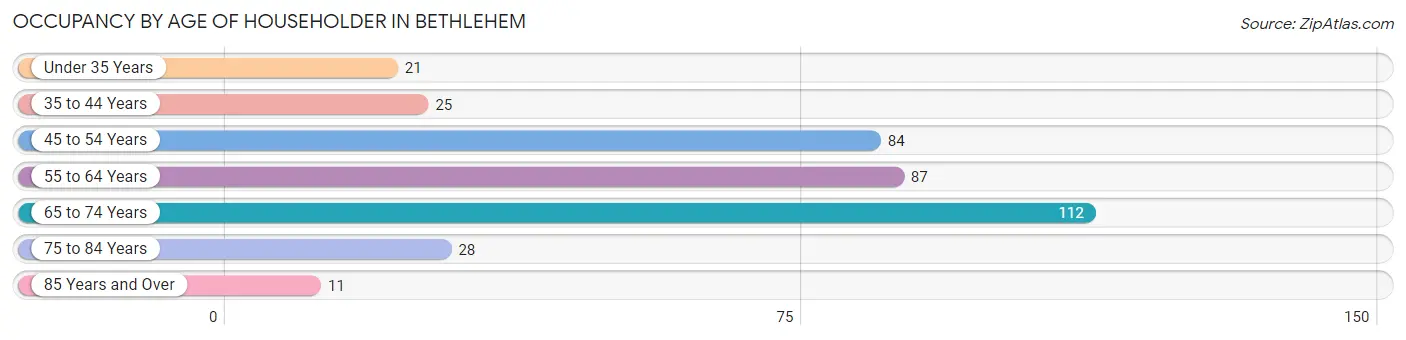
| Age Bracket | # Households | % Households |
| Under 35 Years | 21 | 5.7% |
| 35 to 44 Years | 25 | 6.8% |
| 45 to 54 Years | 84 | 22.8% |
| 55 to 64 Years | 87 | 23.6% |
| 65 to 74 Years | 112 | 30.4% |
| 75 to 84 Years | 28 | 7.6% |
| 85 Years and Over | 11 | 3.0% |
| Total | 368 | 100.0% |
Housing Finances in Bethlehem
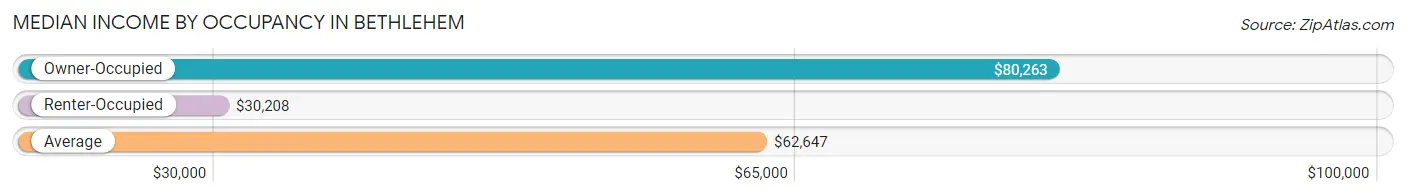
Median Income by Occupancy in Bethlehem
| Occupancy Type | # Households | Median Income |
| Owner-Occupied | 276 (75.0%) | $80,263 |
| Renter-Occupied | 92 (25.0%) | $30,208 |
| Average | 368 (100.0%) | $62,647 |
Occupancy by Householder Income Bracket in Bethlehem
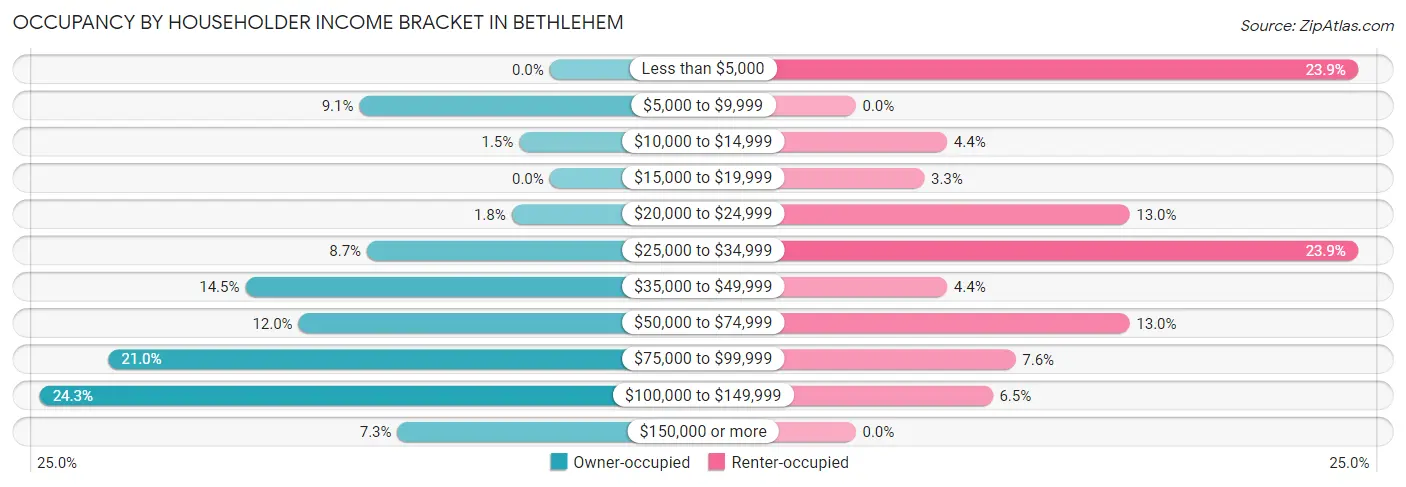
| Income Bracket | Owner-occupied | Renter-occupied |
| Less than $5,000 | 0 (0.0%) | 22 (23.9%) |
| $5,000 to $9,999 | 25 (9.1%) | 0 (0.0%) |
| $10,000 to $14,999 | 4 (1.5%) | 4 (4.3%) |
| $15,000 to $19,999 | 0 (0.0%) | 3 (3.3%) |
| $20,000 to $24,999 | 5 (1.8%) | 12 (13.0%) |
| $25,000 to $34,999 | 24 (8.7%) | 22 (23.9%) |
| $35,000 to $49,999 | 40 (14.5%) | 4 (4.3%) |
| $50,000 to $74,999 | 33 (12.0%) | 12 (13.0%) |
| $75,000 to $99,999 | 58 (21.0%) | 7 (7.6%) |
| $100,000 to $149,999 | 67 (24.3%) | 6 (6.5%) |
| $150,000 or more | 20 (7.2%) | 0 (0.0%) |
| Total | 276 (100.0%) | 92 (100.0%) |
Monthly Housing Cost Tiers in Bethlehem
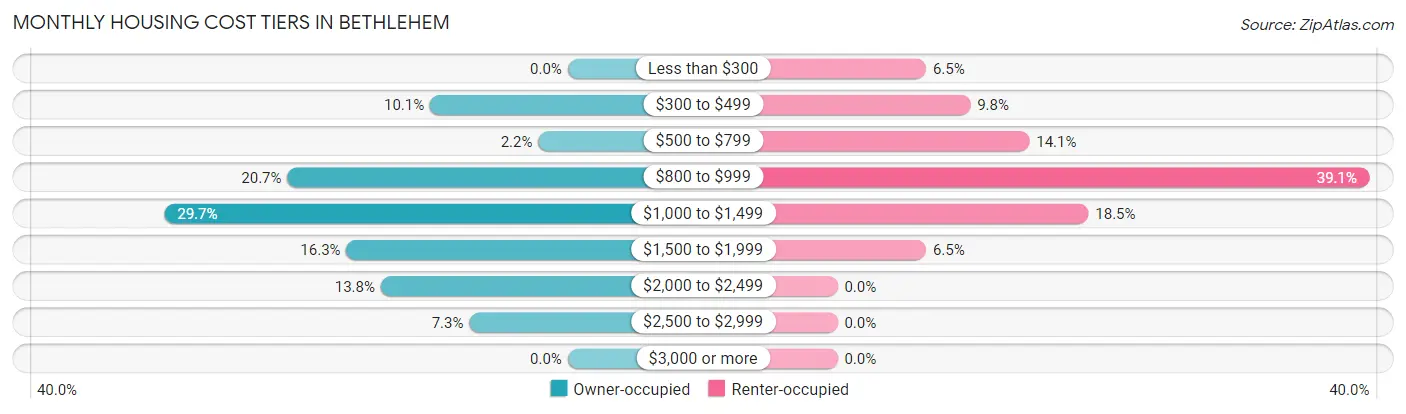
| Monthly Cost | Owner-occupied | Renter-occupied |
| Less than $300 | 0 (0.0%) | 6 (6.5%) |
| $300 to $499 | 28 (10.1%) | 9 (9.8%) |
| $500 to $799 | 6 (2.2%) | 13 (14.1%) |
| $800 to $999 | 57 (20.6%) | 36 (39.1%) |
| $1,000 to $1,499 | 82 (29.7%) | 17 (18.5%) |
| $1,500 to $1,999 | 45 (16.3%) | 6 (6.5%) |
| $2,000 to $2,499 | 38 (13.8%) | 0 (0.0%) |
| $2,500 to $2,999 | 20 (7.2%) | 0 (0.0%) |
| $3,000 or more | 0 (0.0%) | 0 (0.0%) |
| Total | 276 (100.0%) | 92 (100.0%) |
Physical Housing Characteristics in Bethlehem
Housing Structures in Bethlehem
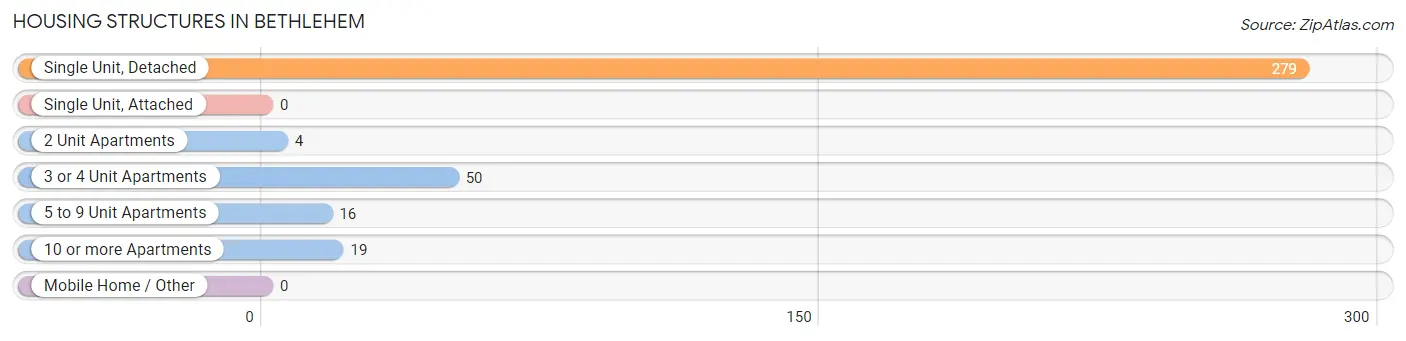
| Structure Type | # Housing Units | % Housing Units |
| Single Unit, Detached | 279 | 75.8% |
| Single Unit, Attached | 0 | 0.0% |
| 2 Unit Apartments | 4 | 1.1% |
| 3 or 4 Unit Apartments | 50 | 13.6% |
| 5 to 9 Unit Apartments | 16 | 4.3% |
| 10 or more Apartments | 19 | 5.2% |
| Mobile Home / Other | 0 | 0.0% |
| Total | 368 | 100.0% |
Housing Structures by Occupancy in Bethlehem
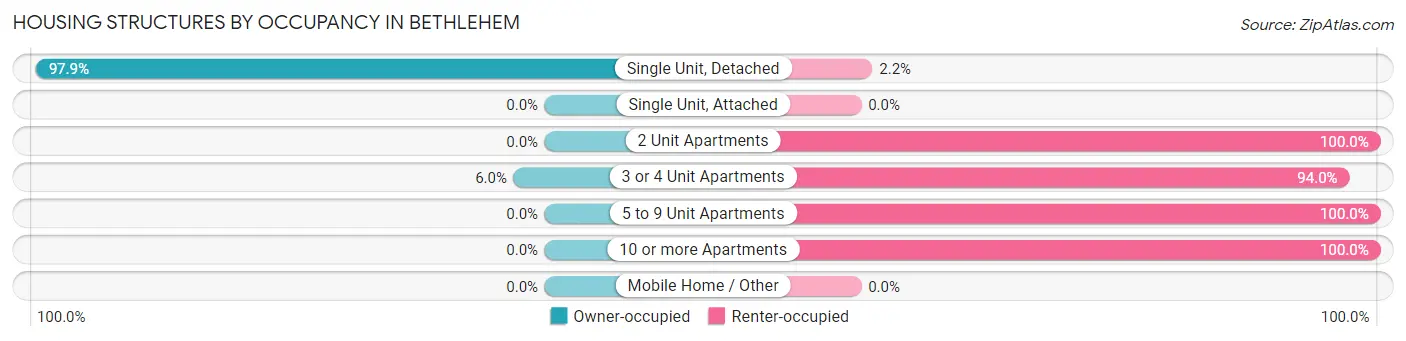
| Structure Type | Owner-occupied | Renter-occupied |
| Single Unit, Detached | 273 (97.9%) | 6 (2.1%) |
| Single Unit, Attached | 0 (0.0%) | 0 (0.0%) |
| 2 Unit Apartments | 0 (0.0%) | 4 (100.0%) |
| 3 or 4 Unit Apartments | 3 (6.0%) | 47 (94.0%) |
| 5 to 9 Unit Apartments | 0 (0.0%) | 16 (100.0%) |
| 10 or more Apartments | 0 (0.0%) | 19 (100.0%) |
| Mobile Home / Other | 0 (0.0%) | 0 (0.0%) |
| Total | 276 (75.0%) | 92 (25.0%) |
Housing Structures by Number of Rooms in Bethlehem
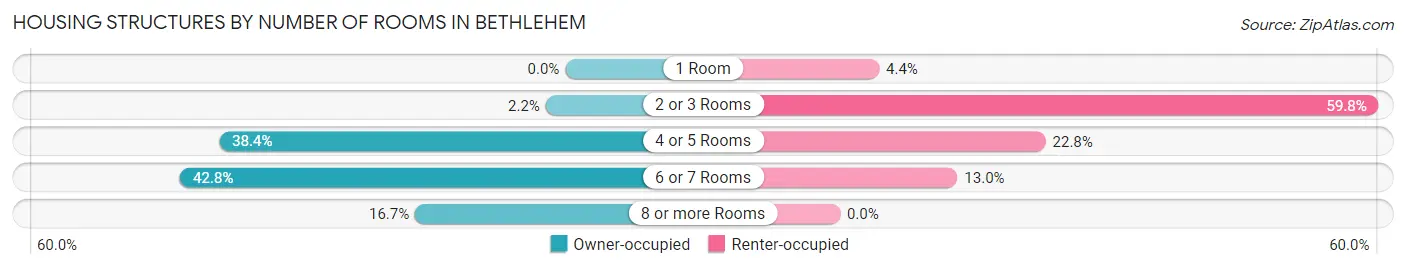
| Number of Rooms | Owner-occupied | Renter-occupied |
| 1 Room | 0 (0.0%) | 4 (4.3%) |
| 2 or 3 Rooms | 6 (2.2%) | 55 (59.8%) |
| 4 or 5 Rooms | 106 (38.4%) | 21 (22.8%) |
| 6 or 7 Rooms | 118 (42.7%) | 12 (13.0%) |
| 8 or more Rooms | 46 (16.7%) | 0 (0.0%) |
| Total | 276 (100.0%) | 92 (100.0%) |
Housing Structure by Heating Type in Bethlehem
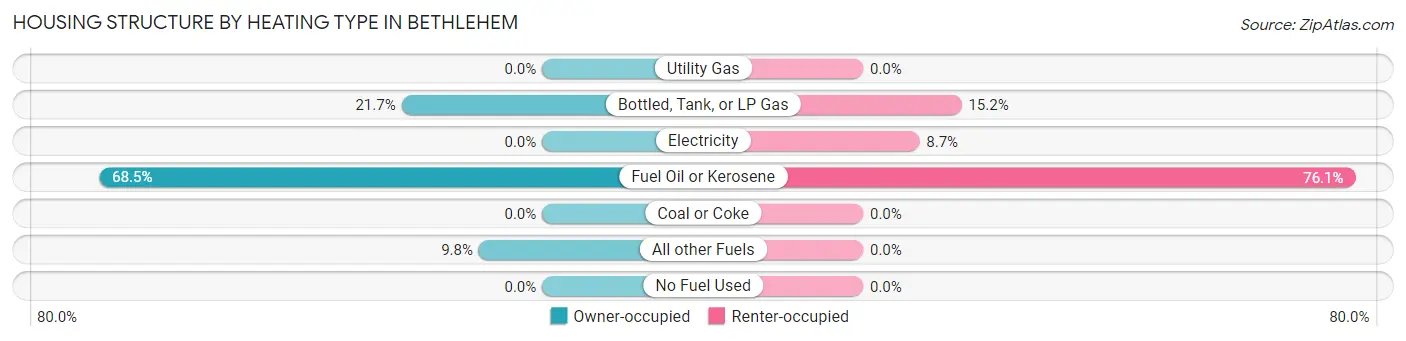
| Heating Type | Owner-occupied | Renter-occupied |
| Utility Gas | 0 (0.0%) | 0 (0.0%) |
| Bottled, Tank, or LP Gas | 60 (21.7%) | 14 (15.2%) |
| Electricity | 0 (0.0%) | 8 (8.7%) |
| Fuel Oil or Kerosene | 189 (68.5%) | 70 (76.1%) |
| Coal or Coke | 0 (0.0%) | 0 (0.0%) |
| All other Fuels | 27 (9.8%) | 0 (0.0%) |
| No Fuel Used | 0 (0.0%) | 0 (0.0%) |
| Total | 276 (100.0%) | 92 (100.0%) |
Household Vehicle Usage in Bethlehem
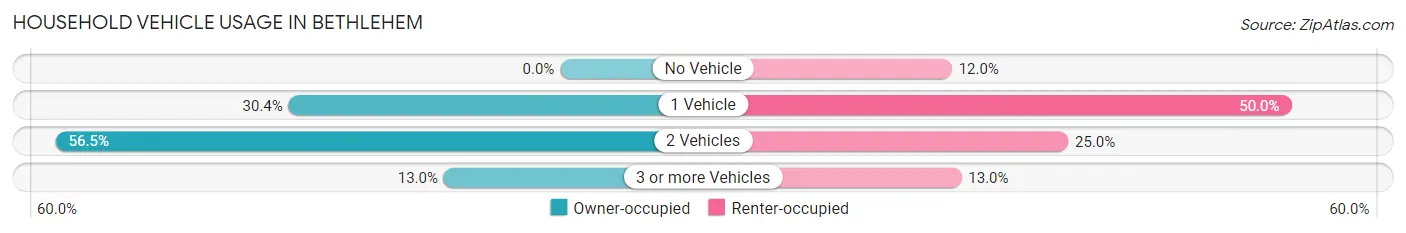
| Vehicles per Household | Owner-occupied | Renter-occupied |
| No Vehicle | 0 (0.0%) | 11 (12.0%) |
| 1 Vehicle | 84 (30.4%) | 46 (50.0%) |
| 2 Vehicles | 156 (56.5%) | 23 (25.0%) |
| 3 or more Vehicles | 36 (13.0%) | 12 (13.0%) |
| Total | 276 (100.0%) | 92 (100.0%) |
Real Estate & Mortgages in Bethlehem
Real Estate and Mortgage Overview in Bethlehem
| Characteristic | Without Mortgage | With Mortgage |
| Housing Units | 124 | 152 |
| Median Property Value | $240,000 | $185,400 |
| Median Household Income | $91,875 | $7 |
| Monthly Housing Costs | $1,009 | $0 |
| Real Estate Taxes | $4,522 | $0 |
Property Value by Mortgage Status in Bethlehem
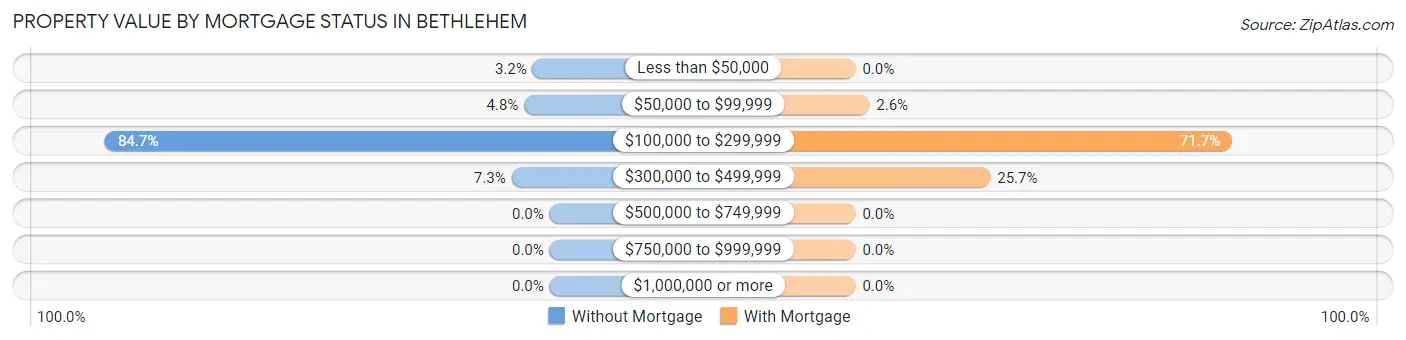
| Property Value | Without Mortgage | With Mortgage |
| Less than $50,000 | 4 (3.2%) | 0 (0.0%) |
| $50,000 to $99,999 | 6 (4.8%) | 4 (2.6%) |
| $100,000 to $299,999 | 105 (84.7%) | 109 (71.7%) |
| $300,000 to $499,999 | 9 (7.3%) | 39 (25.7%) |
| $500,000 to $749,999 | 0 (0.0%) | 0 (0.0%) |
| $750,000 to $999,999 | 0 (0.0%) | 0 (0.0%) |
| $1,000,000 or more | 0 (0.0%) | 0 (0.0%) |
| Total | 124 (100.0%) | 152 (100.0%) |
Household Income by Mortgage Status in Bethlehem
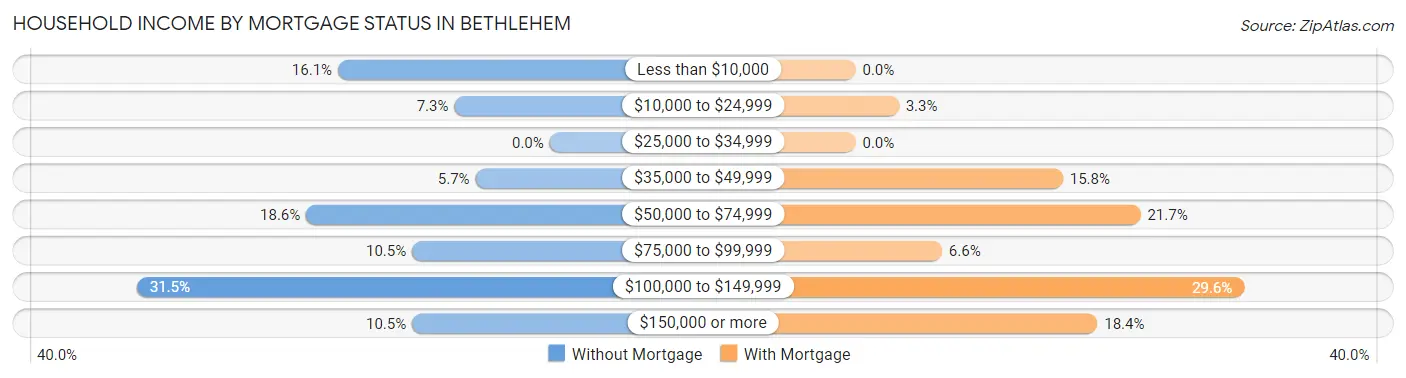
| Household Income | Without Mortgage | With Mortgage |
| Less than $10,000 | 20 (16.1%) | 0 (0.0%) |
| $10,000 to $24,999 | 9 (7.3%) | 5 (3.3%) |
| $25,000 to $34,999 | 0 (0.0%) | 0 (0.0%) |
| $35,000 to $49,999 | 7 (5.7%) | 24 (15.8%) |
| $50,000 to $74,999 | 23 (18.5%) | 33 (21.7%) |
| $75,000 to $99,999 | 13 (10.5%) | 10 (6.6%) |
| $100,000 to $149,999 | 39 (31.5%) | 45 (29.6%) |
| $150,000 or more | 13 (10.5%) | 28 (18.4%) |
| Total | 124 (100.0%) | 152 (100.0%) |
Property Value to Household Income Ratio in Bethlehem
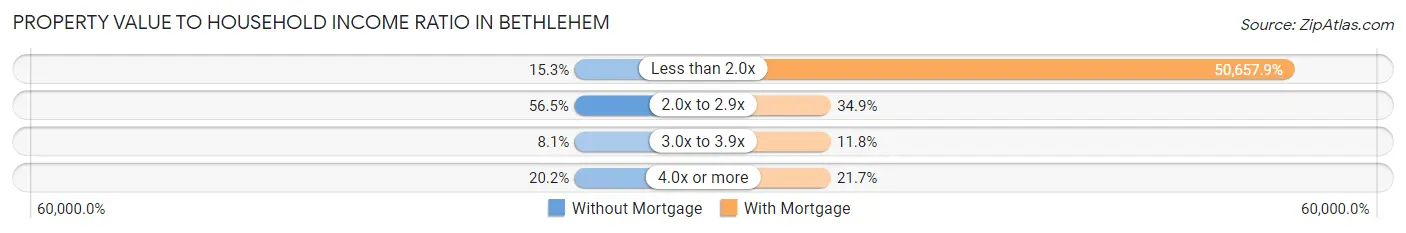
| Value-to-Income Ratio | Without Mortgage | With Mortgage |
| Less than 2.0x | 19 (15.3%) | 77,000 (50,657.9%) |
| 2.0x to 2.9x | 70 (56.5%) | 53 (34.9%) |
| 3.0x to 3.9x | 10 (8.1%) | 18 (11.8%) |
| 4.0x or more | 25 (20.2%) | 33 (21.7%) |
| Total | 124 (100.0%) | 152 (100.0%) |
Real Estate Taxes by Mortgage Status in Bethlehem
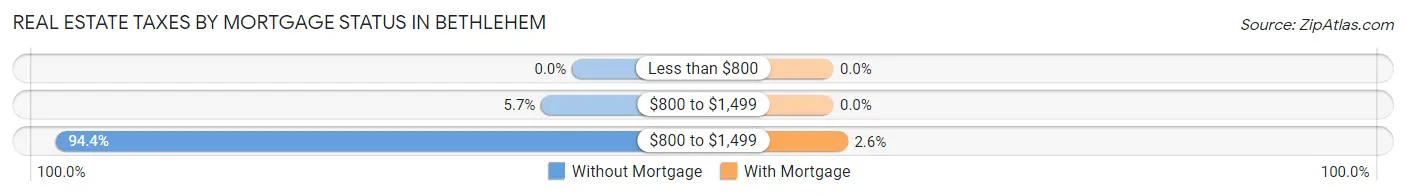
| Property Taxes | Without Mortgage | With Mortgage |
| Less than $800 | 0 (0.0%) | 0 (0.0%) |
| $800 to $1,499 | 7 (5.7%) | 0 (0.0%) |
| $800 to $1,499 | 117 (94.4%) | 4 (2.6%) |
| Total | 124 (100.0%) | 152 (100.0%) |
Health & Disability in Bethlehem
Health Insurance Coverage by Age in Bethlehem
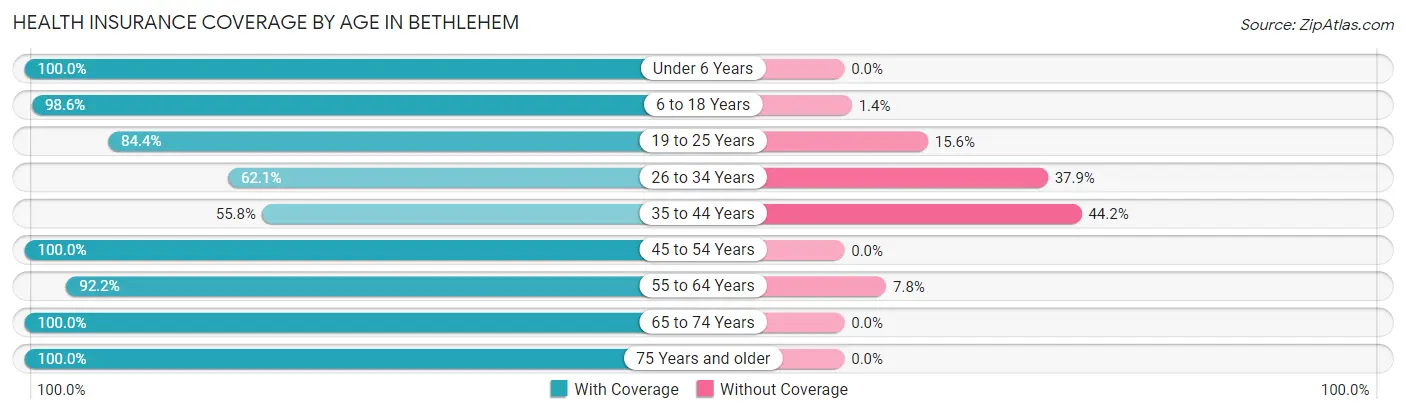
| Age Bracket | With Coverage | Without Coverage |
| Under 6 Years | 25 (100.0%) | 0 (0.0%) |
| 6 to 18 Years | 143 (98.6%) | 2 (1.4%) |
| 19 to 25 Years | 65 (84.4%) | 12 (15.6%) |
| 26 to 34 Years | 18 (62.1%) | 11 (37.9%) |
| 35 to 44 Years | 29 (55.8%) | 23 (44.2%) |
| 45 to 54 Years | 251 (100.0%) | 0 (0.0%) |
| 55 to 64 Years | 142 (92.2%) | 12 (7.8%) |
| 65 to 74 Years | 173 (100.0%) | 0 (0.0%) |
| 75 Years and older | 51 (100.0%) | 0 (0.0%) |
| Total | 897 (93.7%) | 60 (6.3%) |
Health Insurance Coverage by Citizenship Status in Bethlehem
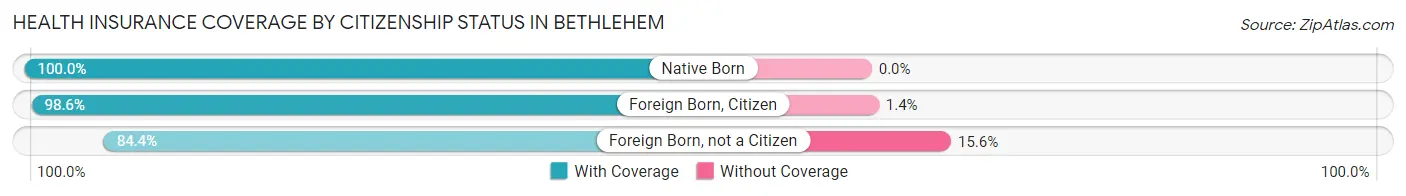
| Citizenship Status | With Coverage | Without Coverage |
| Native Born | 25 (100.0%) | 0 (0.0%) |
| Foreign Born, Citizen | 143 (98.6%) | 2 (1.4%) |
| Foreign Born, not a Citizen | 65 (84.4%) | 12 (15.6%) |
Health Insurance Coverage by Household Income in Bethlehem
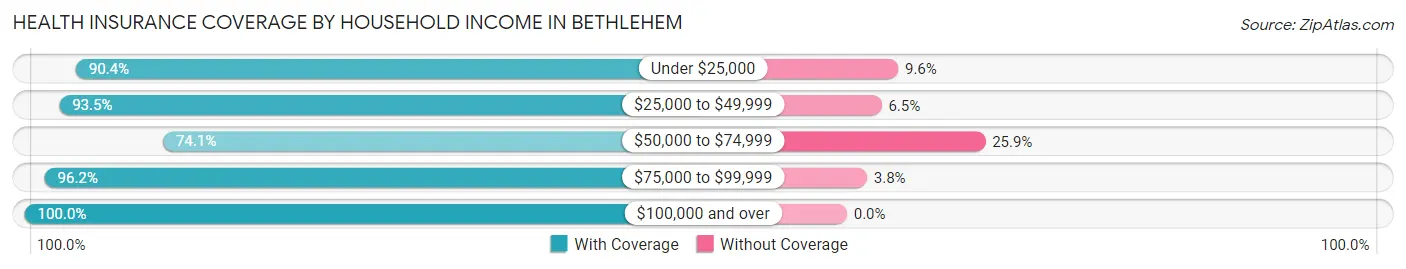
| Household Income | With Coverage | Without Coverage |
| Under $25,000 | 113 (90.4%) | 12 (9.6%) |
| $25,000 to $49,999 | 317 (93.5%) | 22 (6.5%) |
| $50,000 to $74,999 | 60 (74.1%) | 21 (25.9%) |
| $75,000 to $99,999 | 128 (96.2%) | 5 (3.8%) |
| $100,000 and over | 279 (100.0%) | 0 (0.0%) |
Public vs Private Health Insurance Coverage by Age in Bethlehem
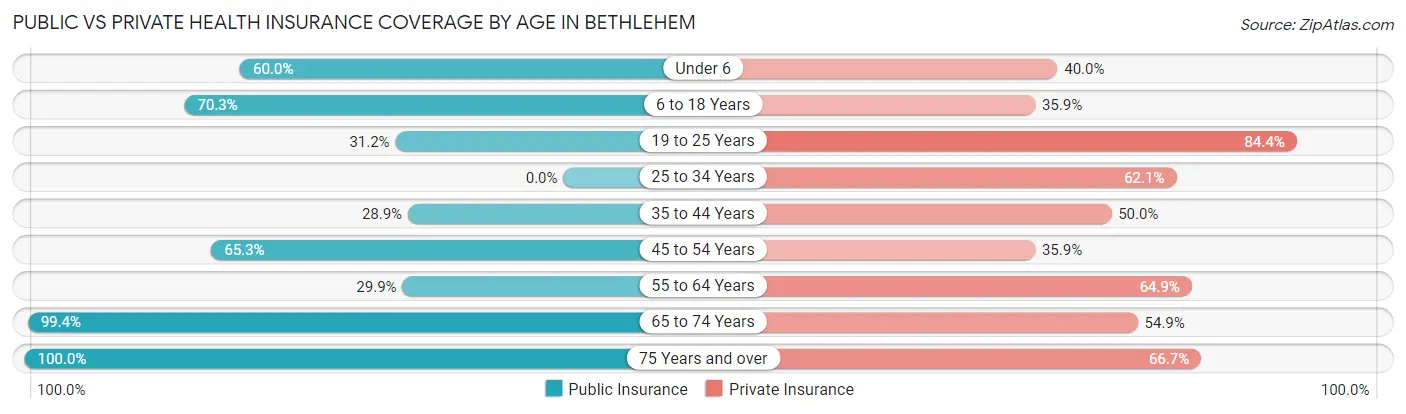
| Age Bracket | Public Insurance | Private Insurance |
| Under 6 | 15 (60.0%) | 10 (40.0%) |
| 6 to 18 Years | 102 (70.3%) | 52 (35.9%) |
| 19 to 25 Years | 24 (31.2%) | 65 (84.4%) |
| 25 to 34 Years | 0 (0.0%) | 18 (62.1%) |
| 35 to 44 Years | 15 (28.8%) | 26 (50.0%) |
| 45 to 54 Years | 164 (65.3%) | 90 (35.9%) |
| 55 to 64 Years | 46 (29.9%) | 100 (64.9%) |
| 65 to 74 Years | 172 (99.4%) | 95 (54.9%) |
| 75 Years and over | 51 (100.0%) | 34 (66.7%) |
| Total | 589 (61.6%) | 490 (51.2%) |
Disability Status by Sex by Age in Bethlehem
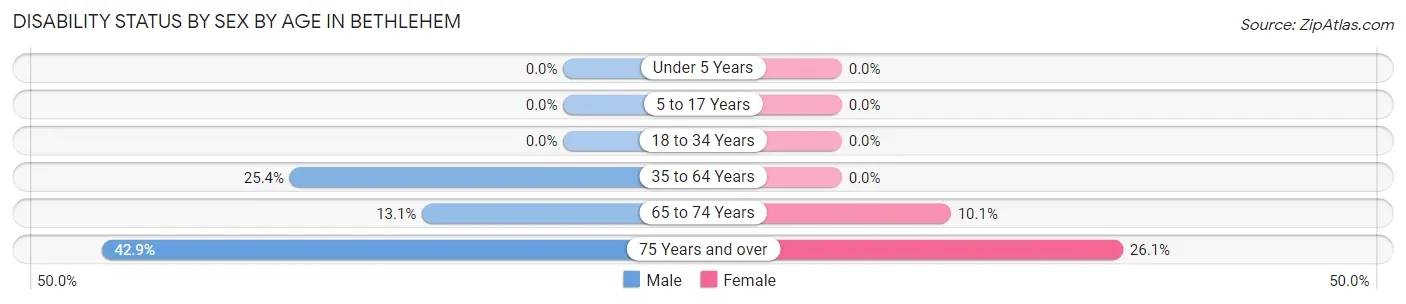
| Age Bracket | Male | Female |
| Under 5 Years | 0 (0.0%) | 0 (0.0%) |
| 5 to 17 Years | 0 (0.0%) | 0 (0.0%) |
| 18 to 34 Years | 0 (0.0%) | 0 (0.0%) |
| 35 to 64 Years | 33 (25.4%) | 0 (0.0%) |
| 65 to 74 Years | 11 (13.1%) | 9 (10.1%) |
| 75 Years and over | 12 (42.9%) | 6 (26.1%) |
Disability Class by Sex by Age in Bethlehem
Disability Class: Hearing Difficulty
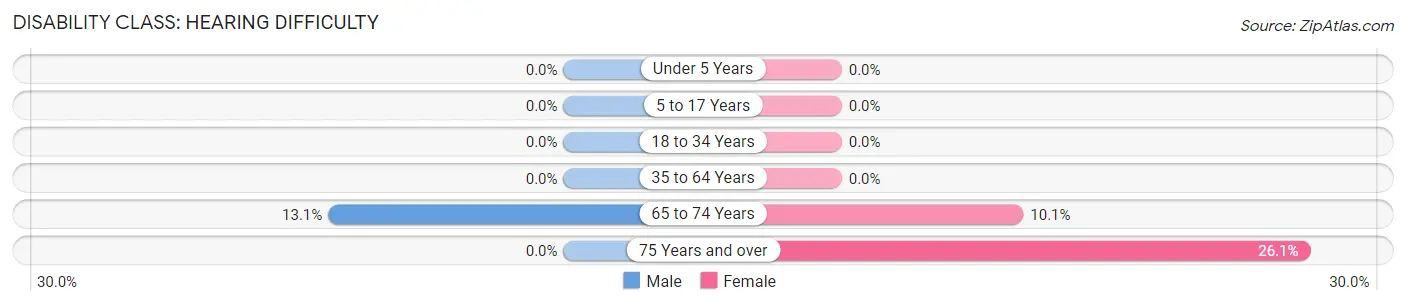
| Age Bracket | Male | Female |
| Under 5 Years | 0 (0.0%) | 0 (0.0%) |
| 5 to 17 Years | 0 (0.0%) | 0 (0.0%) |
| 18 to 34 Years | 0 (0.0%) | 0 (0.0%) |
| 35 to 64 Years | 0 (0.0%) | 0 (0.0%) |
| 65 to 74 Years | 11 (13.1%) | 9 (10.1%) |
| 75 Years and over | 0 (0.0%) | 6 (26.1%) |
Disability Class: Vision Difficulty
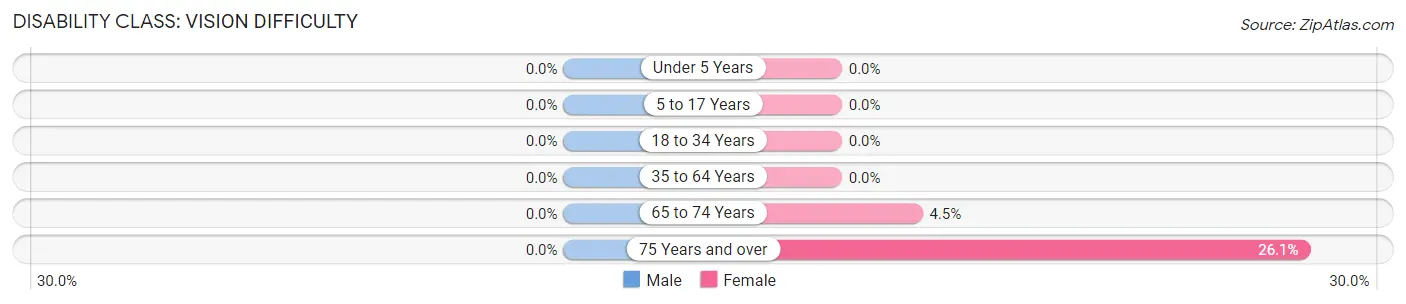
| Age Bracket | Male | Female |
| Under 5 Years | 0 (0.0%) | 0 (0.0%) |
| 5 to 17 Years | 0 (0.0%) | 0 (0.0%) |
| 18 to 34 Years | 0 (0.0%) | 0 (0.0%) |
| 35 to 64 Years | 0 (0.0%) | 0 (0.0%) |
| 65 to 74 Years | 0 (0.0%) | 4 (4.5%) |
| 75 Years and over | 0 (0.0%) | 6 (26.1%) |
Disability Class: Cognitive Difficulty
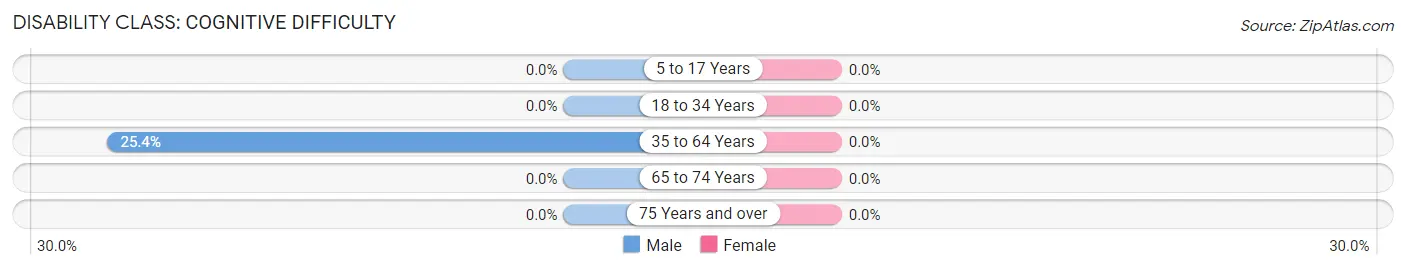
| Age Bracket | Male | Female |
| 5 to 17 Years | 0 (0.0%) | 0 (0.0%) |
| 18 to 34 Years | 0 (0.0%) | 0 (0.0%) |
| 35 to 64 Years | 33 (25.4%) | 0 (0.0%) |
| 65 to 74 Years | 0 (0.0%) | 0 (0.0%) |
| 75 Years and over | 0 (0.0%) | 0 (0.0%) |
Disability Class: Ambulatory Difficulty
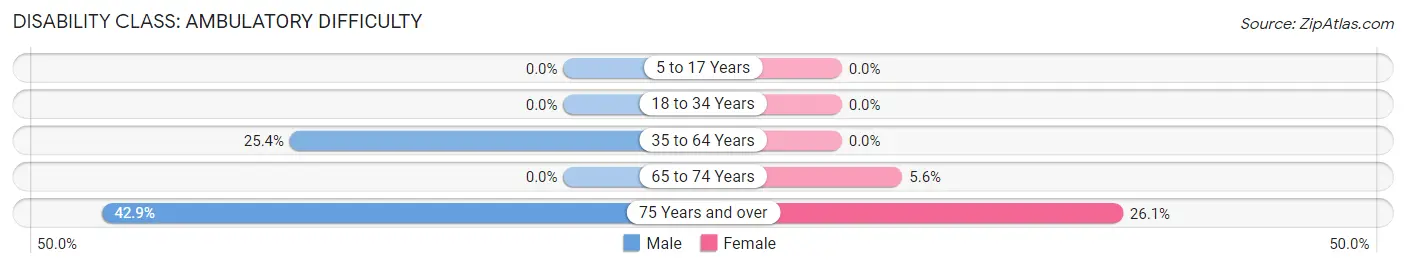
| Age Bracket | Male | Female |
| 5 to 17 Years | 0 (0.0%) | 0 (0.0%) |
| 18 to 34 Years | 0 (0.0%) | 0 (0.0%) |
| 35 to 64 Years | 33 (25.4%) | 0 (0.0%) |
| 65 to 74 Years | 0 (0.0%) | 5 (5.6%) |
| 75 Years and over | 12 (42.9%) | 6 (26.1%) |
Disability Class: Self-Care Difficulty
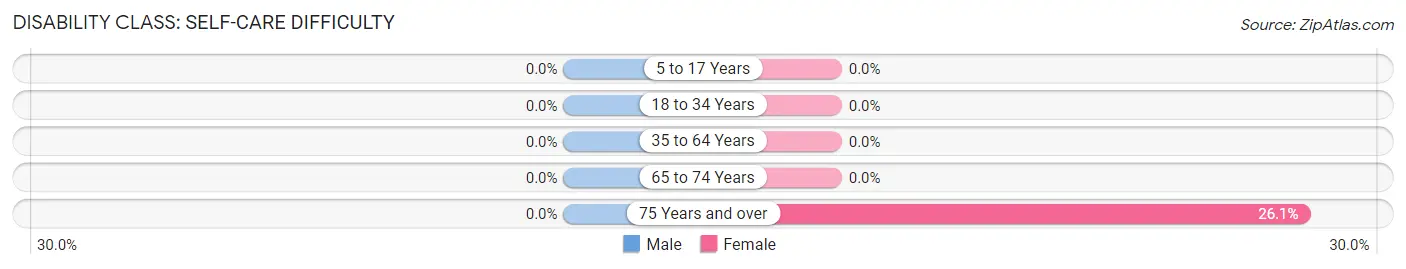
| Age Bracket | Male | Female |
| 5 to 17 Years | 0 (0.0%) | 0 (0.0%) |
| 18 to 34 Years | 0 (0.0%) | 0 (0.0%) |
| 35 to 64 Years | 0 (0.0%) | 0 (0.0%) |
| 65 to 74 Years | 0 (0.0%) | 0 (0.0%) |
| 75 Years and over | 0 (0.0%) | 6 (26.1%) |
Technology Access in Bethlehem
Computing Device Access in Bethlehem
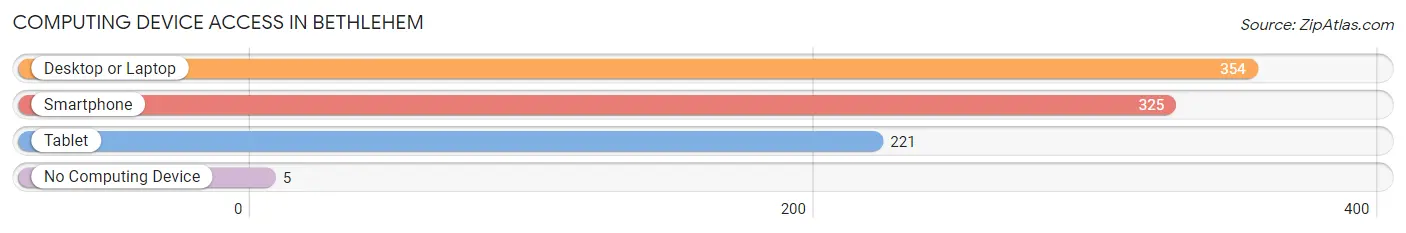
| Device Type | # Households | % Households |
| Desktop or Laptop | 354 | 96.2% |
| Smartphone | 325 | 88.3% |
| Tablet | 221 | 60.1% |
| No Computing Device | 5 | 1.4% |
| Total | 368 | 100.0% |
Internet Access in Bethlehem
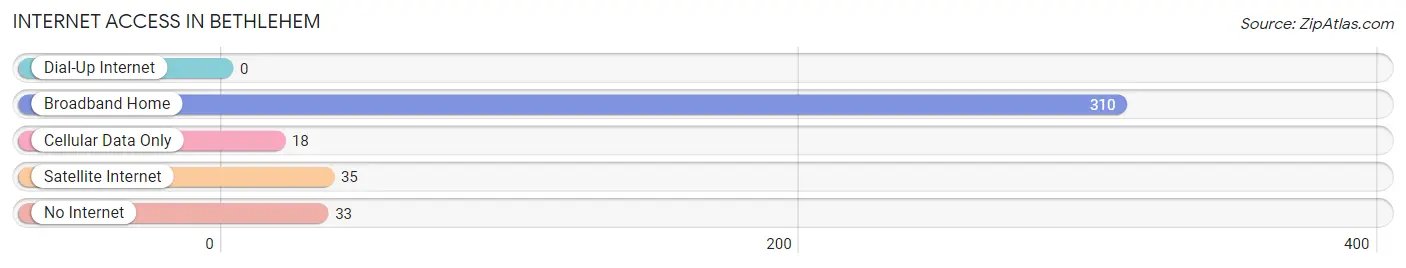
| Internet Type | # Households | % Households |
| Dial-Up Internet | 0 | 0.0% |
| Broadband Home | 310 | 84.2% |
| Cellular Data Only | 18 | 4.9% |
| Satellite Internet | 35 | 9.5% |
| No Internet | 33 | 9.0% |
| Total | 368 | 100.0% |
Bethlehem Summary
Bethlehem is a town located in the White Mountains region of New Hampshire, United States. It is situated in Grafton County and is bordered by the towns of Littleton, Franconia, Sugar Hill, and Easton. The town has a population of 2,526 as of the 2010 census.
History
The area that is now Bethlehem was first settled in 1765 by a group of settlers from Connecticut. The town was originally known as "Bethlehem of the Wilderness" and was incorporated in 1799. The town was named after the biblical town of Bethlehem, which is located in the West Bank.
The town was an important center for the logging industry in the 19th century. The town was also home to several mills, including a paper mill, a grist mill, and a sawmill.
Geography
Bethlehem is located in the White Mountains region of New Hampshire. The town is situated in Grafton County and is bordered by the towns of Littleton, Franconia, Sugar Hill, and Easton. The town has a total area of 33.2 square miles, of which 32.9 square miles is land and 0.3 square miles is water.
The town is located in the White Mountain National Forest and is home to several mountains, including Mount Moosilauke, Mount Lafayette, and Mount Garfield. The town is also home to the Ammonoosuc River, which flows through the town.
Economy
Bethlehem is a rural town with a small economy. The town is home to several small businesses, including restaurants, retail stores, and a few manufacturing companies. The town is also home to several tourist attractions, including the Bethlehem Heritage Society Museum, the Bethlehem Historical Society, and the Bethlehem Town Hall.
The town is also home to several ski resorts, including Cannon Mountain, Bretton Woods, and Loon Mountain. The town is also home to several golf courses, including the Bethlehem Country Club and the White Mountain Country Club.
Demographics
As of the 2010 census, there were 2,526 people, 1,072 households, and 690 families residing in the town. The population density was 76.7 people per square mile. The racial makeup of the town was 97.2% White, 0.4% African American, 0.2% Native American, 0.4% Asian, 0.2% from other races, and 1.6% from two or more races. Hispanic or Latino of any race were 0.8% of the population.
The median income for a household in the town was $45,938, and the median income for a family was $54,821. The per capita income for the town was $25,945. About 6.2% of families and 8.7% of the population were below the poverty line, including 10.2% of those under age 18 and 5.2% of those age 65 or over.
Common Questions
What is Per Capita Income in Bethlehem?
Per Capita income in Bethlehem is $30,199.
What is the Median Family Income in Bethlehem?
Median Family Income in Bethlehem is $80,329.
What is the Median Household income in Bethlehem?
Median Household Income in Bethlehem is $62,647.
What is Income or Wage Gap in Bethlehem?
Income or Wage Gap in Bethlehem is 44.1%.
Women in Bethlehem earn 55.9 cents for every dollar earned by a man.
What is Inequality or Gini Index in Bethlehem?
Inequality or Gini Index in Bethlehem is 0.41.
What is the Total Population of Bethlehem?
Total Population of Bethlehem is 957.
What is the Total Male Population of Bethlehem?
Total Male Population of Bethlehem is 402.
What is the Total Female Population of Bethlehem?
Total Female Population of Bethlehem is 555.
What is the Ratio of Males per 100 Females in Bethlehem?
There are 72.43 Males per 100 Females in Bethlehem.
What is the Ratio of Females per 100 Males in Bethlehem?
There are 138.06 Females per 100 Males in Bethlehem.
What is the Median Population Age in Bethlehem?
Median Population Age in Bethlehem is 47.1 Years.
What is the Average Family Size in Bethlehem
Average Family Size in Bethlehem is 3.2 People.
What is the Average Household Size in Bethlehem
Average Household Size in Bethlehem is 2.6 People.
How Large is the Labor Force in Bethlehem?
There are 512 People in the Labor Forcein in Bethlehem.
What is the Percentage of People in the Labor Force in Bethlehem?
63.9% of People are in the Labor Force in Bethlehem.
What is the Unemployment Rate in Bethlehem?
Unemployment Rate in Bethlehem is 1.8%.