Sanbornville, NH Map & Demographics
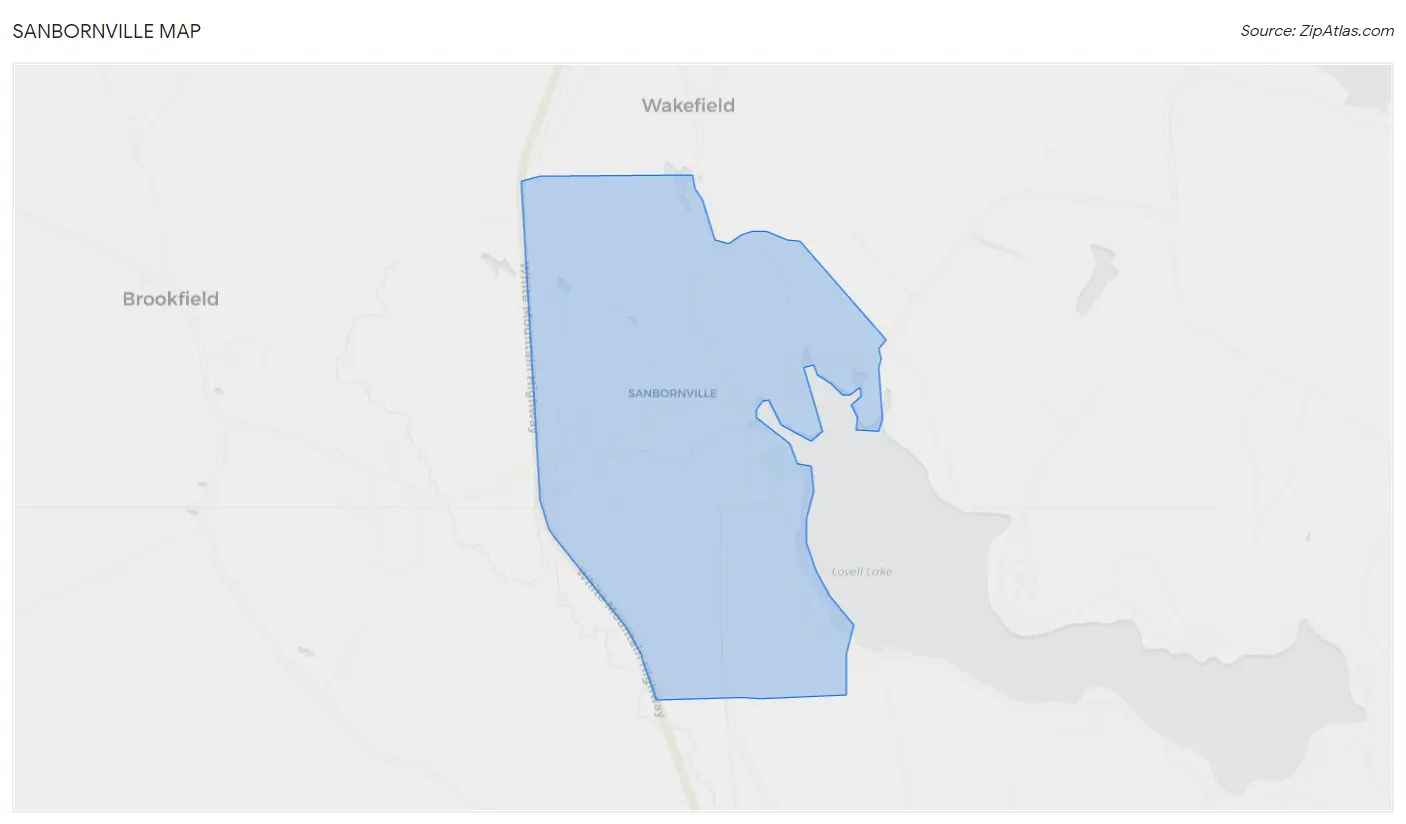
Sanbornville Map
Sanbornville Overview
$44,867
PER CAPITA INCOME
$137,750
AVG FAMILY INCOME
$133,167
AVG HOUSEHOLD INCOME
3.7%
WAGE / INCOME GAP [ % ]
96.3¢/ $1
WAGE / INCOME GAP [ $ ]
0.28
INEQUALITY / GINI INDEX
919
TOTAL POPULATION
485
MALE POPULATION
434
FEMALE POPULATION
111.75
MALES / 100 FEMALES
89.48
FEMALES / 100 MALES
55.8
MEDIAN AGE
2.2
AVG FAMILY SIZE
2.1
AVG HOUSEHOLD SIZE
525
LABOR FORCE [ PEOPLE ]
61.0%
PERCENT IN LABOR FORCE
Sanbornville Zip Codes
Sanbornville Area Codes
Income in Sanbornville
Income Overview in Sanbornville
Per Capita Income in Sanbornville is $44,867, while median incomes of families and households are $137,750 and $133,167 respectively.
| Characteristic | Number | Measure |
| Per Capita Income | 919 | $44,867 |
| Median Family Income | 383 | $137,750 |
| Mean Family Income | 383 | $109,221 |
| Median Household Income | 444 | $133,167 |
| Mean Household Income | 444 | $98,723 |
| Income Deficit | 383 | $0 |
| Wage / Income Gap (%) | 919 | 3.65% |
| Wage / Income Gap ($) | 919 | 96.35¢ per $1 |
| Gini / Inequality Index | 919 | 0.28 |
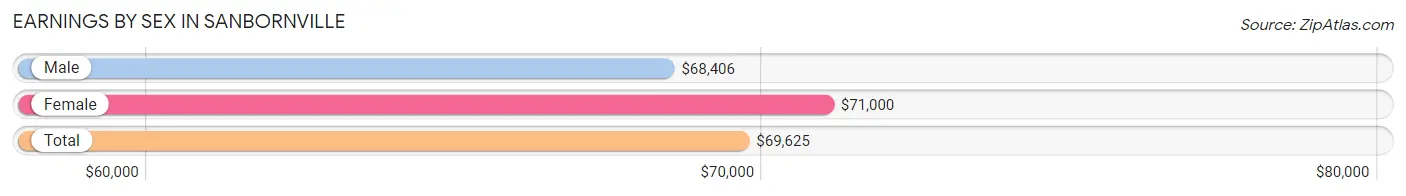
Earnings by Sex in Sanbornville
Average Earnings in Sanbornville are $69,625, $68,406 for men and $71,000 for women, a difference of 3.6%.
| Sex | Number | Average Earnings |
| Male | 284 (49.0%) | $68,406 |
| Female | 296 (51.0%) | $71,000 |
| Total | 580 (100.0%) | $69,625 |
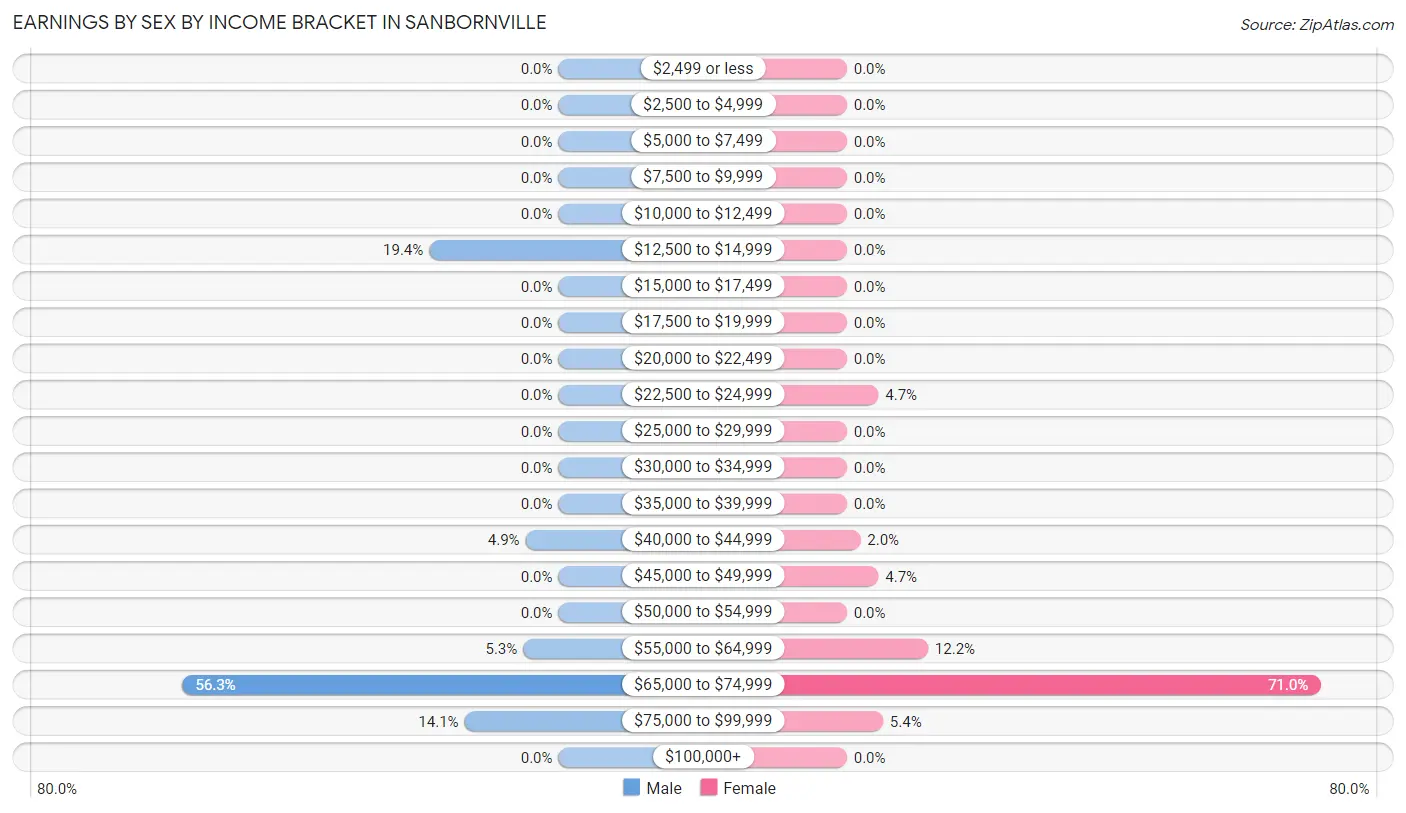
Earnings by Sex by Income Bracket in Sanbornville
The most common earnings brackets in Sanbornville are $65,000 to $74,999 for men (160 | 56.3%) and $65,000 to $74,999 for women (210 | 71.0%).
| Income | Male | Female |
| $2,499 or less | 0 (0.0%) | 0 (0.0%) |
| $2,500 to $4,999 | 0 (0.0%) | 0 (0.0%) |
| $5,000 to $7,499 | 0 (0.0%) | 0 (0.0%) |
| $7,500 to $9,999 | 0 (0.0%) | 0 (0.0%) |
| $10,000 to $12,499 | 0 (0.0%) | 0 (0.0%) |
| $12,500 to $14,999 | 55 (19.4%) | 0 (0.0%) |
| $15,000 to $17,499 | 0 (0.0%) | 0 (0.0%) |
| $17,500 to $19,999 | 0 (0.0%) | 0 (0.0%) |
| $20,000 to $22,499 | 0 (0.0%) | 0 (0.0%) |
| $22,500 to $24,999 | 0 (0.0%) | 14 (4.7%) |
| $25,000 to $29,999 | 0 (0.0%) | 0 (0.0%) |
| $30,000 to $34,999 | 0 (0.0%) | 0 (0.0%) |
| $35,000 to $39,999 | 0 (0.0%) | 0 (0.0%) |
| $40,000 to $44,999 | 14 (4.9%) | 6 (2.0%) |
| $45,000 to $49,999 | 0 (0.0%) | 14 (4.7%) |
| $50,000 to $54,999 | 0 (0.0%) | 0 (0.0%) |
| $55,000 to $64,999 | 15 (5.3%) | 36 (12.2%) |
| $65,000 to $74,999 | 160 (56.3%) | 210 (71.0%) |
| $75,000 to $99,999 | 40 (14.1%) | 16 (5.4%) |
| $100,000+ | 0 (0.0%) | 0 (0.0%) |
| Total | 284 (100.0%) | 296 (100.0%) |
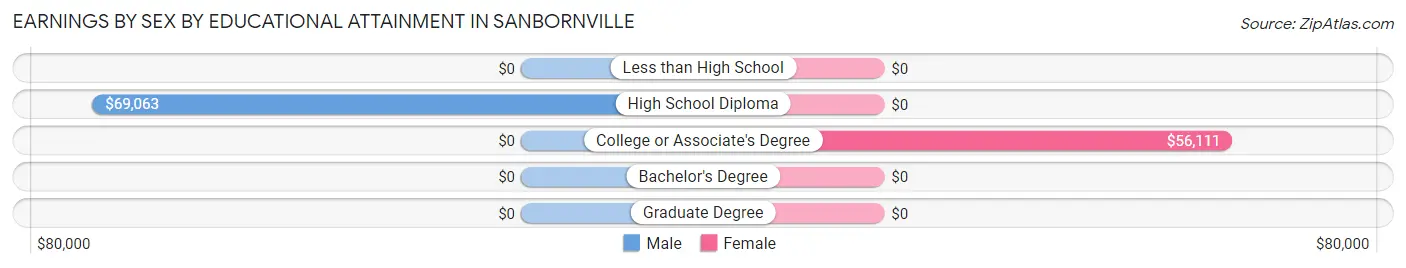
Earnings by Sex by Educational Attainment in Sanbornville
Average earnings in Sanbornville are $68,836 for men and $71,000 for women, a difference of 3.0%. Men with an educational attainment of high school diploma enjoy the highest average annual earnings of $69,063, while those with high school diploma education earn the least with $69,063. Women with an educational attainment of college or associate's degree earn the most with the average annual earnings of $56,111, while those with college or associate's degree education have the smallest earnings of $56,111.
| Educational Attainment | Male Income | Female Income |
| Less than High School | - | - |
| High School Diploma | $69,063 | $0 |
| College or Associate's Degree | - | - |
| Bachelor's Degree | - | - |
| Graduate Degree | - | - |
| Total | $68,836 | $71,000 |
Family Income in Sanbornville
Family Income Brackets in Sanbornville
According to the Sanbornville family income data, there are 260 families falling into the $100,000 to $149,999 income range, which is the most common income bracket and makes up 67.9% of all families.
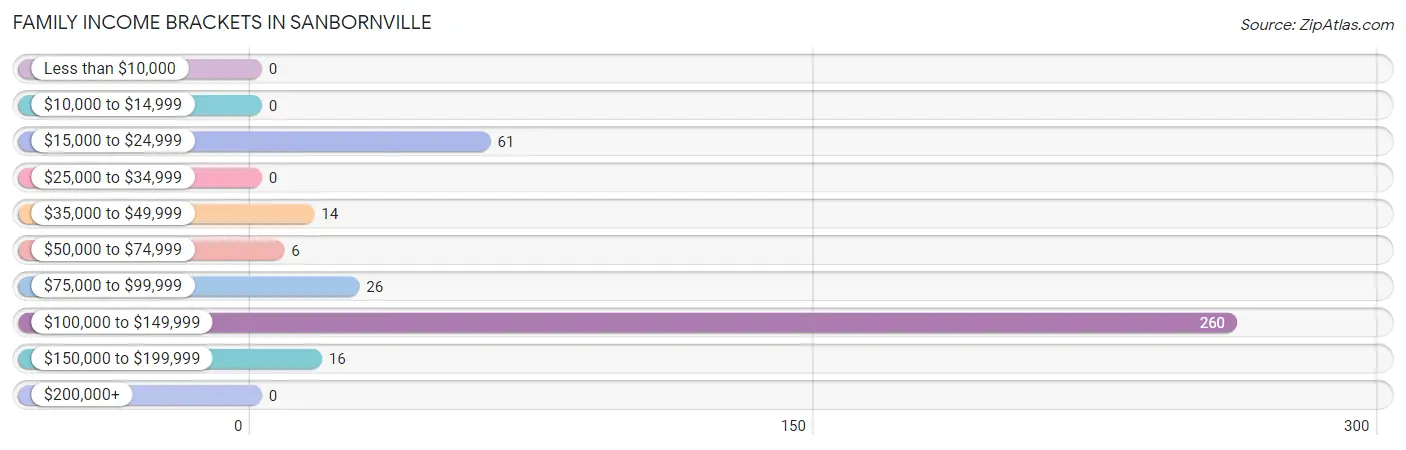
| Income Bracket | # Families | % Families |
| Less than $10,000 | 0 | 0.0% |
| $10,000 to $14,999 | 0 | 0.0% |
| $15,000 to $24,999 | 61 | 15.9% |
| $25,000 to $34,999 | 0 | 0.0% |
| $35,000 to $49,999 | 14 | 3.7% |
| $50,000 to $74,999 | 6 | 1.6% |
| $75,000 to $99,999 | 26 | 6.8% |
| $100,000 to $149,999 | 260 | 67.9% |
| $150,000 to $199,999 | 16 | 4.2% |
| $200,000+ | 0 | 0.0% |
Family Income by Famaliy Size in Sanbornville
2-person families (302 | 78.8%) account for the highest median family income in Sanbornville with $138,269 per family, while 2-person families (302 | 78.8%) have the highest median income of $69,134 per family member.
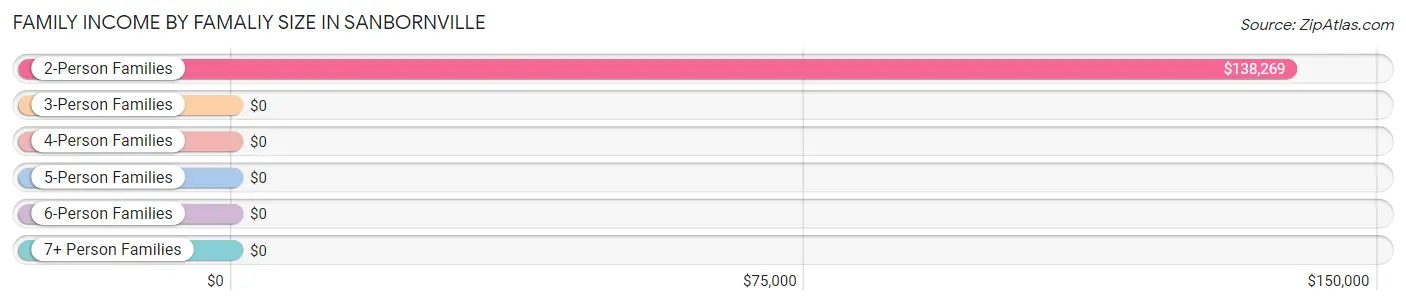
| Income Bracket | # Families | Median Income |
| 2-Person Families | 302 (78.8%) | $138,269 |
| 3-Person Families | 75 (19.6%) | $0 |
| 4-Person Families | 6 (1.6%) | $0 |
| 5-Person Families | 0 (0.0%) | $0 |
| 6-Person Families | 0 (0.0%) | $0 |
| 7+ Person Families | 0 (0.0%) | $0 |
| Total | 383 (100.0%) | $137,750 |
Family Income by Number of Earners in Sanbornville
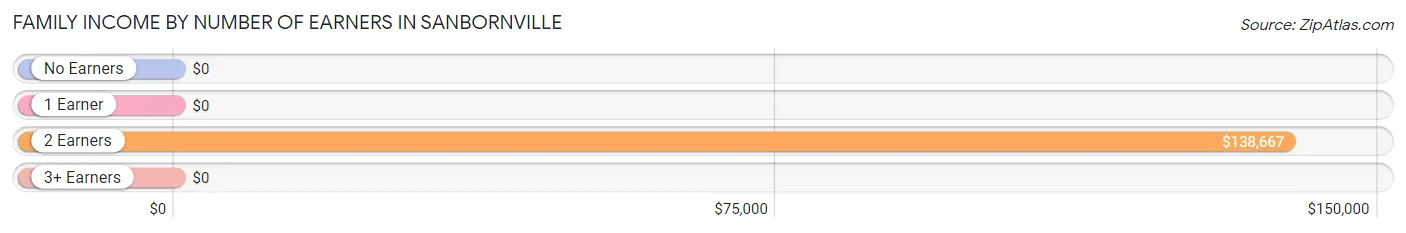
| Number of Earners | # Families | Median Income |
| No Earners | 0 (0.0%) | $0 |
| 1 Earner | 143 (37.3%) | $0 |
| 2 Earners | 240 (62.7%) | $138,667 |
| 3+ Earners | 0 (0.0%) | $0 |
| Total | 383 (100.0%) | $137,750 |
Household Income in Sanbornville
Household Income Brackets in Sanbornville
With 260 households falling in the category, the $100,000 to $149,999 income range is the most frequent in Sanbornville, accounting for 58.6% of all households.
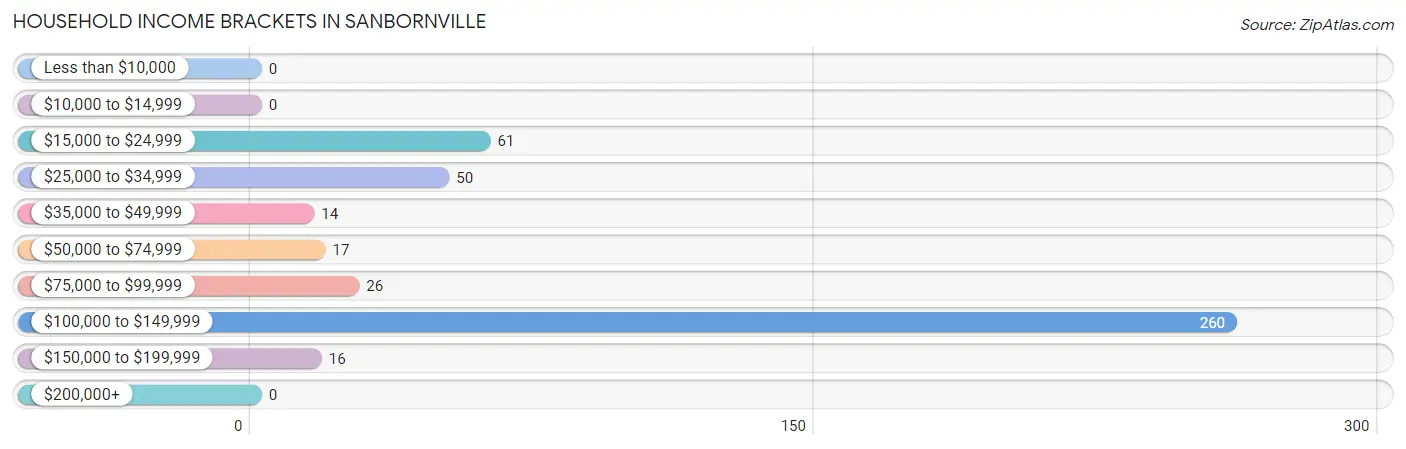
| Income Bracket | # Households | % Households |
| Less than $10,000 | 0 | 0.0% |
| $10,000 to $14,999 | 0 | 0.0% |
| $15,000 to $24,999 | 61 | 13.7% |
| $25,000 to $34,999 | 50 | 11.3% |
| $35,000 to $49,999 | 14 | 3.2% |
| $50,000 to $74,999 | 17 | 3.8% |
| $75,000 to $99,999 | 26 | 5.9% |
| $100,000 to $149,999 | 260 | 58.6% |
| $150,000 to $199,999 | 16 | 3.6% |
| $200,000+ | 0 | 0.0% |
Household Income by Householder Age in Sanbornville
The median household income in Sanbornville is $133,167, with the highest median household income of $138,590 found in the 45 to 64 years age bracket for the primary householder. A total of 252 households (56.8%) fall into this category.
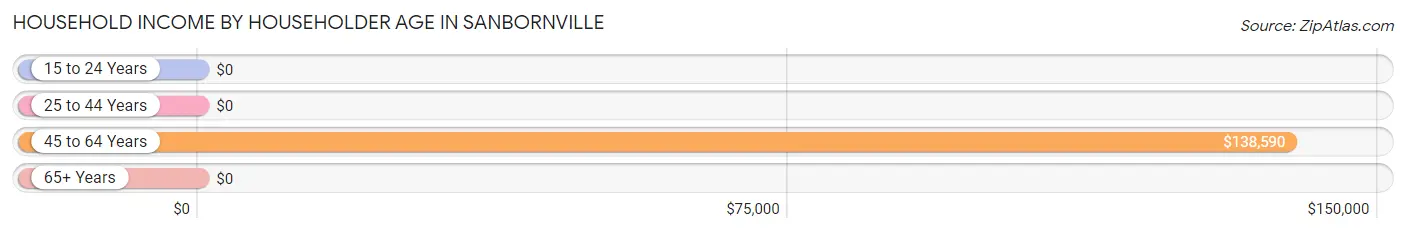
| Income Bracket | # Households | Median Income |
| 15 to 24 Years | 0 (0.0%) | $0 |
| 25 to 44 Years | 34 (7.7%) | $0 |
| 45 to 64 Years | 252 (56.8%) | $138,590 |
| 65+ Years | 158 (35.6%) | $0 |
| Total | 444 (100.0%) | $133,167 |
Poverty in Sanbornville
Income Below Poverty by Sex and Age in Sanbornville
With 23.9% poverty level for males and 17.7% for females among the residents of Sanbornville, 16 and 17 year old males and 35 to 44 year old females are the most vulnerable to poverty, with 55 males (100.0%) and 77 females (76.2%) in their respective age groups living below the poverty level.
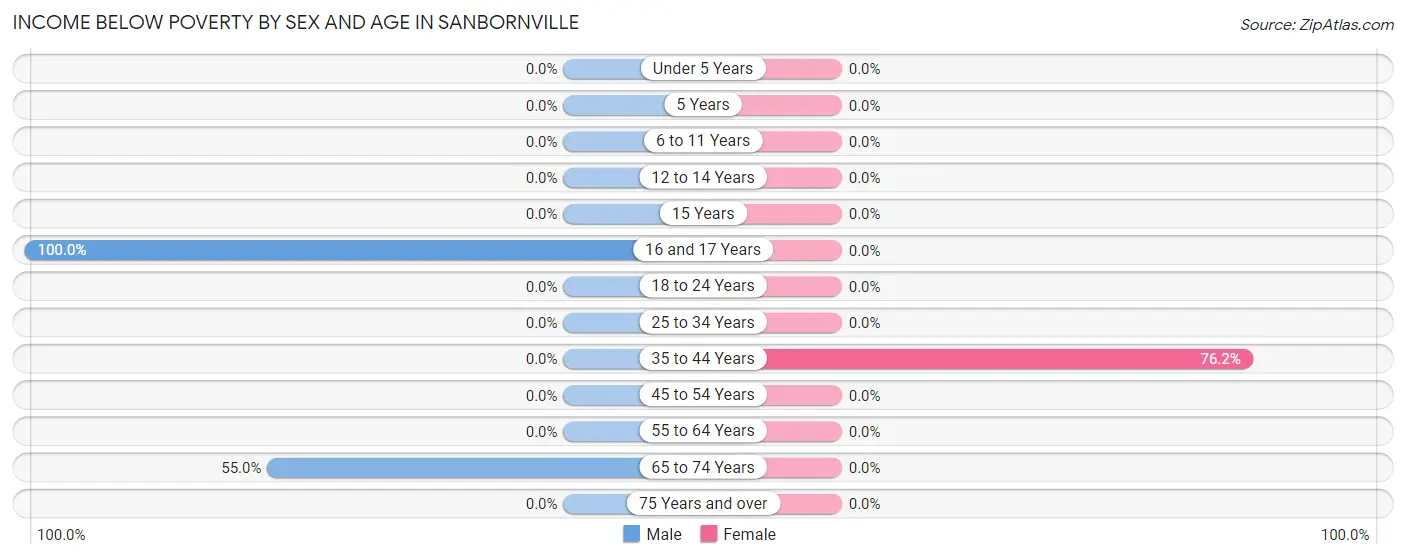
| Age Bracket | Male | Female |
| Under 5 Years | 0 (0.0%) | 0 (0.0%) |
| 5 Years | 0 (0.0%) | 0 (0.0%) |
| 6 to 11 Years | 0 (0.0%) | 0 (0.0%) |
| 12 to 14 Years | 0 (0.0%) | 0 (0.0%) |
| 15 Years | 0 (0.0%) | 0 (0.0%) |
| 16 and 17 Years | 55 (100.0%) | 0 (0.0%) |
| 18 to 24 Years | 0 (0.0%) | 0 (0.0%) |
| 25 to 34 Years | 0 (0.0%) | 0 (0.0%) |
| 35 to 44 Years | 0 (0.0%) | 77 (76.2%) |
| 45 to 54 Years | 0 (0.0%) | 0 (0.0%) |
| 55 to 64 Years | 0 (0.0%) | 0 (0.0%) |
| 65 to 74 Years | 61 (54.9%) | 0 (0.0%) |
| 75 Years and over | 0 (0.0%) | 0 (0.0%) |
| Total | 116 (23.9%) | 77 (17.7%) |
Income Above Poverty by Sex and Age in Sanbornville
According to the poverty statistics in Sanbornville, males aged 6 to 11 years and females aged under 5 years are the age groups that are most secure financially, with 100.0% of males and 100.0% of females in these age groups living above the poverty line.
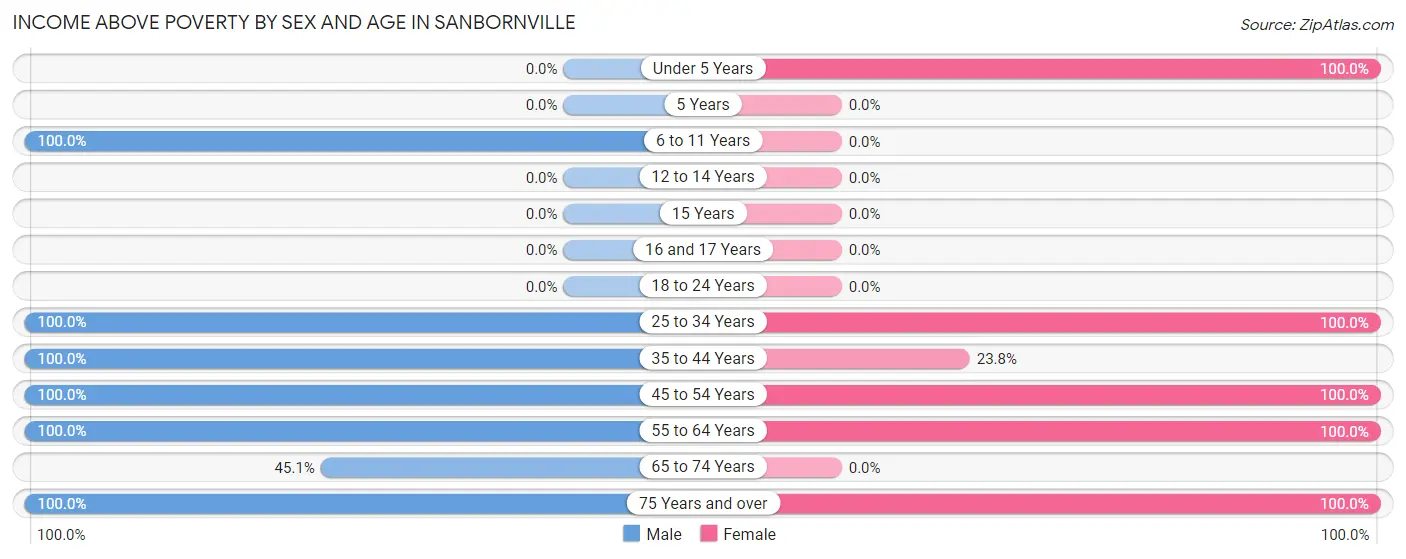
| Age Bracket | Male | Female |
| Under 5 Years | 0 (0.0%) | 32 (100.0%) |
| 5 Years | 0 (0.0%) | 0 (0.0%) |
| 6 to 11 Years | 27 (100.0%) | 0 (0.0%) |
| 12 to 14 Years | 0 (0.0%) | 0 (0.0%) |
| 15 Years | 0 (0.0%) | 0 (0.0%) |
| 16 and 17 Years | 0 (0.0%) | 0 (0.0%) |
| 18 to 24 Years | 0 (0.0%) | 0 (0.0%) |
| 25 to 34 Years | 15 (100.0%) | 28 (100.0%) |
| 35 to 44 Years | 29 (100.0%) | 24 (23.8%) |
| 45 to 54 Years | 26 (100.0%) | 16 (100.0%) |
| 55 to 64 Years | 188 (100.0%) | 210 (100.0%) |
| 65 to 74 Years | 50 (45.1%) | 0 (0.0%) |
| 75 Years and over | 34 (100.0%) | 47 (100.0%) |
| Total | 369 (76.1%) | 357 (82.3%) |
Income Below Poverty Among Married-Couple Families in Sanbornville
The poverty statistics for married-couple families in Sanbornville show that 15.9% or 61 of the total 383 families live below the poverty line. Families with 1 or 2 children have the highest poverty rate of 75.3%, comprising of 61 families. On the other hand, families with no children have the lowest poverty rate of 0.0%, which includes 0 families.
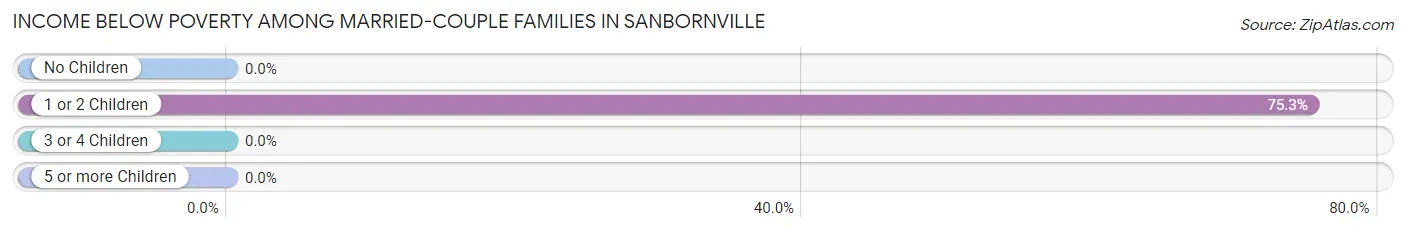
| Children | Above Poverty | Below Poverty |
| No Children | 302 (100.0%) | 0 (0.0%) |
| 1 or 2 Children | 20 (24.7%) | 61 (75.3%) |
| 3 or 4 Children | 0 (0.0%) | 0 (0.0%) |
| 5 or more Children | 0 (0.0%) | 0 (0.0%) |
| Total | 322 (84.1%) | 61 (15.9%) |
Income Below Poverty Among Single-Parent Households in Sanbornville
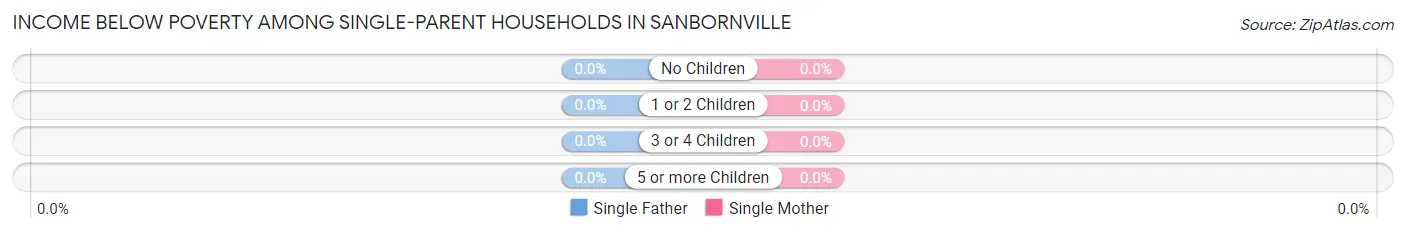
| Children | Single Father | Single Mother |
| No Children | 0 (0.0%) | 0 (0.0%) |
| 1 or 2 Children | 0 (0.0%) | 0 (0.0%) |
| 3 or 4 Children | 0 (0.0%) | 0 (0.0%) |
| 5 or more Children | 0 (0.0%) | 0 (0.0%) |
| Total | 0 (0.0%) | 0 (0.0%) |
Income Below Poverty Among Married-Couple vs Single-Parent Households in Sanbornville
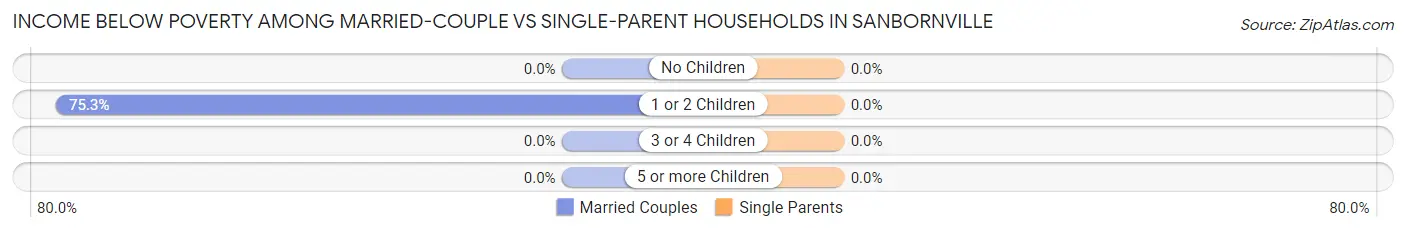
| Children | Married-Couple Families | Single-Parent Households |
| No Children | 0 (0.0%) | 0 (0.0%) |
| 1 or 2 Children | 61 (75.3%) | 0 (0.0%) |
| 3 or 4 Children | 0 (0.0%) | 0 (0.0%) |
| 5 or more Children | 0 (0.0%) | 0 (0.0%) |
| Total | 61 (15.9%) | 0 (0.0%) |
Race in Sanbornville
The most populous races in Sanbornville are White / Caucasian (804 | 87.5%), Hispanic or Latino (77 | 8.4%), and Native / Alaskan (77 | 8.4%).
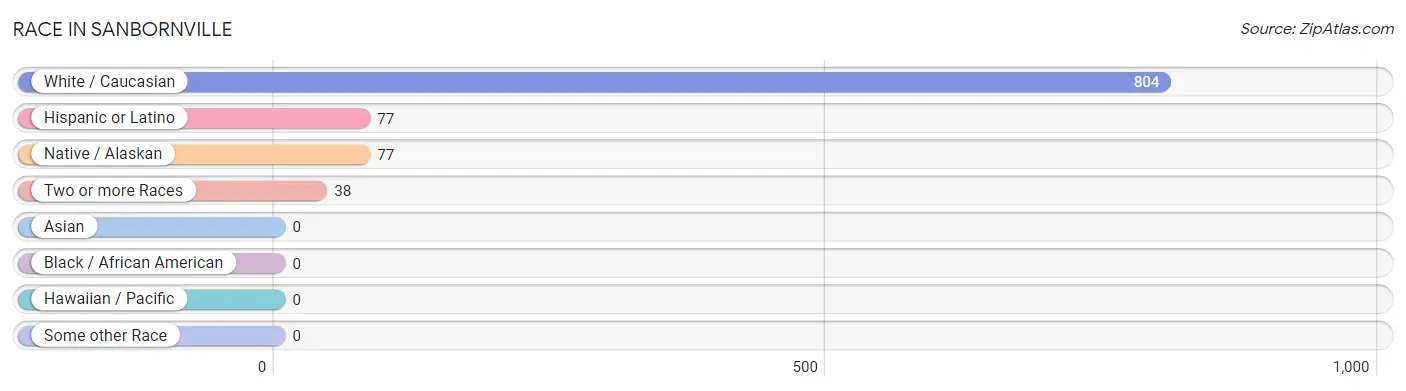
| Race | # Population | % Population |
| Asian | 0 | 0.0% |
| Black / African American | 0 | 0.0% |
| Hawaiian / Pacific | 0 | 0.0% |
| Hispanic or Latino | 77 | 8.4% |
| Native / Alaskan | 77 | 8.4% |
| White / Caucasian | 804 | 87.5% |
| Two or more Races | 38 | 4.1% |
| Some other Race | 0 | 0.0% |
| Total | 919 | 100.0% |
Ancestry in Sanbornville
The most populous ancestries reported in Sanbornville are Italian (480 | 52.2%), English (220 | 23.9%), German (210 | 22.9%), French (83 | 9.0%), and French Canadian (80 | 8.7%), together accounting for 116.8% of all Sanbornville residents.
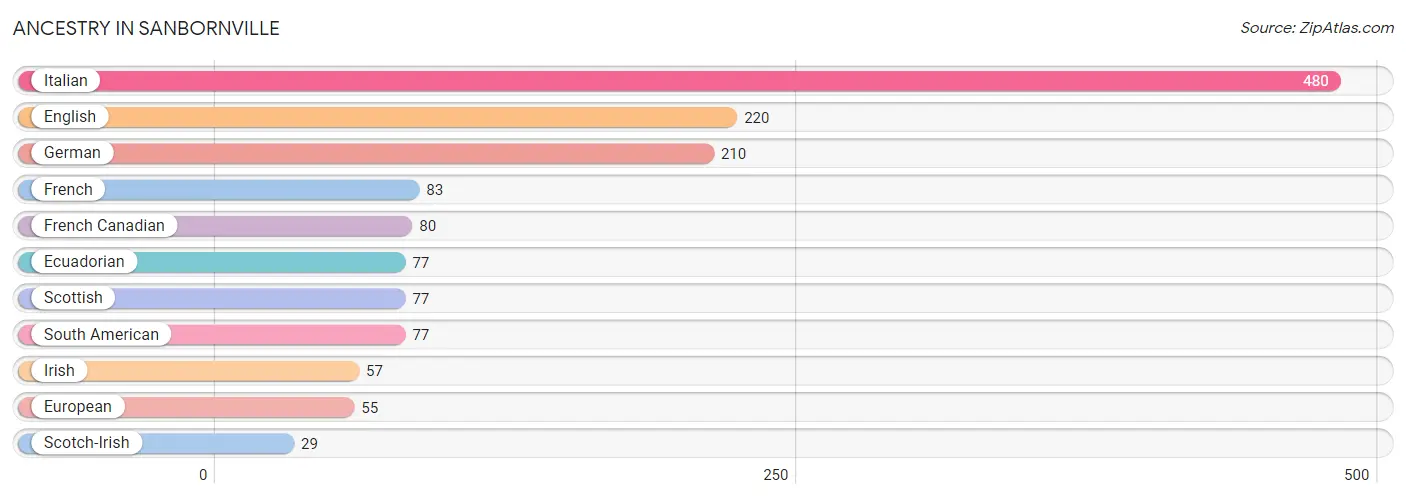
| Ancestry | # Population | % Population |
| Ecuadorian | 77 | 8.4% |
| English | 220 | 23.9% |
| European | 55 | 6.0% |
| French | 83 | 9.0% |
| French Canadian | 80 | 8.7% |
| German | 210 | 22.9% |
| Irish | 57 | 6.2% |
| Italian | 480 | 52.2% |
| Scotch-Irish | 29 | 3.2% |
| Scottish | 77 | 8.4% |
| South American | 77 | 8.4% | View All 11 Rows |
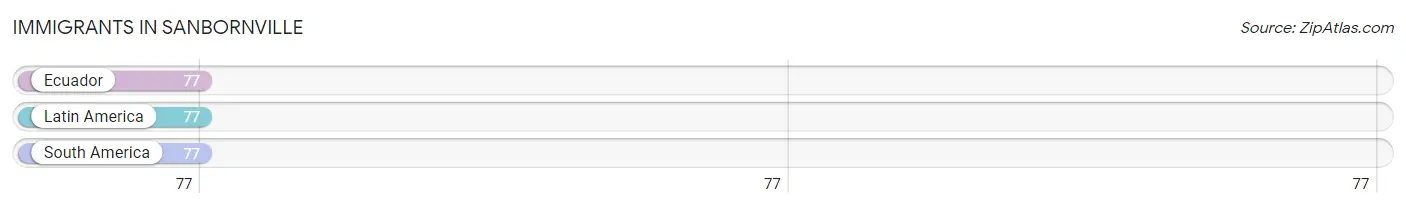
Immigrants in Sanbornville
The most numerous immigrant groups reported in Sanbornville came from Ecuador (77 | 8.4%), Latin America (77 | 8.4%), and South America (77 | 8.4%), together accounting for 25.1% of all Sanbornville residents.
| Immigration Origin | # Population | % Population |
| Ecuador | 77 | 8.4% |
| Latin America | 77 | 8.4% |
| South America | 77 | 8.4% | View All 3 Rows |
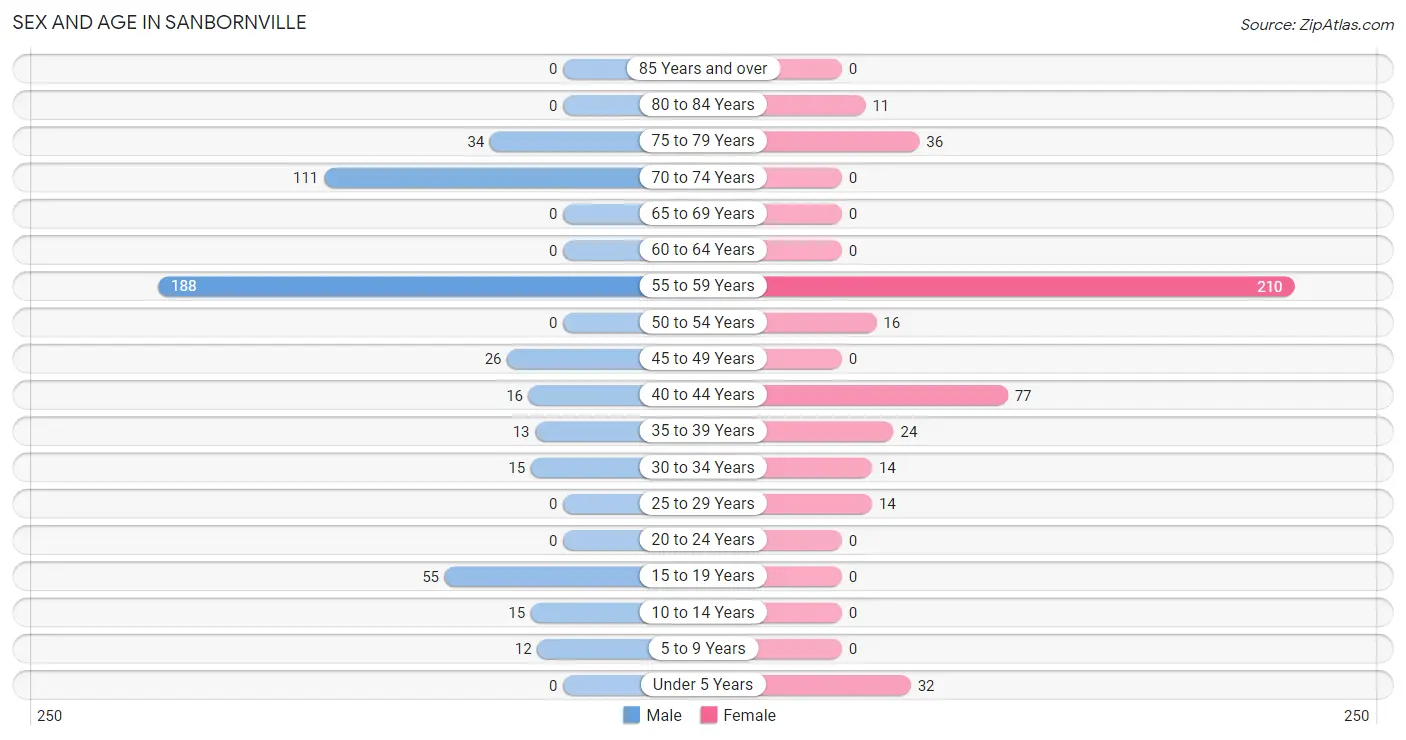
Sex and Age in Sanbornville
Sex and Age in Sanbornville
The most populous age groups in Sanbornville are 55 to 59 Years (188 | 38.8%) for men and 55 to 59 Years (210 | 48.4%) for women.
| Age Bracket | Male | Female |
| Under 5 Years | 0 (0.0%) | 32 (7.4%) |
| 5 to 9 Years | 12 (2.5%) | 0 (0.0%) |
| 10 to 14 Years | 15 (3.1%) | 0 (0.0%) |
| 15 to 19 Years | 55 (11.3%) | 0 (0.0%) |
| 20 to 24 Years | 0 (0.0%) | 0 (0.0%) |
| 25 to 29 Years | 0 (0.0%) | 14 (3.2%) |
| 30 to 34 Years | 15 (3.1%) | 14 (3.2%) |
| 35 to 39 Years | 13 (2.7%) | 24 (5.5%) |
| 40 to 44 Years | 16 (3.3%) | 77 (17.7%) |
| 45 to 49 Years | 26 (5.4%) | 0 (0.0%) |
| 50 to 54 Years | 0 (0.0%) | 16 (3.7%) |
| 55 to 59 Years | 188 (38.8%) | 210 (48.4%) |
| 60 to 64 Years | 0 (0.0%) | 0 (0.0%) |
| 65 to 69 Years | 0 (0.0%) | 0 (0.0%) |
| 70 to 74 Years | 111 (22.9%) | 0 (0.0%) |
| 75 to 79 Years | 34 (7.0%) | 36 (8.3%) |
| 80 to 84 Years | 0 (0.0%) | 11 (2.5%) |
| 85 Years and over | 0 (0.0%) | 0 (0.0%) |
| Total | 485 (100.0%) | 434 (100.0%) |
Families and Households in Sanbornville
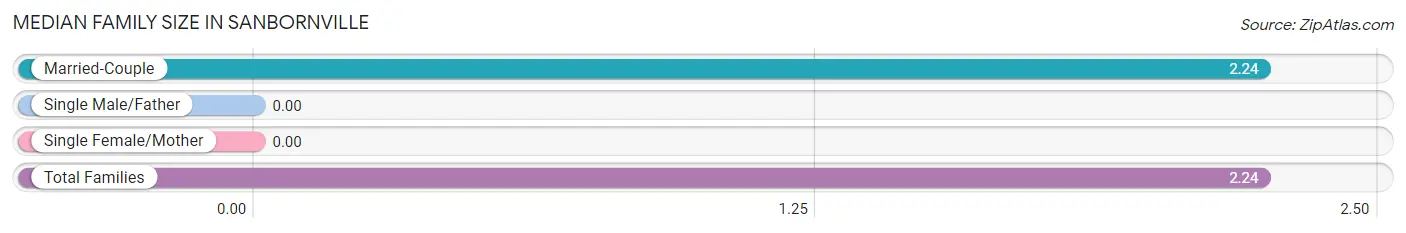
Median Family Size in Sanbornville
| Family Type | # Families | Family Size |
| Married-Couple | 383 (100.0%) | 2.24 |
| Single Male/Father | 0 (0.0%) | - |
| Single Female/Mother | 0 (0.0%) | - |
| Total Families | 383 (100.0%) | 2.24 |
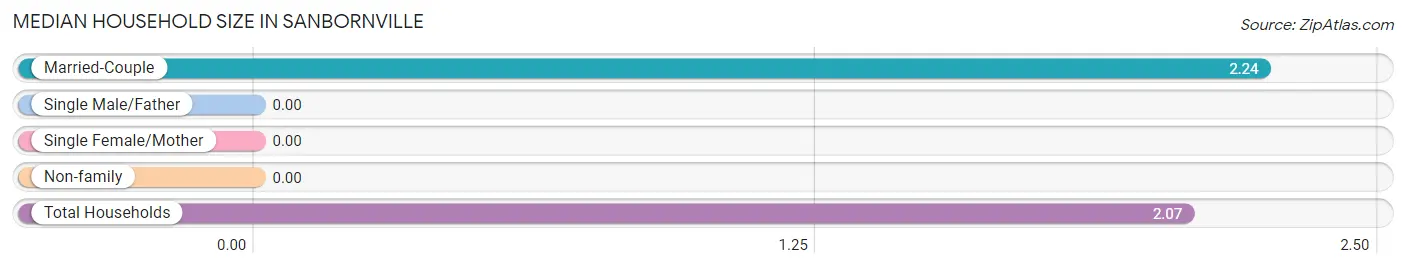
Median Household Size in Sanbornville
| Household Type | # Households | Household Size |
| Married-Couple | 383 (86.3%) | 2.24 |
| Single Male/Father | 0 (0.0%) | - |
| Single Female/Mother | 0 (0.0%) | - |
| Non-family | 61 (13.7%) | - |
| Total Households | 444 (100.0%) | 2.07 |
Household Size by Marriage Status in Sanbornville
Out of a total of 444 households in Sanbornville, 383 (86.3%) are family households, while 61 (13.7%) are nonfamily households. The most numerous type of family households are 2-person households, comprising 302, and the most common type of nonfamily households are 1-person households, comprising 61.
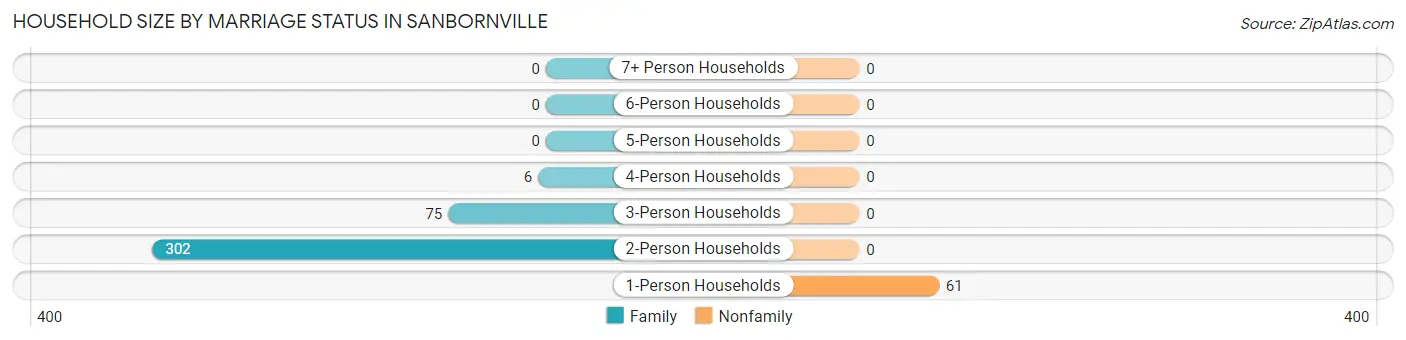
| Household Size | Family Households | Nonfamily Households |
| 1-Person Households | - | 61 (13.7%) |
| 2-Person Households | 302 (68.0%) | 0 (0.0%) |
| 3-Person Households | 75 (16.9%) | 0 (0.0%) |
| 4-Person Households | 6 (1.3%) | 0 (0.0%) |
| 5-Person Households | 0 (0.0%) | 0 (0.0%) |
| 6-Person Households | 0 (0.0%) | 0 (0.0%) |
| 7+ Person Households | 0 (0.0%) | 0 (0.0%) |
| Total | 383 (86.3%) | 61 (13.7%) |
Female Fertility in Sanbornville
Fertility by Age in Sanbornville
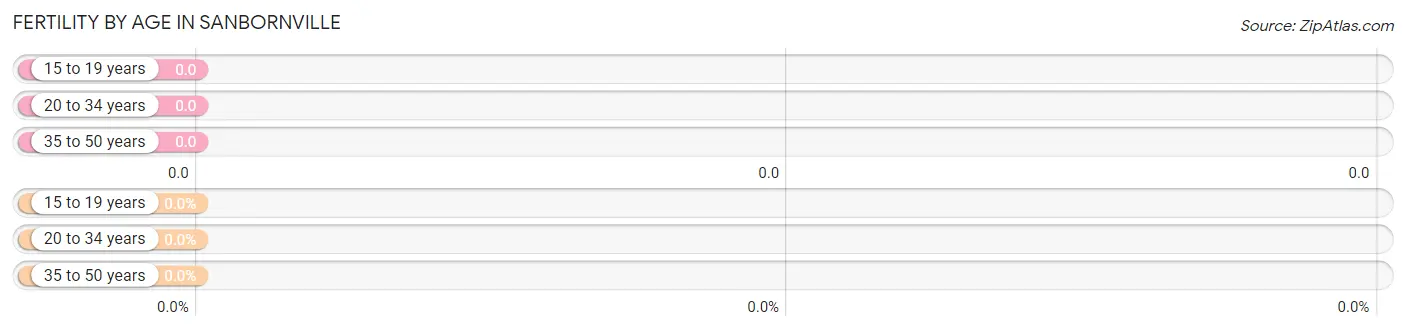
| Age Bracket | Women with Births | Births / 1,000 Women |
| 15 to 19 years | 0 (0.0%) | 0.0 |
| 20 to 34 years | 0 (0.0%) | 0.0 |
| 35 to 50 years | 0 (0.0%) | 0.0 |
| Total | 0 (0.0%) | 0.0 |
Fertility by Age by Marriage Status in Sanbornville
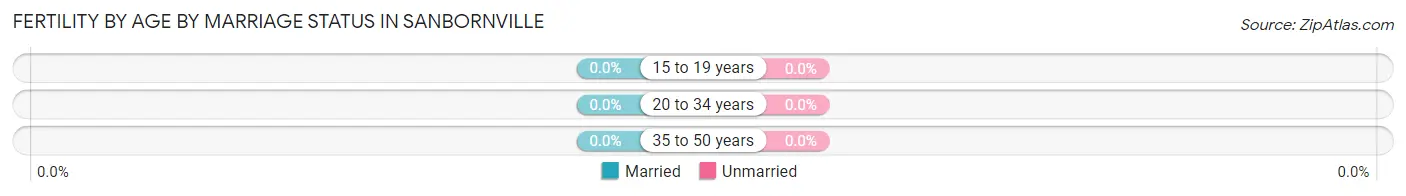
| Age Bracket | Married | Unmarried |
| 15 to 19 years | 0 (0.0%) | 0 (0.0%) |
| 20 to 34 years | 0 (0.0%) | 0 (0.0%) |
| 35 to 50 years | 0 (0.0%) | 0 (0.0%) |
| Total | 0 (0.0%) | 0 (0.0%) |
Fertility by Education in Sanbornville
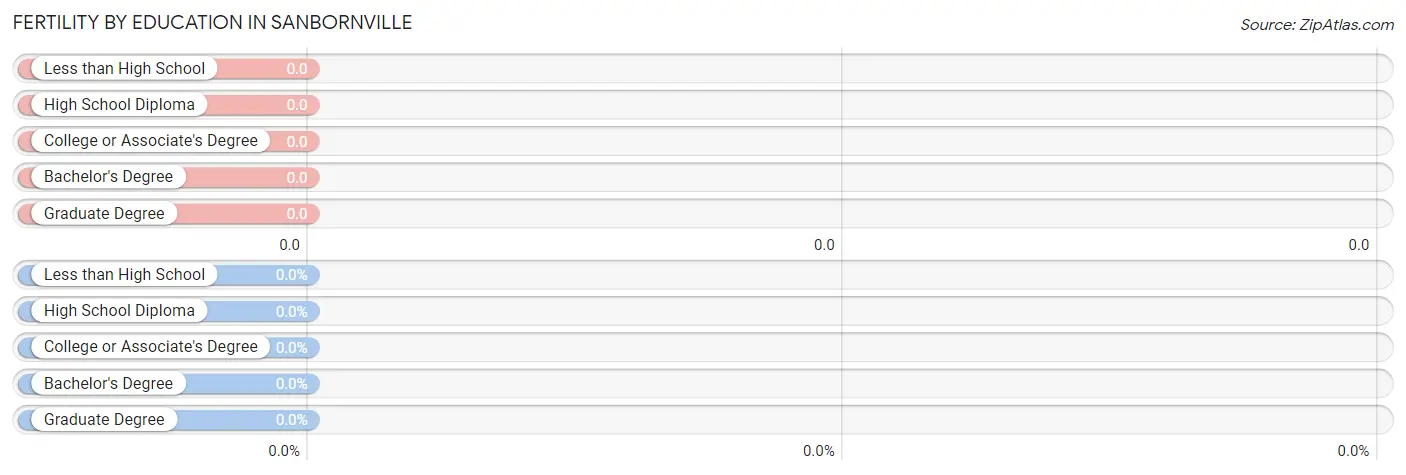
| Educational Attainment | Women with Births | Births / 1,000 Women |
| Less than High School | 0 (0.0%) | 0.0 |
| High School Diploma | 0 (0.0%) | 0.0 |
| College or Associate's Degree | 0 (0.0%) | 0.0 |
| Bachelor's Degree | 0 (0.0%) | 0.0 |
| Graduate Degree | 0 (0.0%) | 0.0 |
| Total | 0 (0.0%) | 0.0 |
Fertility by Education by Marriage Status in Sanbornville
| Educational Attainment | Married | Unmarried |
| Less than High School | 0 (0.0%) | 0 (0.0%) |
| High School Diploma | 0 (0.0%) | 0 (0.0%) |
| College or Associate's Degree | 0 (0.0%) | 0 (0.0%) |
| Bachelor's Degree | 0 (0.0%) | 0 (0.0%) |
| Graduate Degree | 0 (0.0%) | 0 (0.0%) |
| Total | 0 (0.0%) | 0 (0.0%) |
Employment Characteristics in Sanbornville
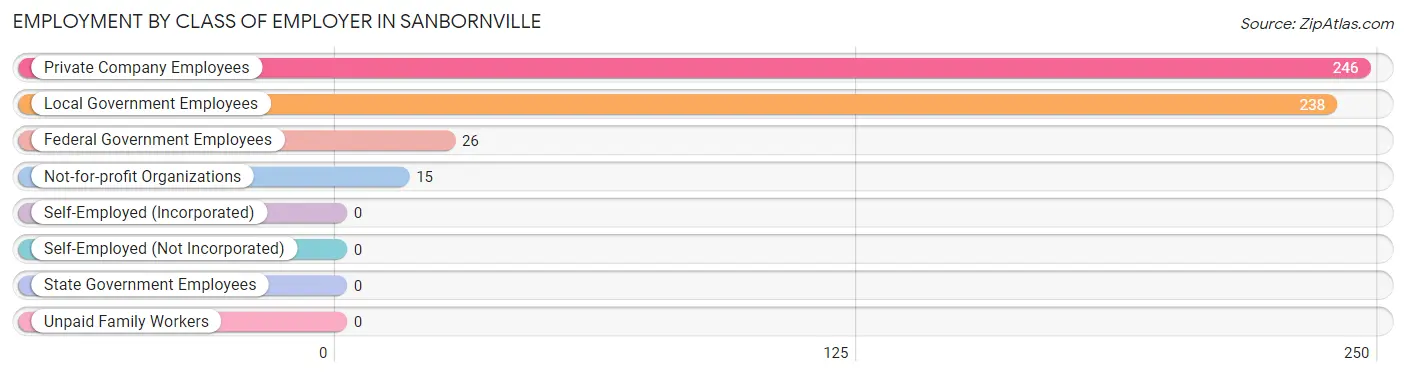
Employment by Class of Employer in Sanbornville
Among the 525 employed individuals in Sanbornville, private company employees (246 | 46.9%), local government employees (238 | 45.3%), and federal government employees (26 | 5.0%) make up the most common classes of employment.
| Employer Class | # Employees | % Employees |
| Private Company Employees | 246 | 46.9% |
| Self-Employed (Incorporated) | 0 | 0.0% |
| Self-Employed (Not Incorporated) | 0 | 0.0% |
| Not-for-profit Organizations | 15 | 2.9% |
| Local Government Employees | 238 | 45.3% |
| State Government Employees | 0 | 0.0% |
| Federal Government Employees | 26 | 5.0% |
| Unpaid Family Workers | 0 | 0.0% |
| Total | 525 | 100.0% |
Employment Status by Age in Sanbornville
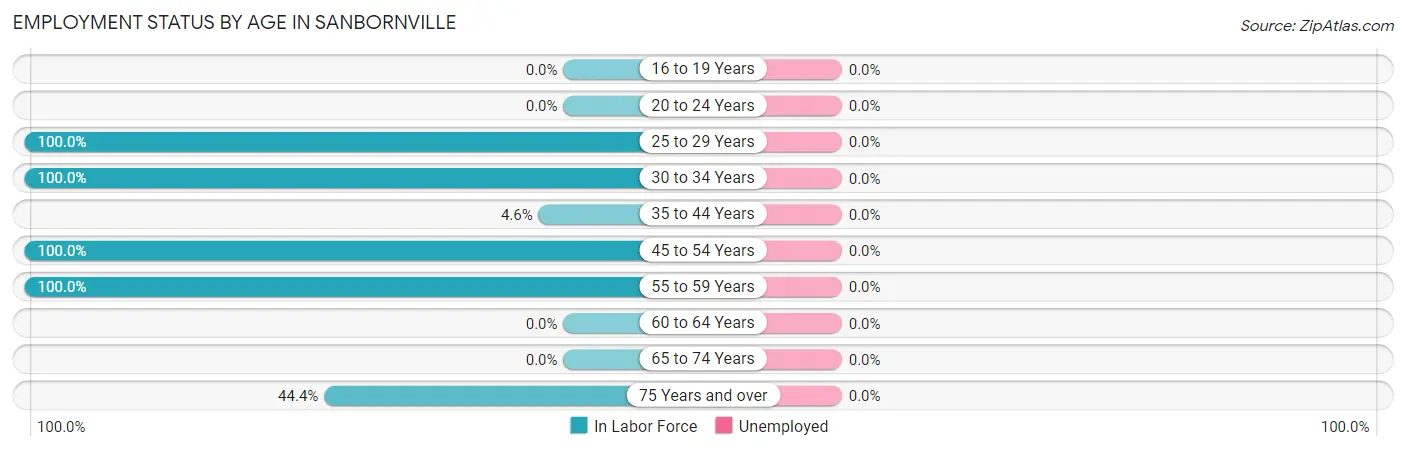
| Age Bracket | In Labor Force | Unemployed |
| 16 to 19 Years | 0 (0.0%) | 0 (0.0%) |
| 20 to 24 Years | 0 (0.0%) | 0 (0.0%) |
| 25 to 29 Years | 14 (100.0%) | 0 (0.0%) |
| 30 to 34 Years | 29 (100.0%) | 0 (0.0%) |
| 35 to 44 Years | 6 (4.6%) | 0 (0.0%) |
| 45 to 54 Years | 42 (100.0%) | 0 (0.0%) |
| 55 to 59 Years | 398 (100.0%) | 0 (0.0%) |
| 60 to 64 Years | 0 (0.0%) | 0 (0.0%) |
| 65 to 74 Years | 0 (0.0%) | 0 (0.0%) |
| 75 Years and over | 36 (44.4%) | 0 (0.0%) |
| Total | 525 (61.0%) | 0 (0.0%) |
Employment Status by Educational Attainment in Sanbornville
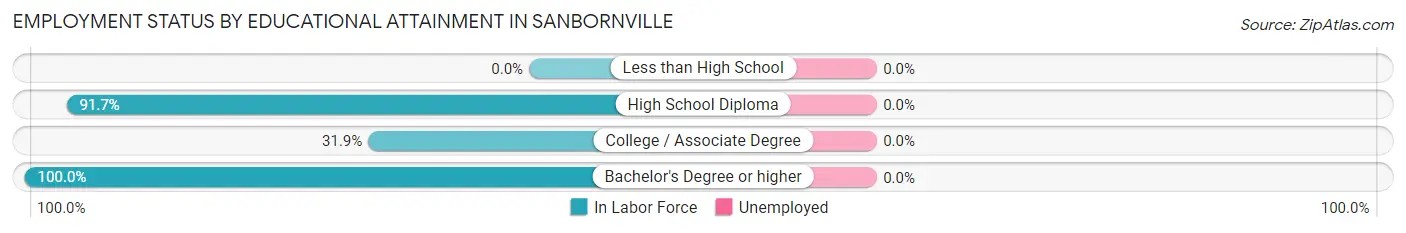
| Educational Attainment | In Labor Force | Unemployed |
| Less than High School | 0 (0.0%) | 0 (0.0%) |
| High School Diploma | 200 (91.7%) | 0 (0.0%) |
| College / Associate Degree | 36 (31.9%) | 0 (0.0%) |
| Bachelor's Degree or higher | 253 (100.0%) | 0 (0.0%) |
| Total | 489 (79.8%) | 0 (0.0%) |
Employment Occupations by Sex in Sanbornville
Management, Business, Science and Arts Occupations
The most common Management, Business, Science and Arts occupations in Sanbornville are Community & Social Service (224 | 42.7%), Education Instruction & Library (224 | 42.7%), and Management (30 | 5.7%).
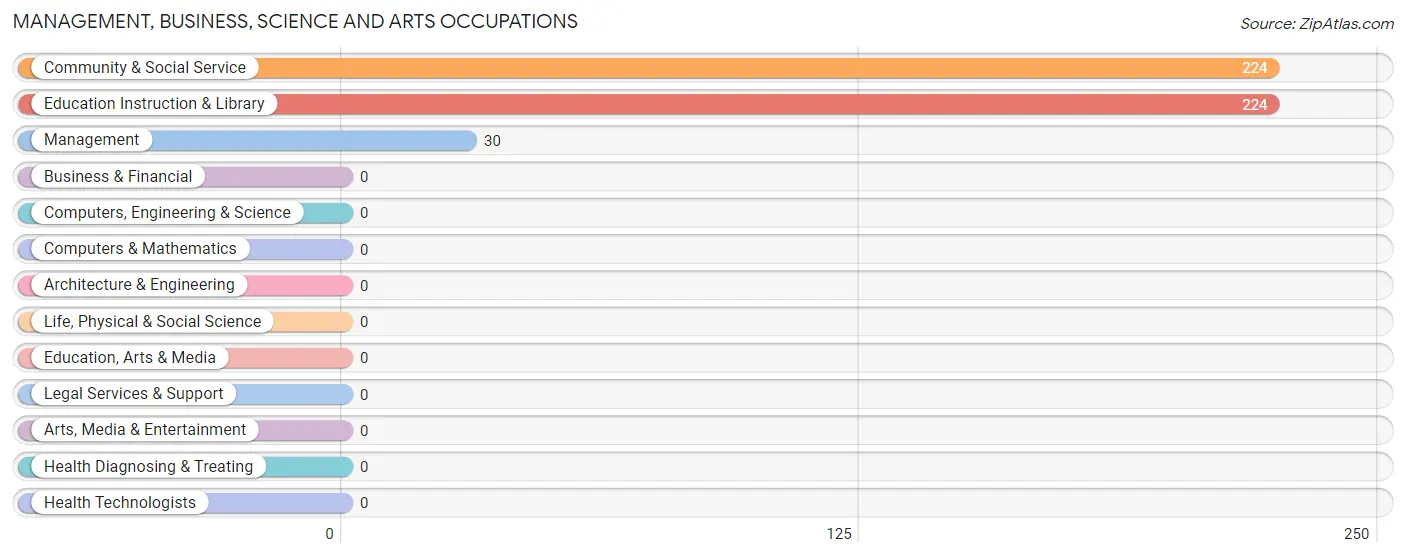
Management, Business, Science and Arts Occupations by Sex
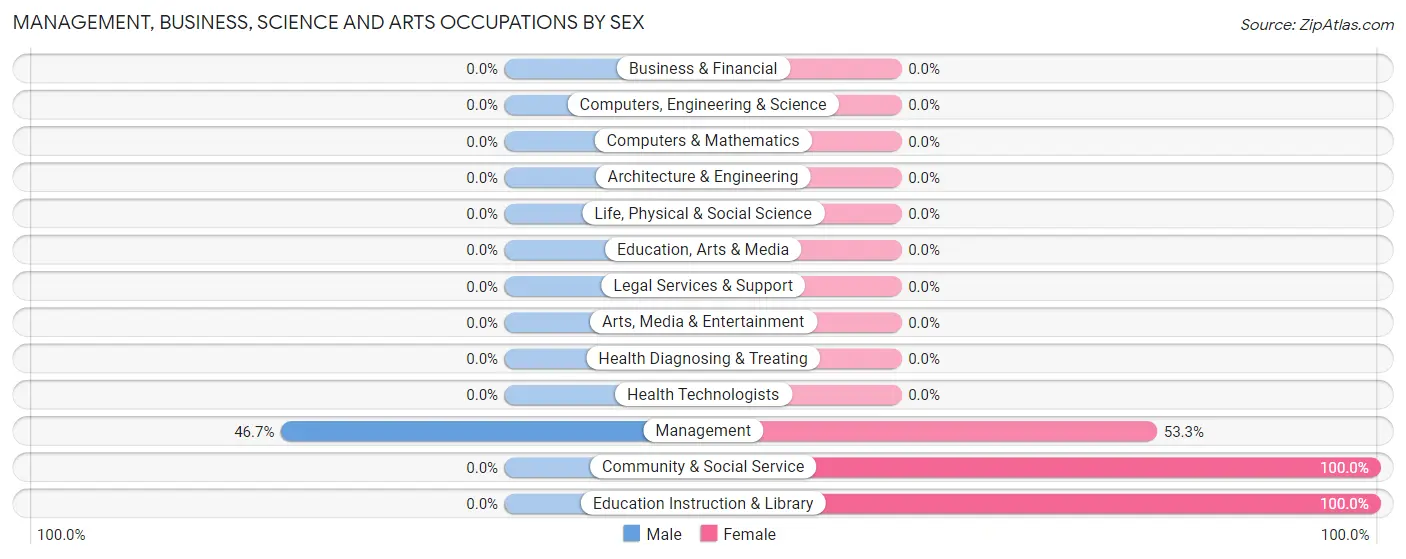
| Occupation | Male | Female |
| Management | 14 (46.7%) | 16 (53.3%) |
| Business & Financial | 0 (0.0%) | 0 (0.0%) |
| Computers, Engineering & Science | 0 (0.0%) | 0 (0.0%) |
| Computers & Mathematics | 0 (0.0%) | 0 (0.0%) |
| Architecture & Engineering | 0 (0.0%) | 0 (0.0%) |
| Life, Physical & Social Science | 0 (0.0%) | 0 (0.0%) |
| Community & Social Service | 0 (0.0%) | 224 (100.0%) |
| Education, Arts & Media | 0 (0.0%) | 0 (0.0%) |
| Legal Services & Support | 0 (0.0%) | 0 (0.0%) |
| Education Instruction & Library | 0 (0.0%) | 224 (100.0%) |
| Arts, Media & Entertainment | 0 (0.0%) | 0 (0.0%) |
| Health Diagnosing & Treating | 0 (0.0%) | 0 (0.0%) |
| Health Technologists | 0 (0.0%) | 0 (0.0%) |
| Total (Category) | 14 (5.5%) | 240 (94.5%) |
| Total (Overall) | 229 (43.6%) | 296 (56.4%) |
Services Occupations
The most common Services occupations in Sanbornville are , and Food Preparation & Serving (14 | 2.7%).
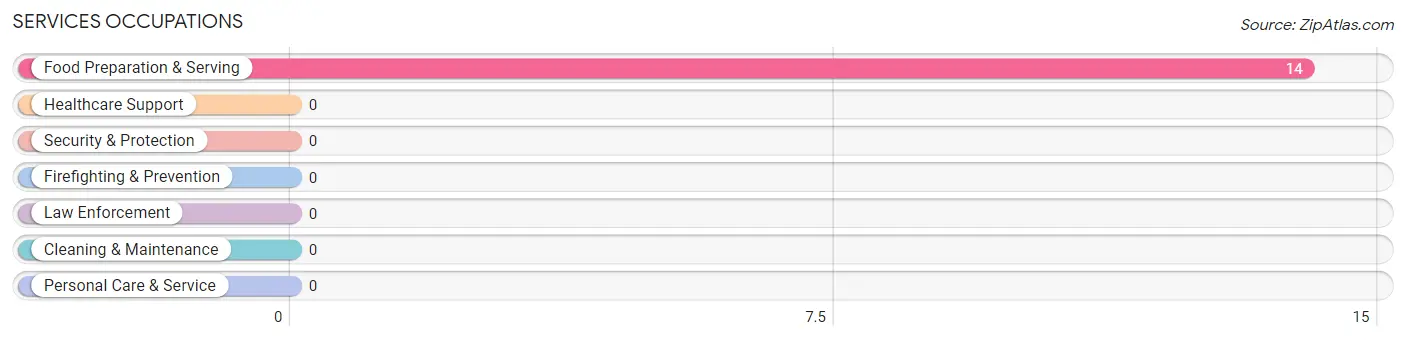
Services Occupations by Sex
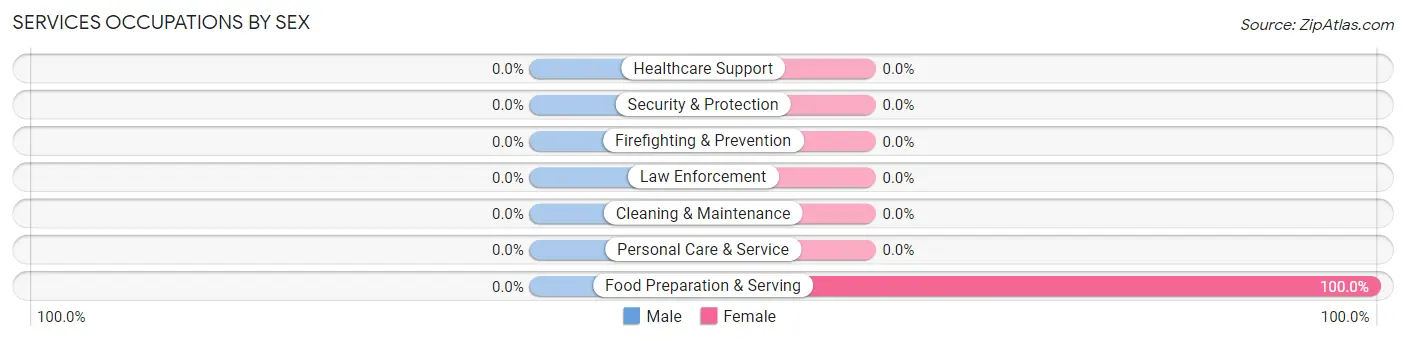
| Occupation | Male | Female |
| Healthcare Support | 0 (0.0%) | 0 (0.0%) |
| Security & Protection | 0 (0.0%) | 0 (0.0%) |
| Firefighting & Prevention | 0 (0.0%) | 0 (0.0%) |
| Law Enforcement | 0 (0.0%) | 0 (0.0%) |
| Food Preparation & Serving | 0 (0.0%) | 14 (100.0%) |
| Cleaning & Maintenance | 0 (0.0%) | 0 (0.0%) |
| Personal Care & Service | 0 (0.0%) | 0 (0.0%) |
| Total (Category) | 0 (0.0%) | 14 (100.0%) |
| Total (Overall) | 229 (43.6%) | 296 (56.4%) |
Sales and Office Occupations
The most common Sales and Office occupations in Sanbornville are , and Sales & Related (42 | 8.0%).
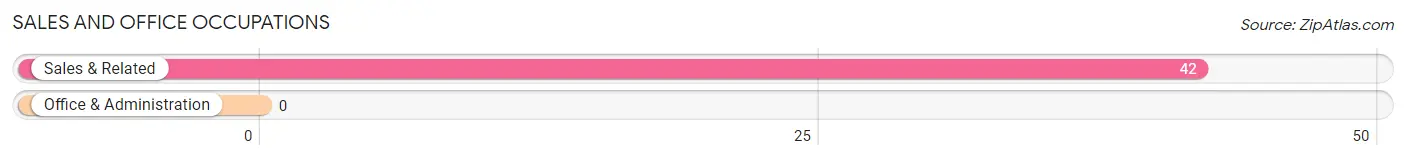
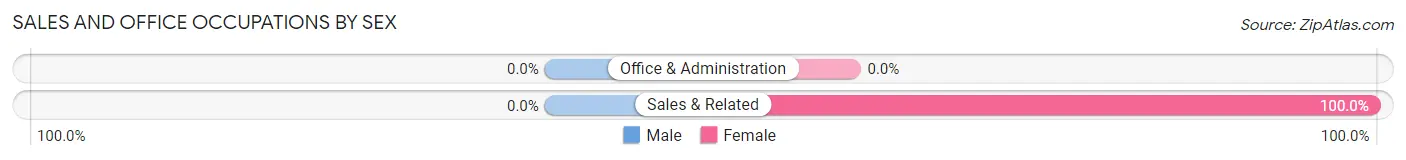
Sales and Office Occupations by Sex
| Occupation | Male | Female |
| Sales & Related | 0 (0.0%) | 42 (100.0%) |
| Office & Administration | 0 (0.0%) | 0 (0.0%) |
| Total (Category) | 0 (0.0%) | 42 (100.0%) |
| Total (Overall) | 229 (43.6%) | 296 (56.4%) |
Natural Resources, Construction and Maintenance Occupations
The most common Natural Resources, Construction and Maintenance occupations in Sanbornville are , and Installation, Maintenance & Repair (14 | 2.7%).
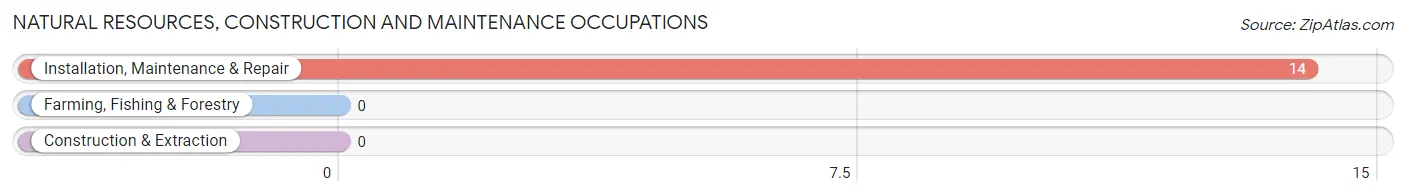
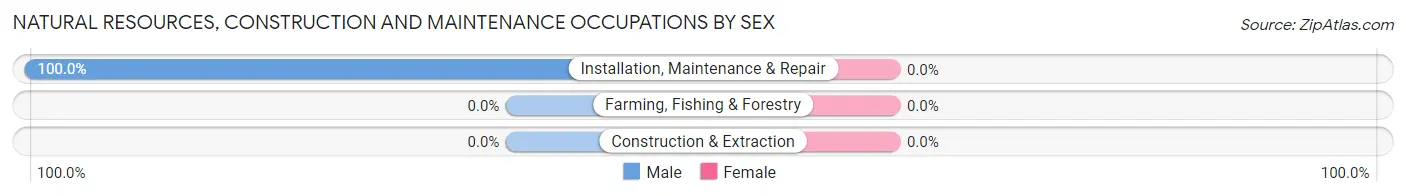
Natural Resources, Construction and Maintenance Occupations by Sex
| Occupation | Male | Female |
| Farming, Fishing & Forestry | 0 (0.0%) | 0 (0.0%) |
| Construction & Extraction | 0 (0.0%) | 0 (0.0%) |
| Installation, Maintenance & Repair | 14 (100.0%) | 0 (0.0%) |
| Total (Category) | 14 (100.0%) | 0 (0.0%) |
| Total (Overall) | 229 (43.6%) | 296 (56.4%) |
Production, Transportation and Moving Occupations
The most common Production, Transportation and Moving occupations in Sanbornville are Production (186 | 35.4%), and Transportation (15 | 2.9%).
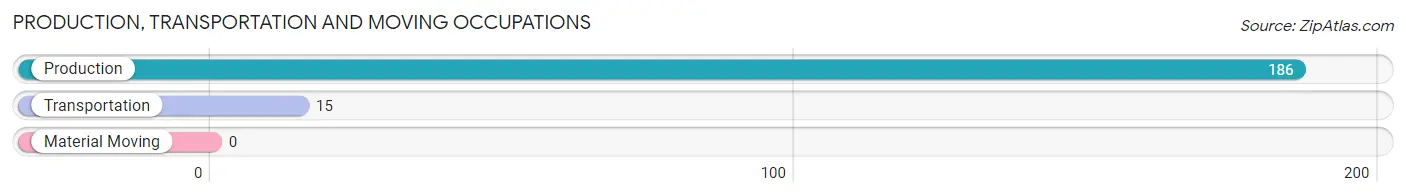
Production, Transportation and Moving Occupations by Sex
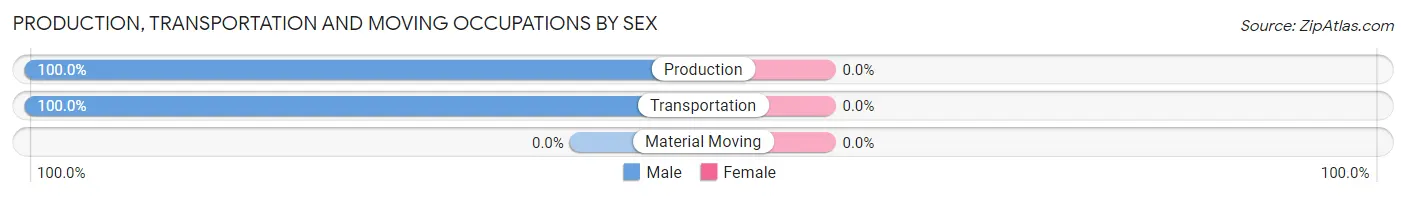
| Occupation | Male | Female |
| Production | 186 (100.0%) | 0 (0.0%) |
| Transportation | 15 (100.0%) | 0 (0.0%) |
| Material Moving | 0 (0.0%) | 0 (0.0%) |
| Total (Category) | 201 (100.0%) | 0 (0.0%) |
| Total (Overall) | 229 (43.6%) | 296 (56.4%) |
Employment Industries by Sex in Sanbornville
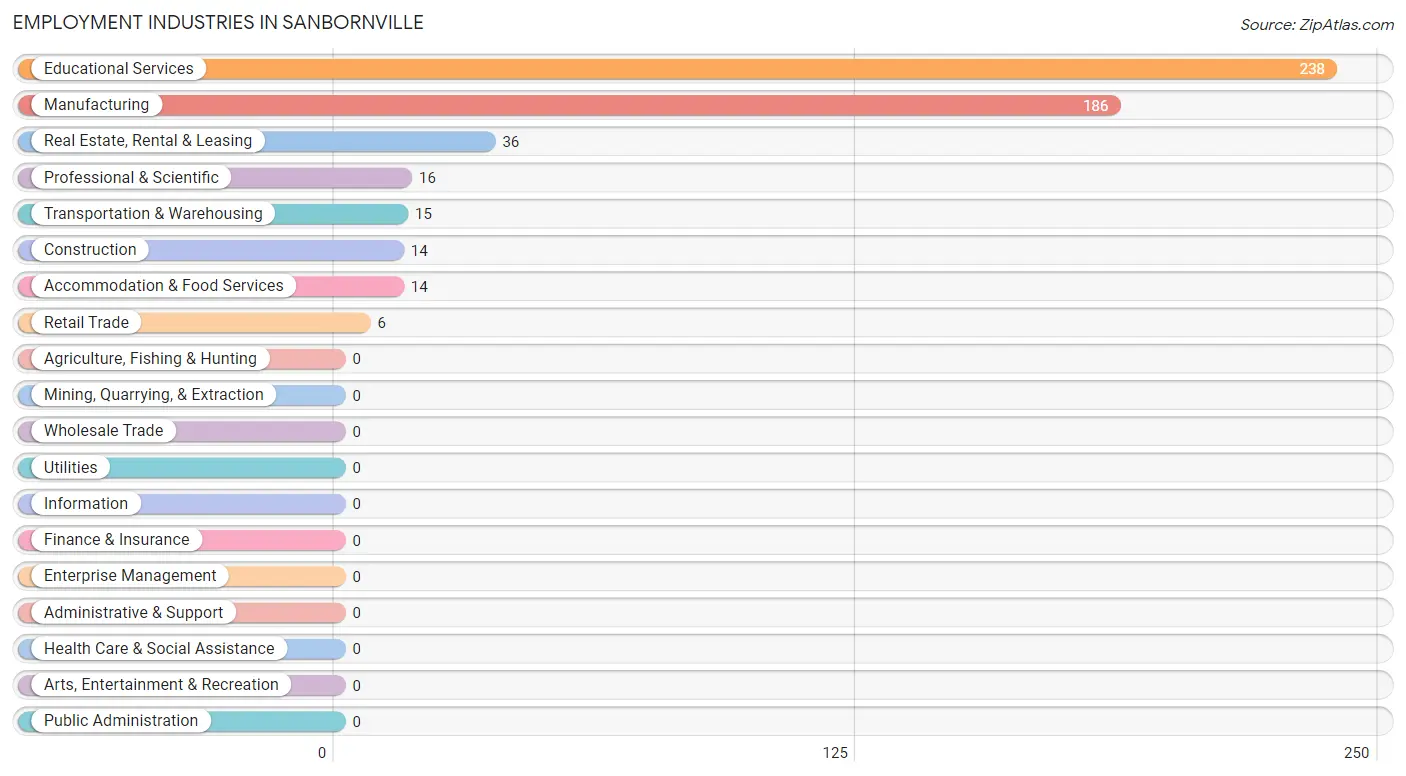
Employment Industries in Sanbornville
The major employment industries in Sanbornville include Educational Services (238 | 45.3%), Manufacturing (186 | 35.4%), Real Estate, Rental & Leasing (36 | 6.9%), Professional & Scientific (16 | 3.0%), and Transportation & Warehousing (15 | 2.9%).
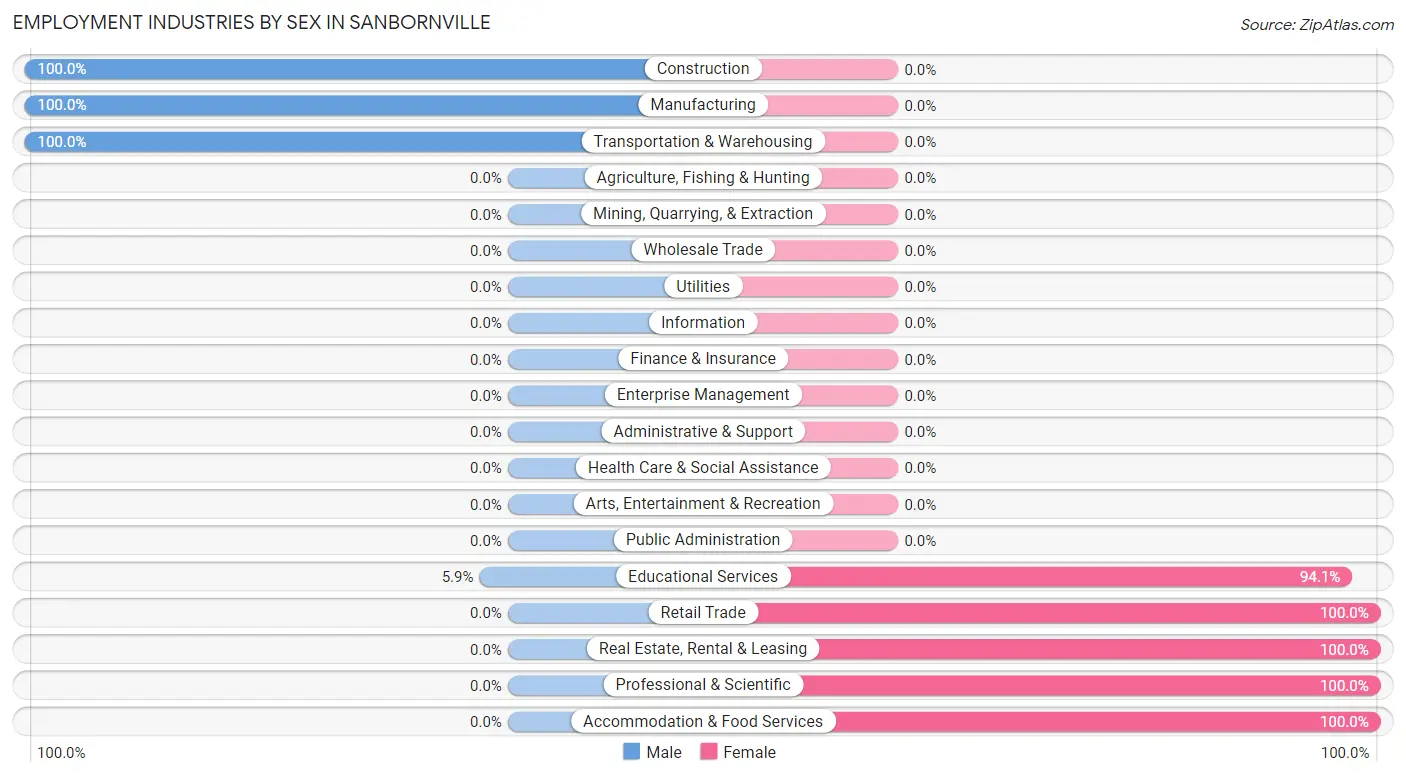
Employment Industries by Sex in Sanbornville
The Sanbornville industries that see more men than women are Construction (100.0%), Manufacturing (100.0%), and Transportation & Warehousing (100.0%), whereas the industries that tend to have a higher number of women are Retail Trade (100.0%), Real Estate, Rental & Leasing (100.0%), and Professional & Scientific (100.0%).
| Industry | Male | Female |
| Agriculture, Fishing & Hunting | 0 (0.0%) | 0 (0.0%) |
| Mining, Quarrying, & Extraction | 0 (0.0%) | 0 (0.0%) |
| Construction | 14 (100.0%) | 0 (0.0%) |
| Manufacturing | 186 (100.0%) | 0 (0.0%) |
| Wholesale Trade | 0 (0.0%) | 0 (0.0%) |
| Retail Trade | 0 (0.0%) | 6 (100.0%) |
| Transportation & Warehousing | 15 (100.0%) | 0 (0.0%) |
| Utilities | 0 (0.0%) | 0 (0.0%) |
| Information | 0 (0.0%) | 0 (0.0%) |
| Finance & Insurance | 0 (0.0%) | 0 (0.0%) |
| Real Estate, Rental & Leasing | 0 (0.0%) | 36 (100.0%) |
| Professional & Scientific | 0 (0.0%) | 16 (100.0%) |
| Enterprise Management | 0 (0.0%) | 0 (0.0%) |
| Administrative & Support | 0 (0.0%) | 0 (0.0%) |
| Educational Services | 14 (5.9%) | 224 (94.1%) |
| Health Care & Social Assistance | 0 (0.0%) | 0 (0.0%) |
| Arts, Entertainment & Recreation | 0 (0.0%) | 0 (0.0%) |
| Accommodation & Food Services | 0 (0.0%) | 14 (100.0%) |
| Public Administration | 0 (0.0%) | 0 (0.0%) |
| Total | 229 (43.6%) | 296 (56.4%) |
Education in Sanbornville
School Enrollment in Sanbornville
The most common levels of schooling among the 114 students in Sanbornville are high school (55 | 48.2%), nursery / preschool (32 | 28.1%), and elementary school (15 | 13.2%).
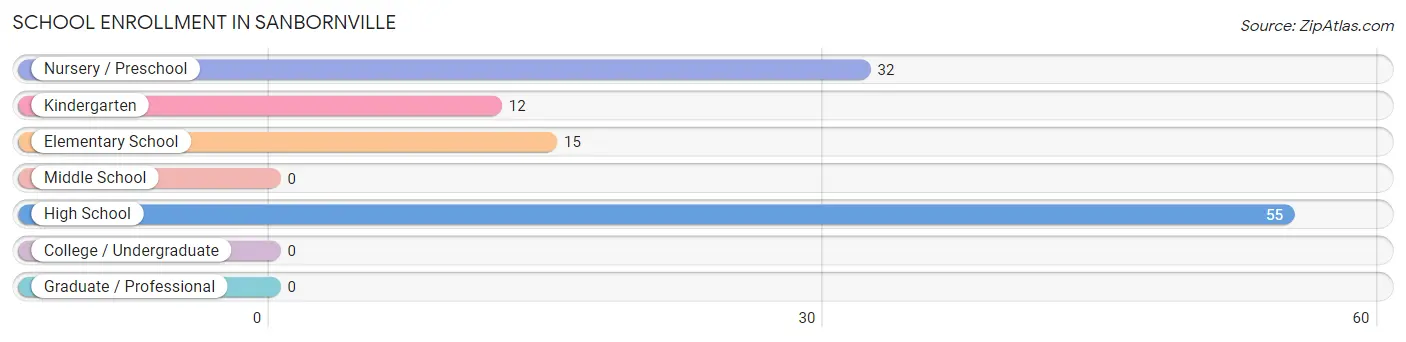
| School Level | # Students | % Students |
| Nursery / Preschool | 32 | 28.1% |
| Kindergarten | 12 | 10.5% |
| Elementary School | 15 | 13.2% |
| Middle School | 0 | 0.0% |
| High School | 55 | 48.2% |
| College / Undergraduate | 0 | 0.0% |
| Graduate / Professional | 0 | 0.0% |
| Total | 114 | 100.0% |
School Enrollment by Age by Funding Source in Sanbornville
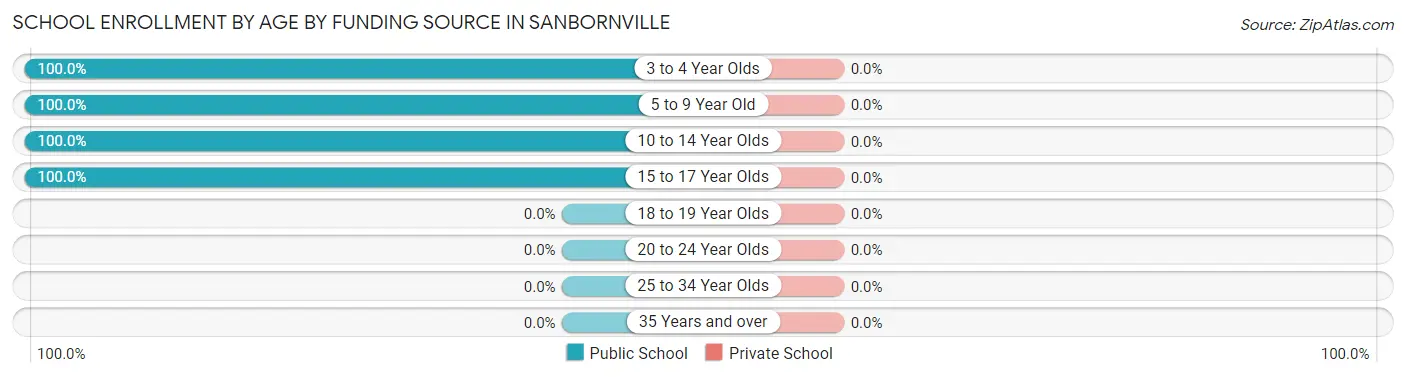
| Age Bracket | Public School | Private School |
| 3 to 4 Year Olds | 32 (100.0%) | 0 (0.0%) |
| 5 to 9 Year Old | 12 (100.0%) | 0 (0.0%) |
| 10 to 14 Year Olds | 15 (100.0%) | 0 (0.0%) |
| 15 to 17 Year Olds | 55 (100.0%) | 0 (0.0%) |
| 18 to 19 Year Olds | 0 (0.0%) | 0 (0.0%) |
| 20 to 24 Year Olds | 0 (0.0%) | 0 (0.0%) |
| 25 to 34 Year Olds | 0 (0.0%) | 0 (0.0%) |
| 35 Years and over | 0 (0.0%) | 0 (0.0%) |
| Total | 114 (100.0%) | 0 (0.0%) |
Educational Attainment by Field of Study in Sanbornville
Education (224 | 71.8%), computers & mathematics (34 | 10.9%), business (15 | 4.8%), physical & health sciences (14 | 4.5%), and visual & performing arts (14 | 4.5%) are the most common fields of study among 312 individuals in Sanbornville who have obtained a bachelor's degree or higher.
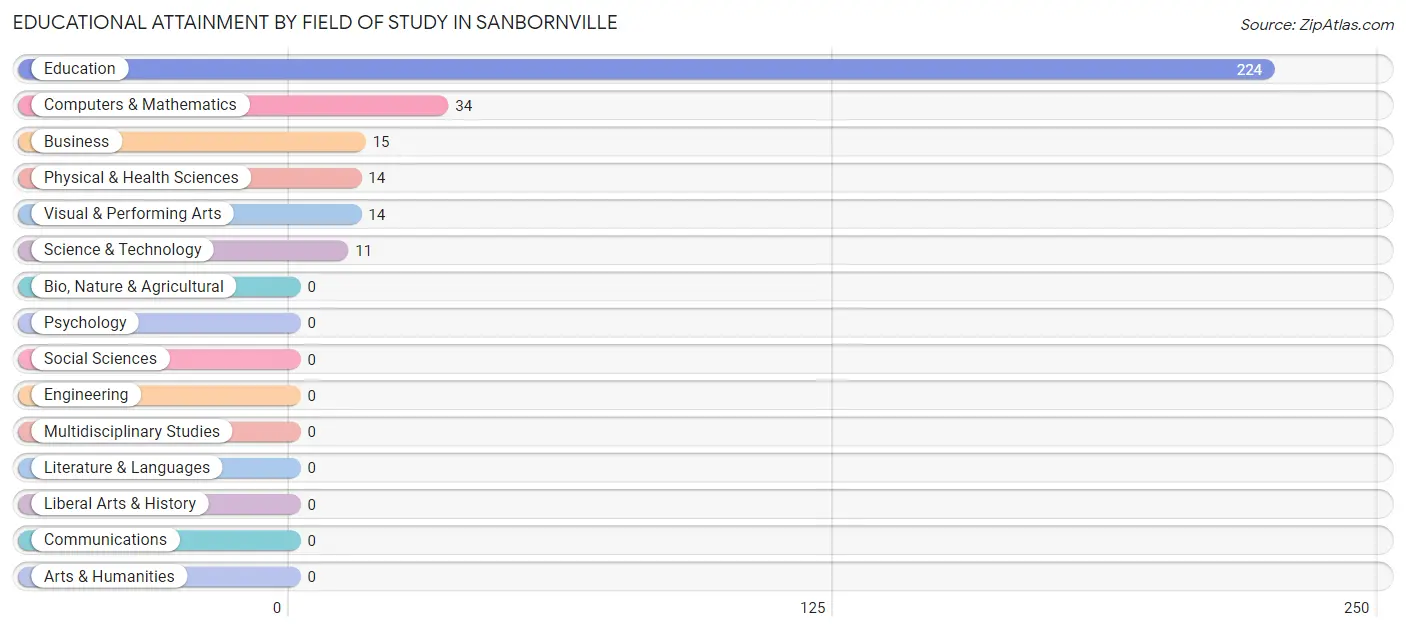
| Field of Study | # Graduates | % Graduates |
| Computers & Mathematics | 34 | 10.9% |
| Bio, Nature & Agricultural | 0 | 0.0% |
| Physical & Health Sciences | 14 | 4.5% |
| Psychology | 0 | 0.0% |
| Social Sciences | 0 | 0.0% |
| Engineering | 0 | 0.0% |
| Multidisciplinary Studies | 0 | 0.0% |
| Science & Technology | 11 | 3.5% |
| Business | 15 | 4.8% |
| Education | 224 | 71.8% |
| Literature & Languages | 0 | 0.0% |
| Liberal Arts & History | 0 | 0.0% |
| Visual & Performing Arts | 14 | 4.5% |
| Communications | 0 | 0.0% |
| Arts & Humanities | 0 | 0.0% |
| Total | 312 | 100.0% |
Transportation & Commute in Sanbornville
Vehicle Availability by Sex in Sanbornville
The most prevalent vehicle ownership categories in Sanbornville are males with 2 vehicles (189, accounting for 82.5%) and females with 2 vehicles (280, making up 63.8%).
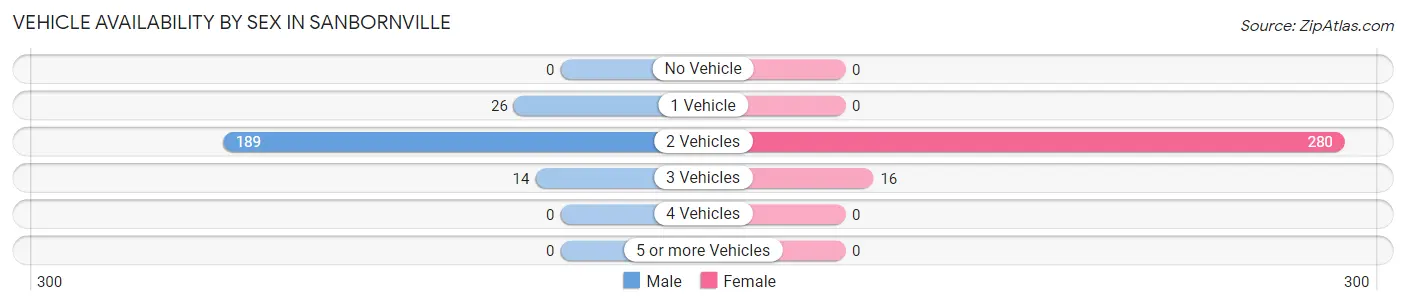
| Vehicles Available | Male | Female |
| No Vehicle | 0 (0.0%) | 0 (0.0%) |
| 1 Vehicle | 26 (11.4%) | 0 (0.0%) |
| 2 Vehicles | 189 (82.5%) | 280 (94.6%) |
| 3 Vehicles | 14 (6.1%) | 16 (5.4%) |
| 4 Vehicles | 0 (0.0%) | 0 (0.0%) |
| 5 or more Vehicles | 0 (0.0%) | 0 (0.0%) |
| Total | 229 (100.0%) | 296 (100.0%) |
Commute Time in Sanbornville
The most frequently occuring commute durations in Sanbornville are 60 to 89 minutes (186 commuters, 56.4%), 25 to 29 minutes (50 commuters, 15.1%), and 30 to 34 minutes (29 commuters, 8.8%).
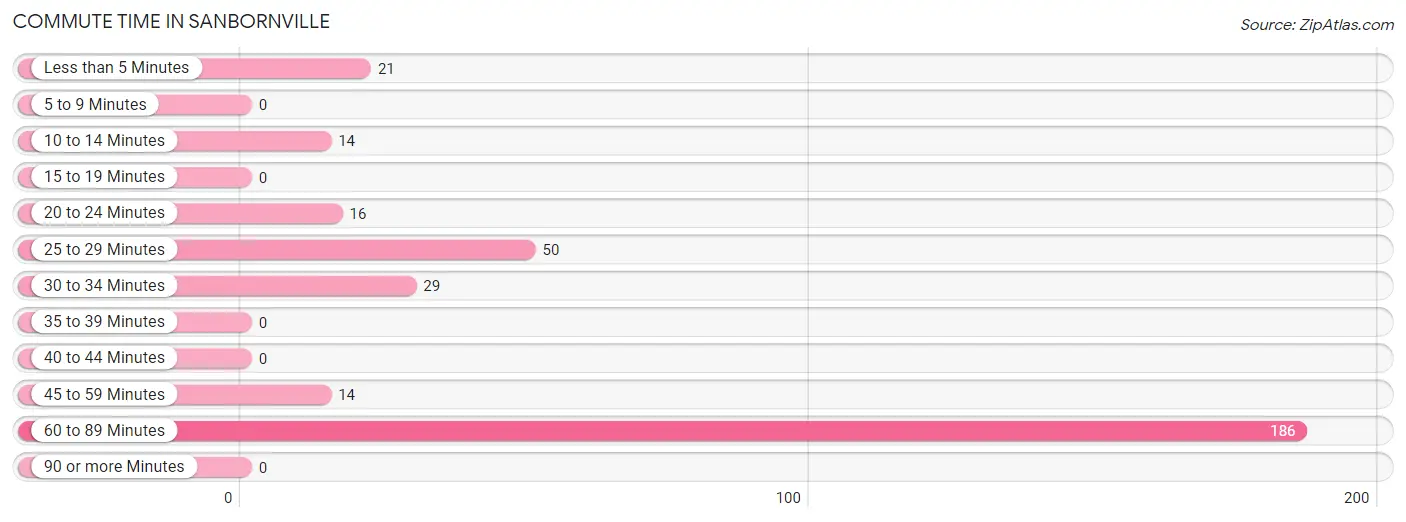
| Commute Time | # Commuters | % Commuters |
| Less than 5 Minutes | 21 | 6.4% |
| 5 to 9 Minutes | 0 | 0.0% |
| 10 to 14 Minutes | 14 | 4.2% |
| 15 to 19 Minutes | 0 | 0.0% |
| 20 to 24 Minutes | 16 | 4.9% |
| 25 to 29 Minutes | 50 | 15.1% |
| 30 to 34 Minutes | 29 | 8.8% |
| 35 to 39 Minutes | 0 | 0.0% |
| 40 to 44 Minutes | 0 | 0.0% |
| 45 to 59 Minutes | 14 | 4.2% |
| 60 to 89 Minutes | 186 | 56.4% |
| 90 or more Minutes | 0 | 0.0% |
Commute Time by Sex in Sanbornville
The most common commute times in Sanbornville are 60 to 89 minutes (186 commuters, 81.2%) for males and 25 to 29 minutes (50 commuters, 49.5%) for females.
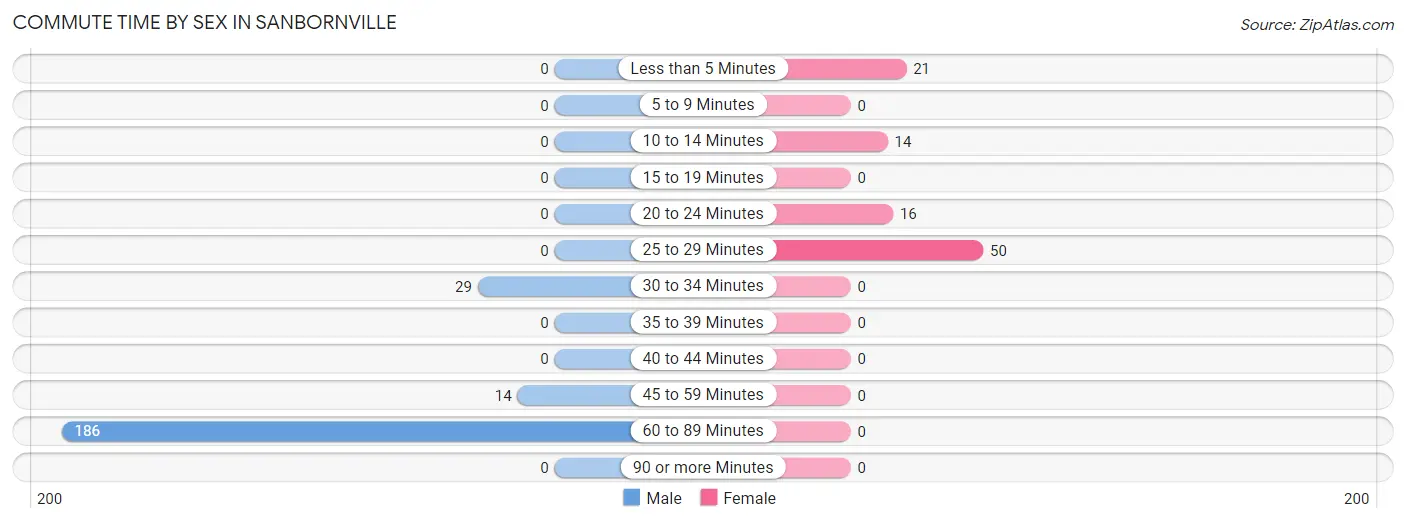
| Commute Time | Male | Female |
| Less than 5 Minutes | 0 (0.0%) | 21 (20.8%) |
| 5 to 9 Minutes | 0 (0.0%) | 0 (0.0%) |
| 10 to 14 Minutes | 0 (0.0%) | 14 (13.9%) |
| 15 to 19 Minutes | 0 (0.0%) | 0 (0.0%) |
| 20 to 24 Minutes | 0 (0.0%) | 16 (15.8%) |
| 25 to 29 Minutes | 0 (0.0%) | 50 (49.5%) |
| 30 to 34 Minutes | 29 (12.7%) | 0 (0.0%) |
| 35 to 39 Minutes | 0 (0.0%) | 0 (0.0%) |
| 40 to 44 Minutes | 0 (0.0%) | 0 (0.0%) |
| 45 to 59 Minutes | 14 (6.1%) | 0 (0.0%) |
| 60 to 89 Minutes | 186 (81.2%) | 0 (0.0%) |
| 90 or more Minutes | 0 (0.0%) | 0 (0.0%) |
Time of Departure to Work by Sex in Sanbornville
The most frequent times of departure to work in Sanbornville are 5:00 AM to 5:29 AM (160, 69.9%) for males and 7:00 AM to 7:29 AM (36, 35.6%) for females.
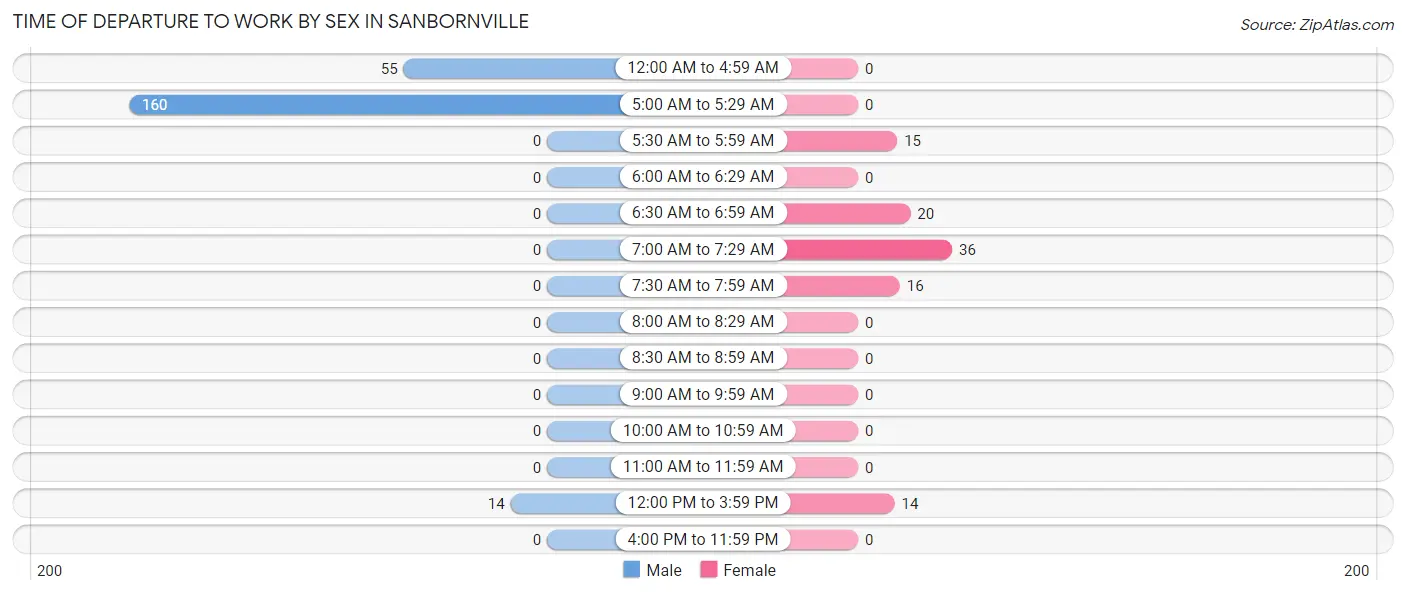
| Time of Departure | Male | Female |
| 12:00 AM to 4:59 AM | 55 (24.0%) | 0 (0.0%) |
| 5:00 AM to 5:29 AM | 160 (69.9%) | 0 (0.0%) |
| 5:30 AM to 5:59 AM | 0 (0.0%) | 15 (14.8%) |
| 6:00 AM to 6:29 AM | 0 (0.0%) | 0 (0.0%) |
| 6:30 AM to 6:59 AM | 0 (0.0%) | 20 (19.8%) |
| 7:00 AM to 7:29 AM | 0 (0.0%) | 36 (35.6%) |
| 7:30 AM to 7:59 AM | 0 (0.0%) | 16 (15.8%) |
| 8:00 AM to 8:29 AM | 0 (0.0%) | 0 (0.0%) |
| 8:30 AM to 8:59 AM | 0 (0.0%) | 0 (0.0%) |
| 9:00 AM to 9:59 AM | 0 (0.0%) | 0 (0.0%) |
| 10:00 AM to 10:59 AM | 0 (0.0%) | 0 (0.0%) |
| 11:00 AM to 11:59 AM | 0 (0.0%) | 0 (0.0%) |
| 12:00 PM to 3:59 PM | 14 (6.1%) | 14 (13.9%) |
| 4:00 PM to 11:59 PM | 0 (0.0%) | 0 (0.0%) |
| Total | 229 (100.0%) | 101 (100.0%) |
Housing Occupancy in Sanbornville
Occupancy by Ownership in Sanbornville
Of the total 444 dwellings in Sanbornville, owner-occupied units account for 363 (81.8%), while renter-occupied units make up 81 (18.2%).
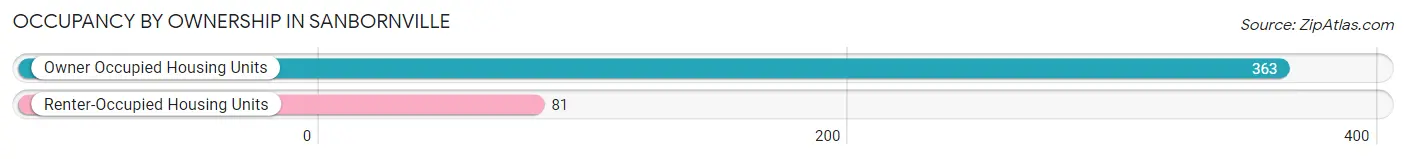
| Occupancy | # Housing Units | % Housing Units |
| Owner Occupied Housing Units | 363 | 81.8% |
| Renter-Occupied Housing Units | 81 | 18.2% |
| Total Occupied Housing Units | 444 | 100.0% |
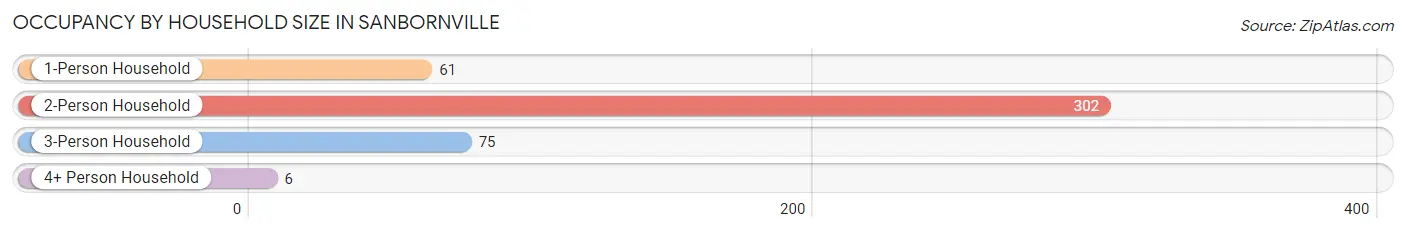
Occupancy by Household Size in Sanbornville
| Household Size | # Housing Units | % Housing Units |
| 1-Person Household | 61 | 13.7% |
| 2-Person Household | 302 | 68.0% |
| 3-Person Household | 75 | 16.9% |
| 4+ Person Household | 6 | 1.3% |
| Total Housing Units | 444 | 100.0% |
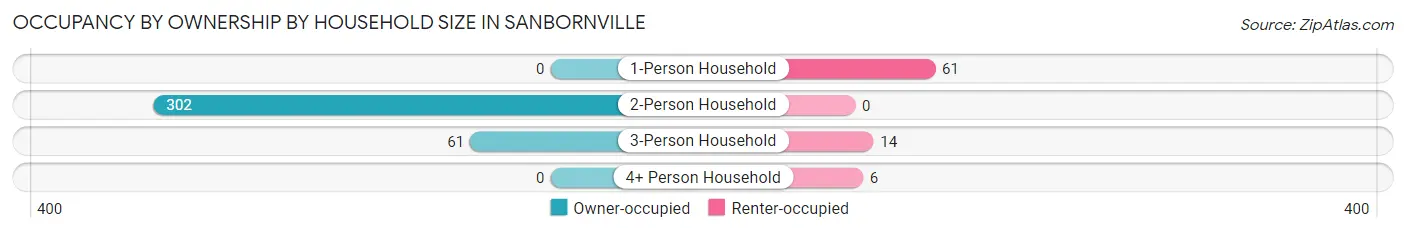
Occupancy by Ownership by Household Size in Sanbornville
| Household Size | Owner-occupied | Renter-occupied |
| 1-Person Household | 0 (0.0%) | 61 (100.0%) |
| 2-Person Household | 302 (100.0%) | 0 (0.0%) |
| 3-Person Household | 61 (81.3%) | 14 (18.7%) |
| 4+ Person Household | 0 (0.0%) | 6 (100.0%) |
| Total Housing Units | 363 (81.8%) | 81 (18.2%) |
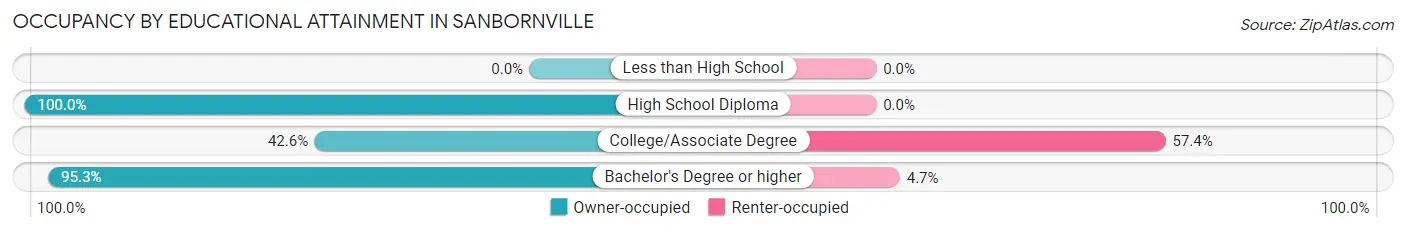
Occupancy by Educational Attainment in Sanbornville
| Household Size | Owner-occupied | Renter-occupied |
| Less than High School | 0 (0.0%) | 0 (0.0%) |
| High School Diploma | 87 (100.0%) | 0 (0.0%) |
| College/Associate Degree | 52 (42.6%) | 70 (57.4%) |
| Bachelor's Degree or higher | 224 (95.3%) | 11 (4.7%) |
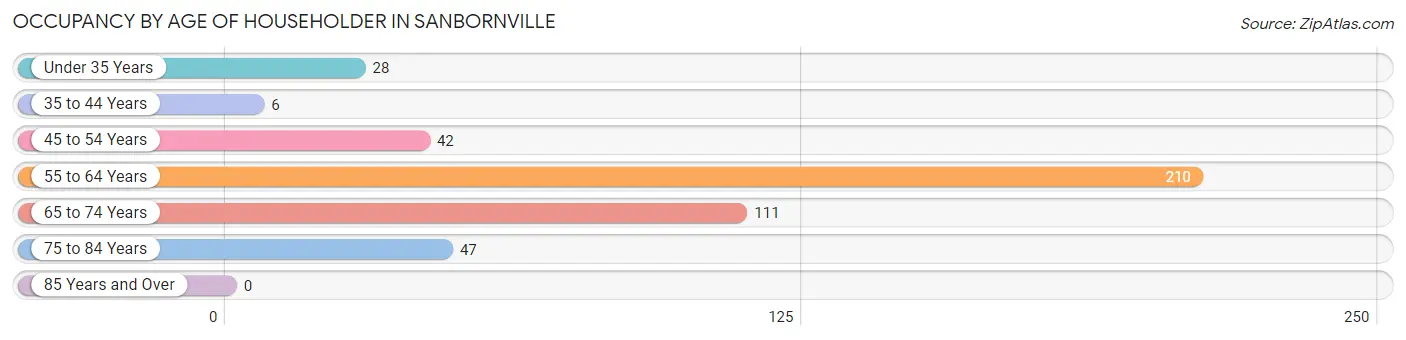
Occupancy by Age of Householder in Sanbornville
| Age Bracket | # Households | % Households |
| Under 35 Years | 28 | 6.3% |
| 35 to 44 Years | 6 | 1.3% |
| 45 to 54 Years | 42 | 9.5% |
| 55 to 64 Years | 210 | 47.3% |
| 65 to 74 Years | 111 | 25.0% |
| 75 to 84 Years | 47 | 10.6% |
| 85 Years and Over | 0 | 0.0% |
| Total | 444 | 100.0% |
Housing Finances in Sanbornville
Median Income by Occupancy in Sanbornville
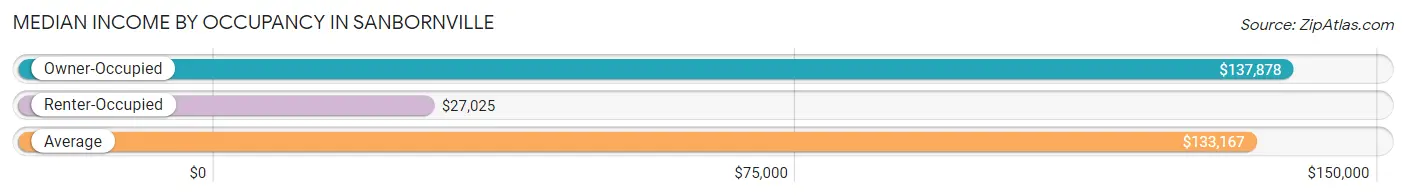
| Occupancy Type | # Households | Median Income |
| Owner-Occupied | 363 (81.8%) | $137,878 |
| Renter-Occupied | 81 (18.2%) | $27,025 |
| Average | 444 (100.0%) | $133,167 |
Occupancy by Householder Income Bracket in Sanbornville
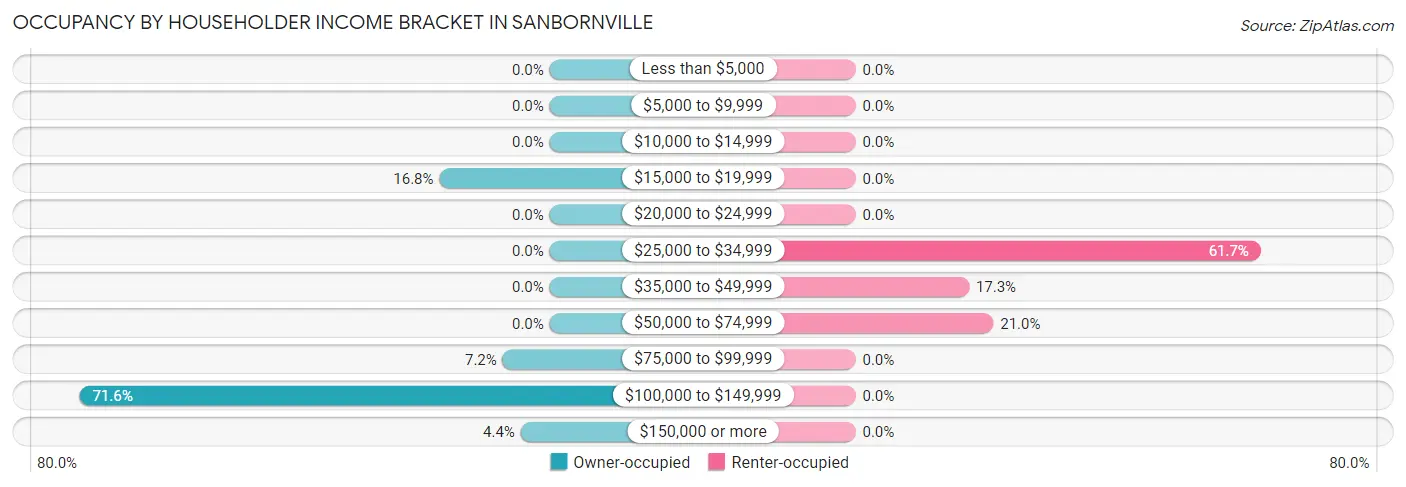
| Income Bracket | Owner-occupied | Renter-occupied |
| Less than $5,000 | 0 (0.0%) | 0 (0.0%) |
| $5,000 to $9,999 | 0 (0.0%) | 0 (0.0%) |
| $10,000 to $14,999 | 0 (0.0%) | 0 (0.0%) |
| $15,000 to $19,999 | 61 (16.8%) | 0 (0.0%) |
| $20,000 to $24,999 | 0 (0.0%) | 0 (0.0%) |
| $25,000 to $34,999 | 0 (0.0%) | 50 (61.7%) |
| $35,000 to $49,999 | 0 (0.0%) | 14 (17.3%) |
| $50,000 to $74,999 | 0 (0.0%) | 17 (21.0%) |
| $75,000 to $99,999 | 26 (7.2%) | 0 (0.0%) |
| $100,000 to $149,999 | 260 (71.6%) | 0 (0.0%) |
| $150,000 or more | 16 (4.4%) | 0 (0.0%) |
| Total | 363 (100.0%) | 81 (100.0%) |
Monthly Housing Cost Tiers in Sanbornville
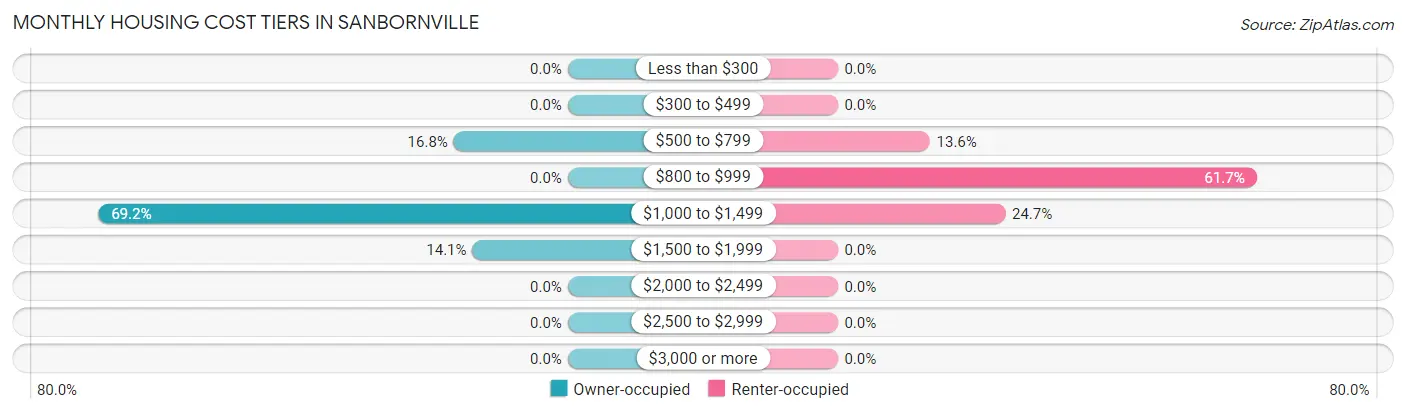
| Monthly Cost | Owner-occupied | Renter-occupied |
| Less than $300 | 0 (0.0%) | 0 (0.0%) |
| $300 to $499 | 0 (0.0%) | 0 (0.0%) |
| $500 to $799 | 61 (16.8%) | 11 (13.6%) |
| $800 to $999 | 0 (0.0%) | 50 (61.7%) |
| $1,000 to $1,499 | 251 (69.2%) | 20 (24.7%) |
| $1,500 to $1,999 | 51 (14.1%) | 0 (0.0%) |
| $2,000 to $2,499 | 0 (0.0%) | 0 (0.0%) |
| $2,500 to $2,999 | 0 (0.0%) | 0 (0.0%) |
| $3,000 or more | 0 (0.0%) | 0 (0.0%) |
| Total | 363 (100.0%) | 81 (100.0%) |
Physical Housing Characteristics in Sanbornville
Housing Structures in Sanbornville
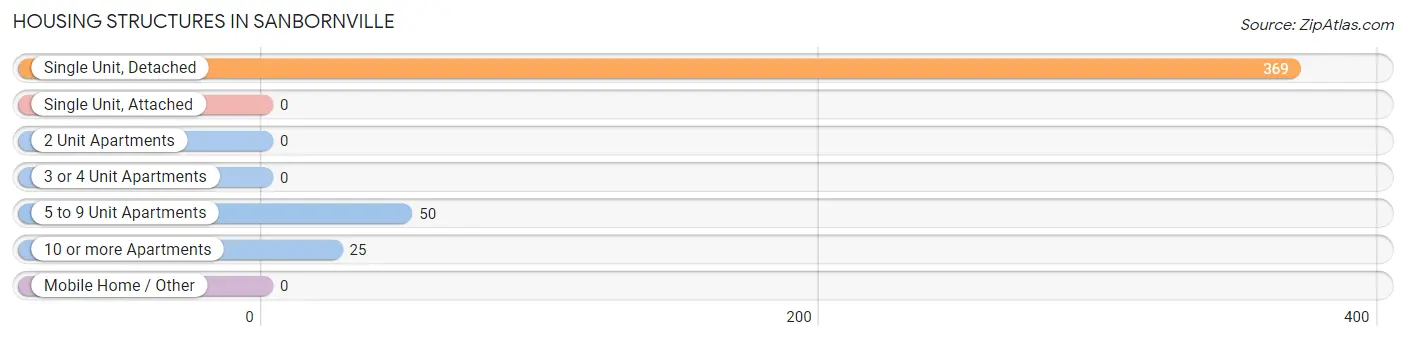
| Structure Type | # Housing Units | % Housing Units |
| Single Unit, Detached | 369 | 83.1% |
| Single Unit, Attached | 0 | 0.0% |
| 2 Unit Apartments | 0 | 0.0% |
| 3 or 4 Unit Apartments | 0 | 0.0% |
| 5 to 9 Unit Apartments | 50 | 11.3% |
| 10 or more Apartments | 25 | 5.6% |
| Mobile Home / Other | 0 | 0.0% |
| Total | 444 | 100.0% |
Housing Structures by Occupancy in Sanbornville
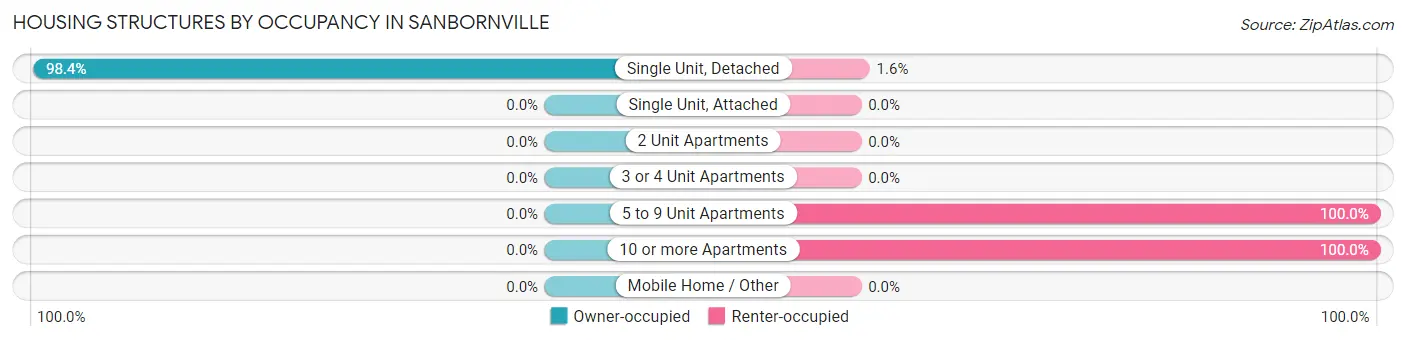
| Structure Type | Owner-occupied | Renter-occupied |
| Single Unit, Detached | 363 (98.4%) | 6 (1.6%) |
| Single Unit, Attached | 0 (0.0%) | 0 (0.0%) |
| 2 Unit Apartments | 0 (0.0%) | 0 (0.0%) |
| 3 or 4 Unit Apartments | 0 (0.0%) | 0 (0.0%) |
| 5 to 9 Unit Apartments | 0 (0.0%) | 50 (100.0%) |
| 10 or more Apartments | 0 (0.0%) | 25 (100.0%) |
| Mobile Home / Other | 0 (0.0%) | 0 (0.0%) |
| Total | 363 (81.8%) | 81 (18.2%) |
Housing Structures by Number of Rooms in Sanbornville
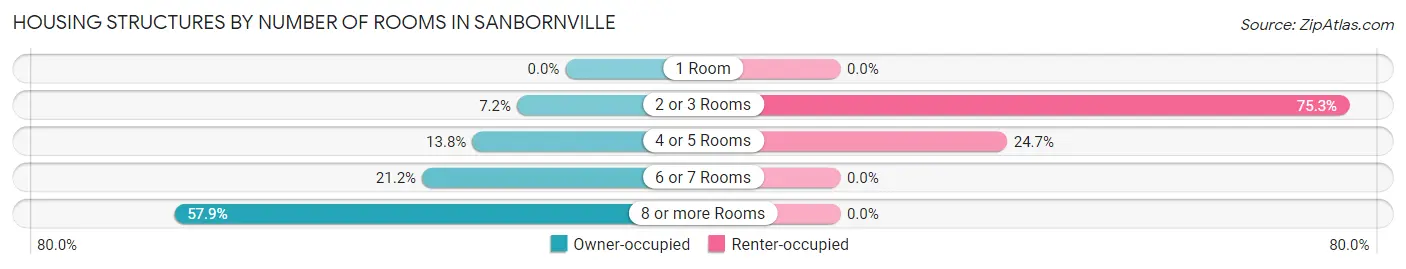
| Number of Rooms | Owner-occupied | Renter-occupied |
| 1 Room | 0 (0.0%) | 0 (0.0%) |
| 2 or 3 Rooms | 26 (7.2%) | 61 (75.3%) |
| 4 or 5 Rooms | 50 (13.8%) | 20 (24.7%) |
| 6 or 7 Rooms | 77 (21.2%) | 0 (0.0%) |
| 8 or more Rooms | 210 (57.9%) | 0 (0.0%) |
| Total | 363 (100.0%) | 81 (100.0%) |
Housing Structure by Heating Type in Sanbornville
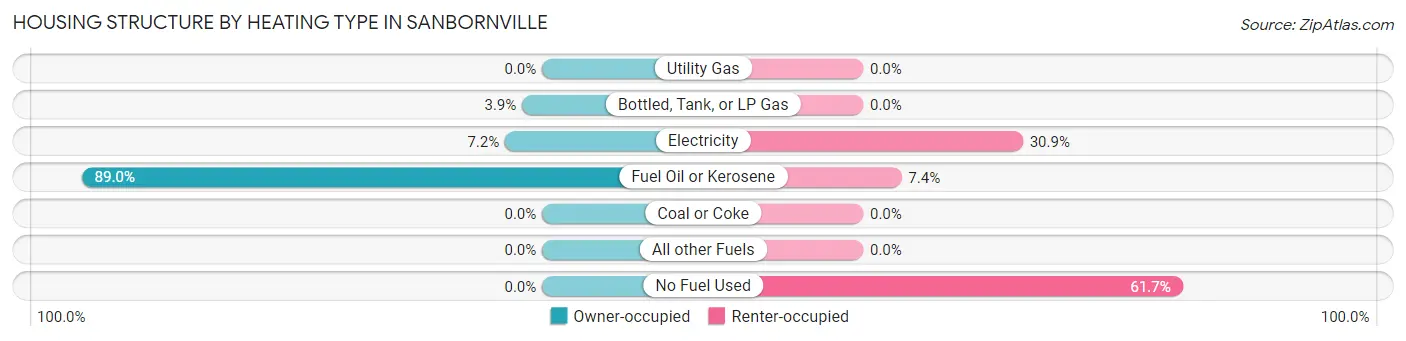
| Heating Type | Owner-occupied | Renter-occupied |
| Utility Gas | 0 (0.0%) | 0 (0.0%) |
| Bottled, Tank, or LP Gas | 14 (3.9%) | 0 (0.0%) |
| Electricity | 26 (7.2%) | 25 (30.9%) |
| Fuel Oil or Kerosene | 323 (89.0%) | 6 (7.4%) |
| Coal or Coke | 0 (0.0%) | 0 (0.0%) |
| All other Fuels | 0 (0.0%) | 0 (0.0%) |
| No Fuel Used | 0 (0.0%) | 50 (61.7%) |
| Total | 363 (100.0%) | 81 (100.0%) |
Household Vehicle Usage in Sanbornville
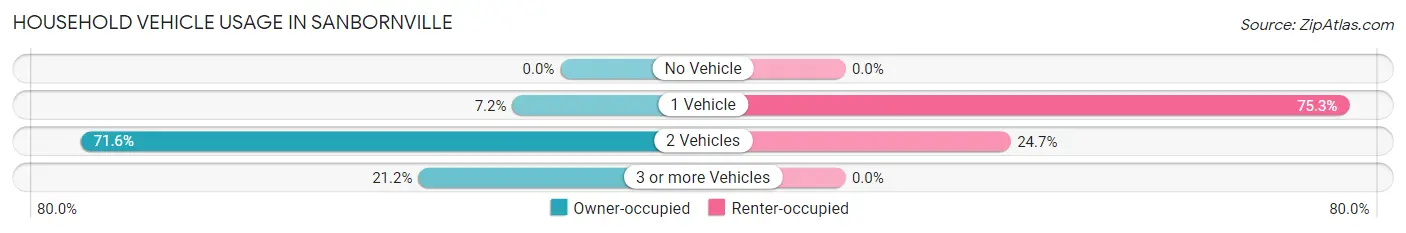
| Vehicles per Household | Owner-occupied | Renter-occupied |
| No Vehicle | 0 (0.0%) | 0 (0.0%) |
| 1 Vehicle | 26 (7.2%) | 61 (75.3%) |
| 2 Vehicles | 260 (71.6%) | 20 (24.7%) |
| 3 or more Vehicles | 77 (21.2%) | 0 (0.0%) |
| Total | 363 (100.0%) | 81 (100.0%) |
Real Estate & Mortgages in Sanbornville
Real Estate and Mortgage Overview in Sanbornville
| Characteristic | Without Mortgage | With Mortgage |
| Housing Units | 61 | 302 |
| Median Property Value | - | - |
| Median Household Income | - | - |
| Monthly Housing Costs | - | - |
| Real Estate Taxes | - | - |
Property Value by Mortgage Status in Sanbornville
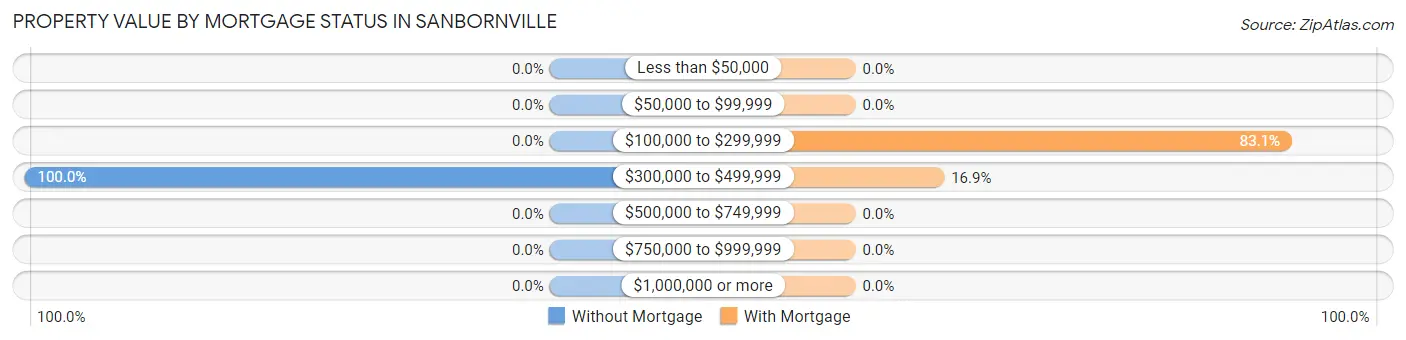
| Property Value | Without Mortgage | With Mortgage |
| Less than $50,000 | 0 (0.0%) | 0 (0.0%) |
| $50,000 to $99,999 | 0 (0.0%) | 0 (0.0%) |
| $100,000 to $299,999 | 0 (0.0%) | 251 (83.1%) |
| $300,000 to $499,999 | 61 (100.0%) | 51 (16.9%) |
| $500,000 to $749,999 | 0 (0.0%) | 0 (0.0%) |
| $750,000 to $999,999 | 0 (0.0%) | 0 (0.0%) |
| $1,000,000 or more | 0 (0.0%) | 0 (0.0%) |
| Total | 61 (100.0%) | 302 (100.0%) |
Household Income by Mortgage Status in Sanbornville
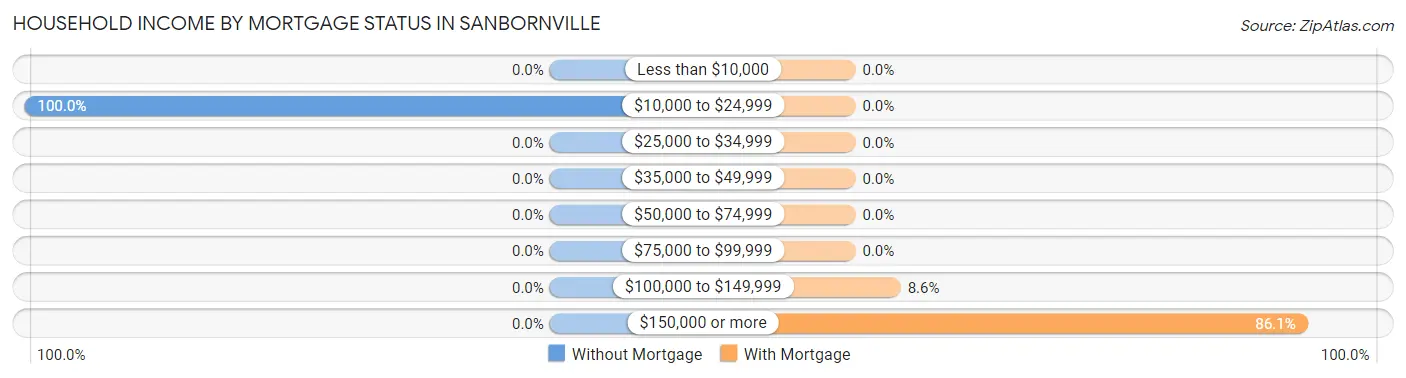
| Household Income | Without Mortgage | With Mortgage |
| Less than $10,000 | 0 (0.0%) | 0 (0.0%) |
| $10,000 to $24,999 | 61 (100.0%) | 0 (0.0%) |
| $25,000 to $34,999 | 0 (0.0%) | 0 (0.0%) |
| $35,000 to $49,999 | 0 (0.0%) | 0 (0.0%) |
| $50,000 to $74,999 | 0 (0.0%) | 0 (0.0%) |
| $75,000 to $99,999 | 0 (0.0%) | 0 (0.0%) |
| $100,000 to $149,999 | 0 (0.0%) | 26 (8.6%) |
| $150,000 or more | 0 (0.0%) | 260 (86.1%) |
| Total | 61 (100.0%) | 302 (100.0%) |
Property Value to Household Income Ratio in Sanbornville
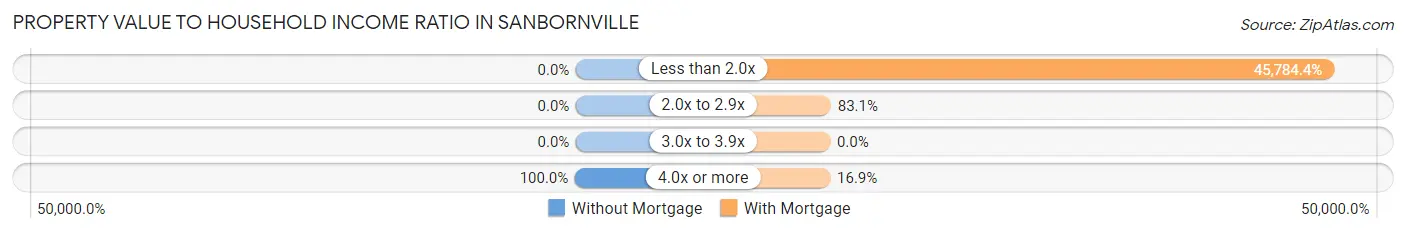
| Value-to-Income Ratio | Without Mortgage | With Mortgage |
| Less than 2.0x | 0 (0.0%) | 138,269 (45,784.4%) |
| 2.0x to 2.9x | 0 (0.0%) | 251 (83.1%) |
| 3.0x to 3.9x | 0 (0.0%) | 0 (0.0%) |
| 4.0x or more | 61 (100.0%) | 51 (16.9%) |
| Total | 61 (100.0%) | 302 (100.0%) |
Real Estate Taxes by Mortgage Status in Sanbornville
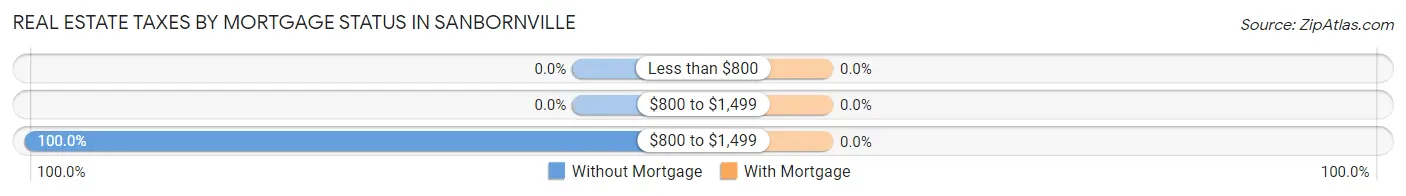
| Property Taxes | Without Mortgage | With Mortgage |
| Less than $800 | 0 (0.0%) | 0 (0.0%) |
| $800 to $1,499 | 0 (0.0%) | 0 (0.0%) |
| $800 to $1,499 | 61 (100.0%) | 0 (0.0%) |
| Total | 61 (100.0%) | 302 (100.0%) |
Health & Disability in Sanbornville
Health Insurance Coverage by Age in Sanbornville
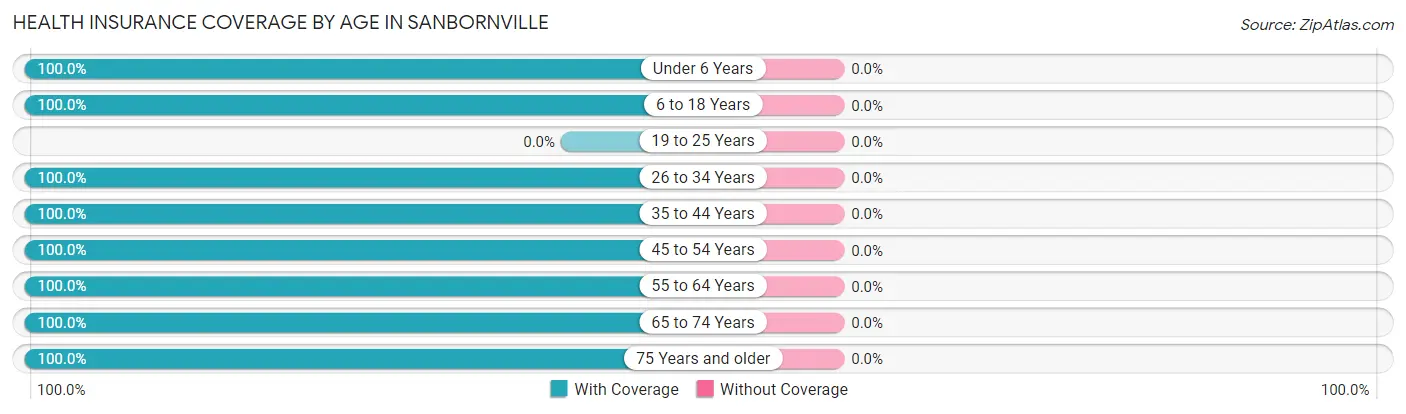
| Age Bracket | With Coverage | Without Coverage |
| Under 6 Years | 32 (100.0%) | 0 (0.0%) |
| 6 to 18 Years | 82 (100.0%) | 0 (0.0%) |
| 19 to 25 Years | 0 (0.0%) | 0 (0.0%) |
| 26 to 34 Years | 43 (100.0%) | 0 (0.0%) |
| 35 to 44 Years | 130 (100.0%) | 0 (0.0%) |
| 45 to 54 Years | 42 (100.0%) | 0 (0.0%) |
| 55 to 64 Years | 398 (100.0%) | 0 (0.0%) |
| 65 to 74 Years | 111 (100.0%) | 0 (0.0%) |
| 75 Years and older | 81 (100.0%) | 0 (0.0%) |
| Total | 919 (100.0%) | 0 (0.0%) |
Health Insurance Coverage by Citizenship Status in Sanbornville
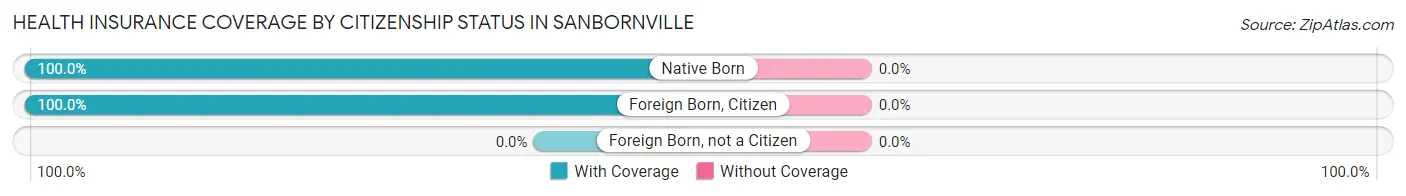
| Citizenship Status | With Coverage | Without Coverage |
| Native Born | 32 (100.0%) | 0 (0.0%) |
| Foreign Born, Citizen | 82 (100.0%) | 0 (0.0%) |
| Foreign Born, not a Citizen | 0 (0.0%) | 0 (0.0%) |
Health Insurance Coverage by Household Income in Sanbornville
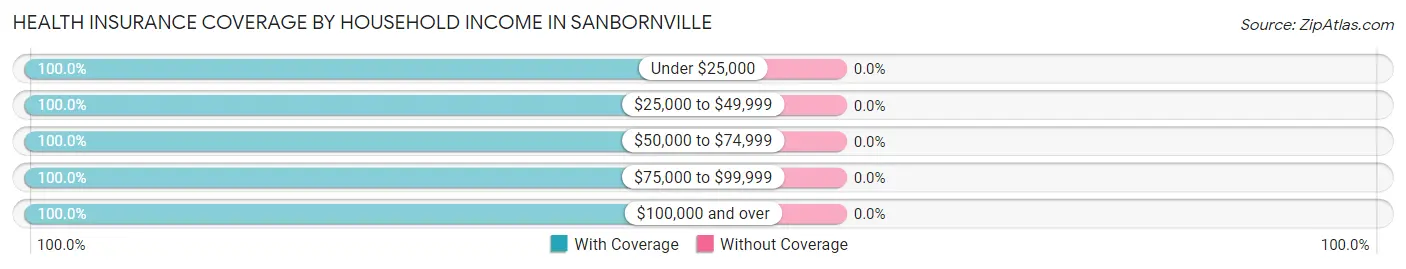
| Household Income | With Coverage | Without Coverage |
| Under $25,000 | 193 (100.0%) | 0 (0.0%) |
| $25,000 to $49,999 | 89 (100.0%) | 0 (0.0%) |
| $50,000 to $74,999 | 80 (100.0%) | 0 (0.0%) |
| $75,000 to $99,999 | 44 (100.0%) | 0 (0.0%) |
| $100,000 and over | 513 (100.0%) | 0 (0.0%) |
Public vs Private Health Insurance Coverage by Age in Sanbornville
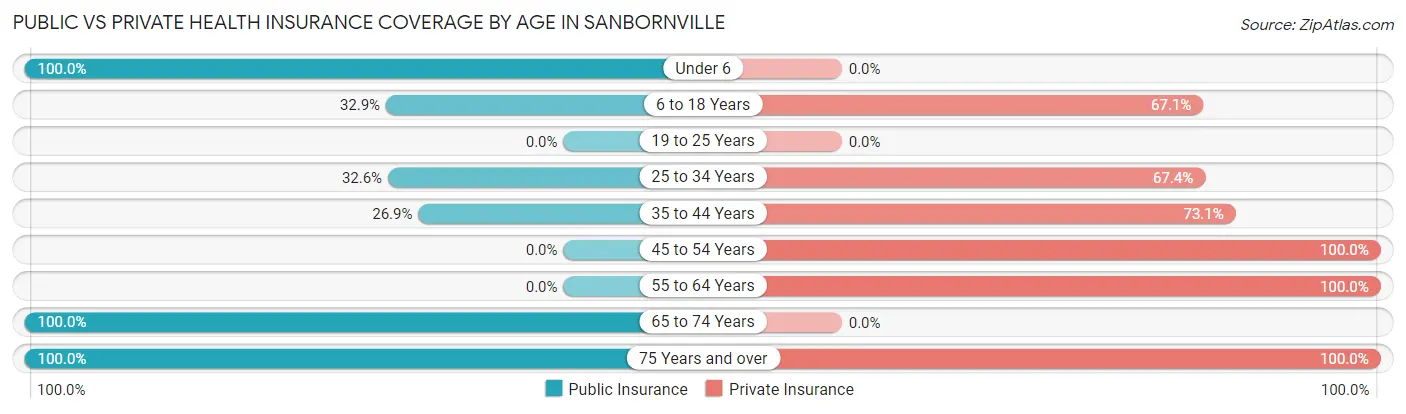
| Age Bracket | Public Insurance | Private Insurance |
| Under 6 | 32 (100.0%) | 0 (0.0%) |
| 6 to 18 Years | 27 (32.9%) | 55 (67.1%) |
| 19 to 25 Years | 0 (0.0%) | 0 (0.0%) |
| 25 to 34 Years | 14 (32.6%) | 29 (67.4%) |
| 35 to 44 Years | 35 (26.9%) | 95 (73.1%) |
| 45 to 54 Years | 0 (0.0%) | 42 (100.0%) |
| 55 to 64 Years | 0 (0.0%) | 398 (100.0%) |
| 65 to 74 Years | 111 (100.0%) | 0 (0.0%) |
| 75 Years and over | 81 (100.0%) | 81 (100.0%) |
| Total | 300 (32.6%) | 700 (76.2%) |
Disability Status by Sex by Age in Sanbornville
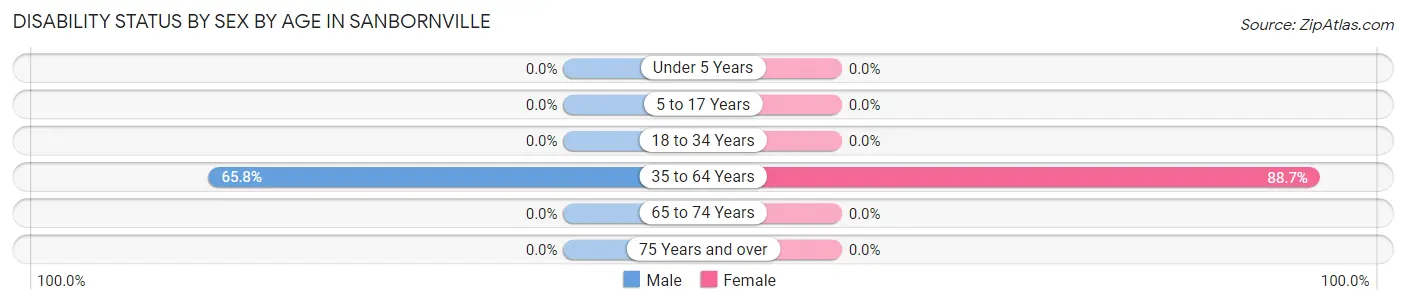
| Age Bracket | Male | Female |
| Under 5 Years | 0 (0.0%) | 0 (0.0%) |
| 5 to 17 Years | 0 (0.0%) | 0 (0.0%) |
| 18 to 34 Years | 0 (0.0%) | 0 (0.0%) |
| 35 to 64 Years | 160 (65.8%) | 290 (88.7%) |
| 65 to 74 Years | 0 (0.0%) | 0 (0.0%) |
| 75 Years and over | 0 (0.0%) | 0 (0.0%) |
Disability Class by Sex by Age in Sanbornville
Disability Class: Hearing Difficulty
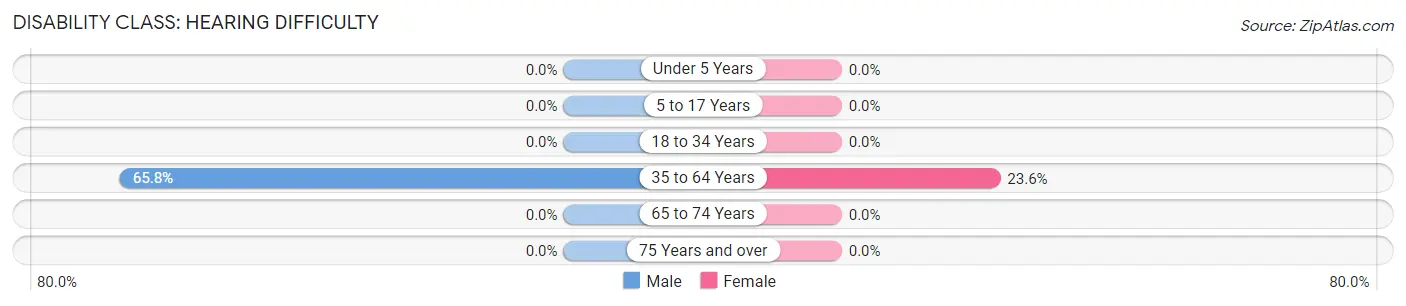
| Age Bracket | Male | Female |
| Under 5 Years | 0 (0.0%) | 0 (0.0%) |
| 5 to 17 Years | 0 (0.0%) | 0 (0.0%) |
| 18 to 34 Years | 0 (0.0%) | 0 (0.0%) |
| 35 to 64 Years | 160 (65.8%) | 77 (23.5%) |
| 65 to 74 Years | 0 (0.0%) | 0 (0.0%) |
| 75 Years and over | 0 (0.0%) | 0 (0.0%) |
Disability Class: Vision Difficulty
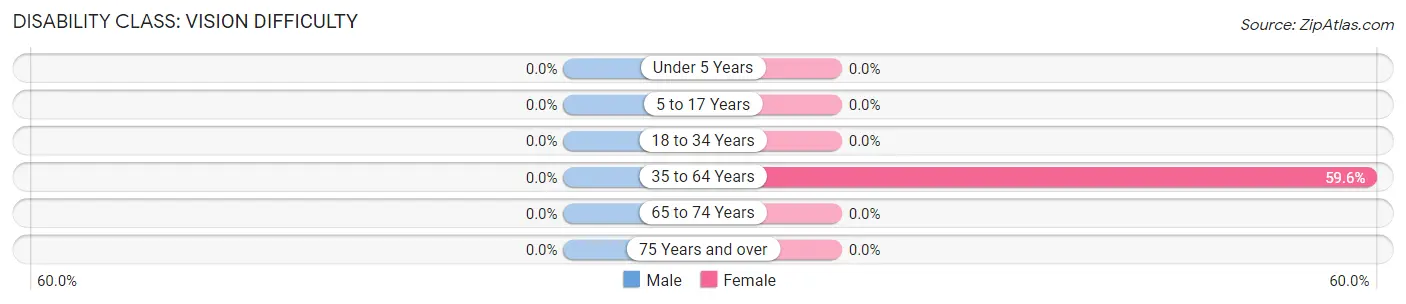
| Age Bracket | Male | Female |
| Under 5 Years | 0 (0.0%) | 0 (0.0%) |
| 5 to 17 Years | 0 (0.0%) | 0 (0.0%) |
| 18 to 34 Years | 0 (0.0%) | 0 (0.0%) |
| 35 to 64 Years | 0 (0.0%) | 195 (59.6%) |
| 65 to 74 Years | 0 (0.0%) | 0 (0.0%) |
| 75 Years and over | 0 (0.0%) | 0 (0.0%) |
Disability Class: Cognitive Difficulty
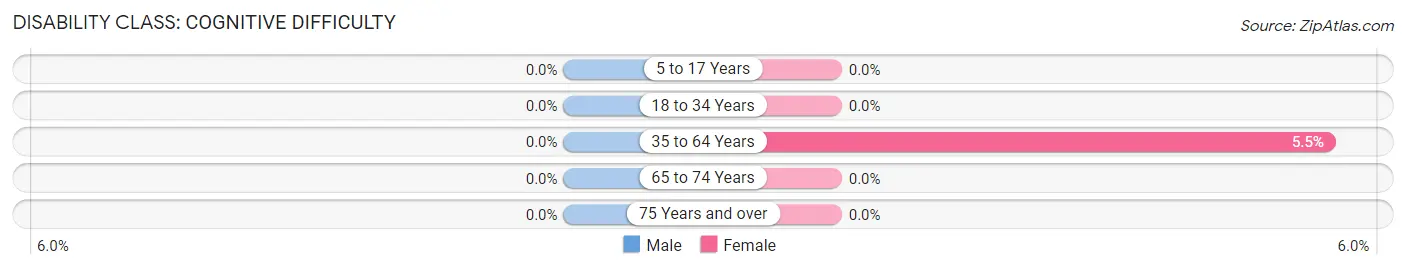
| Age Bracket | Male | Female |
| 5 to 17 Years | 0 (0.0%) | 0 (0.0%) |
| 18 to 34 Years | 0 (0.0%) | 0 (0.0%) |
| 35 to 64 Years | 0 (0.0%) | 18 (5.5%) |
| 65 to 74 Years | 0 (0.0%) | 0 (0.0%) |
| 75 Years and over | 0 (0.0%) | 0 (0.0%) |
Disability Class: Ambulatory Difficulty
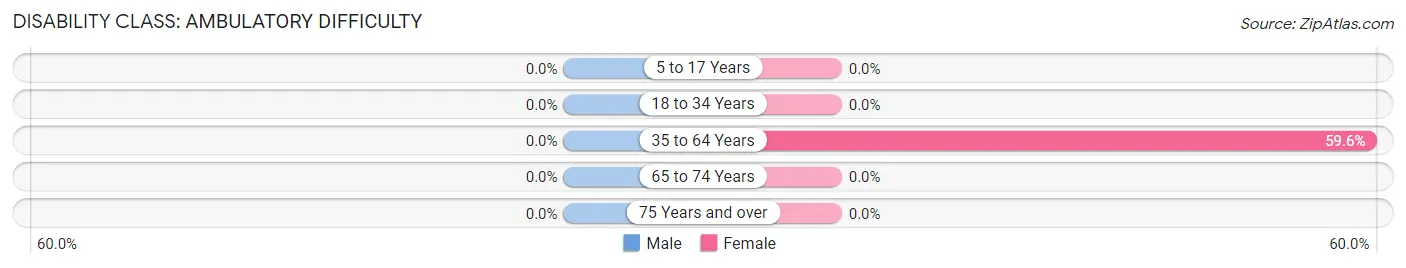
| Age Bracket | Male | Female |
| 5 to 17 Years | 0 (0.0%) | 0 (0.0%) |
| 18 to 34 Years | 0 (0.0%) | 0 (0.0%) |
| 35 to 64 Years | 0 (0.0%) | 195 (59.6%) |
| 65 to 74 Years | 0 (0.0%) | 0 (0.0%) |
| 75 Years and over | 0 (0.0%) | 0 (0.0%) |
Disability Class: Self-Care Difficulty
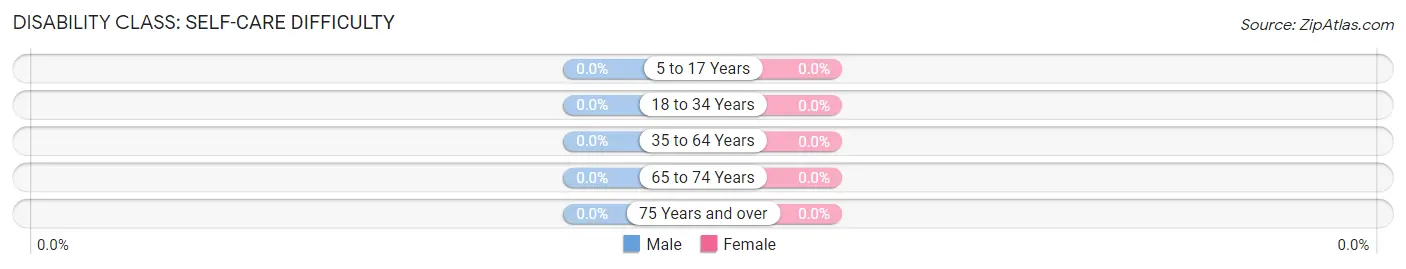
| Age Bracket | Male | Female |
| 5 to 17 Years | 0 (0.0%) | 0 (0.0%) |
| 18 to 34 Years | 0 (0.0%) | 0 (0.0%) |
| 35 to 64 Years | 0 (0.0%) | 0 (0.0%) |
| 65 to 74 Years | 0 (0.0%) | 0 (0.0%) |
| 75 Years and over | 0 (0.0%) | 0 (0.0%) |
Technology Access in Sanbornville
Computing Device Access in Sanbornville
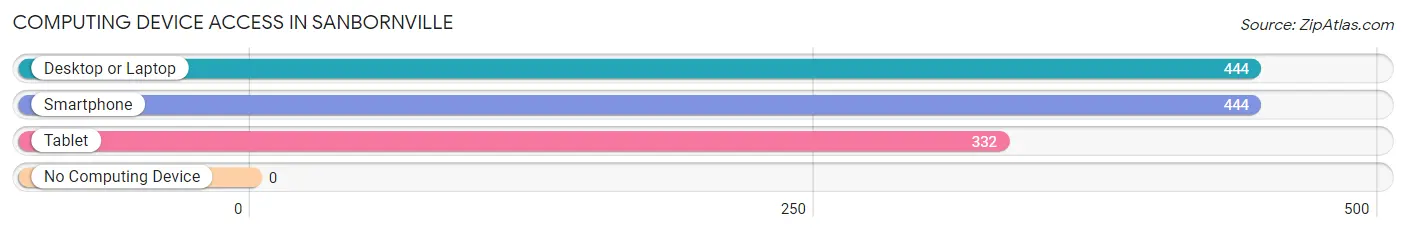
| Device Type | # Households | % Households |
| Desktop or Laptop | 444 | 100.0% |
| Smartphone | 444 | 100.0% |
| Tablet | 332 | 74.8% |
| No Computing Device | 0 | 0.0% |
| Total | 444 | 100.0% |
Internet Access in Sanbornville
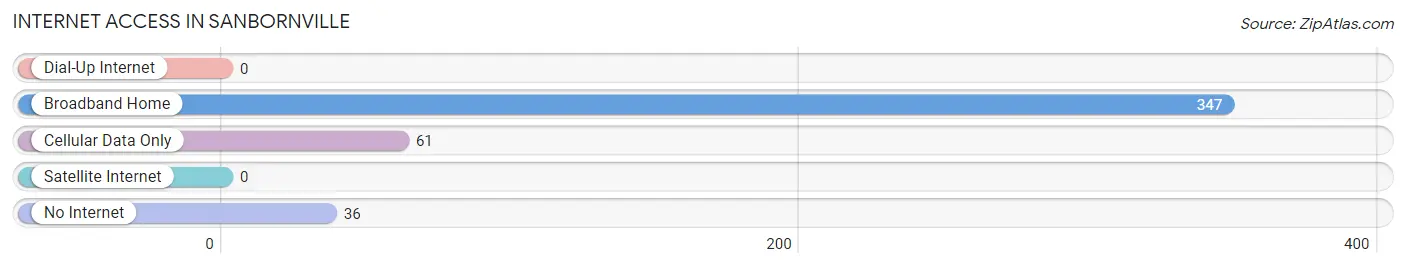
| Internet Type | # Households | % Households |
| Dial-Up Internet | 0 | 0.0% |
| Broadband Home | 347 | 78.1% |
| Cellular Data Only | 61 | 13.7% |
| Satellite Internet | 0 | 0.0% |
| No Internet | 36 | 8.1% |
| Total | 444 | 100.0% |
Sanbornville Summary
Sanbornville is a small town located in the state of New Hampshire, in the United States. It is situated in the northern part of the state, in the county of Carroll. The town is located on the eastern shore of Lake Winnipesaukee, and is part of the Lakes Region of New Hampshire. Sanbornville is bordered by the towns of Wakefield, Milton, and Brookfield.
History
Sanbornville was first settled in 1767 by a group of settlers from Massachusetts. The town was named after the Sanborn family, who were among the first settlers. The town was incorporated in 1790, and was originally part of Wakefield. In 1820, Sanbornville was separated from Wakefield and became its own town.
Geography
Sanbornville is located in the northern part of New Hampshire, in the county of Carroll. The town is situated on the eastern shore of Lake Winnipesaukee, and is part of the Lakes Region of New Hampshire. Sanbornville is bordered by the towns of Wakefield, Milton, and Brookfield. The town has a total area of 11.2 square miles, of which 10.9 square miles is land and 0.3 square miles is water.
Economy
Sanbornville’s economy is largely based on tourism. The town is home to several resorts and hotels, as well as a variety of restaurants and shops. The town is also home to a number of marinas, which provide access to Lake Winnipesaukee. In addition, Sanbornville is home to a number of small businesses, including a lumber mill, a sawmill, and a machine shop.
Demographics
As of the 2010 census, Sanbornville had a population of 1,845. The racial makeup of the town was 97.2% White, 0.7% African American, 0.3% Native American, 0.3% Asian, 0.1% Pacific Islander, 0.2% from other races, and 1.2% from two or more races. Hispanic or Latino of any race were 0.9% of the population.
The median income for a household in Sanbornville was $50,938, and the median income for a family was $60,000. The per capita income for the town was $25,938. About 5.2% of families and 8.2% of the population were below the poverty line, including 10.2% of those under age 18 and 5.2% of those age 65 or over.
Common Questions
What is Per Capita Income in Sanbornville?
Per Capita income in Sanbornville is $44,867.
What is the Median Family Income in Sanbornville?
Median Family Income in Sanbornville is $137,750.
What is the Median Household income in Sanbornville?
Median Household Income in Sanbornville is $133,167.
What is Income or Wage Gap in Sanbornville?
Income or Wage Gap in Sanbornville is 3.7%.
Women in Sanbornville earn 96.3 cents for every dollar earned by a man.
What is Inequality or Gini Index in Sanbornville?
Inequality or Gini Index in Sanbornville is 0.28.
What is the Total Population of Sanbornville?
Total Population of Sanbornville is 919.
What is the Total Male Population of Sanbornville?
Total Male Population of Sanbornville is 485.
What is the Total Female Population of Sanbornville?
Total Female Population of Sanbornville is 434.
What is the Ratio of Males per 100 Females in Sanbornville?
There are 111.75 Males per 100 Females in Sanbornville.
What is the Ratio of Females per 100 Males in Sanbornville?
There are 89.48 Females per 100 Males in Sanbornville.
What is the Median Population Age in Sanbornville?
Median Population Age in Sanbornville is 55.8 Years.
What is the Average Family Size in Sanbornville
Average Family Size in Sanbornville is 2.2 People.
What is the Average Household Size in Sanbornville
Average Household Size in Sanbornville is 2.1 People.
How Large is the Labor Force in Sanbornville?
There are 525 People in the Labor Forcein in Sanbornville.
What is the Percentage of People in the Labor Force in Sanbornville?
61.0% of People are in the Labor Force in Sanbornville.