Antrim, NH Map & Demographics
Antrim Map
Antrim Overview
$38,425
PER CAPITA INCOME
$106,065
AVG FAMILY INCOME
$83,542
AVG HOUSEHOLD INCOME
25.7%
WAGE / INCOME GAP [ % ]
74.3¢/ $1
WAGE / INCOME GAP [ $ ]
0.41
INEQUALITY / GINI INDEX
1,320
TOTAL POPULATION
733
MALE POPULATION
587
FEMALE POPULATION
124.87
MALES / 100 FEMALES
80.08
FEMALES / 100 MALES
41.1
MEDIAN AGE
3.3
AVG FAMILY SIZE
2.6
AVG HOUSEHOLD SIZE
679
LABOR FORCE [ PEOPLE ]
67.3%
PERCENT IN LABOR FORCE
2.2%
UNEMPLOYMENT RATE
Antrim Zip Codes
Antrim Area Codes
Income in Antrim
Income Overview in Antrim
Per Capita Income in Antrim is $38,425, while median incomes of families and households are $106,065 and $83,542 respectively.
| Characteristic | Number | Measure |
| Per Capita Income | 1,320 | $38,425 |
| Median Family Income | 317 | $106,065 |
| Mean Family Income | 317 | $125,986 |
| Median Household Income | 493 | $83,542 |
| Mean Household Income | 493 | $101,620 |
| Income Deficit | 317 | $0 |
| Wage / Income Gap (%) | 1,320 | 25.74% |
| Wage / Income Gap ($) | 1,320 | 74.26¢ per $1 |
| Gini / Inequality Index | 1,320 | 0.41 |
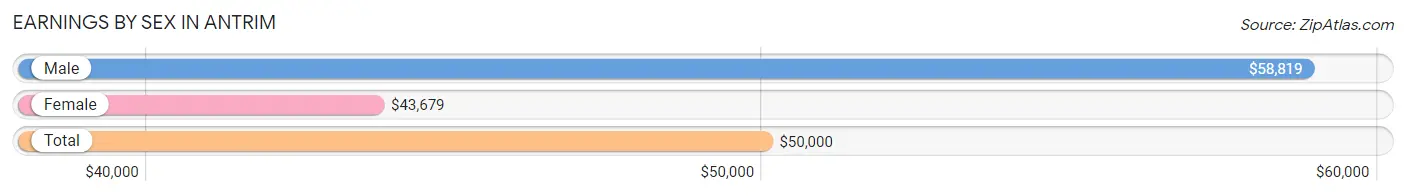
Earnings by Sex in Antrim
Average Earnings in Antrim are $50,000, $58,819 for men and $43,679 for women, a difference of 25.7%.
| Sex | Number | Average Earnings |
| Male | 377 (53.4%) | $58,819 |
| Female | 329 (46.6%) | $43,679 |
| Total | 706 (100.0%) | $50,000 |
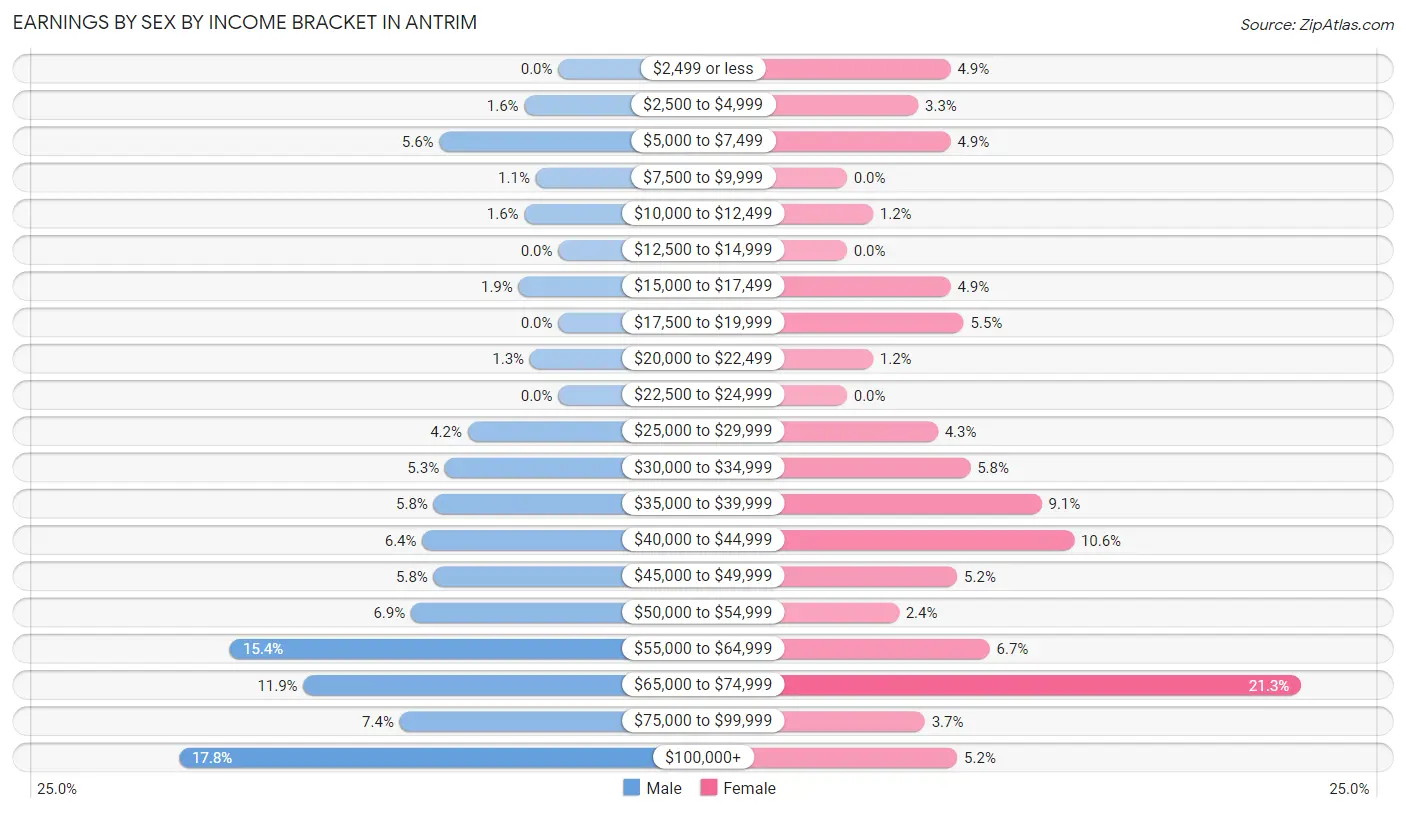
Earnings by Sex by Income Bracket in Antrim
The most common earnings brackets in Antrim are $100,000+ for men (67 | 17.8%) and $65,000 to $74,999 for women (70 | 21.3%).
| Income | Male | Female |
| $2,499 or less | 0 (0.0%) | 16 (4.9%) |
| $2,500 to $4,999 | 6 (1.6%) | 11 (3.3%) |
| $5,000 to $7,499 | 21 (5.6%) | 16 (4.9%) |
| $7,500 to $9,999 | 4 (1.1%) | 0 (0.0%) |
| $10,000 to $12,499 | 6 (1.6%) | 4 (1.2%) |
| $12,500 to $14,999 | 0 (0.0%) | 0 (0.0%) |
| $15,000 to $17,499 | 7 (1.9%) | 16 (4.9%) |
| $17,500 to $19,999 | 0 (0.0%) | 18 (5.5%) |
| $20,000 to $22,499 | 5 (1.3%) | 4 (1.2%) |
| $22,500 to $24,999 | 0 (0.0%) | 0 (0.0%) |
| $25,000 to $29,999 | 16 (4.2%) | 14 (4.3%) |
| $30,000 to $34,999 | 20 (5.3%) | 19 (5.8%) |
| $35,000 to $39,999 | 22 (5.8%) | 30 (9.1%) |
| $40,000 to $44,999 | 24 (6.4%) | 35 (10.6%) |
| $45,000 to $49,999 | 22 (5.8%) | 17 (5.2%) |
| $50,000 to $54,999 | 26 (6.9%) | 8 (2.4%) |
| $55,000 to $64,999 | 58 (15.4%) | 22 (6.7%) |
| $65,000 to $74,999 | 45 (11.9%) | 70 (21.3%) |
| $75,000 to $99,999 | 28 (7.4%) | 12 (3.6%) |
| $100,000+ | 67 (17.8%) | 17 (5.2%) |
| Total | 377 (100.0%) | 329 (100.0%) |
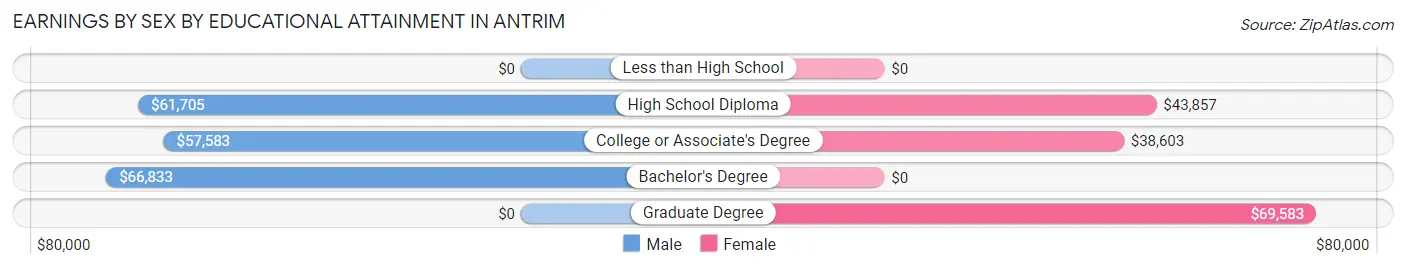
Earnings by Sex by Educational Attainment in Antrim
Average earnings in Antrim are $60,556 for men and $44,393 for women, a difference of 26.7%. Men with an educational attainment of bachelor's degree enjoy the highest average annual earnings of $66,833, while those with college or associate's degree education earn the least with $57,583. Women with an educational attainment of graduate degree earn the most with the average annual earnings of $69,583, while those with college or associate's degree education have the smallest earnings of $38,603.
| Educational Attainment | Male Income | Female Income |
| Less than High School | - | - |
| High School Diploma | $61,705 | $43,857 |
| College or Associate's Degree | $57,583 | $38,603 |
| Bachelor's Degree | $66,833 | $0 |
| Graduate Degree | - | - |
| Total | $60,556 | $44,393 |
Family Income in Antrim
Family Income Brackets in Antrim
According to the Antrim family income data, there are 80 families falling into the $100,000 to $149,999 income range, which is the most common income bracket and makes up 25.2% of all families.
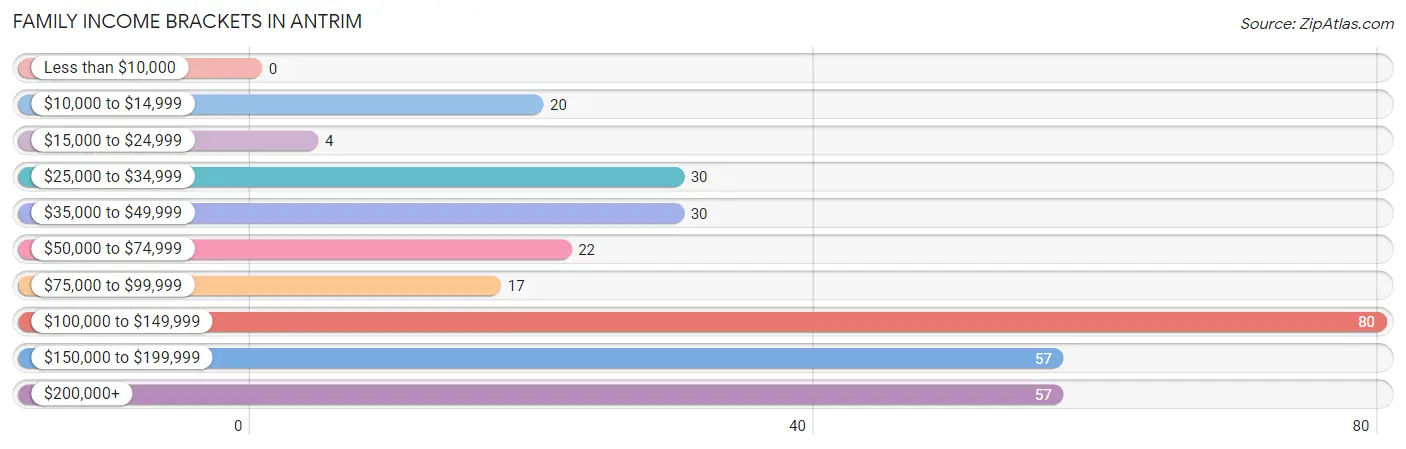
| Income Bracket | # Families | % Families |
| Less than $10,000 | 0 | 0.0% |
| $10,000 to $14,999 | 20 | 6.3% |
| $15,000 to $24,999 | 4 | 1.3% |
| $25,000 to $34,999 | 30 | 9.5% |
| $35,000 to $49,999 | 30 | 9.5% |
| $50,000 to $74,999 | 22 | 6.9% |
| $75,000 to $99,999 | 17 | 5.4% |
| $100,000 to $149,999 | 80 | 25.2% |
| $150,000 to $199,999 | 57 | 18.0% |
| $200,000+ | 57 | 18.0% |
Family Income by Famaliy Size in Antrim
5-person families (36 | 11.4%) account for the highest median family income in Antrim with $111,875 per family, while 2-person families (145 | 45.7%) have the highest median income of $52,188 per family member.
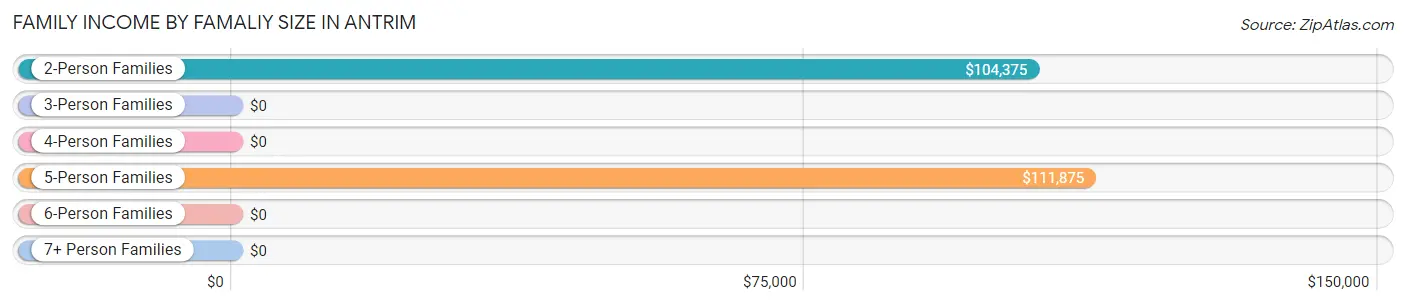
| Income Bracket | # Families | Median Income |
| 2-Person Families | 145 (45.7%) | $104,375 |
| 3-Person Families | 83 (26.2%) | $0 |
| 4-Person Families | 26 (8.2%) | $0 |
| 5-Person Families | 36 (11.4%) | $111,875 |
| 6-Person Families | 4 (1.3%) | $0 |
| 7+ Person Families | 23 (7.3%) | $0 |
| Total | 317 (100.0%) | $106,065 |
Family Income by Number of Earners in Antrim
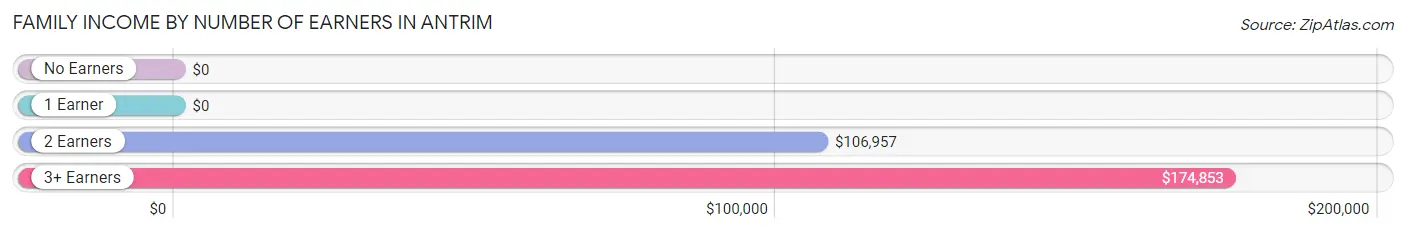
| Number of Earners | # Families | Median Income |
| No Earners | 49 (15.5%) | $0 |
| 1 Earner | 66 (20.8%) | $0 |
| 2 Earners | 136 (42.9%) | $106,957 |
| 3+ Earners | 66 (20.8%) | $174,853 |
| Total | 317 (100.0%) | $106,065 |
Household Income in Antrim
Household Income Brackets in Antrim
With 105 households falling in the category, the $100,000 to $149,999 income range is the most frequent in Antrim, accounting for 21.3% of all households. In contrast, only 4 households (0.8%) fall into the less than $10,000 income bracket, making it the least populous group.
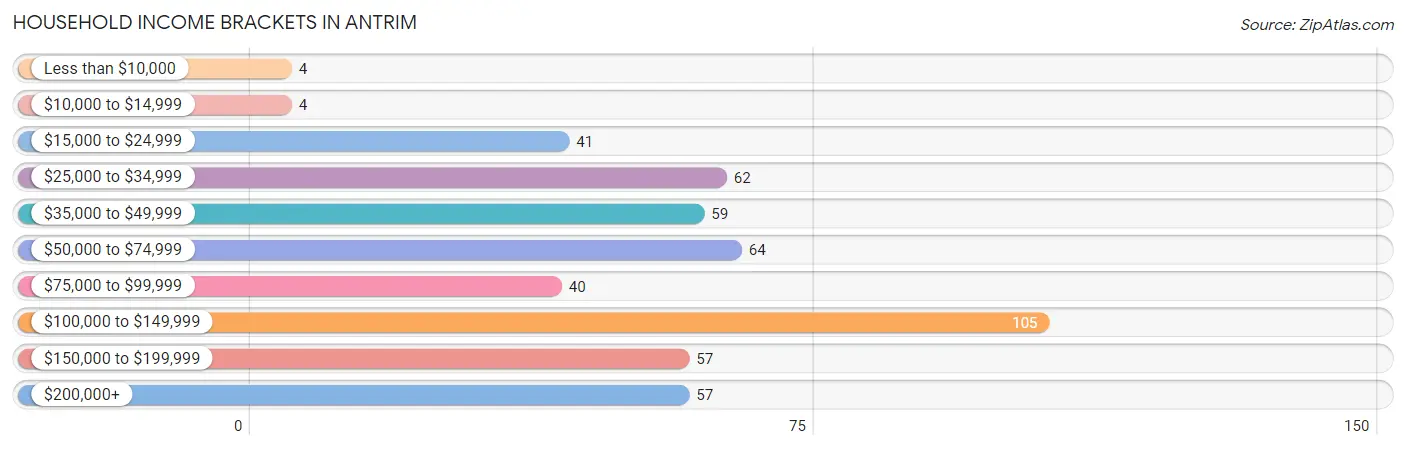
| Income Bracket | # Households | % Households |
| Less than $10,000 | 4 | 0.8% |
| $10,000 to $14,999 | 4 | 0.8% |
| $15,000 to $24,999 | 41 | 8.3% |
| $25,000 to $34,999 | 62 | 12.6% |
| $35,000 to $49,999 | 59 | 12.0% |
| $50,000 to $74,999 | 64 | 13.0% |
| $75,000 to $99,999 | 40 | 8.1% |
| $100,000 to $149,999 | 105 | 21.3% |
| $150,000 to $199,999 | 57 | 11.6% |
| $200,000+ | 57 | 11.6% |
Household Income by Householder Age in Antrim
The median household income in Antrim is $83,542, with the highest median household income of $106,304 found in the 45 to 64 years age bracket for the primary householder. A total of 212 households (43.0%) fall into this category. Meanwhile, the 15 to 24 years age bracket for the primary householder has the lowest median household income of $0, with 4 households (0.8%) in this group.
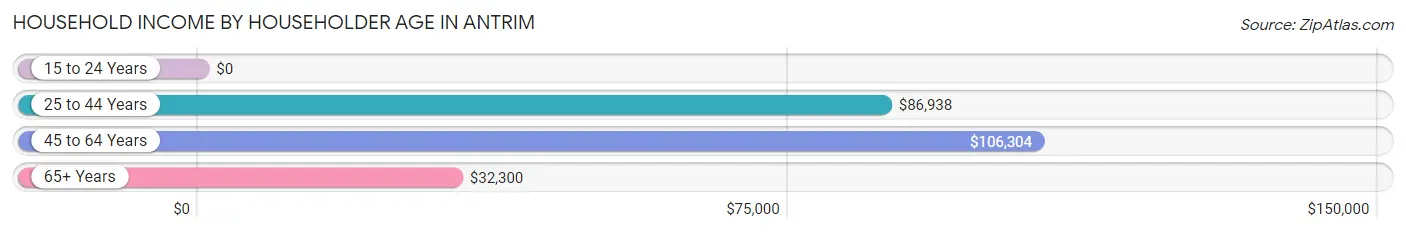
| Income Bracket | # Households | Median Income |
| 15 to 24 Years | 4 (0.8%) | $0 |
| 25 to 44 Years | 137 (27.8%) | $86,938 |
| 45 to 64 Years | 212 (43.0%) | $106,304 |
| 65+ Years | 140 (28.4%) | $32,300 |
| Total | 493 (100.0%) | $83,542 |
Poverty in Antrim
Income Below Poverty by Sex and Age in Antrim
With 9.0% poverty level for males and 5.3% for females among the residents of Antrim, under 5 year old males and 18 to 24 year old females are the most vulnerable to poverty, with 19 males (36.5%) and 4 females (33.3%) in their respective age groups living below the poverty level.
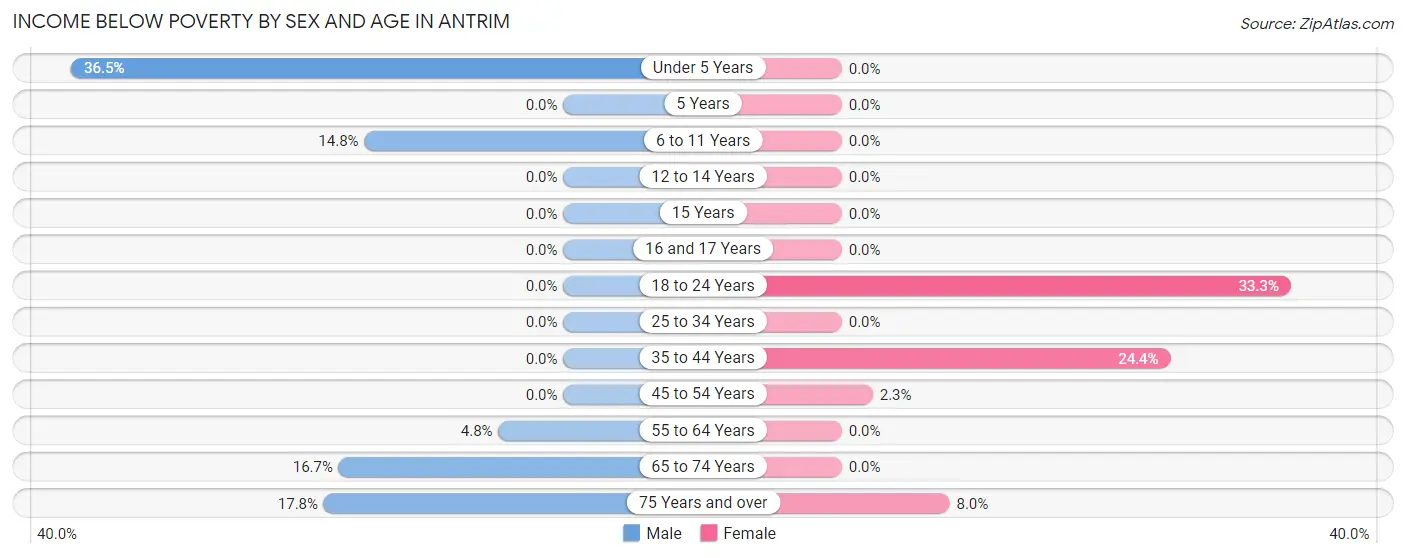
| Age Bracket | Male | Female |
| Under 5 Years | 19 (36.5%) | 0 (0.0%) |
| 5 Years | 0 (0.0%) | 0 (0.0%) |
| 6 to 11 Years | 22 (14.8%) | 0 (0.0%) |
| 12 to 14 Years | 0 (0.0%) | 0 (0.0%) |
| 15 Years | 0 (0.0%) | 0 (0.0%) |
| 16 and 17 Years | 0 (0.0%) | 0 (0.0%) |
| 18 to 24 Years | 0 (0.0%) | 4 (33.3%) |
| 25 to 34 Years | 0 (0.0%) | 0 (0.0%) |
| 35 to 44 Years | 0 (0.0%) | 20 (24.4%) |
| 45 to 54 Years | 0 (0.0%) | 2 (2.3%) |
| 55 to 64 Years | 4 (4.8%) | 0 (0.0%) |
| 65 to 74 Years | 13 (16.7%) | 0 (0.0%) |
| 75 Years and over | 8 (17.8%) | 4 (8.0%) |
| Total | 66 (9.0%) | 30 (5.3%) |
Income Above Poverty by Sex and Age in Antrim
According to the poverty statistics in Antrim, males aged 5 years and females aged under 5 years are the age groups that are most secure financially, with 100.0% of males and 100.0% of females in these age groups living above the poverty line.
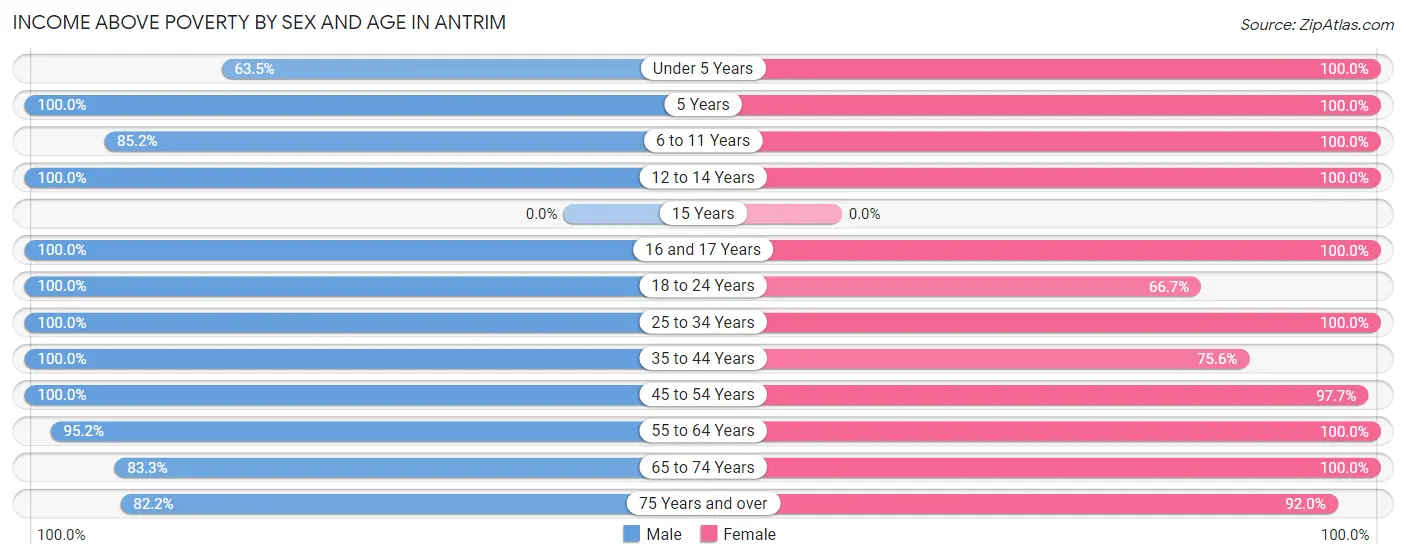
| Age Bracket | Male | Female |
| Under 5 Years | 33 (63.5%) | 23 (100.0%) |
| 5 Years | 18 (100.0%) | 4 (100.0%) |
| 6 to 11 Years | 127 (85.2%) | 26 (100.0%) |
| 12 to 14 Years | 9 (100.0%) | 16 (100.0%) |
| 15 Years | 0 (0.0%) | 0 (0.0%) |
| 16 and 17 Years | 10 (100.0%) | 8 (100.0%) |
| 18 to 24 Years | 23 (100.0%) | 8 (66.7%) |
| 25 to 34 Years | 110 (100.0%) | 81 (100.0%) |
| 35 to 44 Years | 46 (100.0%) | 62 (75.6%) |
| 45 to 54 Years | 108 (100.0%) | 85 (97.7%) |
| 55 to 64 Years | 79 (95.2%) | 111 (100.0%) |
| 65 to 74 Years | 65 (83.3%) | 68 (100.0%) |
| 75 Years and over | 37 (82.2%) | 46 (92.0%) |
| Total | 665 (91.0%) | 538 (94.7%) |
Income Below Poverty Among Married-Couple Families in Antrim
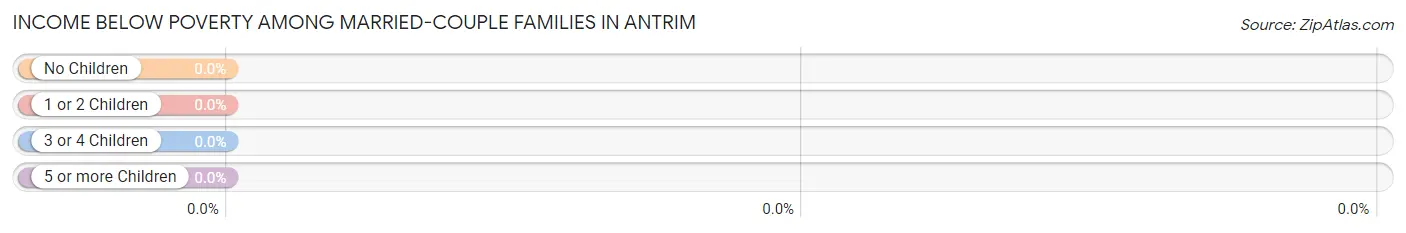
| Children | Above Poverty | Below Poverty |
| No Children | 170 (100.0%) | 0 (0.0%) |
| 1 or 2 Children | 66 (100.0%) | 0 (0.0%) |
| 3 or 4 Children | 33 (100.0%) | 0 (0.0%) |
| 5 or more Children | 6 (100.0%) | 0 (0.0%) |
| Total | 275 (100.0%) | 0 (0.0%) |
Income Below Poverty Among Single-Parent Households in Antrim
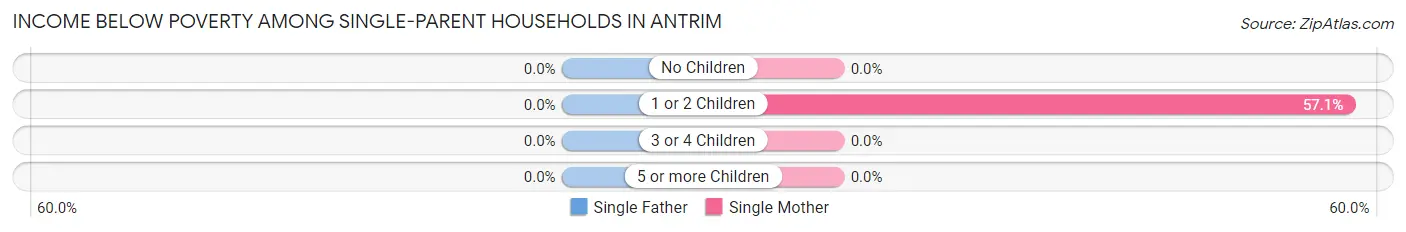
| Children | Single Father | Single Mother |
| No Children | 0 (0.0%) | 0 (0.0%) |
| 1 or 2 Children | 0 (0.0%) | 20 (57.1%) |
| 3 or 4 Children | 0 (0.0%) | 0 (0.0%) |
| 5 or more Children | 0 (0.0%) | 0 (0.0%) |
| Total | 0 (0.0%) | 20 (47.6%) |
Income Below Poverty Among Married-Couple vs Single-Parent Households in Antrim
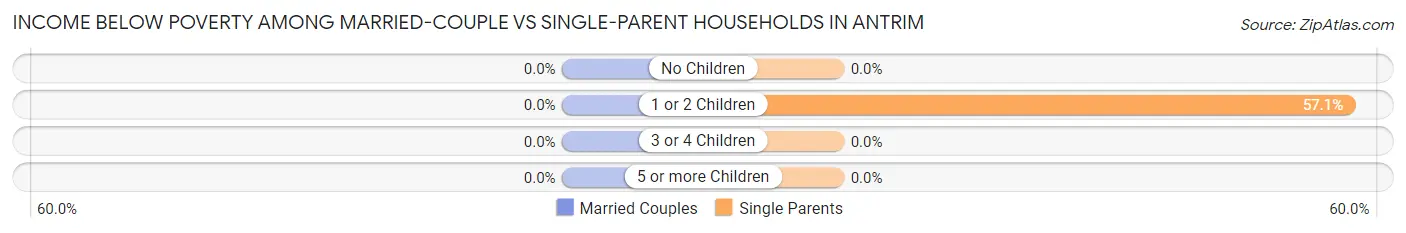
| Children | Married-Couple Families | Single-Parent Households |
| No Children | 0 (0.0%) | 0 (0.0%) |
| 1 or 2 Children | 0 (0.0%) | 20 (57.1%) |
| 3 or 4 Children | 0 (0.0%) | 0 (0.0%) |
| 5 or more Children | 0 (0.0%) | 0 (0.0%) |
| Total | 0 (0.0%) | 20 (47.6%) |
Race in Antrim
The most populous races in Antrim are White / Caucasian (1,275 | 96.6%), Two or more Races (41 | 3.1%), and Hispanic or Latino (27 | 2.1%).
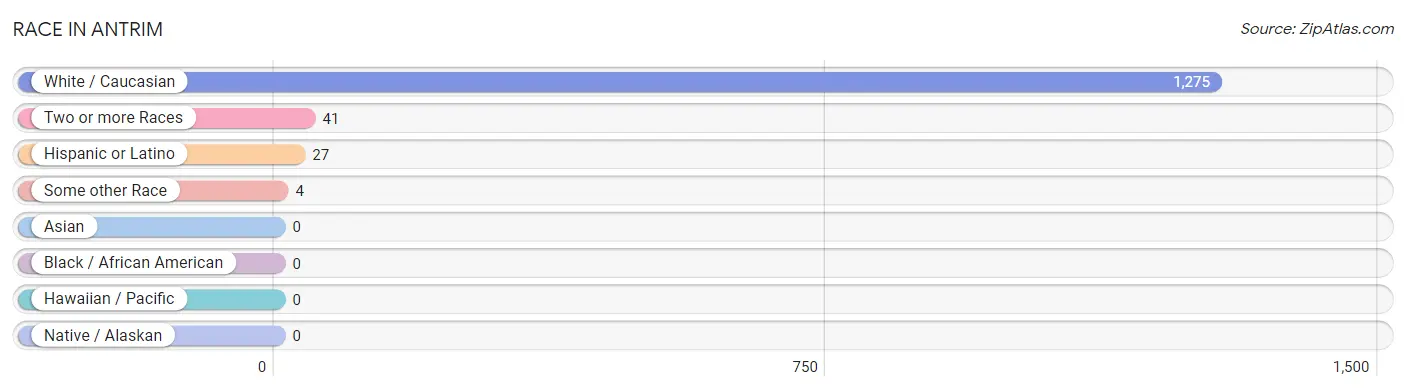
| Race | # Population | % Population |
| Asian | 0 | 0.0% |
| Black / African American | 0 | 0.0% |
| Hawaiian / Pacific | 0 | 0.0% |
| Hispanic or Latino | 27 | 2.1% |
| Native / Alaskan | 0 | 0.0% |
| White / Caucasian | 1,275 | 96.6% |
| Two or more Races | 41 | 3.1% |
| Some other Race | 4 | 0.3% |
| Total | 1,320 | 100.0% |
Ancestry in Antrim
The most populous ancestries reported in Antrim are English (325 | 24.6%), Irish (193 | 14.6%), French (131 | 9.9%), American (115 | 8.7%), and Scottish (79 | 6.0%), together accounting for 63.8% of all Antrim residents.
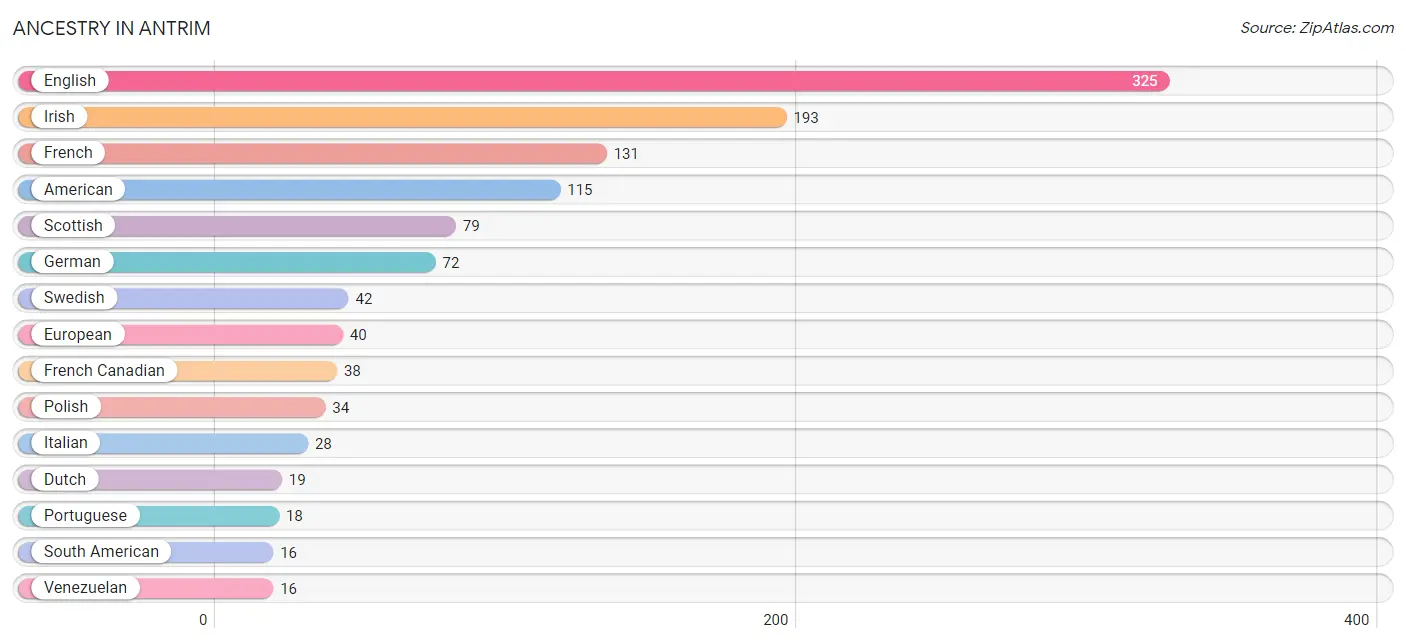
| Ancestry | # Population | % Population |
| American | 115 | 8.7% |
| Arab | 3 | 0.2% |
| Belgian | 4 | 0.3% |
| British | 9 | 0.7% |
| Canadian | 14 | 1.1% |
| Dutch | 19 | 1.4% |
| English | 325 | 24.6% |
| European | 40 | 3.0% |
| French | 131 | 9.9% |
| French Canadian | 38 | 2.9% |
| German | 72 | 5.4% |
| Greek | 3 | 0.2% |
| Hungarian | 13 | 1.0% |
| Irish | 193 | 14.6% |
| Italian | 28 | 2.1% |
| Maltese | 12 | 0.9% |
| Northern European | 7 | 0.5% |
| Pennsylvania German | 5 | 0.4% |
| Polish | 34 | 2.6% |
| Portuguese | 18 | 1.4% |
| Puerto Rican | 11 | 0.8% |
| Scandinavian | 7 | 0.5% |
| Scotch-Irish | 6 | 0.4% |
| Scottish | 79 | 6.0% |
| South American | 16 | 1.2% |
| Swedish | 42 | 3.2% |
| Syrian | 3 | 0.2% |
| Venezuelan | 16 | 1.2% | View All 28 Rows |
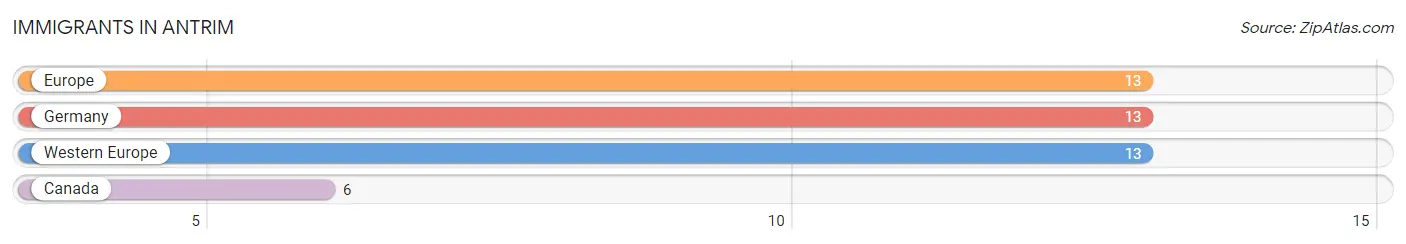
Immigrants in Antrim
The most numerous immigrant groups reported in Antrim came from Europe (13 | 1.0%), Germany (13 | 1.0%), Western Europe (13 | 1.0%), and Canada (6 | 0.4%), together accounting for 3.4% of all Antrim residents.
| Immigration Origin | # Population | % Population |
| Canada | 6 | 0.4% |
| Europe | 13 | 1.0% |
| Germany | 13 | 1.0% |
| Western Europe | 13 | 1.0% | View All 4 Rows |
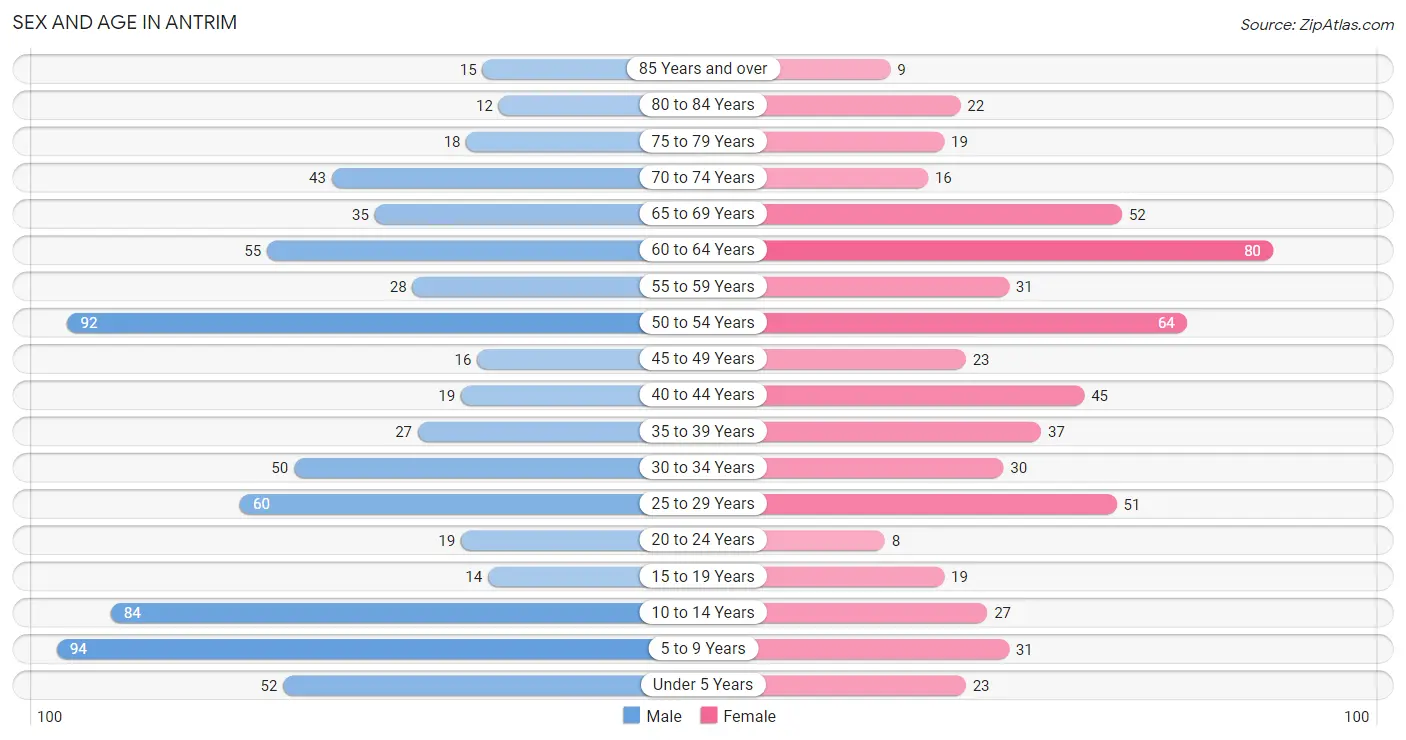
Sex and Age in Antrim
Sex and Age in Antrim
The most populous age groups in Antrim are 5 to 9 Years (94 | 12.8%) for men and 60 to 64 Years (80 | 13.6%) for women.
| Age Bracket | Male | Female |
| Under 5 Years | 52 (7.1%) | 23 (3.9%) |
| 5 to 9 Years | 94 (12.8%) | 31 (5.3%) |
| 10 to 14 Years | 84 (11.5%) | 27 (4.6%) |
| 15 to 19 Years | 14 (1.9%) | 19 (3.2%) |
| 20 to 24 Years | 19 (2.6%) | 8 (1.4%) |
| 25 to 29 Years | 60 (8.2%) | 51 (8.7%) |
| 30 to 34 Years | 50 (6.8%) | 30 (5.1%) |
| 35 to 39 Years | 27 (3.7%) | 37 (6.3%) |
| 40 to 44 Years | 19 (2.6%) | 45 (7.7%) |
| 45 to 49 Years | 16 (2.2%) | 23 (3.9%) |
| 50 to 54 Years | 92 (12.6%) | 64 (10.9%) |
| 55 to 59 Years | 28 (3.8%) | 31 (5.3%) |
| 60 to 64 Years | 55 (7.5%) | 80 (13.6%) |
| 65 to 69 Years | 35 (4.8%) | 52 (8.9%) |
| 70 to 74 Years | 43 (5.9%) | 16 (2.7%) |
| 75 to 79 Years | 18 (2.5%) | 19 (3.2%) |
| 80 to 84 Years | 12 (1.6%) | 22 (3.7%) |
| 85 Years and over | 15 (2.1%) | 9 (1.5%) |
| Total | 733 (100.0%) | 587 (100.0%) |
Families and Households in Antrim
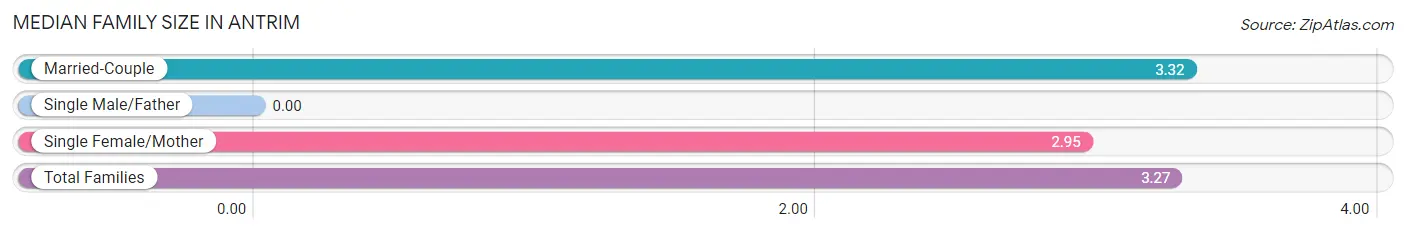
Median Family Size in Antrim
| Family Type | # Families | Family Size |
| Married-Couple | 275 (86.8%) | 3.32 |
| Single Male/Father | 0 (0.0%) | - |
| Single Female/Mother | 42 (13.3%) | 2.95 |
| Total Families | 317 (100.0%) | 3.27 |
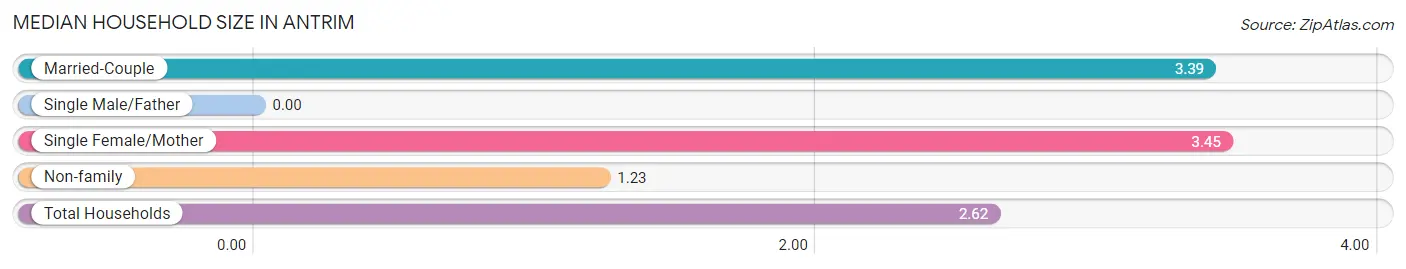
Median Household Size in Antrim
| Household Type | # Households | Household Size |
| Married-Couple | 275 (55.8%) | 3.39 |
| Single Male/Father | 0 (0.0%) | - |
| Single Female/Mother | 42 (8.5%) | 3.45 |
| Non-family | 176 (35.7%) | 1.23 |
| Total Households | 493 (100.0%) | 2.62 |
Household Size by Marriage Status in Antrim
Out of a total of 493 households in Antrim, 317 (64.3%) are family households, while 176 (35.7%) are nonfamily households. The most numerous type of family households are 2-person households, comprising 138, and the most common type of nonfamily households are 1-person households, comprising 146.
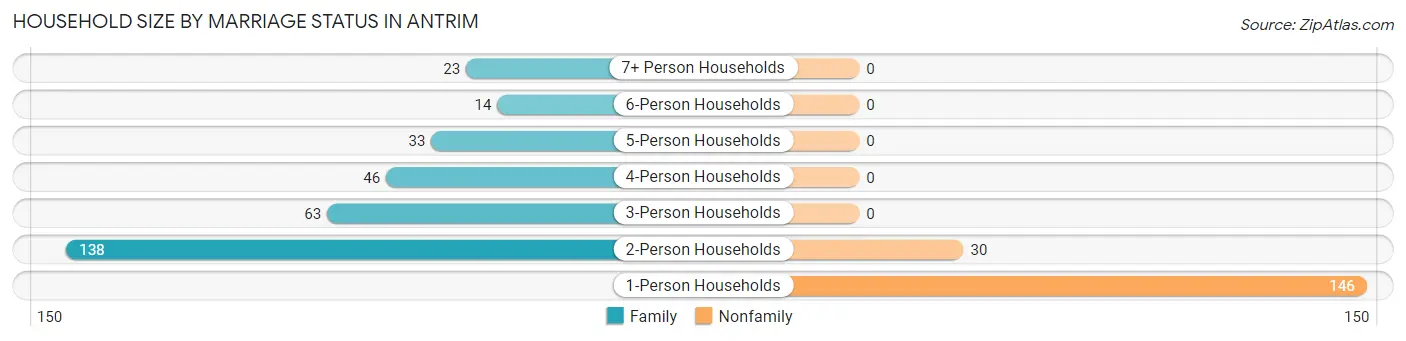
| Household Size | Family Households | Nonfamily Households |
| 1-Person Households | - | 146 (29.6%) |
| 2-Person Households | 138 (28.0%) | 30 (6.1%) |
| 3-Person Households | 63 (12.8%) | 0 (0.0%) |
| 4-Person Households | 46 (9.3%) | 0 (0.0%) |
| 5-Person Households | 33 (6.7%) | 0 (0.0%) |
| 6-Person Households | 14 (2.8%) | 0 (0.0%) |
| 7+ Person Households | 23 (4.7%) | 0 (0.0%) |
| Total | 317 (64.3%) | 176 (35.7%) |
Female Fertility in Antrim
Fertility by Age in Antrim
Average fertility rate in Antrim is 23.0 births per 1,000 women. Women in the age bracket of 20 to 34 years have the highest fertility rate with 56.0 births per 1,000 women. Women in the age bracket of 20 to 34 years acount for 100.0% of all women with births.
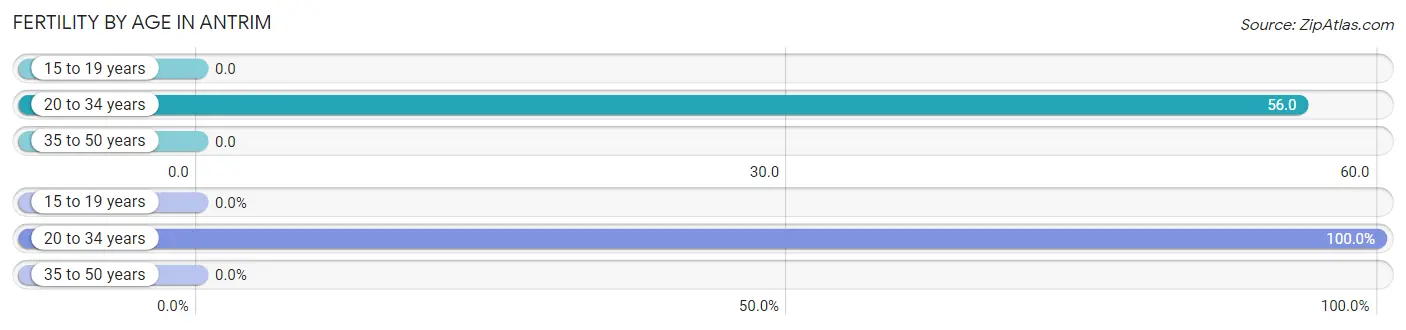
| Age Bracket | Women with Births | Births / 1,000 Women |
| 15 to 19 years | 0 (0.0%) | 0.0 |
| 20 to 34 years | 5 (100.0%) | 56.0 |
| 35 to 50 years | 0 (0.0%) | 0.0 |
| Total | 5 (100.0%) | 23.0 |
Fertility by Age by Marriage Status in Antrim
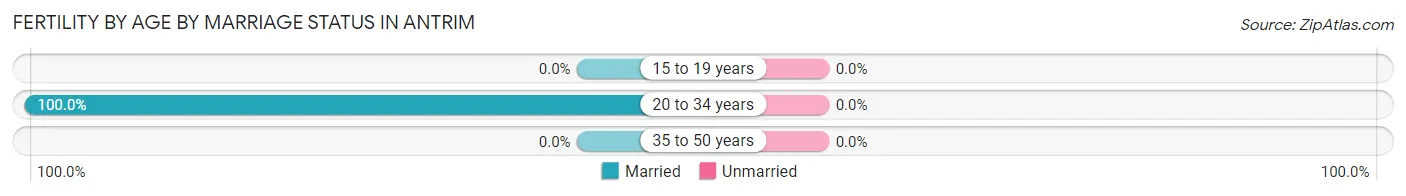
| Age Bracket | Married | Unmarried |
| 15 to 19 years | 0 (0.0%) | 0 (0.0%) |
| 20 to 34 years | 5 (100.0%) | 0 (0.0%) |
| 35 to 50 years | 0 (0.0%) | 0 (0.0%) |
| Total | 5 (100.0%) | 0 (0.0%) |
Fertility by Education in Antrim
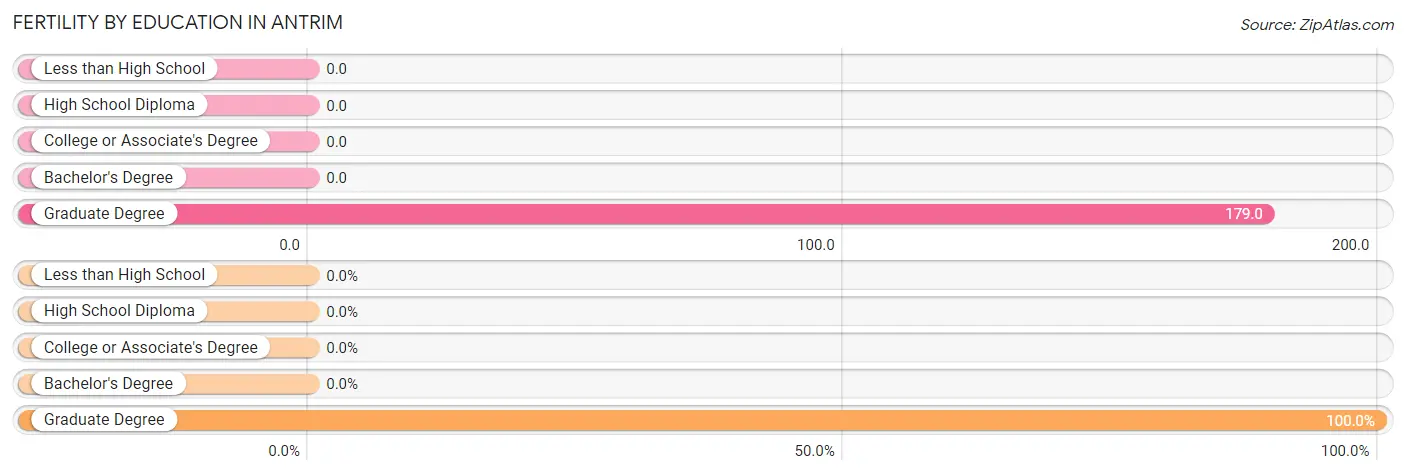
| Educational Attainment | Women with Births | Births / 1,000 Women |
| Less than High School | 0 (0.0%) | 0.0 |
| High School Diploma | 0 (0.0%) | 0.0 |
| College or Associate's Degree | 0 (0.0%) | 0.0 |
| Bachelor's Degree | 0 (0.0%) | 0.0 |
| Graduate Degree | 5 (100.0%) | 179.0 |
| Total | 5 (100.0%) | 23.0 |
Fertility by Education by Marriage Status in Antrim
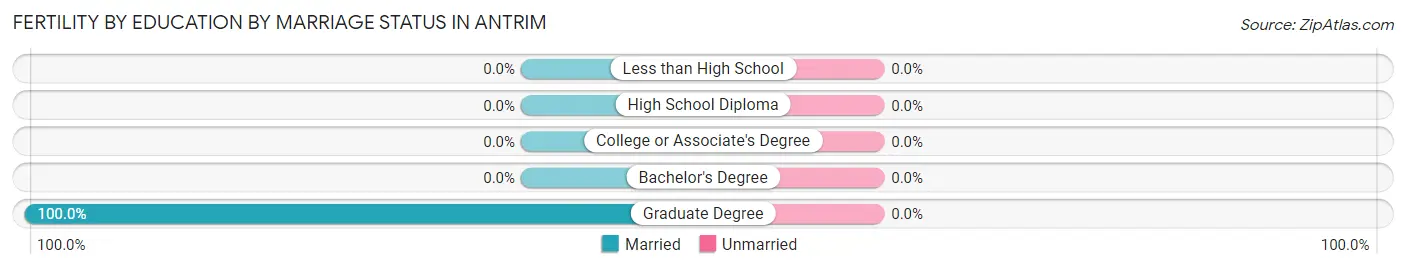
| Educational Attainment | Married | Unmarried |
| Less than High School | 0 (0.0%) | 0 (0.0%) |
| High School Diploma | 0 (0.0%) | 0 (0.0%) |
| College or Associate's Degree | 0 (0.0%) | 0 (0.0%) |
| Bachelor's Degree | 0 (0.0%) | 0 (0.0%) |
| Graduate Degree | 5 (100.0%) | 0 (0.0%) |
| Total | 5 (100.0%) | 0 (0.0%) |
Employment Characteristics in Antrim
Employment by Class of Employer in Antrim
Among the 664 employed individuals in Antrim, private company employees (393 | 59.2%), not-for-profit organizations (111 | 16.7%), and self-employed (not incorporated) (71 | 10.7%) make up the most common classes of employment.
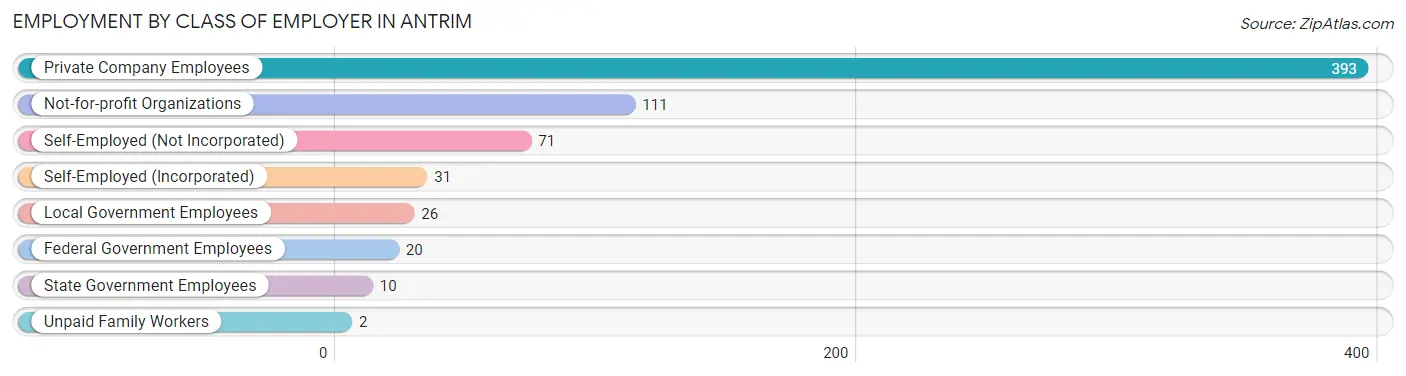
| Employer Class | # Employees | % Employees |
| Private Company Employees | 393 | 59.2% |
| Self-Employed (Incorporated) | 31 | 4.7% |
| Self-Employed (Not Incorporated) | 71 | 10.7% |
| Not-for-profit Organizations | 111 | 16.7% |
| Local Government Employees | 26 | 3.9% |
| State Government Employees | 10 | 1.5% |
| Federal Government Employees | 20 | 3.0% |
| Unpaid Family Workers | 2 | 0.3% |
| Total | 664 | 100.0% |
Employment Status by Age in Antrim
According to the labor force statistics for Antrim, out of the total population over 16 years of age (1,009), 67.3% or 679 individuals are in the labor force, with 2.2% or 15 of them unemployed. The age group with the highest labor force participation rate is 20 to 24 years, with 100.0% or 27 individuals in the labor force. Within the labor force, the 25 to 29 years age range has the highest percentage of unemployed individuals, with 16.5% or 15 of them being unemployed.
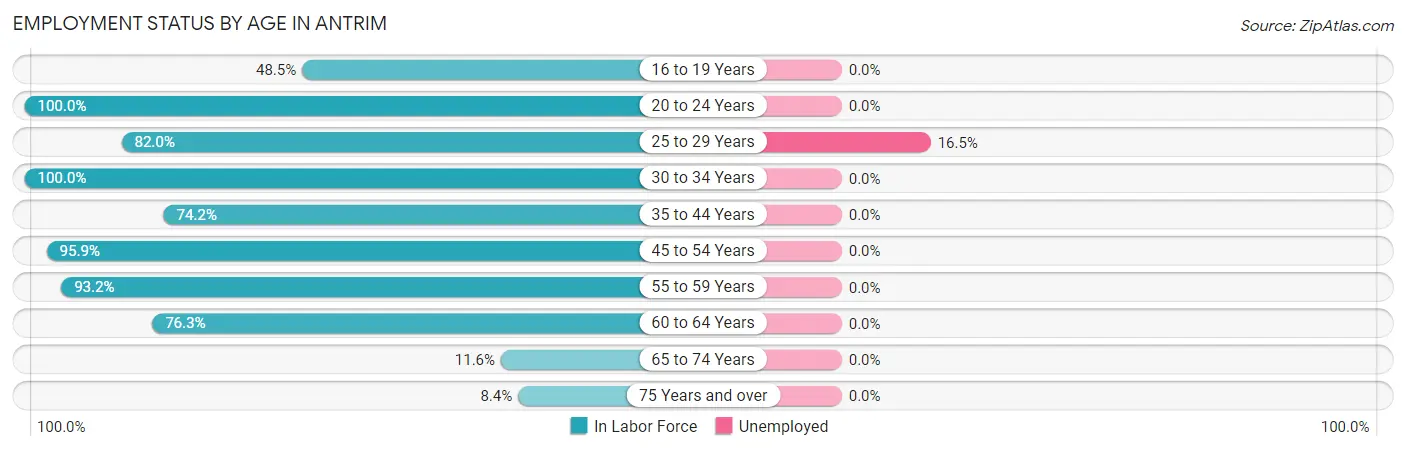
| Age Bracket | In Labor Force | Unemployed |
| 16 to 19 Years | 16 (48.5%) | 0 (0.0%) |
| 20 to 24 Years | 27 (100.0%) | 0 (0.0%) |
| 25 to 29 Years | 91 (82.0%) | 15 (16.5%) |
| 30 to 34 Years | 80 (100.0%) | 0 (0.0%) |
| 35 to 44 Years | 95 (74.2%) | 0 (0.0%) |
| 45 to 54 Years | 187 (95.9%) | 0 (0.0%) |
| 55 to 59 Years | 55 (93.2%) | 0 (0.0%) |
| 60 to 64 Years | 103 (76.3%) | 0 (0.0%) |
| 65 to 74 Years | 17 (11.6%) | 0 (0.0%) |
| 75 Years and over | 8 (8.4%) | 0 (0.0%) |
| Total | 679 (67.3%) | 15 (2.2%) |
Employment Status by Educational Attainment in Antrim
According to labor force statistics for Antrim, 86.3% of individuals (611) out of the total population between 25 and 64 years of age (708) are in the labor force, with 2.5% or 15 of them being unemployed. The group with the highest labor force participation rate are those with the educational attainment of bachelor's degree or higher, with 98.6% or 208 individuals in the labor force. Within the labor force, individuals with college / associate degree education have the highest percentage of unemployment, with 8.6% or 15 of them being unemployed.
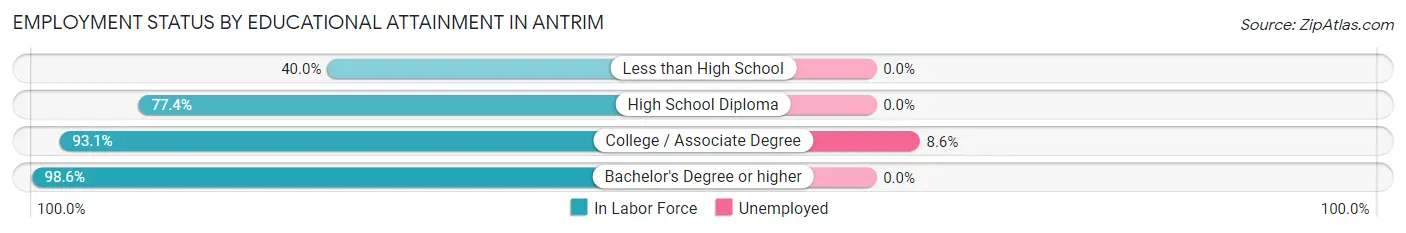
| Educational Attainment | In Labor Force | Unemployed |
| Less than High School | 12 (40.0%) | 0 (0.0%) |
| High School Diploma | 216 (77.4%) | 0 (0.0%) |
| College / Associate Degree | 175 (93.1%) | 16 (8.6%) |
| Bachelor's Degree or higher | 208 (98.6%) | 0 (0.0%) |
| Total | 611 (86.3%) | 18 (2.5%) |
Employment Occupations by Sex in Antrim
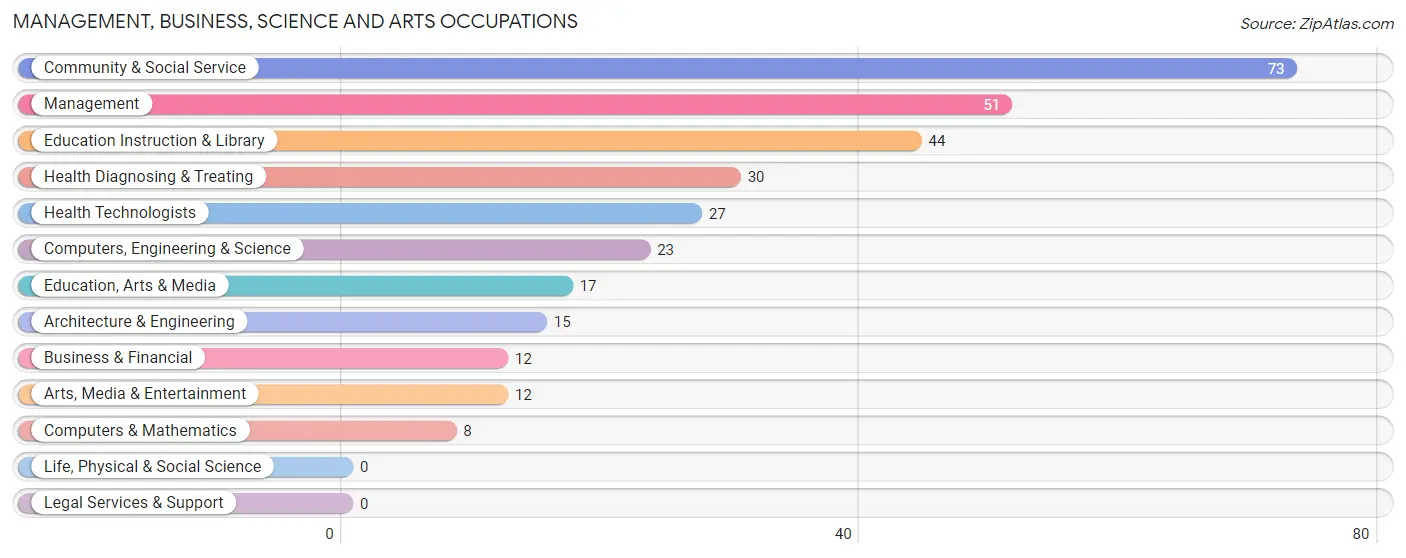
Management, Business, Science and Arts Occupations
The most common Management, Business, Science and Arts occupations in Antrim are Community & Social Service (73 | 11.0%), Management (51 | 7.7%), Education Instruction & Library (44 | 6.6%), Health Diagnosing & Treating (30 | 4.5%), and Health Technologists (27 | 4.1%).
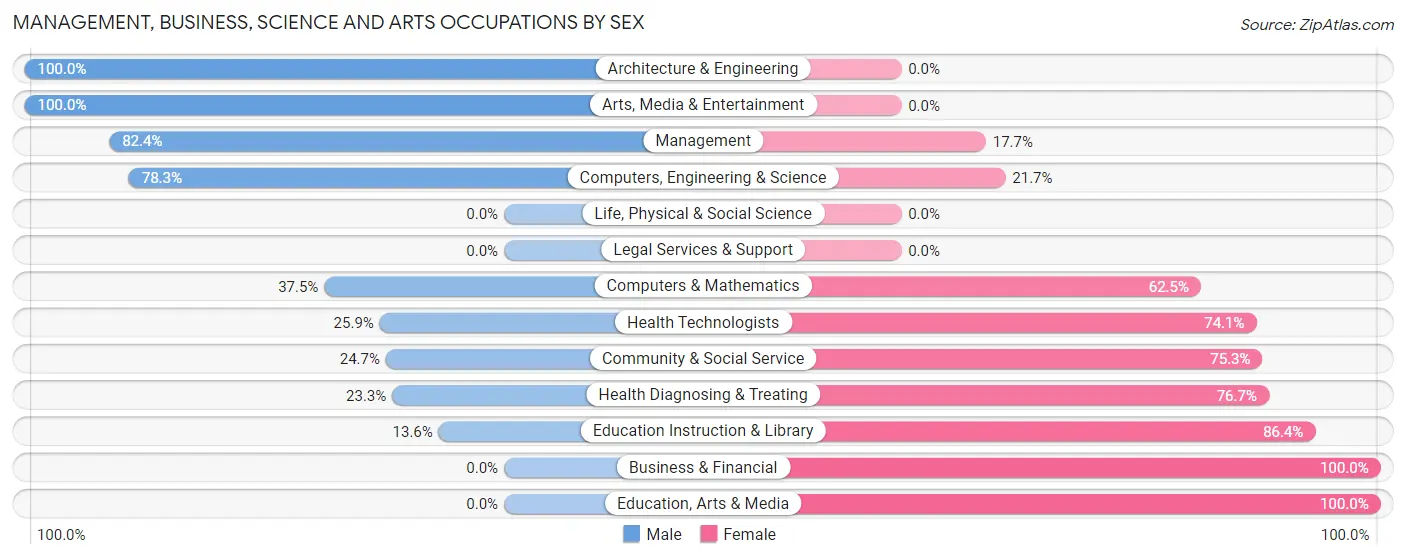
Management, Business, Science and Arts Occupations by Sex
Within the Management, Business, Science and Arts occupations in Antrim, the most male-oriented occupations are Architecture & Engineering (100.0%), Arts, Media & Entertainment (100.0%), and Management (82.4%), while the most female-oriented occupations are Business & Financial (100.0%), Education, Arts & Media (100.0%), and Education Instruction & Library (86.4%).
| Occupation | Male | Female |
| Management | 42 (82.4%) | 9 (17.6%) |
| Business & Financial | 0 (0.0%) | 12 (100.0%) |
| Computers, Engineering & Science | 18 (78.3%) | 5 (21.7%) |
| Computers & Mathematics | 3 (37.5%) | 5 (62.5%) |
| Architecture & Engineering | 15 (100.0%) | 0 (0.0%) |
| Life, Physical & Social Science | 0 (0.0%) | 0 (0.0%) |
| Community & Social Service | 18 (24.7%) | 55 (75.3%) |
| Education, Arts & Media | 0 (0.0%) | 17 (100.0%) |
| Legal Services & Support | 0 (0.0%) | 0 (0.0%) |
| Education Instruction & Library | 6 (13.6%) | 38 (86.4%) |
| Arts, Media & Entertainment | 12 (100.0%) | 0 (0.0%) |
| Health Diagnosing & Treating | 7 (23.3%) | 23 (76.7%) |
| Health Technologists | 7 (25.9%) | 20 (74.1%) |
| Total (Category) | 85 (45.0%) | 104 (55.0%) |
| Total (Overall) | 339 (51.0%) | 325 (48.9%) |
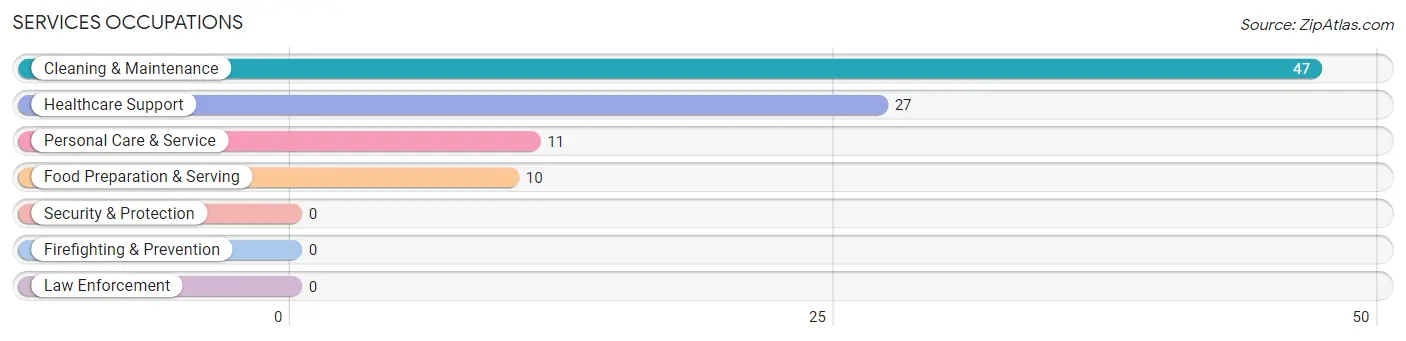
Services Occupations
The most common Services occupations in Antrim are Cleaning & Maintenance (47 | 7.1%), Healthcare Support (27 | 4.1%), Personal Care & Service (11 | 1.7%), and Food Preparation & Serving (10 | 1.5%).
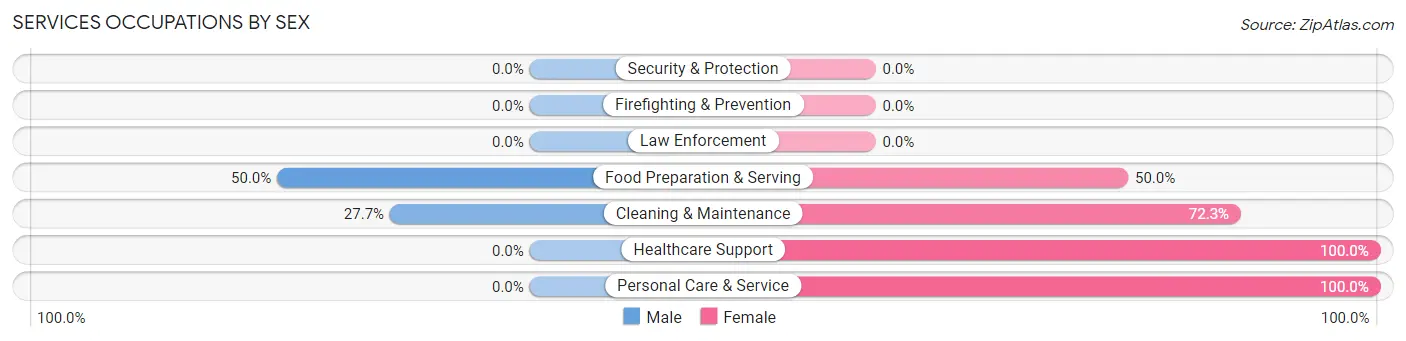
Services Occupations by Sex
Within the Services occupations in Antrim, the most male-oriented occupations are Food Preparation & Serving (50.0%), and Cleaning & Maintenance (27.7%), while the most female-oriented occupations are Healthcare Support (100.0%), Personal Care & Service (100.0%), and Cleaning & Maintenance (72.3%).
| Occupation | Male | Female |
| Healthcare Support | 0 (0.0%) | 27 (100.0%) |
| Security & Protection | 0 (0.0%) | 0 (0.0%) |
| Firefighting & Prevention | 0 (0.0%) | 0 (0.0%) |
| Law Enforcement | 0 (0.0%) | 0 (0.0%) |
| Food Preparation & Serving | 5 (50.0%) | 5 (50.0%) |
| Cleaning & Maintenance | 13 (27.7%) | 34 (72.3%) |
| Personal Care & Service | 0 (0.0%) | 11 (100.0%) |
| Total (Category) | 18 (19.0%) | 77 (81.0%) |
| Total (Overall) | 339 (51.0%) | 325 (48.9%) |
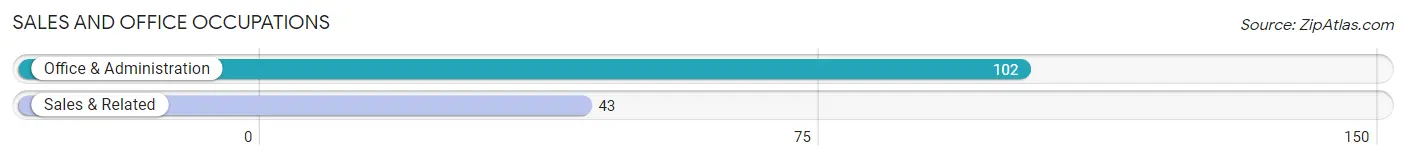
Sales and Office Occupations
The most common Sales and Office occupations in Antrim are Office & Administration (102 | 15.4%), and Sales & Related (43 | 6.5%).
Sales and Office Occupations by Sex
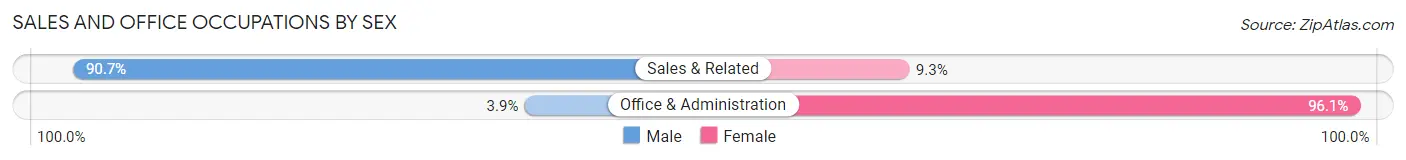
| Occupation | Male | Female |
| Sales & Related | 39 (90.7%) | 4 (9.3%) |
| Office & Administration | 4 (3.9%) | 98 (96.1%) |
| Total (Category) | 43 (29.7%) | 102 (70.3%) |
| Total (Overall) | 339 (51.0%) | 325 (48.9%) |
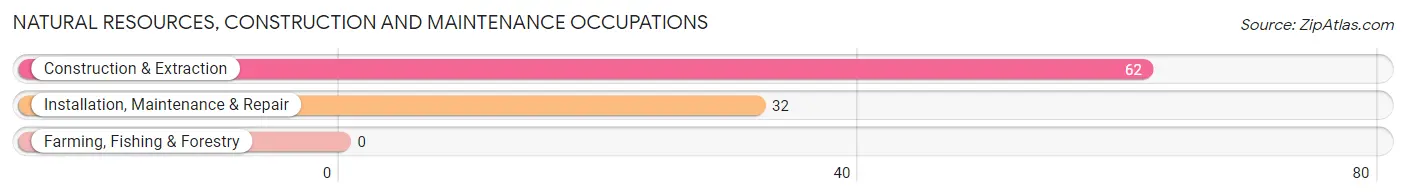
Natural Resources, Construction and Maintenance Occupations
The most common Natural Resources, Construction and Maintenance occupations in Antrim are Construction & Extraction (62 | 9.3%), and Installation, Maintenance & Repair (32 | 4.8%).
Natural Resources, Construction and Maintenance Occupations by Sex
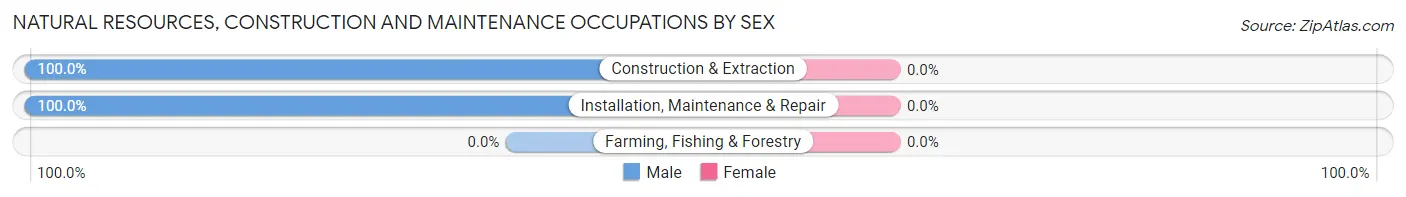
| Occupation | Male | Female |
| Farming, Fishing & Forestry | 0 (0.0%) | 0 (0.0%) |
| Construction & Extraction | 62 (100.0%) | 0 (0.0%) |
| Installation, Maintenance & Repair | 32 (100.0%) | 0 (0.0%) |
| Total (Category) | 94 (100.0%) | 0 (0.0%) |
| Total (Overall) | 339 (51.0%) | 325 (48.9%) |
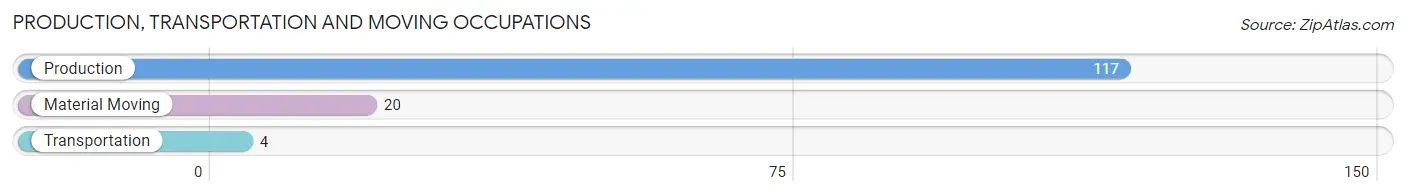
Production, Transportation and Moving Occupations
The most common Production, Transportation and Moving occupations in Antrim are Production (117 | 17.6%), Material Moving (20 | 3.0%), and Transportation (4 | 0.6%).
Production, Transportation and Moving Occupations by Sex
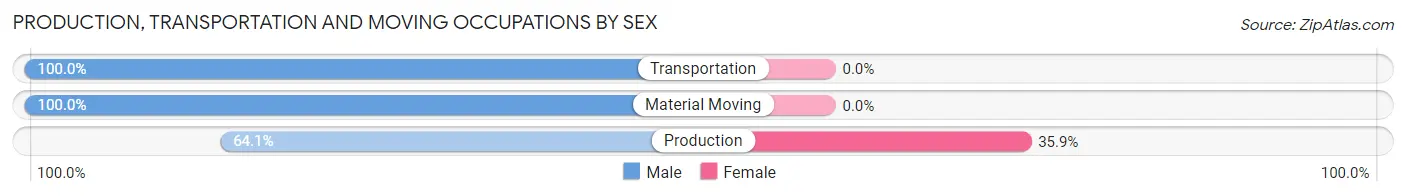
| Occupation | Male | Female |
| Production | 75 (64.1%) | 42 (35.9%) |
| Transportation | 4 (100.0%) | 0 (0.0%) |
| Material Moving | 20 (100.0%) | 0 (0.0%) |
| Total (Category) | 99 (70.2%) | 42 (29.8%) |
| Total (Overall) | 339 (51.0%) | 325 (48.9%) |
Employment Industries by Sex in Antrim
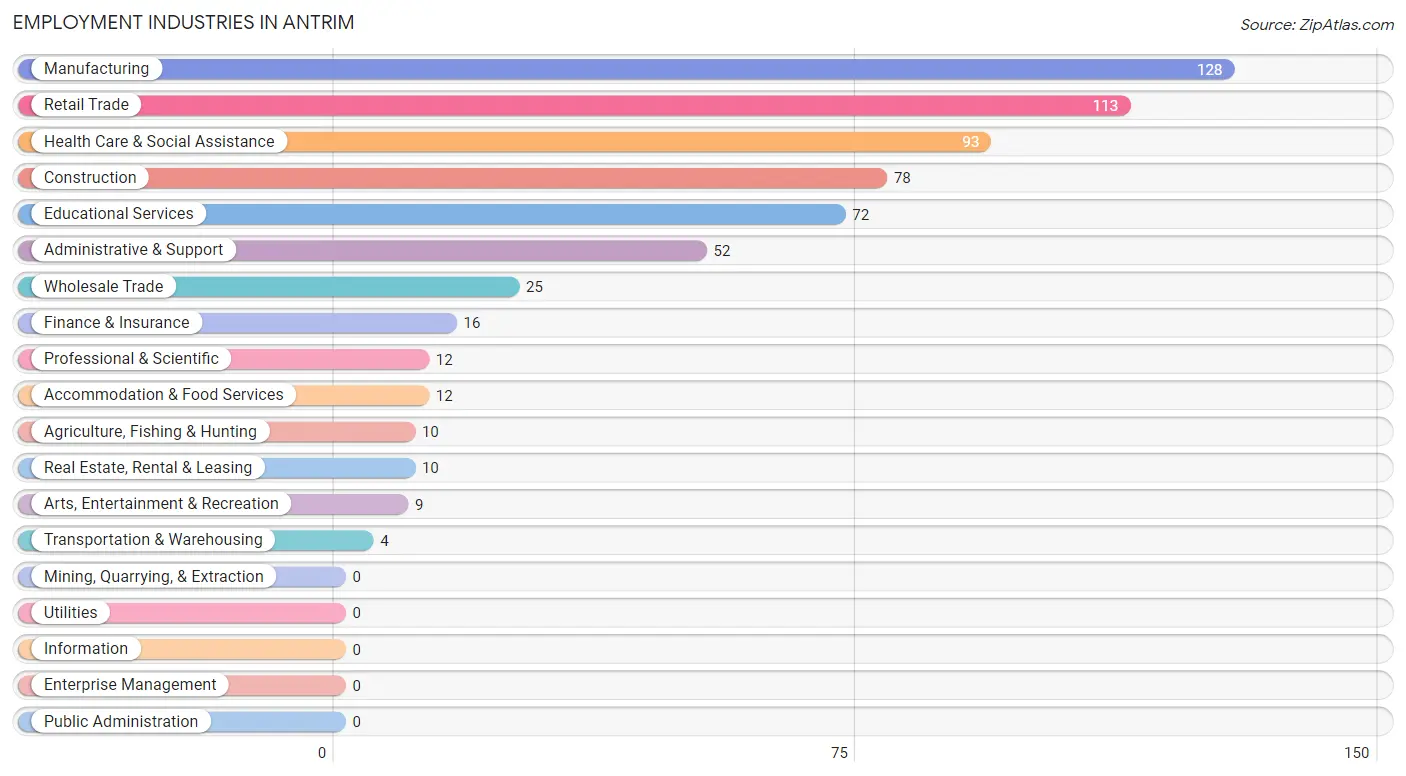
Employment Industries in Antrim
The major employment industries in Antrim include Manufacturing (128 | 19.3%), Retail Trade (113 | 17.0%), Health Care & Social Assistance (93 | 14.0%), Construction (78 | 11.7%), and Educational Services (72 | 10.8%).
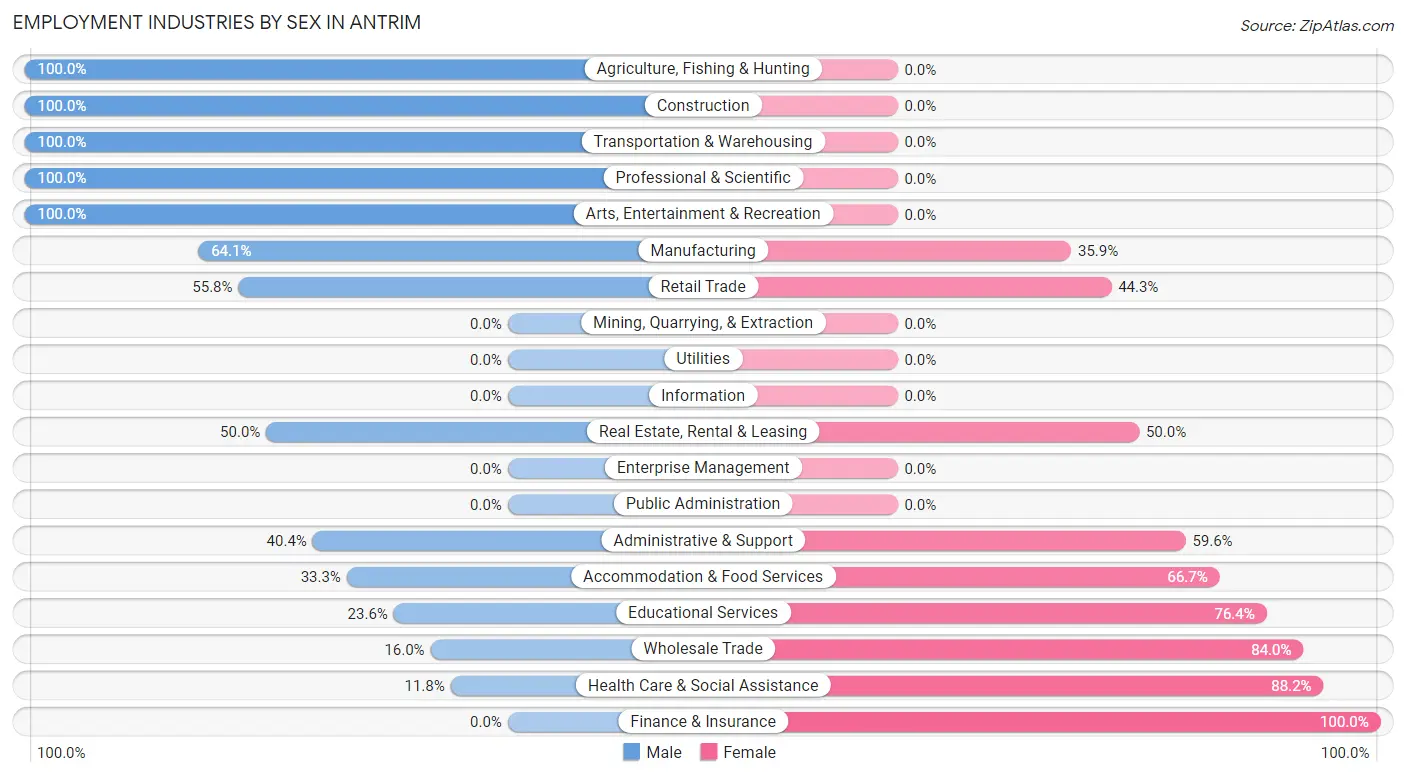
Employment Industries by Sex in Antrim
The Antrim industries that see more men than women are Agriculture, Fishing & Hunting (100.0%), Construction (100.0%), and Transportation & Warehousing (100.0%), whereas the industries that tend to have a higher number of women are Finance & Insurance (100.0%), Health Care & Social Assistance (88.2%), and Wholesale Trade (84.0%).
| Industry | Male | Female |
| Agriculture, Fishing & Hunting | 10 (100.0%) | 0 (0.0%) |
| Mining, Quarrying, & Extraction | 0 (0.0%) | 0 (0.0%) |
| Construction | 78 (100.0%) | 0 (0.0%) |
| Manufacturing | 82 (64.1%) | 46 (35.9%) |
| Wholesale Trade | 4 (16.0%) | 21 (84.0%) |
| Retail Trade | 63 (55.7%) | 50 (44.3%) |
| Transportation & Warehousing | 4 (100.0%) | 0 (0.0%) |
| Utilities | 0 (0.0%) | 0 (0.0%) |
| Information | 0 (0.0%) | 0 (0.0%) |
| Finance & Insurance | 0 (0.0%) | 16 (100.0%) |
| Real Estate, Rental & Leasing | 5 (50.0%) | 5 (50.0%) |
| Professional & Scientific | 12 (100.0%) | 0 (0.0%) |
| Enterprise Management | 0 (0.0%) | 0 (0.0%) |
| Administrative & Support | 21 (40.4%) | 31 (59.6%) |
| Educational Services | 17 (23.6%) | 55 (76.4%) |
| Health Care & Social Assistance | 11 (11.8%) | 82 (88.2%) |
| Arts, Entertainment & Recreation | 9 (100.0%) | 0 (0.0%) |
| Accommodation & Food Services | 4 (33.3%) | 8 (66.7%) |
| Public Administration | 0 (0.0%) | 0 (0.0%) |
| Total | 339 (51.0%) | 325 (48.9%) |
Education in Antrim
School Enrollment in Antrim
The most common levels of schooling among the 306 students in Antrim are elementary school (114 | 37.2%), middle school (71 | 23.2%), and high school (36 | 11.8%).
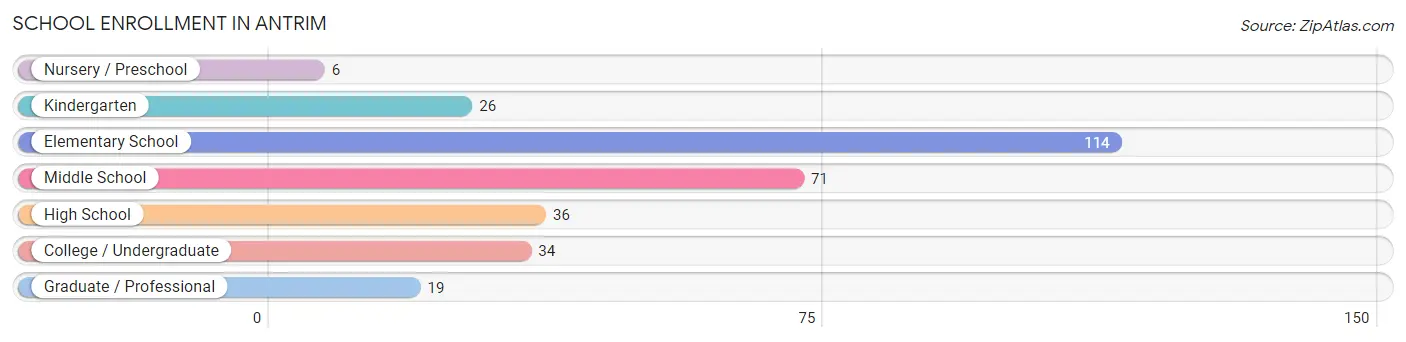
| School Level | # Students | % Students |
| Nursery / Preschool | 6 | 2.0% |
| Kindergarten | 26 | 8.5% |
| Elementary School | 114 | 37.2% |
| Middle School | 71 | 23.2% |
| High School | 36 | 11.8% |
| College / Undergraduate | 34 | 11.1% |
| Graduate / Professional | 19 | 6.2% |
| Total | 306 | 100.0% |
School Enrollment by Age by Funding Source in Antrim
Out of a total of 306 students who are enrolled in schools in Antrim, 98 (32.0%) attend a private institution, while the remaining 208 (68.0%) are enrolled in public schools. The age group of 3 to 4 year olds has the highest likelihood of being enrolled in private schools, with 6 (100.0% in the age bracket) enrolled. Conversely, the age group of 18 to 19 year olds has the lowest likelihood of being enrolled in a private school, with 8 (100.0% in the age bracket) attending a public institution.
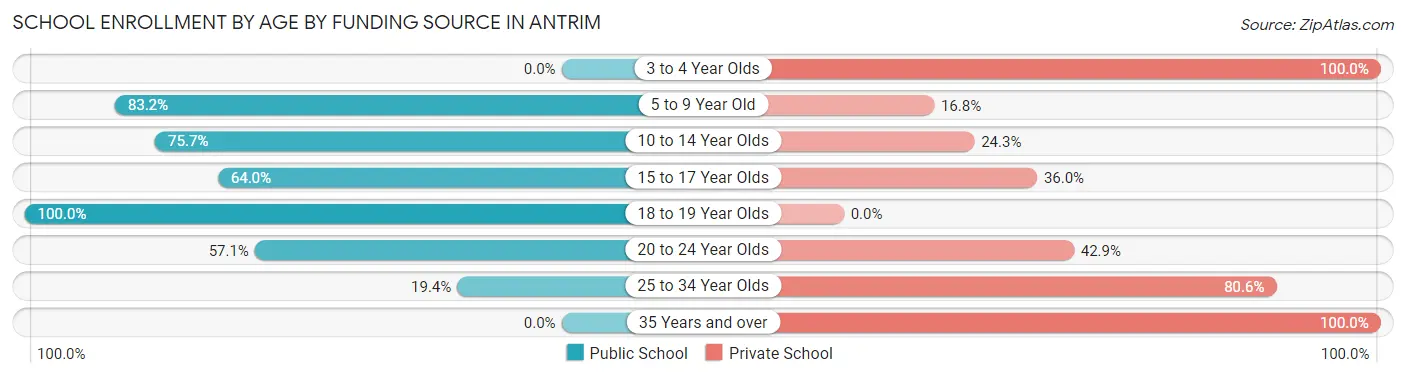
| Age Bracket | Public School | Private School |
| 3 to 4 Year Olds | 0 (0.0%) | 6 (100.0%) |
| 5 to 9 Year Old | 89 (83.2%) | 18 (16.8%) |
| 10 to 14 Year Olds | 84 (75.7%) | 27 (24.3%) |
| 15 to 17 Year Olds | 16 (64.0%) | 9 (36.0%) |
| 18 to 19 Year Olds | 8 (100.0%) | 0 (0.0%) |
| 20 to 24 Year Olds | 4 (57.1%) | 3 (42.9%) |
| 25 to 34 Year Olds | 7 (19.4%) | 29 (80.6%) |
| 35 Years and over | 0 (0.0%) | 6 (100.0%) |
| Total | 208 (68.0%) | 98 (32.0%) |
Educational Attainment by Field of Study in Antrim
Business (64 | 20.8%), psychology (38 | 12.3%), social sciences (35 | 11.4%), education (34 | 11.0%), and science & technology (28 | 9.1%) are the most common fields of study among 308 individuals in Antrim who have obtained a bachelor's degree or higher.
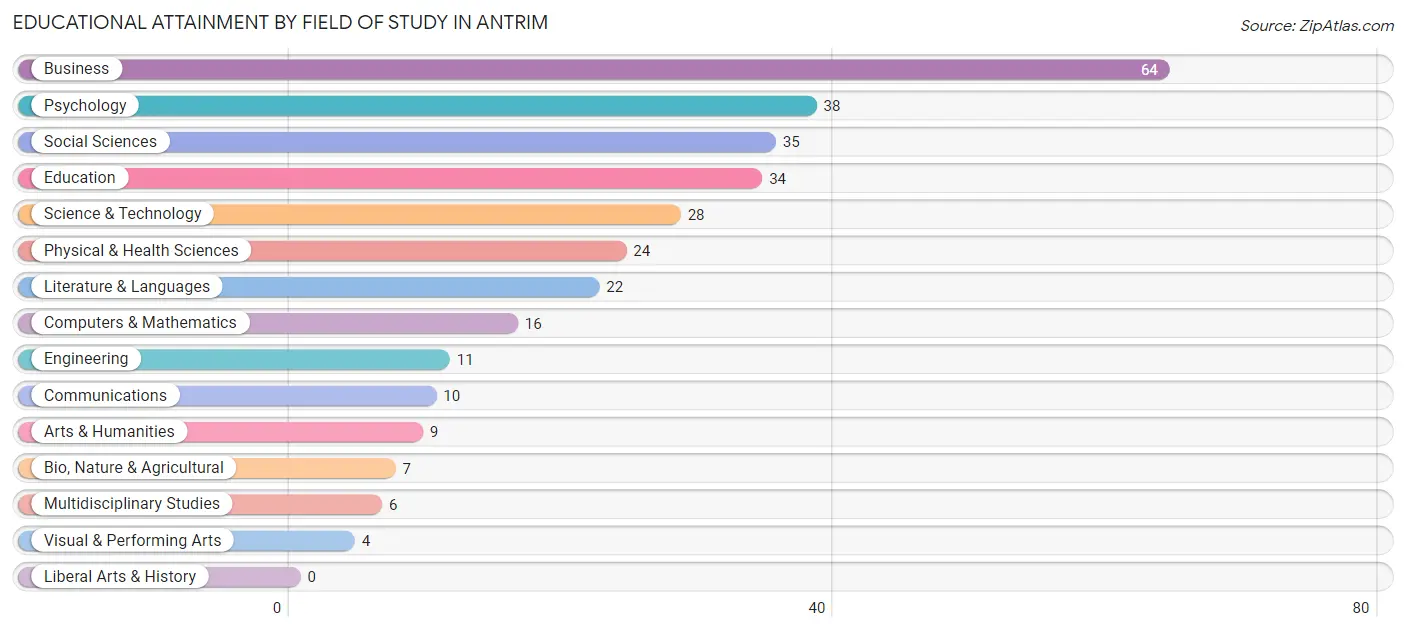
| Field of Study | # Graduates | % Graduates |
| Computers & Mathematics | 16 | 5.2% |
| Bio, Nature & Agricultural | 7 | 2.3% |
| Physical & Health Sciences | 24 | 7.8% |
| Psychology | 38 | 12.3% |
| Social Sciences | 35 | 11.4% |
| Engineering | 11 | 3.6% |
| Multidisciplinary Studies | 6 | 1.9% |
| Science & Technology | 28 | 9.1% |
| Business | 64 | 20.8% |
| Education | 34 | 11.0% |
| Literature & Languages | 22 | 7.1% |
| Liberal Arts & History | 0 | 0.0% |
| Visual & Performing Arts | 4 | 1.3% |
| Communications | 10 | 3.3% |
| Arts & Humanities | 9 | 2.9% |
| Total | 308 | 100.0% |
Transportation & Commute in Antrim
Vehicle Availability by Sex in Antrim
The most prevalent vehicle ownership categories in Antrim are males with 2 vehicles (140, accounting for 41.3%) and females with 2 vehicles (131, making up 43.1%).
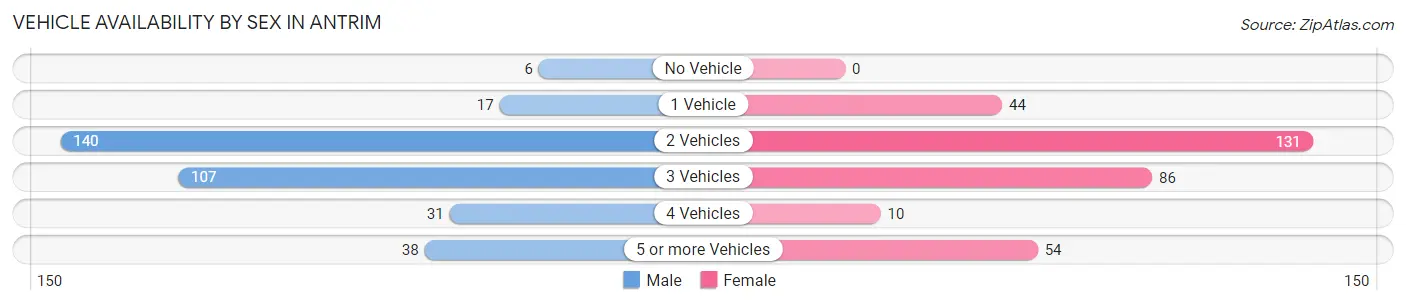
| Vehicles Available | Male | Female |
| No Vehicle | 6 (1.8%) | 0 (0.0%) |
| 1 Vehicle | 17 (5.0%) | 44 (13.5%) |
| 2 Vehicles | 140 (41.3%) | 131 (40.3%) |
| 3 Vehicles | 107 (31.6%) | 86 (26.5%) |
| 4 Vehicles | 31 (9.1%) | 10 (3.1%) |
| 5 or more Vehicles | 38 (11.2%) | 54 (16.6%) |
| Total | 339 (100.0%) | 325 (100.0%) |
Commute Time in Antrim
The most frequently occuring commute durations in Antrim are 20 to 24 minutes (119 commuters, 18.2%), 45 to 59 minutes (108 commuters, 16.5%), and 60 to 89 minutes (99 commuters, 15.1%).
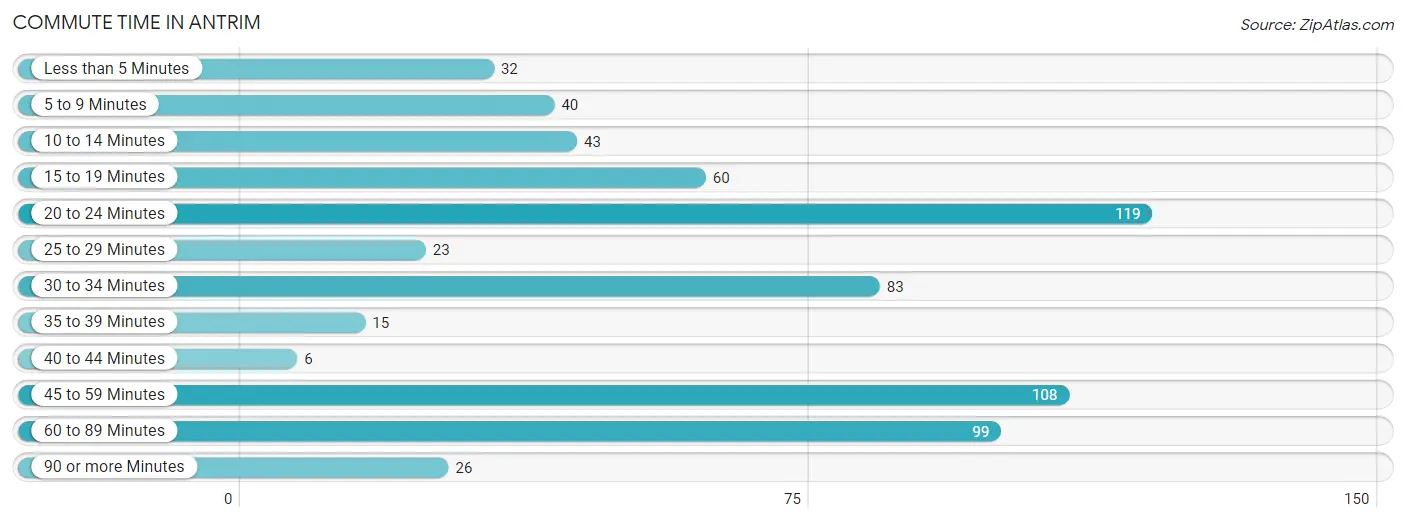
| Commute Time | # Commuters | % Commuters |
| Less than 5 Minutes | 32 | 4.9% |
| 5 to 9 Minutes | 40 | 6.1% |
| 10 to 14 Minutes | 43 | 6.6% |
| 15 to 19 Minutes | 60 | 9.2% |
| 20 to 24 Minutes | 119 | 18.2% |
| 25 to 29 Minutes | 23 | 3.5% |
| 30 to 34 Minutes | 83 | 12.7% |
| 35 to 39 Minutes | 15 | 2.3% |
| 40 to 44 Minutes | 6 | 0.9% |
| 45 to 59 Minutes | 108 | 16.5% |
| 60 to 89 Minutes | 99 | 15.1% |
| 90 or more Minutes | 26 | 4.0% |
Commute Time by Sex in Antrim
The most common commute times in Antrim are 45 to 59 minutes (69 commuters, 20.3%) for males and 20 to 24 minutes (72 commuters, 22.9%) for females.
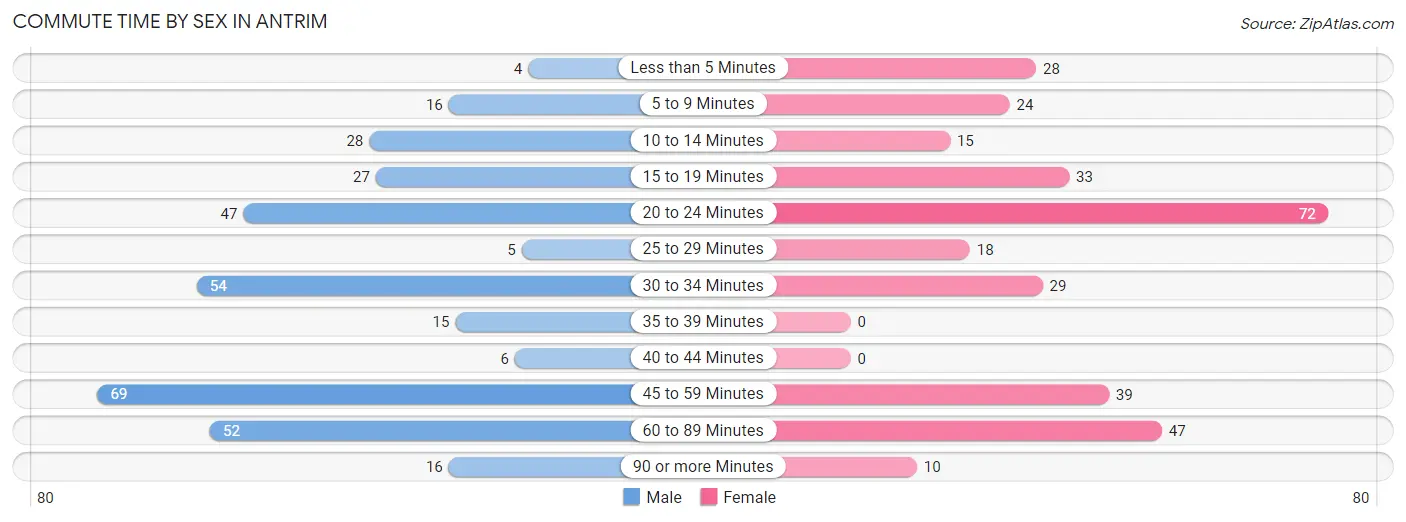
| Commute Time | Male | Female |
| Less than 5 Minutes | 4 (1.2%) | 28 (8.9%) |
| 5 to 9 Minutes | 16 (4.7%) | 24 (7.6%) |
| 10 to 14 Minutes | 28 (8.3%) | 15 (4.8%) |
| 15 to 19 Minutes | 27 (8.0%) | 33 (10.5%) |
| 20 to 24 Minutes | 47 (13.9%) | 72 (22.9%) |
| 25 to 29 Minutes | 5 (1.5%) | 18 (5.7%) |
| 30 to 34 Minutes | 54 (15.9%) | 29 (9.2%) |
| 35 to 39 Minutes | 15 (4.4%) | 0 (0.0%) |
| 40 to 44 Minutes | 6 (1.8%) | 0 (0.0%) |
| 45 to 59 Minutes | 69 (20.3%) | 39 (12.4%) |
| 60 to 89 Minutes | 52 (15.3%) | 47 (14.9%) |
| 90 or more Minutes | 16 (4.7%) | 10 (3.2%) |
Time of Departure to Work by Sex in Antrim
The most frequent times of departure to work in Antrim are 6:30 AM to 6:59 AM (70, 20.6%) for males and 6:30 AM to 6:59 AM (69, 21.9%) for females.
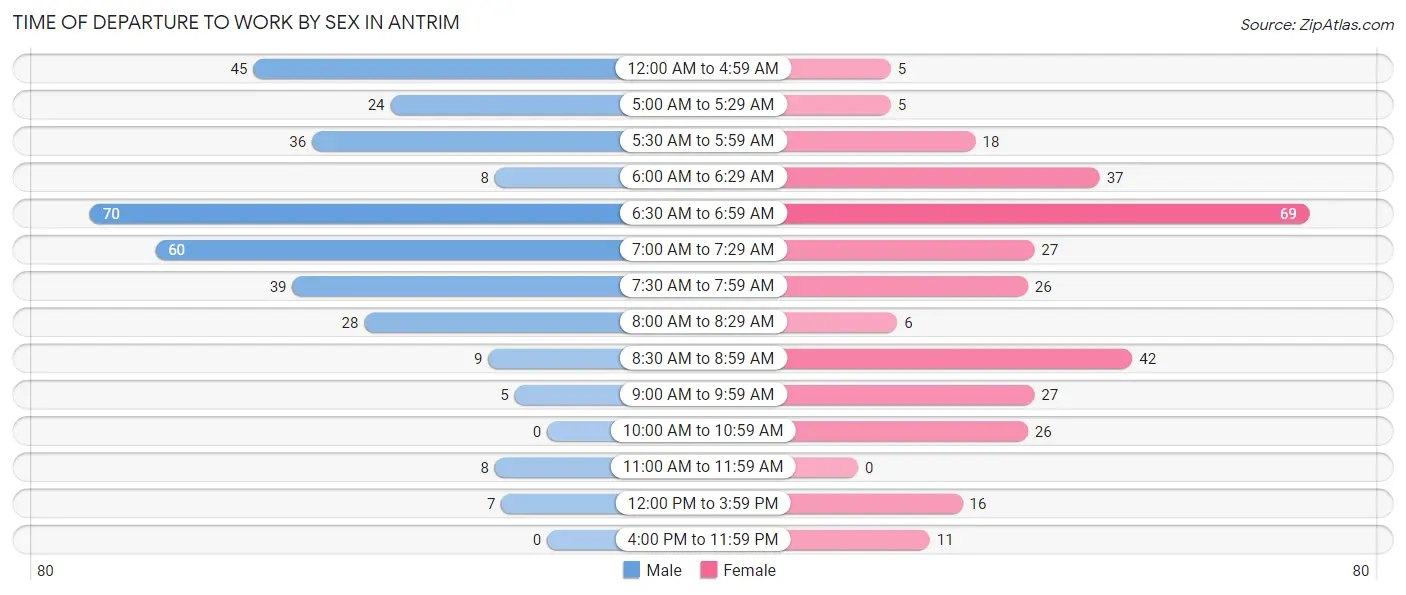
| Time of Departure | Male | Female |
| 12:00 AM to 4:59 AM | 45 (13.3%) | 5 (1.6%) |
| 5:00 AM to 5:29 AM | 24 (7.1%) | 5 (1.6%) |
| 5:30 AM to 5:59 AM | 36 (10.6%) | 18 (5.7%) |
| 6:00 AM to 6:29 AM | 8 (2.4%) | 37 (11.7%) |
| 6:30 AM to 6:59 AM | 70 (20.6%) | 69 (21.9%) |
| 7:00 AM to 7:29 AM | 60 (17.7%) | 27 (8.6%) |
| 7:30 AM to 7:59 AM | 39 (11.5%) | 26 (8.3%) |
| 8:00 AM to 8:29 AM | 28 (8.3%) | 6 (1.9%) |
| 8:30 AM to 8:59 AM | 9 (2.6%) | 42 (13.3%) |
| 9:00 AM to 9:59 AM | 5 (1.5%) | 27 (8.6%) |
| 10:00 AM to 10:59 AM | 0 (0.0%) | 26 (8.3%) |
| 11:00 AM to 11:59 AM | 8 (2.4%) | 0 (0.0%) |
| 12:00 PM to 3:59 PM | 7 (2.1%) | 16 (5.1%) |
| 4:00 PM to 11:59 PM | 0 (0.0%) | 11 (3.5%) |
| Total | 339 (100.0%) | 315 (100.0%) |
Housing Occupancy in Antrim
Occupancy by Ownership in Antrim
Of the total 493 dwellings in Antrim, owner-occupied units account for 394 (79.9%), while renter-occupied units make up 99 (20.1%).
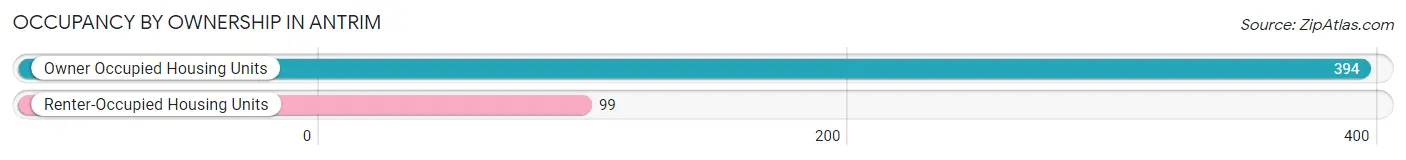
| Occupancy | # Housing Units | % Housing Units |
| Owner Occupied Housing Units | 394 | 79.9% |
| Renter-Occupied Housing Units | 99 | 20.1% |
| Total Occupied Housing Units | 493 | 100.0% |
Occupancy by Household Size in Antrim
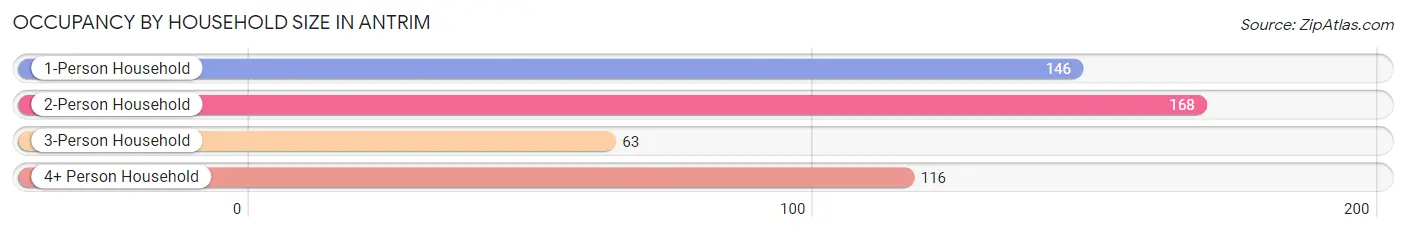
| Household Size | # Housing Units | % Housing Units |
| 1-Person Household | 146 | 29.6% |
| 2-Person Household | 168 | 34.1% |
| 3-Person Household | 63 | 12.8% |
| 4+ Person Household | 116 | 23.5% |
| Total Housing Units | 493 | 100.0% |
Occupancy by Ownership by Household Size in Antrim
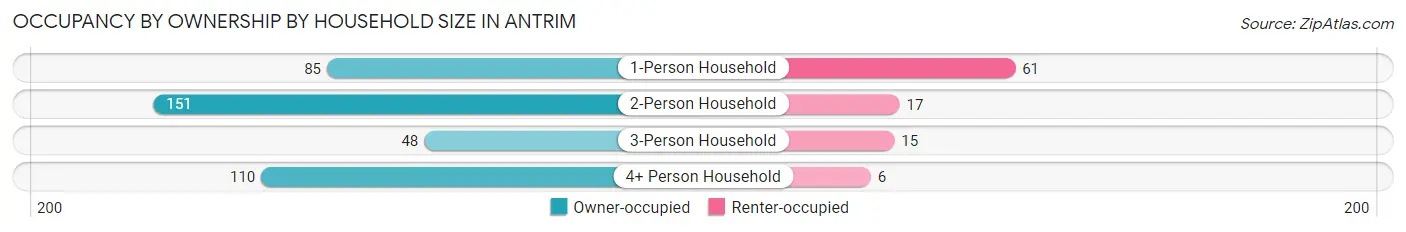
| Household Size | Owner-occupied | Renter-occupied |
| 1-Person Household | 85 (58.2%) | 61 (41.8%) |
| 2-Person Household | 151 (89.9%) | 17 (10.1%) |
| 3-Person Household | 48 (76.2%) | 15 (23.8%) |
| 4+ Person Household | 110 (94.8%) | 6 (5.2%) |
| Total Housing Units | 394 (79.9%) | 99 (20.1%) |
Occupancy by Educational Attainment in Antrim
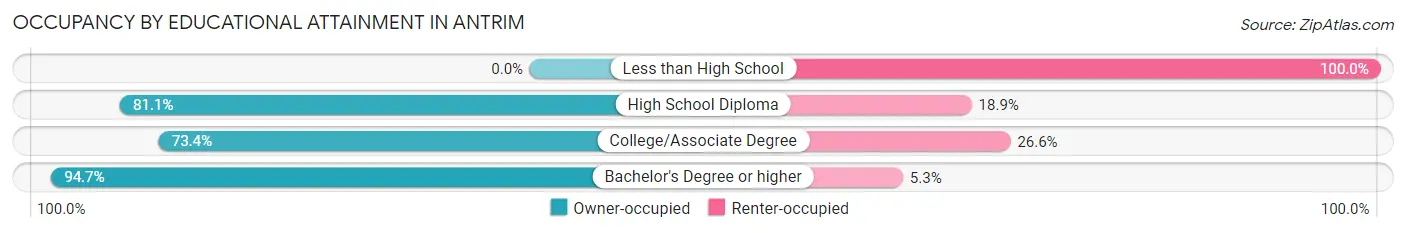
| Household Size | Owner-occupied | Renter-occupied |
| Less than High School | 0 (0.0%) | 16 (100.0%) |
| High School Diploma | 167 (81.1%) | 39 (18.9%) |
| College/Associate Degree | 102 (73.4%) | 37 (26.6%) |
| Bachelor's Degree or higher | 125 (94.7%) | 7 (5.3%) |
Occupancy by Age of Householder in Antrim
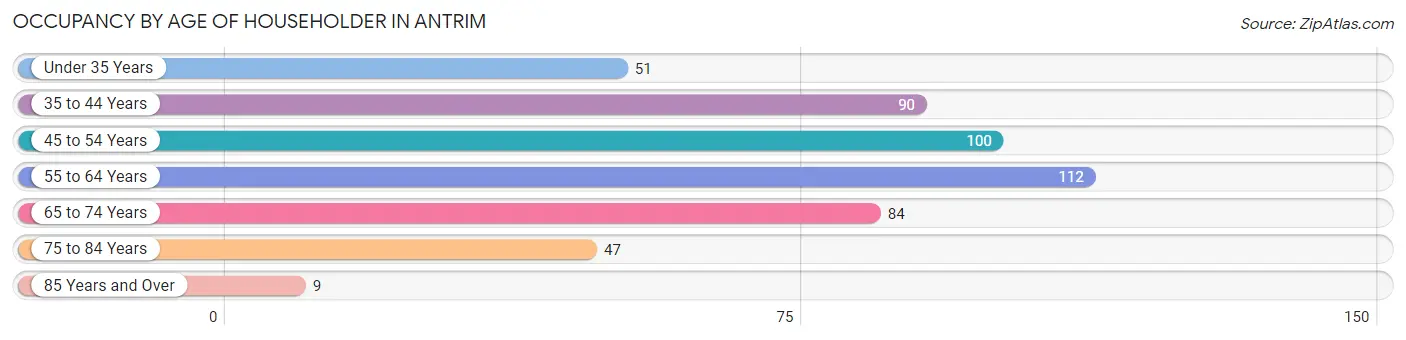
| Age Bracket | # Households | % Households |
| Under 35 Years | 51 | 10.3% |
| 35 to 44 Years | 90 | 18.3% |
| 45 to 54 Years | 100 | 20.3% |
| 55 to 64 Years | 112 | 22.7% |
| 65 to 74 Years | 84 | 17.0% |
| 75 to 84 Years | 47 | 9.5% |
| 85 Years and Over | 9 | 1.8% |
| Total | 493 | 100.0% |
Housing Finances in Antrim
Median Income by Occupancy in Antrim
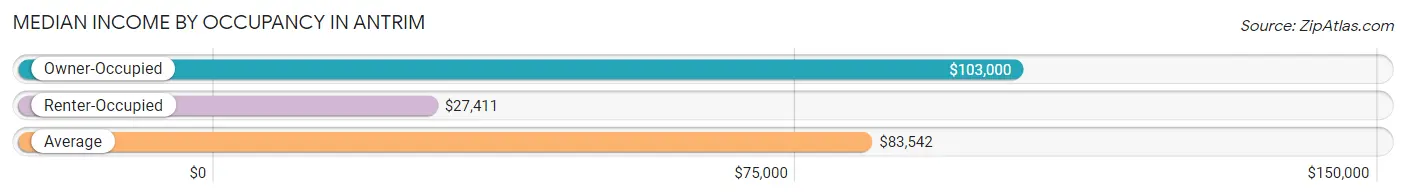
| Occupancy Type | # Households | Median Income |
| Owner-Occupied | 394 (79.9%) | $103,000 |
| Renter-Occupied | 99 (20.1%) | $27,411 |
| Average | 493 (100.0%) | $83,542 |
Occupancy by Householder Income Bracket in Antrim
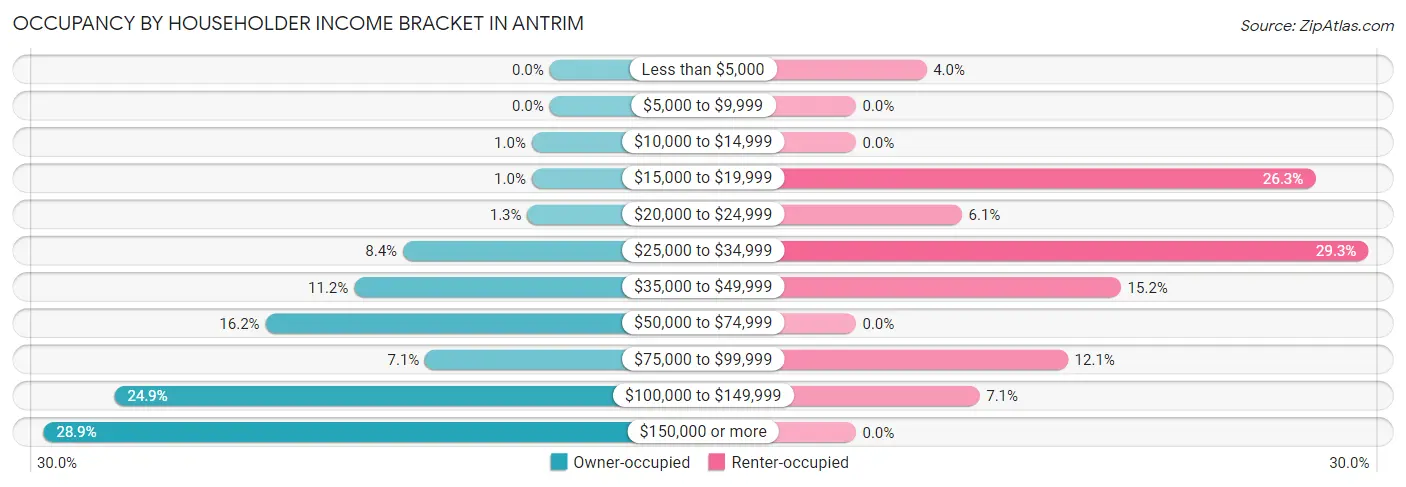
| Income Bracket | Owner-occupied | Renter-occupied |
| Less than $5,000 | 0 (0.0%) | 4 (4.0%) |
| $5,000 to $9,999 | 0 (0.0%) | 0 (0.0%) |
| $10,000 to $14,999 | 4 (1.0%) | 0 (0.0%) |
| $15,000 to $19,999 | 4 (1.0%) | 26 (26.3%) |
| $20,000 to $24,999 | 5 (1.3%) | 6 (6.1%) |
| $25,000 to $34,999 | 33 (8.4%) | 29 (29.3%) |
| $35,000 to $49,999 | 44 (11.2%) | 15 (15.1%) |
| $50,000 to $74,999 | 64 (16.2%) | 0 (0.0%) |
| $75,000 to $99,999 | 28 (7.1%) | 12 (12.1%) |
| $100,000 to $149,999 | 98 (24.9%) | 7 (7.1%) |
| $150,000 or more | 114 (28.9%) | 0 (0.0%) |
| Total | 394 (100.0%) | 99 (100.0%) |
Monthly Housing Cost Tiers in Antrim
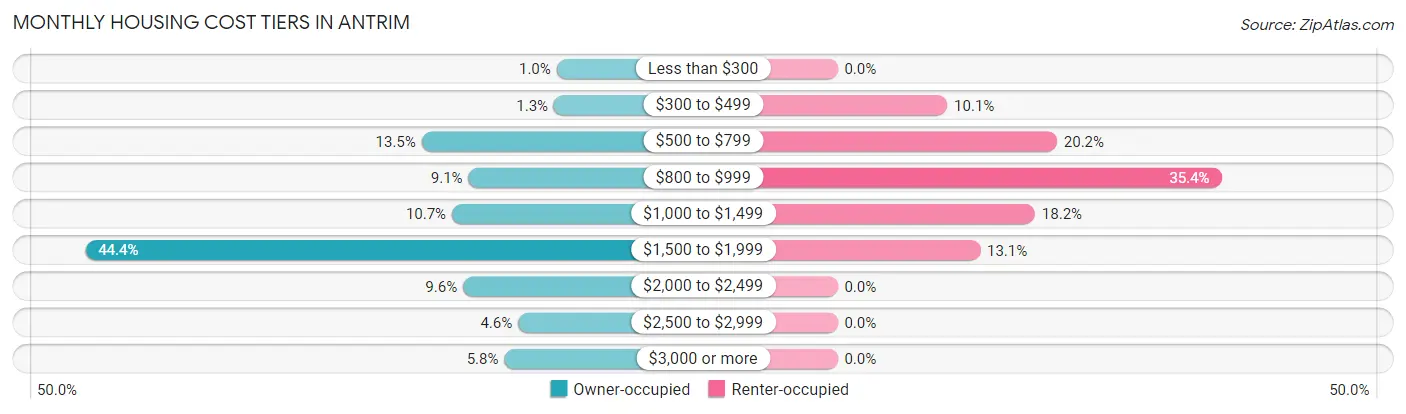
| Monthly Cost | Owner-occupied | Renter-occupied |
| Less than $300 | 4 (1.0%) | 0 (0.0%) |
| $300 to $499 | 5 (1.3%) | 10 (10.1%) |
| $500 to $799 | 53 (13.5%) | 20 (20.2%) |
| $800 to $999 | 36 (9.1%) | 35 (35.3%) |
| $1,000 to $1,499 | 42 (10.7%) | 18 (18.2%) |
| $1,500 to $1,999 | 175 (44.4%) | 13 (13.1%) |
| $2,000 to $2,499 | 38 (9.6%) | 0 (0.0%) |
| $2,500 to $2,999 | 18 (4.6%) | 0 (0.0%) |
| $3,000 or more | 23 (5.8%) | 0 (0.0%) |
| Total | 394 (100.0%) | 99 (100.0%) |
Physical Housing Characteristics in Antrim
Housing Structures in Antrim
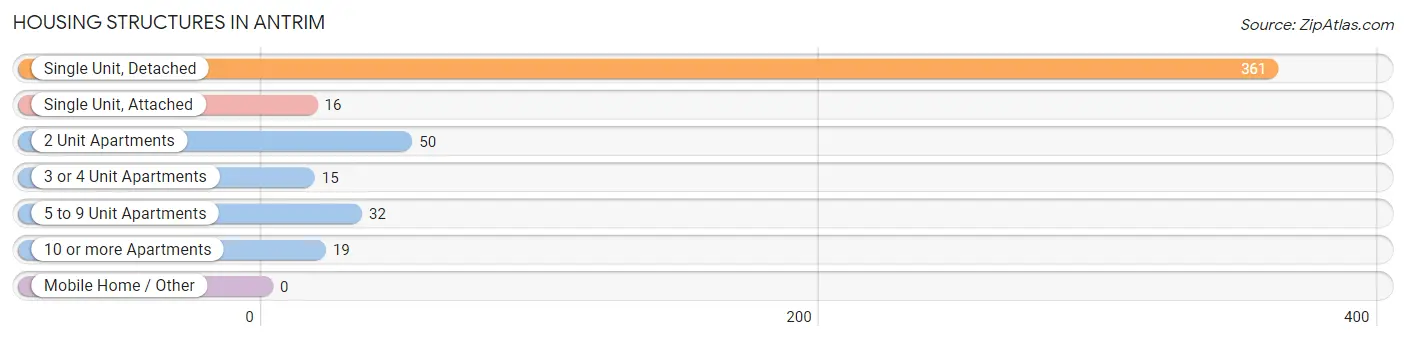
| Structure Type | # Housing Units | % Housing Units |
| Single Unit, Detached | 361 | 73.2% |
| Single Unit, Attached | 16 | 3.3% |
| 2 Unit Apartments | 50 | 10.1% |
| 3 or 4 Unit Apartments | 15 | 3.0% |
| 5 to 9 Unit Apartments | 32 | 6.5% |
| 10 or more Apartments | 19 | 3.8% |
| Mobile Home / Other | 0 | 0.0% |
| Total | 493 | 100.0% |
Housing Structures by Occupancy in Antrim
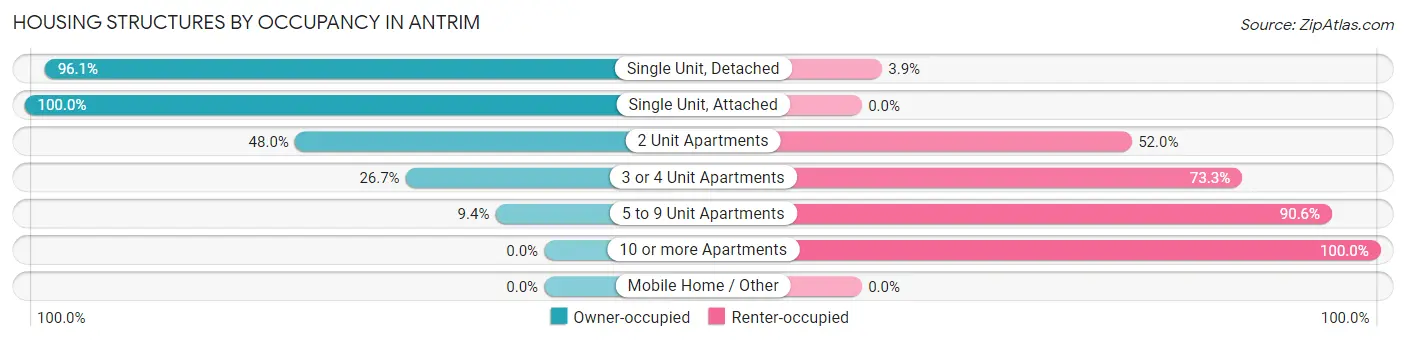
| Structure Type | Owner-occupied | Renter-occupied |
| Single Unit, Detached | 347 (96.1%) | 14 (3.9%) |
| Single Unit, Attached | 16 (100.0%) | 0 (0.0%) |
| 2 Unit Apartments | 24 (48.0%) | 26 (52.0%) |
| 3 or 4 Unit Apartments | 4 (26.7%) | 11 (73.3%) |
| 5 to 9 Unit Apartments | 3 (9.4%) | 29 (90.6%) |
| 10 or more Apartments | 0 (0.0%) | 19 (100.0%) |
| Mobile Home / Other | 0 (0.0%) | 0 (0.0%) |
| Total | 394 (79.9%) | 99 (20.1%) |
Housing Structures by Number of Rooms in Antrim
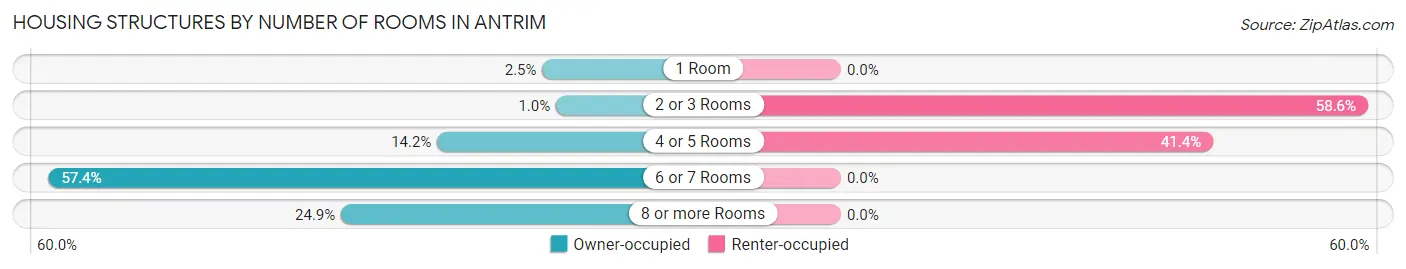
| Number of Rooms | Owner-occupied | Renter-occupied |
| 1 Room | 10 (2.5%) | 0 (0.0%) |
| 2 or 3 Rooms | 4 (1.0%) | 58 (58.6%) |
| 4 or 5 Rooms | 56 (14.2%) | 41 (41.4%) |
| 6 or 7 Rooms | 226 (57.4%) | 0 (0.0%) |
| 8 or more Rooms | 98 (24.9%) | 0 (0.0%) |
| Total | 394 (100.0%) | 99 (100.0%) |
Housing Structure by Heating Type in Antrim
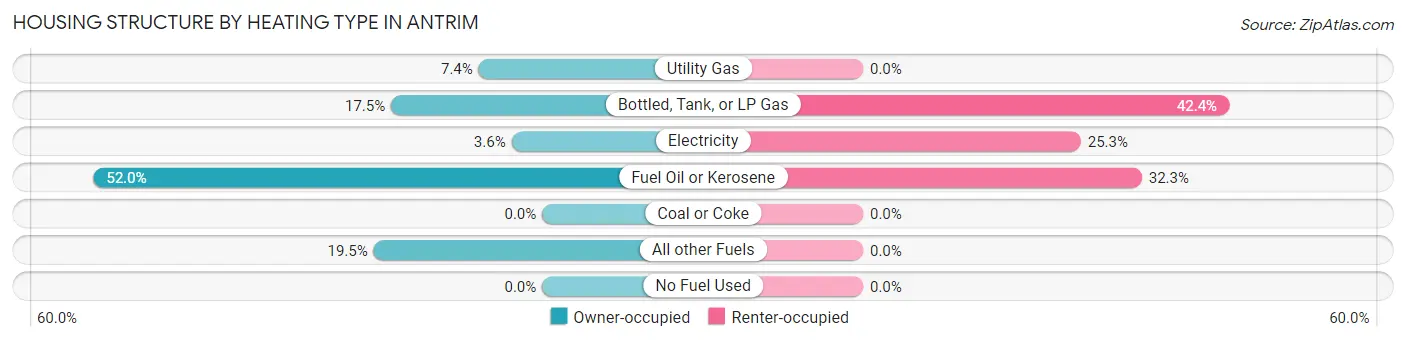
| Heating Type | Owner-occupied | Renter-occupied |
| Utility Gas | 29 (7.4%) | 0 (0.0%) |
| Bottled, Tank, or LP Gas | 69 (17.5%) | 42 (42.4%) |
| Electricity | 14 (3.5%) | 25 (25.3%) |
| Fuel Oil or Kerosene | 205 (52.0%) | 32 (32.3%) |
| Coal or Coke | 0 (0.0%) | 0 (0.0%) |
| All other Fuels | 77 (19.5%) | 0 (0.0%) |
| No Fuel Used | 0 (0.0%) | 0 (0.0%) |
| Total | 394 (100.0%) | 99 (100.0%) |
Household Vehicle Usage in Antrim
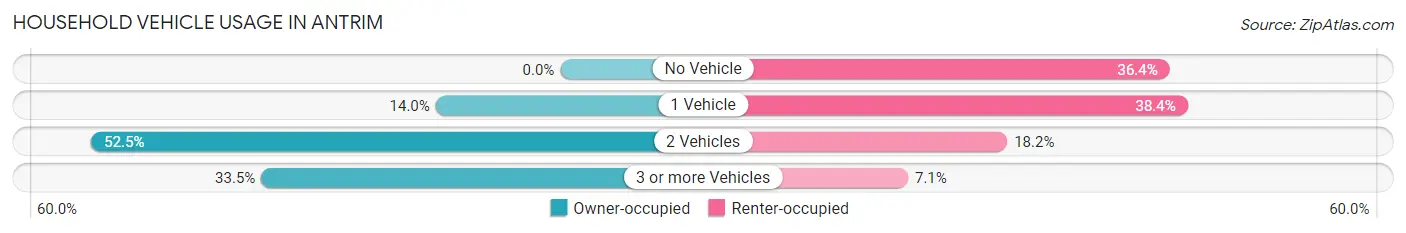
| Vehicles per Household | Owner-occupied | Renter-occupied |
| No Vehicle | 0 (0.0%) | 36 (36.4%) |
| 1 Vehicle | 55 (14.0%) | 38 (38.4%) |
| 2 Vehicles | 207 (52.5%) | 18 (18.2%) |
| 3 or more Vehicles | 132 (33.5%) | 7 (7.1%) |
| Total | 394 (100.0%) | 99 (100.0%) |
Real Estate & Mortgages in Antrim
Real Estate and Mortgage Overview in Antrim
| Characteristic | Without Mortgage | With Mortgage |
| Housing Units | 107 | 287 |
| Median Property Value | $235,000 | $225,000 |
| Median Household Income | $46,473 | $94 |
| Monthly Housing Costs | $834 | $15 |
| Real Estate Taxes | $4,890 | $0 |
Property Value by Mortgage Status in Antrim
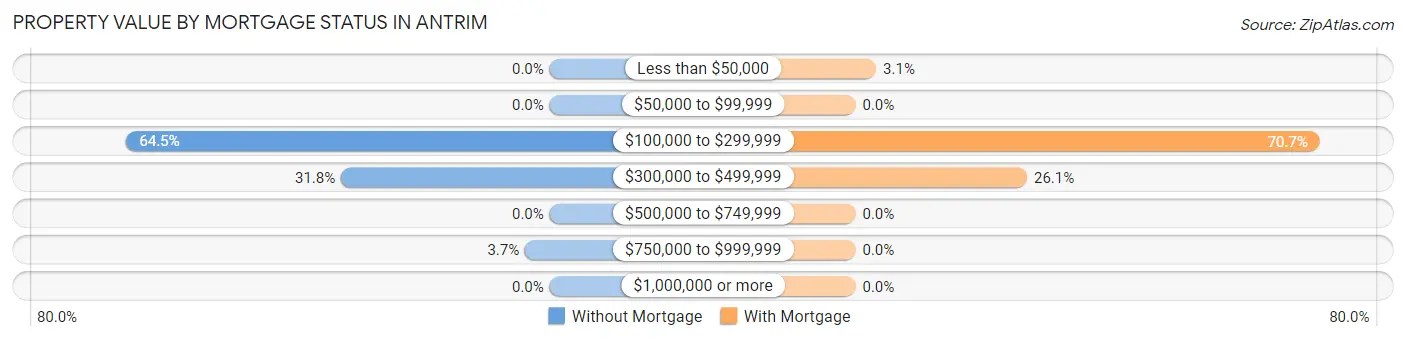
| Property Value | Without Mortgage | With Mortgage |
| Less than $50,000 | 0 (0.0%) | 9 (3.1%) |
| $50,000 to $99,999 | 0 (0.0%) | 0 (0.0%) |
| $100,000 to $299,999 | 69 (64.5%) | 203 (70.7%) |
| $300,000 to $499,999 | 34 (31.8%) | 75 (26.1%) |
| $500,000 to $749,999 | 0 (0.0%) | 0 (0.0%) |
| $750,000 to $999,999 | 4 (3.7%) | 0 (0.0%) |
| $1,000,000 or more | 0 (0.0%) | 0 (0.0%) |
| Total | 107 (100.0%) | 287 (100.0%) |
Household Income by Mortgage Status in Antrim
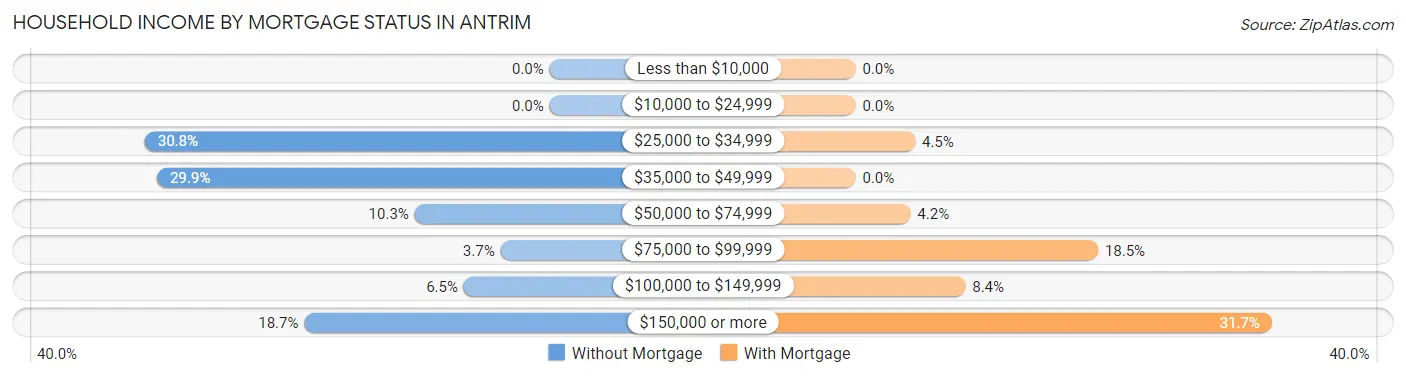
| Household Income | Without Mortgage | With Mortgage |
| Less than $10,000 | 0 (0.0%) | 0 (0.0%) |
| $10,000 to $24,999 | 0 (0.0%) | 0 (0.0%) |
| $25,000 to $34,999 | 33 (30.8%) | 13 (4.5%) |
| $35,000 to $49,999 | 32 (29.9%) | 0 (0.0%) |
| $50,000 to $74,999 | 11 (10.3%) | 12 (4.2%) |
| $75,000 to $99,999 | 4 (3.7%) | 53 (18.5%) |
| $100,000 to $149,999 | 7 (6.5%) | 24 (8.4%) |
| $150,000 or more | 20 (18.7%) | 91 (31.7%) |
| Total | 107 (100.0%) | 287 (100.0%) |
Property Value to Household Income Ratio in Antrim
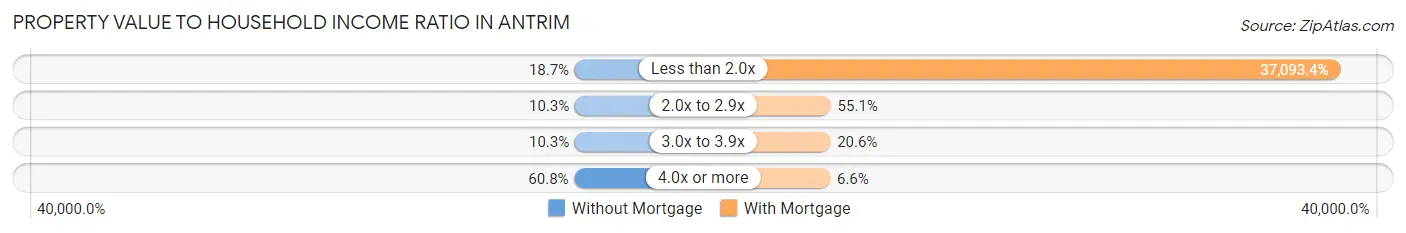
| Value-to-Income Ratio | Without Mortgage | With Mortgage |
| Less than 2.0x | 20 (18.7%) | 106,458 (37,093.4%) |
| 2.0x to 2.9x | 11 (10.3%) | 158 (55.0%) |
| 3.0x to 3.9x | 11 (10.3%) | 59 (20.6%) |
| 4.0x or more | 65 (60.8%) | 19 (6.6%) |
| Total | 107 (100.0%) | 287 (100.0%) |
Real Estate Taxes by Mortgage Status in Antrim
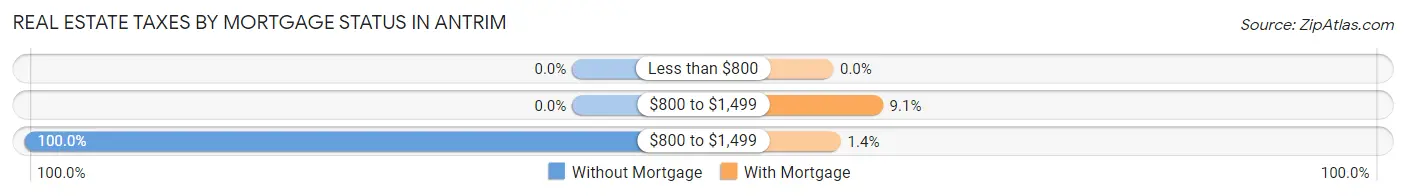
| Property Taxes | Without Mortgage | With Mortgage |
| Less than $800 | 0 (0.0%) | 0 (0.0%) |
| $800 to $1,499 | 0 (0.0%) | 26 (9.1%) |
| $800 to $1,499 | 107 (100.0%) | 4 (1.4%) |
| Total | 107 (100.0%) | 287 (100.0%) |
Health & Disability in Antrim
Health Insurance Coverage by Age in Antrim
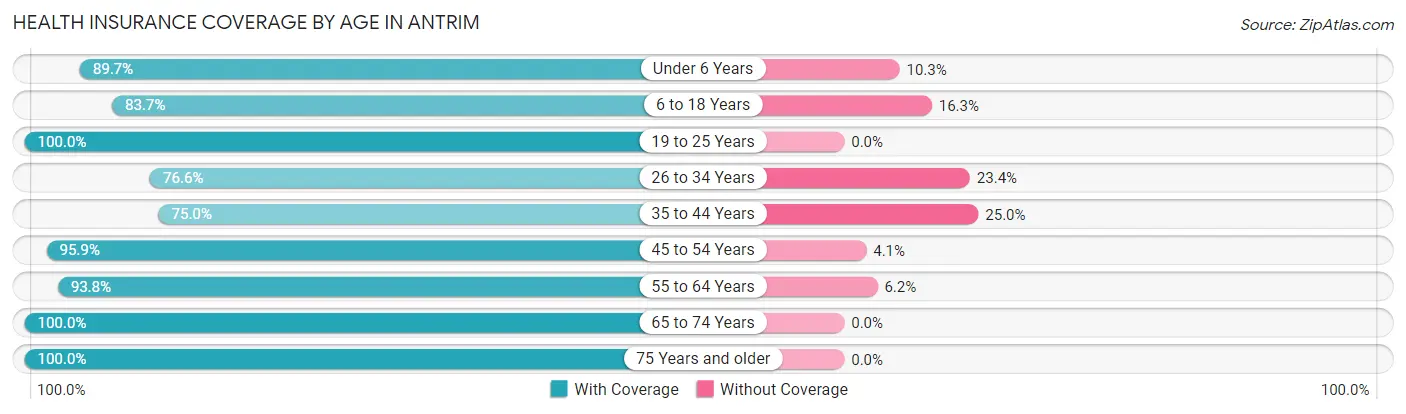
| Age Bracket | With Coverage | Without Coverage |
| Under 6 Years | 87 (89.7%) | 10 (10.3%) |
| 6 to 18 Years | 195 (83.7%) | 38 (16.3%) |
| 19 to 25 Years | 60 (100.0%) | 0 (0.0%) |
| 26 to 34 Years | 121 (76.6%) | 37 (23.4%) |
| 35 to 44 Years | 96 (75.0%) | 32 (25.0%) |
| 45 to 54 Years | 187 (95.9%) | 8 (4.1%) |
| 55 to 64 Years | 182 (93.8%) | 12 (6.2%) |
| 65 to 74 Years | 146 (100.0%) | 0 (0.0%) |
| 75 Years and older | 95 (100.0%) | 0 (0.0%) |
| Total | 1,169 (89.5%) | 137 (10.5%) |
Health Insurance Coverage by Citizenship Status in Antrim
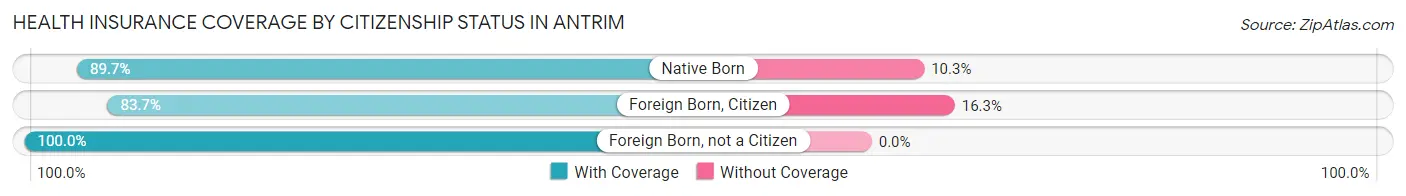
| Citizenship Status | With Coverage | Without Coverage |
| Native Born | 87 (89.7%) | 10 (10.3%) |
| Foreign Born, Citizen | 195 (83.7%) | 38 (16.3%) |
| Foreign Born, not a Citizen | 60 (100.0%) | 0 (0.0%) |
Health Insurance Coverage by Household Income in Antrim
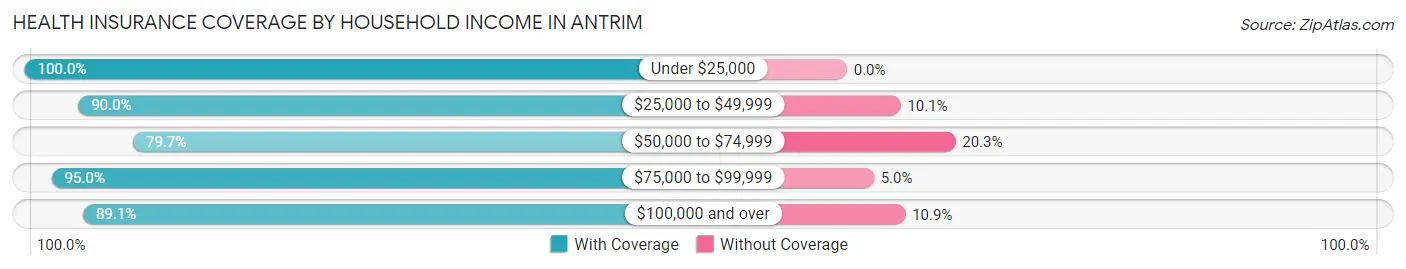
| Household Income | With Coverage | Without Coverage |
| Under $25,000 | 53 (100.0%) | 0 (0.0%) |
| $25,000 to $49,999 | 197 (89.9%) | 22 (10.1%) |
| $50,000 to $74,999 | 98 (79.7%) | 25 (20.3%) |
| $75,000 to $99,999 | 132 (95.0%) | 7 (5.0%) |
| $100,000 and over | 676 (89.1%) | 83 (10.9%) |
Public vs Private Health Insurance Coverage by Age in Antrim
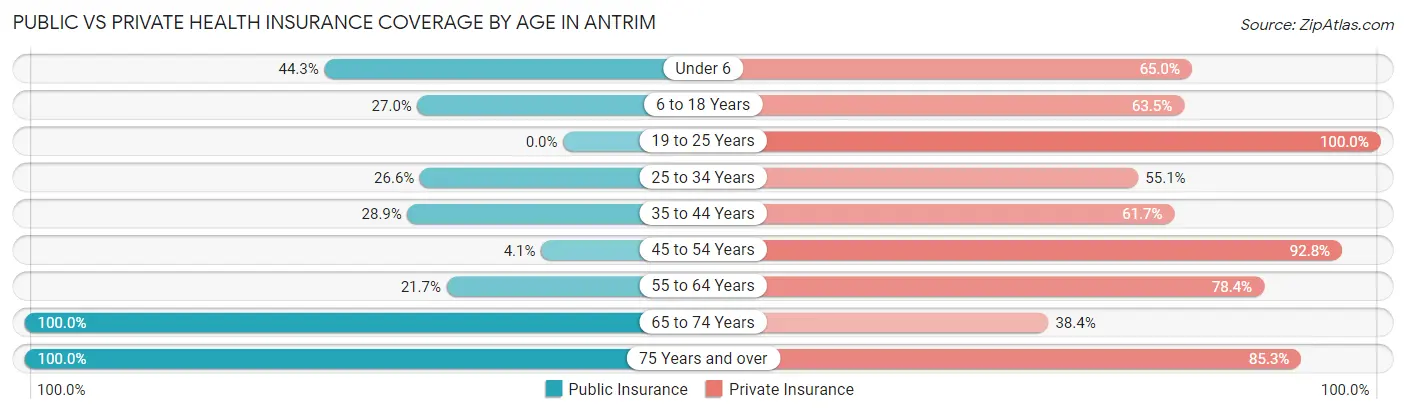
| Age Bracket | Public Insurance | Private Insurance |
| Under 6 | 43 (44.3%) | 63 (64.9%) |
| 6 to 18 Years | 63 (27.0%) | 148 (63.5%) |
| 19 to 25 Years | 0 (0.0%) | 60 (100.0%) |
| 25 to 34 Years | 42 (26.6%) | 87 (55.1%) |
| 35 to 44 Years | 37 (28.9%) | 79 (61.7%) |
| 45 to 54 Years | 8 (4.1%) | 181 (92.8%) |
| 55 to 64 Years | 42 (21.6%) | 152 (78.3%) |
| 65 to 74 Years | 146 (100.0%) | 56 (38.4%) |
| 75 Years and over | 95 (100.0%) | 81 (85.3%) |
| Total | 476 (36.4%) | 907 (69.5%) |
Disability Status by Sex by Age in Antrim
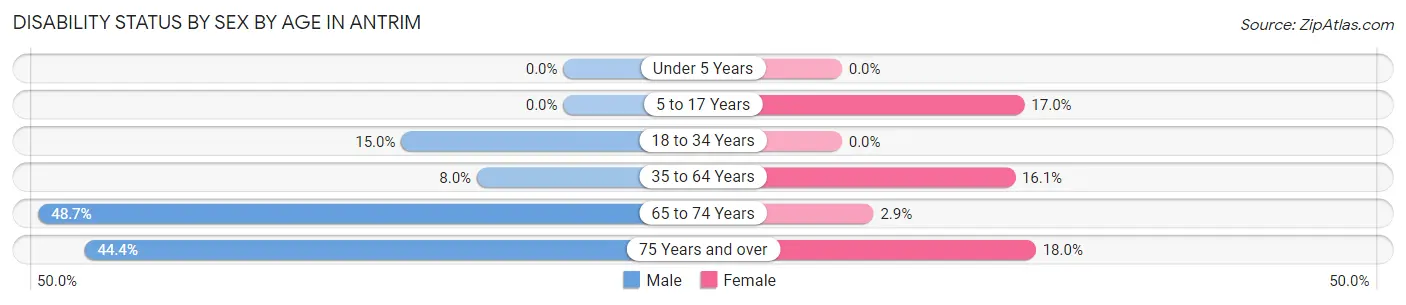
| Age Bracket | Male | Female |
| Under 5 Years | 0 (0.0%) | 0 (0.0%) |
| 5 to 17 Years | 0 (0.0%) | 10 (17.0%) |
| 18 to 34 Years | 20 (15.0%) | 0 (0.0%) |
| 35 to 64 Years | 19 (8.0%) | 45 (16.1%) |
| 65 to 74 Years | 38 (48.7%) | 2 (2.9%) |
| 75 Years and over | 20 (44.4%) | 9 (18.0%) |
Disability Class by Sex by Age in Antrim
Disability Class: Hearing Difficulty
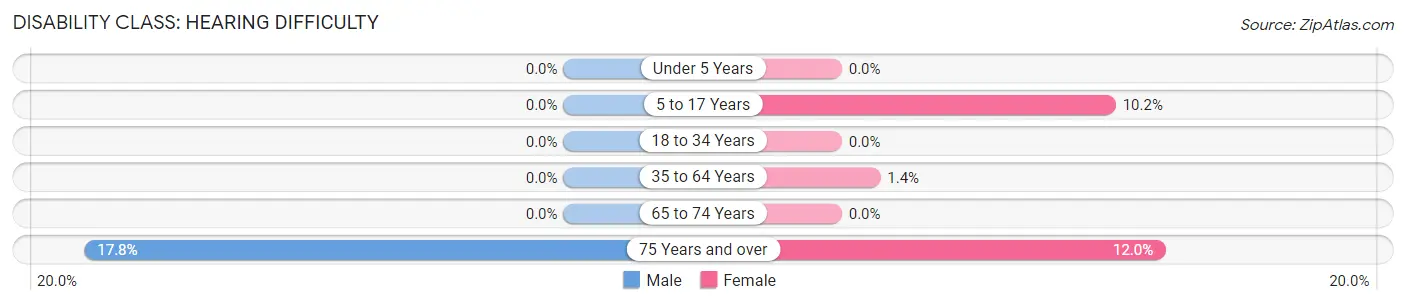
| Age Bracket | Male | Female |
| Under 5 Years | 0 (0.0%) | 0 (0.0%) |
| 5 to 17 Years | 0 (0.0%) | 6 (10.2%) |
| 18 to 34 Years | 0 (0.0%) | 0 (0.0%) |
| 35 to 64 Years | 0 (0.0%) | 4 (1.4%) |
| 65 to 74 Years | 0 (0.0%) | 0 (0.0%) |
| 75 Years and over | 8 (17.8%) | 6 (12.0%) |
Disability Class: Vision Difficulty
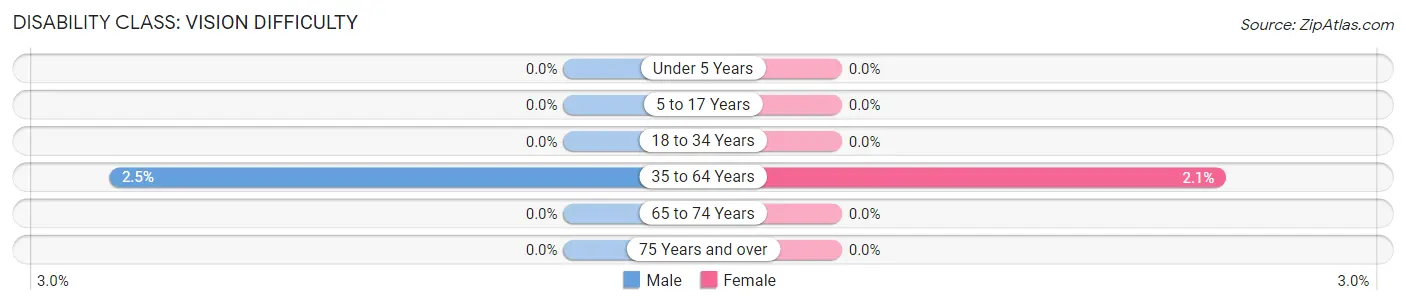
| Age Bracket | Male | Female |
| Under 5 Years | 0 (0.0%) | 0 (0.0%) |
| 5 to 17 Years | 0 (0.0%) | 0 (0.0%) |
| 18 to 34 Years | 0 (0.0%) | 0 (0.0%) |
| 35 to 64 Years | 6 (2.5%) | 6 (2.1%) |
| 65 to 74 Years | 0 (0.0%) | 0 (0.0%) |
| 75 Years and over | 0 (0.0%) | 0 (0.0%) |
Disability Class: Cognitive Difficulty
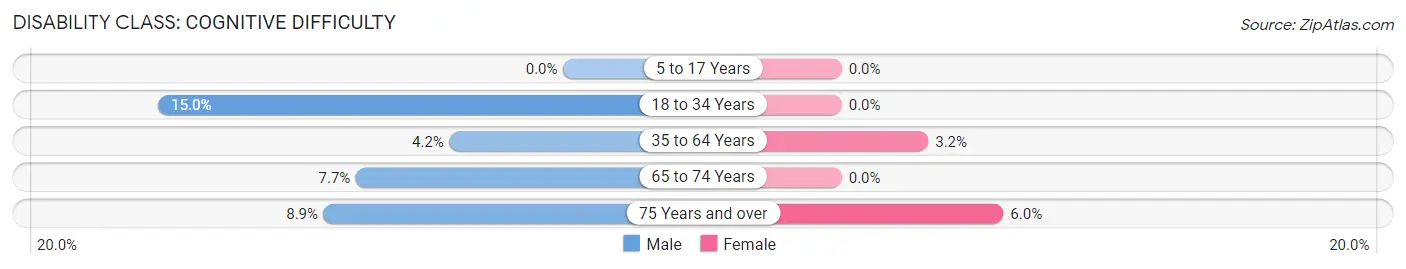
| Age Bracket | Male | Female |
| 5 to 17 Years | 0 (0.0%) | 0 (0.0%) |
| 18 to 34 Years | 20 (15.0%) | 0 (0.0%) |
| 35 to 64 Years | 10 (4.2%) | 9 (3.2%) |
| 65 to 74 Years | 6 (7.7%) | 0 (0.0%) |
| 75 Years and over | 4 (8.9%) | 3 (6.0%) |
Disability Class: Ambulatory Difficulty
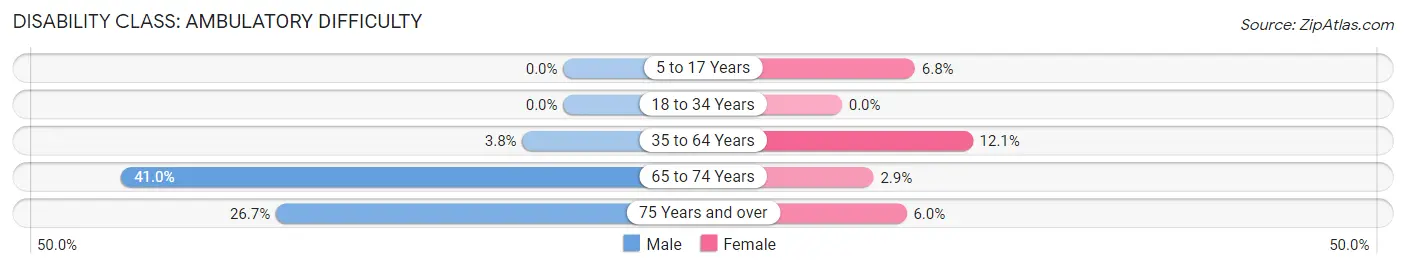
| Age Bracket | Male | Female |
| 5 to 17 Years | 0 (0.0%) | 4 (6.8%) |
| 18 to 34 Years | 0 (0.0%) | 0 (0.0%) |
| 35 to 64 Years | 9 (3.8%) | 34 (12.1%) |
| 65 to 74 Years | 32 (41.0%) | 2 (2.9%) |
| 75 Years and over | 12 (26.7%) | 3 (6.0%) |
Disability Class: Self-Care Difficulty
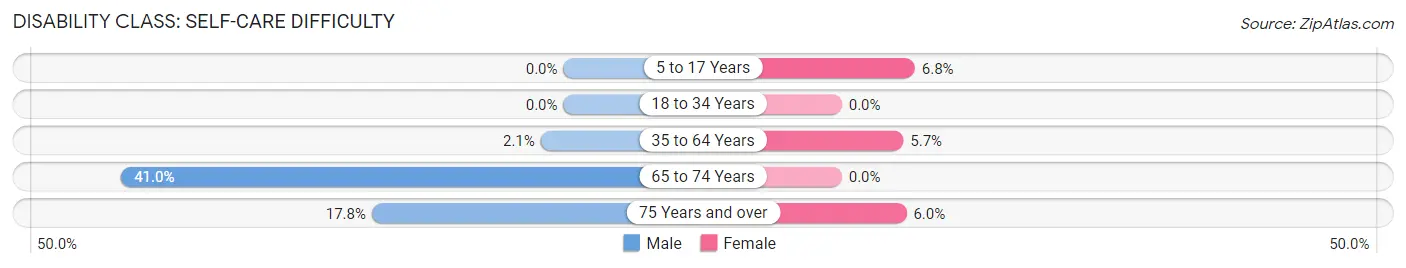
| Age Bracket | Male | Female |
| 5 to 17 Years | 0 (0.0%) | 4 (6.8%) |
| 18 to 34 Years | 0 (0.0%) | 0 (0.0%) |
| 35 to 64 Years | 5 (2.1%) | 16 (5.7%) |
| 65 to 74 Years | 32 (41.0%) | 0 (0.0%) |
| 75 Years and over | 8 (17.8%) | 3 (6.0%) |
Technology Access in Antrim
Computing Device Access in Antrim
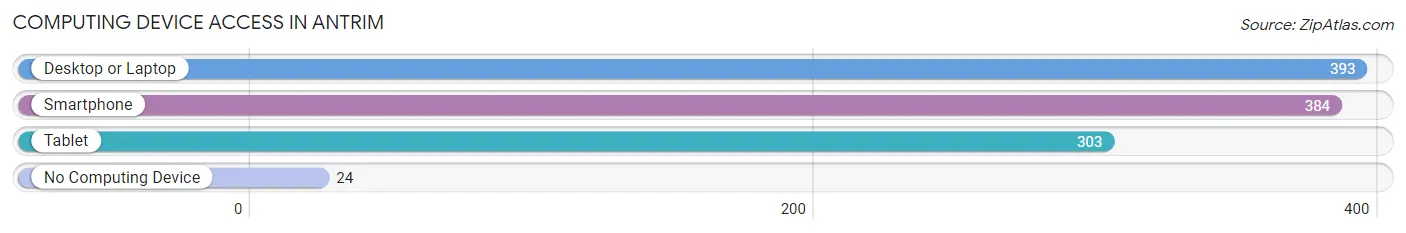
| Device Type | # Households | % Households |
| Desktop or Laptop | 393 | 79.7% |
| Smartphone | 384 | 77.9% |
| Tablet | 303 | 61.5% |
| No Computing Device | 24 | 4.9% |
| Total | 493 | 100.0% |
Internet Access in Antrim
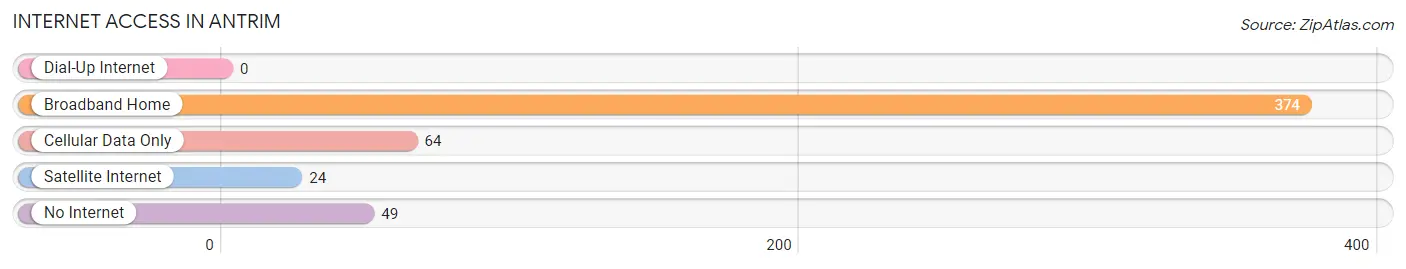
| Internet Type | # Households | % Households |
| Dial-Up Internet | 0 | 0.0% |
| Broadband Home | 374 | 75.9% |
| Cellular Data Only | 64 | 13.0% |
| Satellite Internet | 24 | 4.9% |
| No Internet | 49 | 9.9% |
| Total | 493 | 100.0% |
Antrim Summary
Antrim, New Hampshire is a small town located in Hillsborough County in the southwestern part of the state. It is situated on the banks of the Contoocook River and is bordered by the towns of Bennington, Hancock, and Hillsborough. The town has a population of 2,085 as of the 2010 census, and is part of the larger Manchester-Nashua metropolitan area.
History
The area that is now Antrim was first settled in 1741 by a group of Scots-Irish immigrants led by James McFarland. The town was originally known as “Number Four”, and was part of the Massachusetts Bay Colony. In 1761, the town was incorporated as Antrim, named after the county in Northern Ireland.
During the Revolutionary War, Antrim was a major center of activity. The town was the site of a major battle between the British and American forces in 1777, and was also the site of a major supply depot for the Continental Army.
Geography
Antrim is located in southwestern New Hampshire, in Hillsborough County. It is situated on the banks of the Contoocook River, and is bordered by the towns of Bennington, Hancock, and Hillsborough. The town has a total area of 24.2 square miles, of which 24.1 square miles is land and 0.1 square miles is water.
The town is located in the Merrimack Valley region of New Hampshire, and is part of the larger Manchester-Nashua metropolitan area. The town is located in the foothills of the White Mountains, and is home to several small lakes and ponds, including Antrim Lake, which is the largest body of water in the town.
Economy
The economy of Antrim is largely based on agriculture and tourism. The town is home to several small farms, which produce a variety of crops, including apples, corn, and hay. The town is also home to several small businesses, including a few restaurants, a general store, and a few antique shops.
Tourism is also an important part of the town’s economy. The town is home to several popular attractions, including the Antrim Historical Society Museum, the Antrim Playhouse, and the Antrim Town Hall. The town is also home to several popular hiking trails, including the Contoocook River Trail and the Antrim Rail Trail.
Demographics
As of the 2010 census, the population of Antrim was 2,085. The racial makeup of the town was 97.3% White, 0.7% African American, 0.3% Native American, 0.4% Asian, 0.1% Pacific Islander, 0.2% from other races, and 1.0% from two or more races. Hispanic or Latino of any race were 1.2% of the population.
The median household income in Antrim was $60,938, and the median family income was $68,750. The per capita income for the town was $27,945. About 5.3% of families and 7.2% of the population were below the poverty line, including 8.3% of those under age 18 and 5.2% of those age 65 or over.
Common Questions
What is Per Capita Income in Antrim?
Per Capita income in Antrim is $38,425.
What is the Median Family Income in Antrim?
Median Family Income in Antrim is $106,065.
What is the Median Household income in Antrim?
Median Household Income in Antrim is $83,542.
What is Income or Wage Gap in Antrim?
Income or Wage Gap in Antrim is 25.7%.
Women in Antrim earn 74.3 cents for every dollar earned by a man.
What is Inequality or Gini Index in Antrim?
Inequality or Gini Index in Antrim is 0.41.
What is the Total Population of Antrim?
Total Population of Antrim is 1,320.
What is the Total Male Population of Antrim?
Total Male Population of Antrim is 733.
What is the Total Female Population of Antrim?
Total Female Population of Antrim is 587.
What is the Ratio of Males per 100 Females in Antrim?
There are 124.87 Males per 100 Females in Antrim.
What is the Ratio of Females per 100 Males in Antrim?
There are 80.08 Females per 100 Males in Antrim.
What is the Median Population Age in Antrim?
Median Population Age in Antrim is 41.1 Years.
What is the Average Family Size in Antrim
Average Family Size in Antrim is 3.3 People.
What is the Average Household Size in Antrim
Average Household Size in Antrim is 2.6 People.
How Large is the Labor Force in Antrim?
There are 679 People in the Labor Forcein in Antrim.
What is the Percentage of People in the Labor Force in Antrim?
67.3% of People are in the Labor Force in Antrim.
What is the Unemployment Rate in Antrim?
Unemployment Rate in Antrim is 2.2%.