Henniker, NH Map & Demographics
Henniker Map
Henniker Overview
$35,191
PER CAPITA INCOME
$135,143
AVG FAMILY INCOME
$70,839
AVG HOUSEHOLD INCOME
50.5%
WAGE / INCOME GAP [ % ]
49.5¢/ $1
WAGE / INCOME GAP [ $ ]
0.42
INEQUALITY / GINI INDEX
2,741
TOTAL POPULATION
1,393
MALE POPULATION
1,348
FEMALE POPULATION
103.34
MALES / 100 FEMALES
96.77
FEMALES / 100 MALES
26.0
MEDIAN AGE
2.6
AVG FAMILY SIZE
1.9
AVG HOUSEHOLD SIZE
1,383
LABOR FORCE [ PEOPLE ]
56.2%
PERCENT IN LABOR FORCE
Henniker Zip Codes
Henniker Area Codes
Income in Henniker
Income Overview in Henniker
Per Capita Income in Henniker is $35,191, while median incomes of families and households are $135,143 and $70,839 respectively.
| Characteristic | Number | Measure |
| Per Capita Income | 2,741 | $35,191 |
| Median Family Income | 467 | $135,143 |
| Mean Family Income | 467 | $130,857 |
| Median Household Income | 1,115 | $70,839 |
| Mean Household Income | 1,115 | $83,391 |
| Income Deficit | 467 | $0 |
| Wage / Income Gap (%) | 2,741 | 50.54% |
| Wage / Income Gap ($) | 2,741 | 49.46¢ per $1 |
| Gini / Inequality Index | 2,741 | 0.42 |
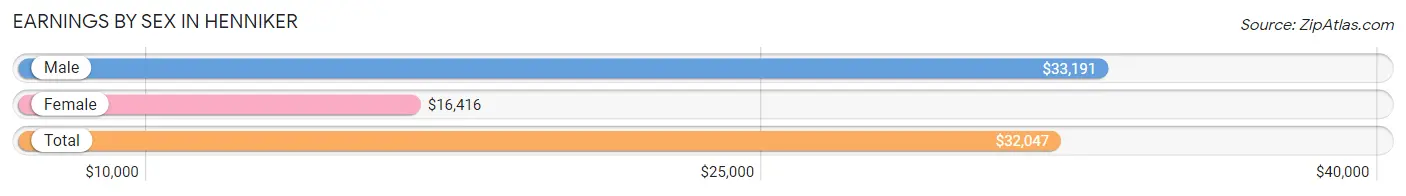
Earnings by Sex in Henniker
Average Earnings in Henniker are $32,047, $33,191 for men and $16,416 for women, a difference of 50.5%.
| Sex | Number | Average Earnings |
| Male | 1,007 (64.6%) | $33,191 |
| Female | 552 (35.4%) | $16,416 |
| Total | 1,559 (100.0%) | $32,047 |
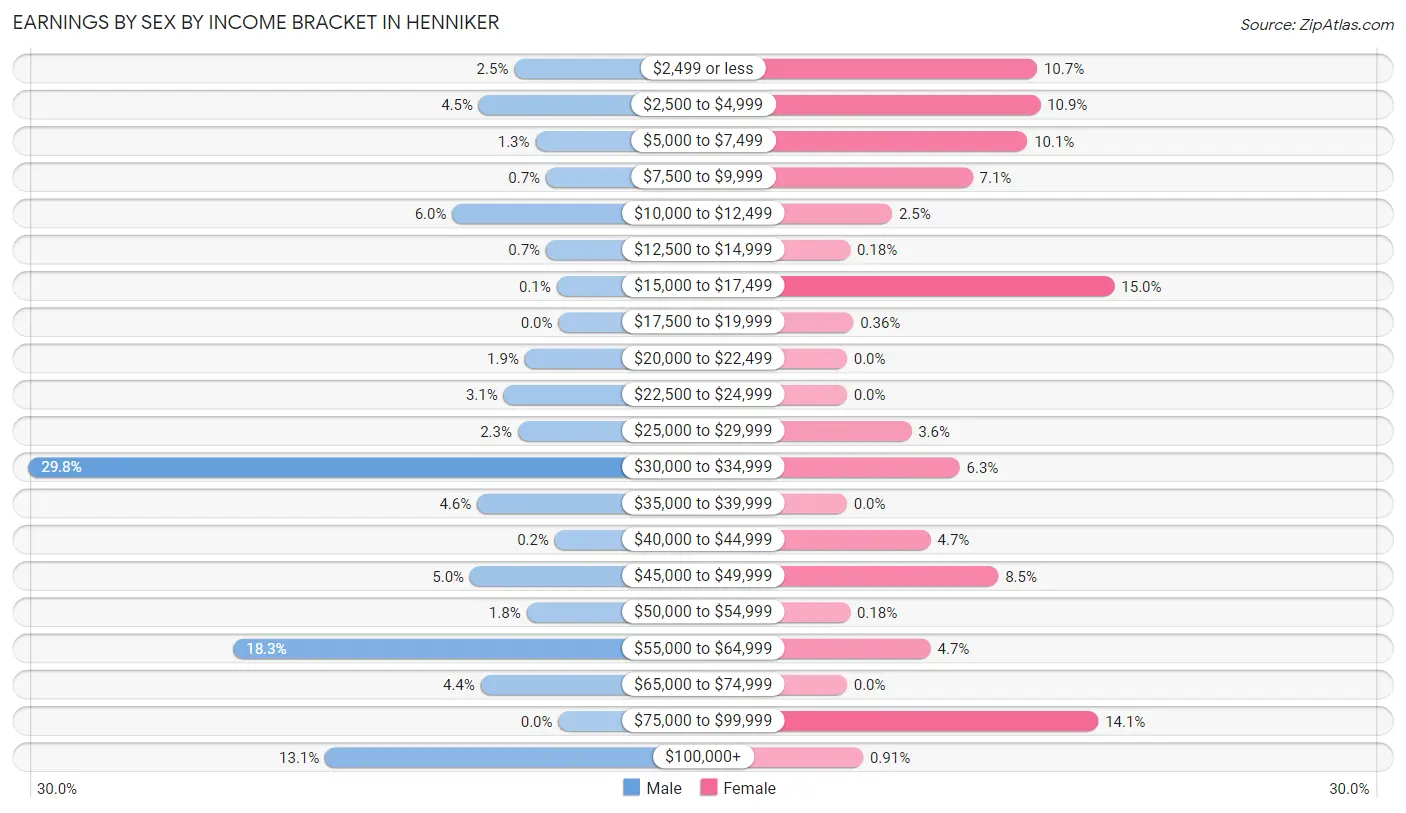
Earnings by Sex by Income Bracket in Henniker
The most common earnings brackets in Henniker are $30,000 to $34,999 for men (300 | 29.8%) and $15,000 to $17,499 for women (83 | 15.0%).
| Income | Male | Female |
| $2,499 or less | 25 (2.5%) | 59 (10.7%) |
| $2,500 to $4,999 | 45 (4.5%) | 60 (10.9%) |
| $5,000 to $7,499 | 13 (1.3%) | 56 (10.1%) |
| $7,500 to $9,999 | 7 (0.7%) | 39 (7.1%) |
| $10,000 to $12,499 | 60 (6.0%) | 14 (2.5%) |
| $12,500 to $14,999 | 7 (0.7%) | 1 (0.2%) |
| $15,000 to $17,499 | 1 (0.1%) | 83 (15.0%) |
| $17,500 to $19,999 | 0 (0.0%) | 2 (0.4%) |
| $20,000 to $22,499 | 19 (1.9%) | 0 (0.0%) |
| $22,500 to $24,999 | 31 (3.1%) | 0 (0.0%) |
| $25,000 to $29,999 | 23 (2.3%) | 20 (3.6%) |
| $30,000 to $34,999 | 300 (29.8%) | 35 (6.3%) |
| $35,000 to $39,999 | 46 (4.6%) | 0 (0.0%) |
| $40,000 to $44,999 | 2 (0.2%) | 26 (4.7%) |
| $45,000 to $49,999 | 50 (5.0%) | 47 (8.5%) |
| $50,000 to $54,999 | 18 (1.8%) | 1 (0.2%) |
| $55,000 to $64,999 | 184 (18.3%) | 26 (4.7%) |
| $65,000 to $74,999 | 44 (4.4%) | 0 (0.0%) |
| $75,000 to $99,999 | 0 (0.0%) | 78 (14.1%) |
| $100,000+ | 132 (13.1%) | 5 (0.9%) |
| Total | 1,007 (100.0%) | 552 (100.0%) |
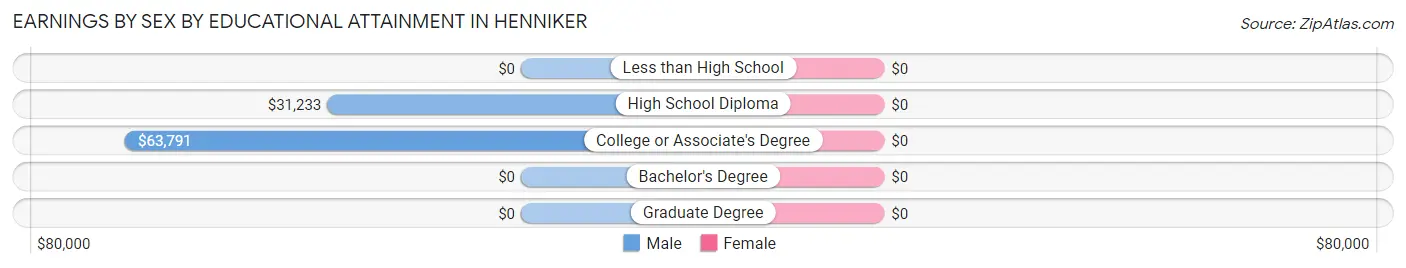
Earnings by Sex by Educational Attainment in Henniker
| Educational Attainment | Male Income | Female Income |
| Less than High School | - | - |
| High School Diploma | $31,233 | $0 |
| College or Associate's Degree | $63,791 | $0 |
| Bachelor's Degree | - | - |
| Graduate Degree | - | - |
| Total | $53,611 | $46,089 |
Family Income in Henniker
Family Income Brackets in Henniker
According to the Henniker family income data, there are 312 families falling into the $100,000 to $149,999 income range, which is the most common income bracket and makes up 66.8% of all families.
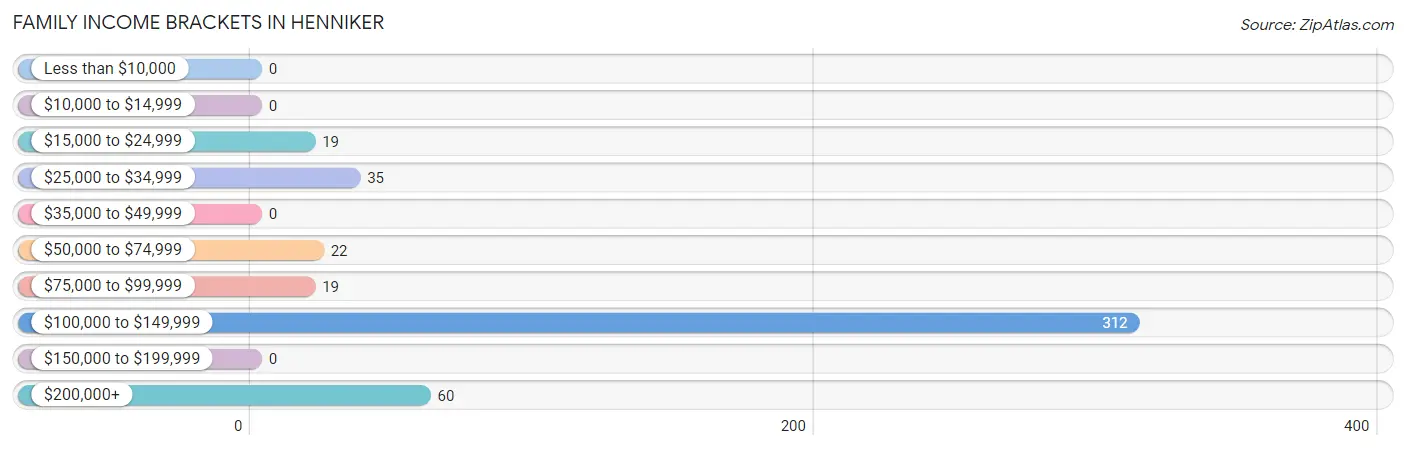
| Income Bracket | # Families | % Families |
| Less than $10,000 | 0 | 0.0% |
| $10,000 to $14,999 | 0 | 0.0% |
| $15,000 to $24,999 | 19 | 4.1% |
| $25,000 to $34,999 | 35 | 7.5% |
| $35,000 to $49,999 | 0 | 0.0% |
| $50,000 to $74,999 | 22 | 4.7% |
| $75,000 to $99,999 | 19 | 4.1% |
| $100,000 to $149,999 | 312 | 66.8% |
| $150,000 to $199,999 | 0 | 0.0% |
| $200,000+ | 60 | 12.8% |
Family Income by Famaliy Size in Henniker
2-person families (361 | 77.3%) account for the highest median family income in Henniker with $135,781 per family, while 2-person families (361 | 77.3%) have the highest median income of $67,890 per family member.
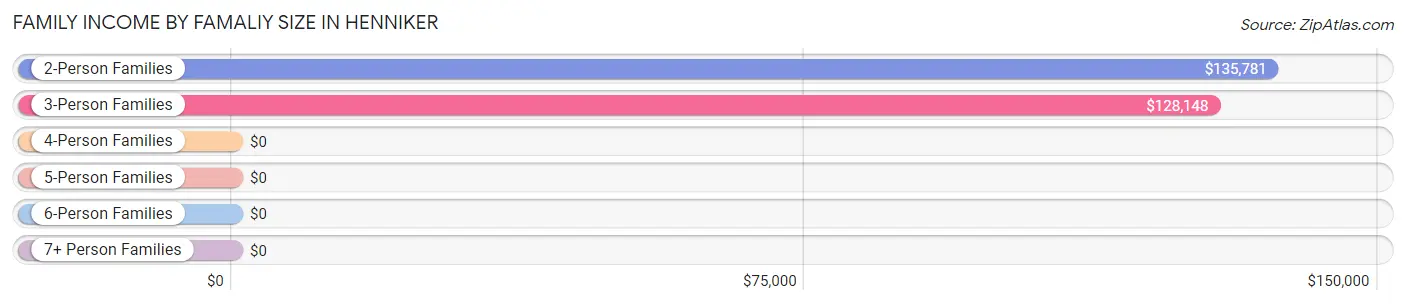
| Income Bracket | # Families | Median Income |
| 2-Person Families | 361 (77.3%) | $135,781 |
| 3-Person Families | 52 (11.1%) | $128,148 |
| 4-Person Families | 15 (3.2%) | $0 |
| 5-Person Families | 39 (8.4%) | $0 |
| 6-Person Families | 0 (0.0%) | $0 |
| 7+ Person Families | 0 (0.0%) | $0 |
| Total | 467 (100.0%) | $135,143 |
Family Income by Number of Earners in Henniker
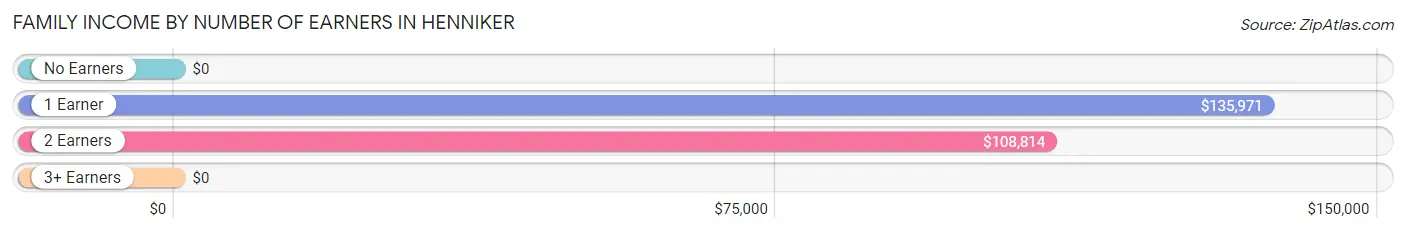
| Number of Earners | # Families | Median Income |
| No Earners | 10 (2.1%) | $0 |
| 1 Earner | 333 (71.3%) | $135,971 |
| 2 Earners | 103 (22.1%) | $108,814 |
| 3+ Earners | 21 (4.5%) | $0 |
| Total | 467 (100.0%) | $135,143 |
Household Income in Henniker
Household Income Brackets in Henniker
With 396 households falling in the category, the $100,000 to $149,999 income range is the most frequent in Henniker, accounting for 35.5% of all households.
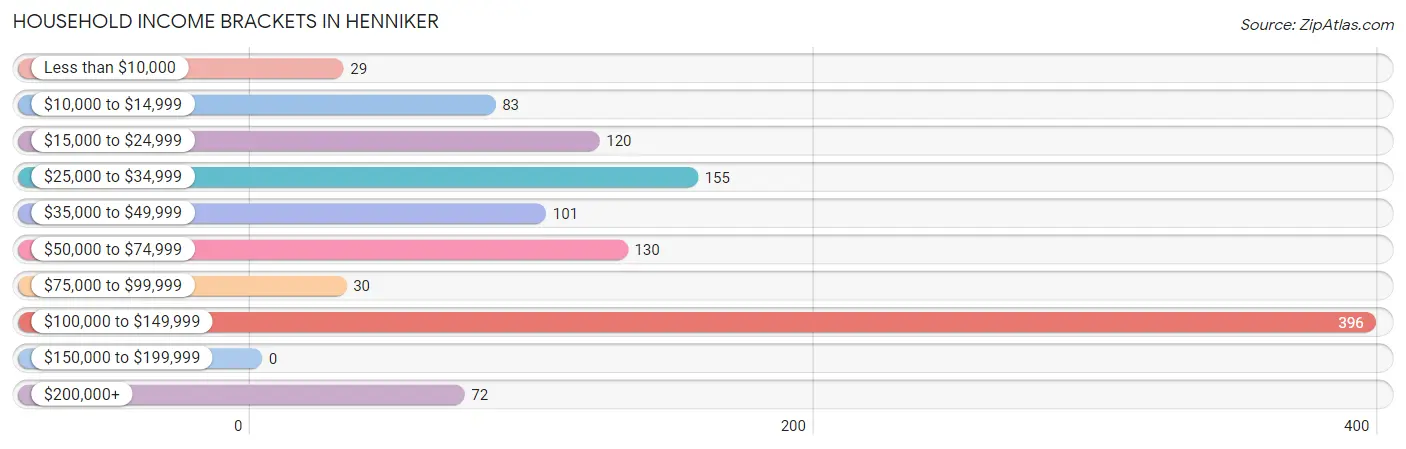
| Income Bracket | # Households | % Households |
| Less than $10,000 | 29 | 2.6% |
| $10,000 to $14,999 | 83 | 7.4% |
| $15,000 to $24,999 | 120 | 10.8% |
| $25,000 to $34,999 | 155 | 13.9% |
| $35,000 to $49,999 | 101 | 9.1% |
| $50,000 to $74,999 | 130 | 11.7% |
| $75,000 to $99,999 | 30 | 2.7% |
| $100,000 to $149,999 | 396 | 35.5% |
| $150,000 to $199,999 | 0 | 0.0% |
| $200,000+ | 72 | 6.5% |
Household Income by Householder Age in Henniker
The median household income in Henniker is $70,839, with the highest median household income of $124,844 found in the 65+ years age bracket for the primary householder. A total of 372 households (33.4%) fall into this category. Meanwhile, the 15 to 24 years age bracket for the primary householder has the lowest median household income of $0, with 241 households (21.6%) in this group.
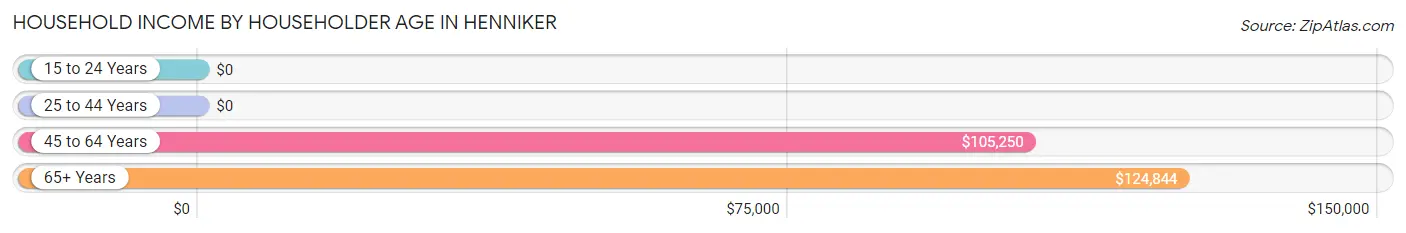
| Income Bracket | # Households | Median Income |
| 15 to 24 Years | 241 (21.6%) | $0 |
| 25 to 44 Years | 275 (24.7%) | $0 |
| 45 to 64 Years | 227 (20.4%) | $105,250 |
| 65+ Years | 372 (33.4%) | $124,844 |
| Total | 1,115 (100.0%) | $70,839 |
Poverty in Henniker
Income Below Poverty by Sex and Age in Henniker
With 8.7% poverty level for males and 10.1% for females among the residents of Henniker, 18 to 24 year old males and 55 to 64 year old females are the most vulnerable to poverty, with 90 males (33.3%) and 39 females (100.0%) in their respective age groups living below the poverty level.
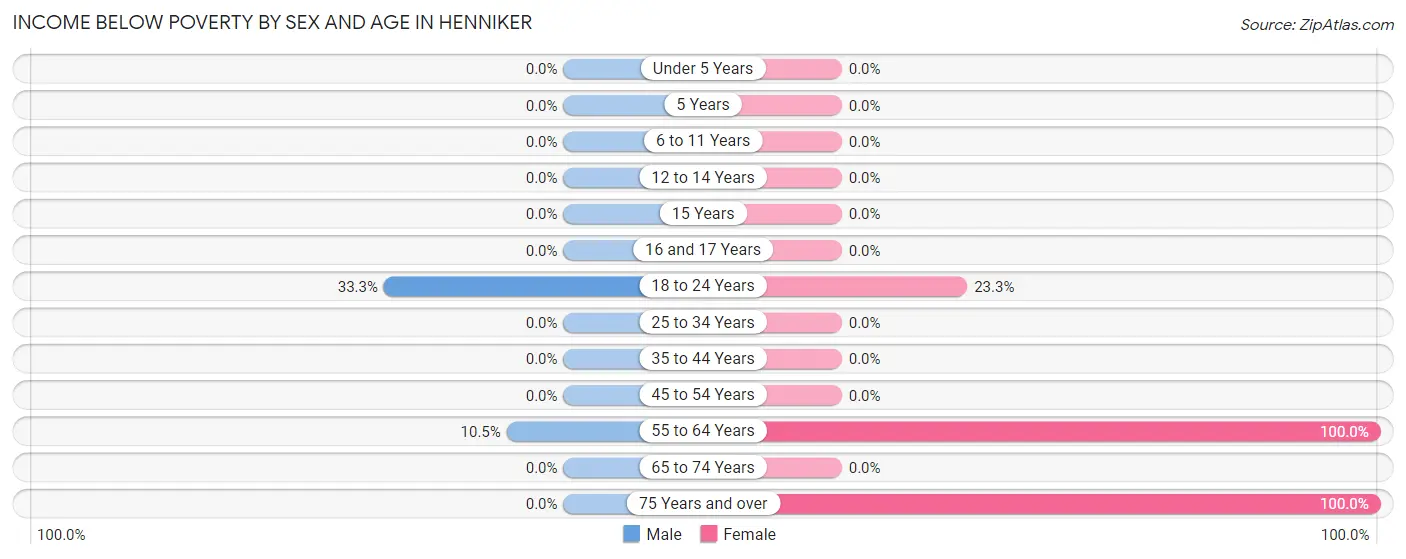
| Age Bracket | Male | Female |
| Under 5 Years | 0 (0.0%) | 0 (0.0%) |
| 5 Years | 0 (0.0%) | 0 (0.0%) |
| 6 to 11 Years | 0 (0.0%) | 0 (0.0%) |
| 12 to 14 Years | 0 (0.0%) | 0 (0.0%) |
| 15 Years | 0 (0.0%) | 0 (0.0%) |
| 16 and 17 Years | 0 (0.0%) | 0 (0.0%) |
| 18 to 24 Years | 90 (33.3%) | 44 (23.3%) |
| 25 to 34 Years | 0 (0.0%) | 0 (0.0%) |
| 35 to 44 Years | 0 (0.0%) | 0 (0.0%) |
| 45 to 54 Years | 0 (0.0%) | 0 (0.0%) |
| 55 to 64 Years | 14 (10.5%) | 39 (100.0%) |
| 65 to 74 Years | 0 (0.0%) | 0 (0.0%) |
| 75 Years and over | 0 (0.0%) | 11 (100.0%) |
| Total | 104 (8.7%) | 94 (10.1%) |
Income Above Poverty by Sex and Age in Henniker
According to the poverty statistics in Henniker, males aged under 5 years and females aged under 5 years are the age groups that are most secure financially, with 100.0% of males and 100.0% of females in these age groups living above the poverty line.
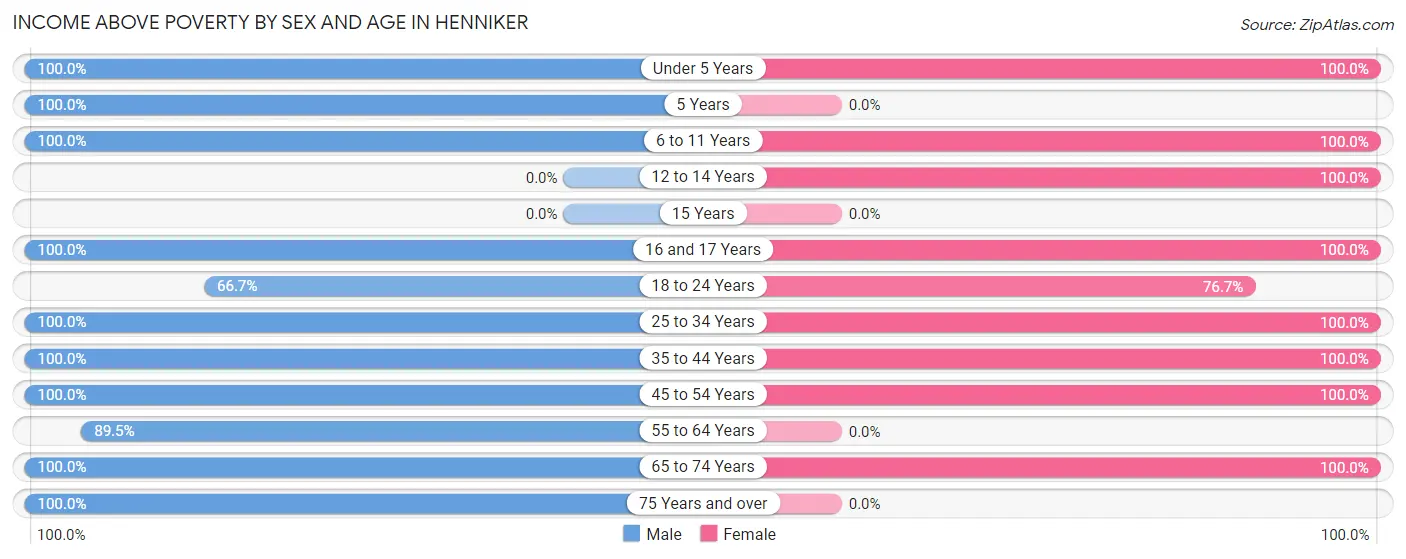
| Age Bracket | Male | Female |
| Under 5 Years | 92 (100.0%) | 65 (100.0%) |
| 5 Years | 35 (100.0%) | 0 (0.0%) |
| 6 to 11 Years | 27 (100.0%) | 28 (100.0%) |
| 12 to 14 Years | 0 (0.0%) | 33 (100.0%) |
| 15 Years | 0 (0.0%) | 0 (0.0%) |
| 16 and 17 Years | 14 (100.0%) | 12 (100.0%) |
| 18 to 24 Years | 180 (66.7%) | 145 (76.7%) |
| 25 to 34 Years | 276 (100.0%) | 81 (100.0%) |
| 35 to 44 Years | 27 (100.0%) | 18 (100.0%) |
| 45 to 54 Years | 18 (100.0%) | 82 (100.0%) |
| 55 to 64 Years | 119 (89.5%) | 0 (0.0%) |
| 65 to 74 Years | 297 (100.0%) | 370 (100.0%) |
| 75 Years and over | 8 (100.0%) | 0 (0.0%) |
| Total | 1,093 (91.3%) | 834 (89.9%) |
Income Below Poverty Among Married-Couple Families in Henniker
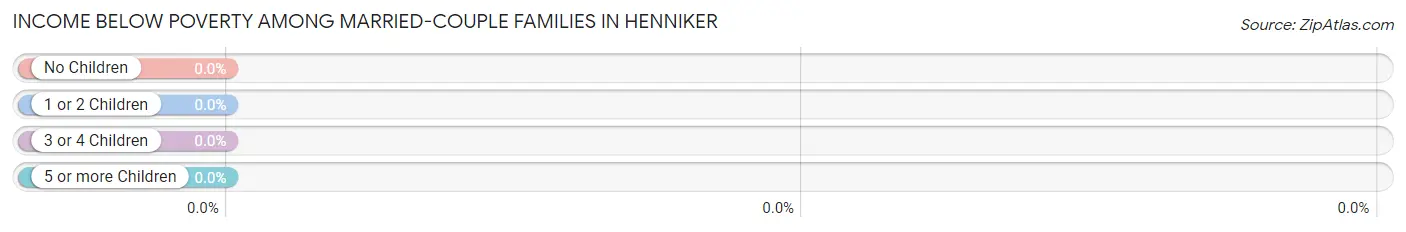
| Children | Above Poverty | Below Poverty |
| No Children | 313 (100.0%) | 0 (0.0%) |
| 1 or 2 Children | 18 (100.0%) | 0 (0.0%) |
| 3 or 4 Children | 39 (100.0%) | 0 (0.0%) |
| 5 or more Children | 0 (0.0%) | 0 (0.0%) |
| Total | 370 (100.0%) | 0 (0.0%) |
Income Below Poverty Among Single-Parent Households in Henniker
| Children | Single Father | Single Mother |
| No Children | 0 (0.0%) | 0 (0.0%) |
| 1 or 2 Children | 0 (0.0%) | 0 (0.0%) |
| 3 or 4 Children | 0 (0.0%) | 0 (0.0%) |
| 5 or more Children | 0 (0.0%) | 0 (0.0%) |
| Total | 0 (0.0%) | 0 (0.0%) |
Income Below Poverty Among Married-Couple vs Single-Parent Households in Henniker
| Children | Married-Couple Families | Single-Parent Households |
| No Children | 0 (0.0%) | 0 (0.0%) |
| 1 or 2 Children | 0 (0.0%) | 0 (0.0%) |
| 3 or 4 Children | 0 (0.0%) | 0 (0.0%) |
| 5 or more Children | 0 (0.0%) | 0 (0.0%) |
| Total | 0 (0.0%) | 0 (0.0%) |
Race in Henniker
The most populous races in Henniker are White / Caucasian (2,662 | 97.1%), Hispanic or Latino (175 | 6.4%), and Black / African American (35 | 1.3%).
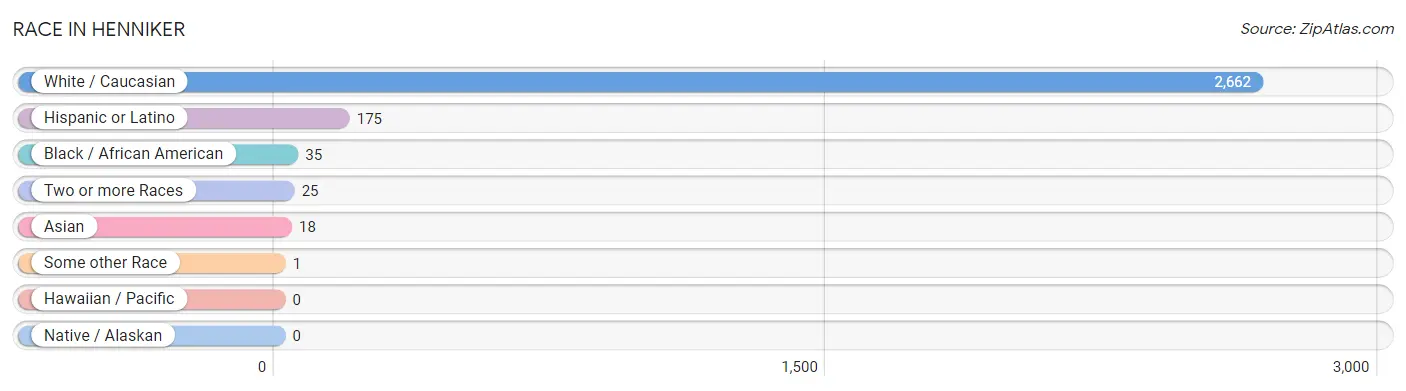
| Race | # Population | % Population |
| Asian | 18 | 0.7% |
| Black / African American | 35 | 1.3% |
| Hawaiian / Pacific | 0 | 0.0% |
| Hispanic or Latino | 175 | 6.4% |
| Native / Alaskan | 0 | 0.0% |
| White / Caucasian | 2,662 | 97.1% |
| Two or more Races | 25 | 0.9% |
| Some other Race | 1 | 0.0% |
| Total | 2,741 | 100.0% |
Ancestry in Henniker
The most populous ancestries reported in Henniker are English (957 | 34.9%), Irish (748 | 27.3%), German (419 | 15.3%), French (209 | 7.6%), and Italian (168 | 6.1%), together accounting for 91.2% of all Henniker residents.
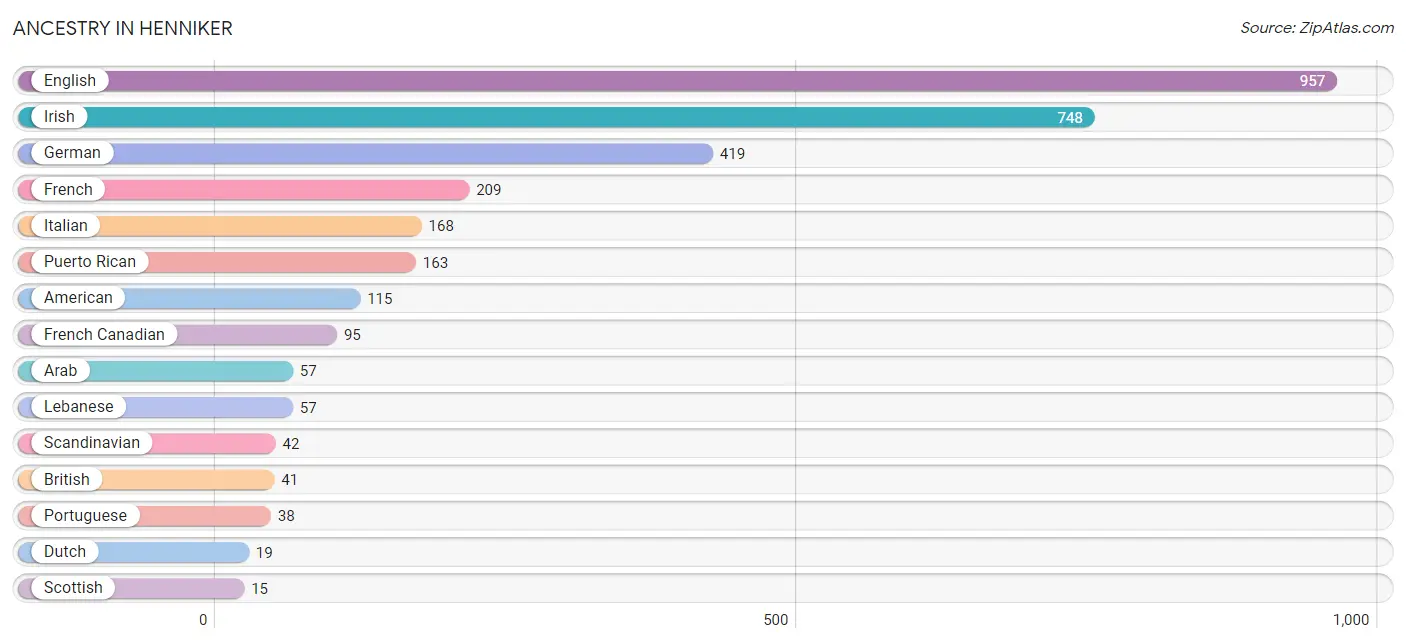
| Ancestry | # Population | % Population |
| American | 115 | 4.2% |
| Arab | 57 | 2.1% |
| Barbadian | 1 | 0.0% |
| Bhutanese | 4 | 0.2% |
| British | 41 | 1.5% |
| Burmese | 5 | 0.2% |
| Canadian | 5 | 0.2% |
| Cuban | 2 | 0.1% |
| Czech | 2 | 0.1% |
| Dominican | 10 | 0.4% |
| Dutch | 19 | 0.7% |
| English | 957 | 34.9% |
| European | 1 | 0.0% |
| French | 209 | 7.6% |
| French Canadian | 95 | 3.5% |
| German | 419 | 15.3% |
| Haitian | 1 | 0.0% |
| Indian (Asian) | 2 | 0.1% |
| Irish | 748 | 27.3% |
| Italian | 168 | 6.1% |
| Jamaican | 2 | 0.1% |
| Korean | 6 | 0.2% |
| Lebanese | 57 | 2.1% |
| Polish | 14 | 0.5% |
| Portuguese | 38 | 1.4% |
| Puerto Rican | 163 | 5.9% |
| Scandinavian | 42 | 1.5% |
| Scotch-Irish | 11 | 0.4% |
| Scottish | 15 | 0.5% |
| Subsaharan African | 2 | 0.1% |
| Swiss | 1 | 0.0% |
| Thai | 13 | 0.5% |
| Trinidadian and Tobagonian | 5 | 0.2% |
| Turkish | 2 | 0.1% | View All 34 Rows |
Immigrants in Henniker
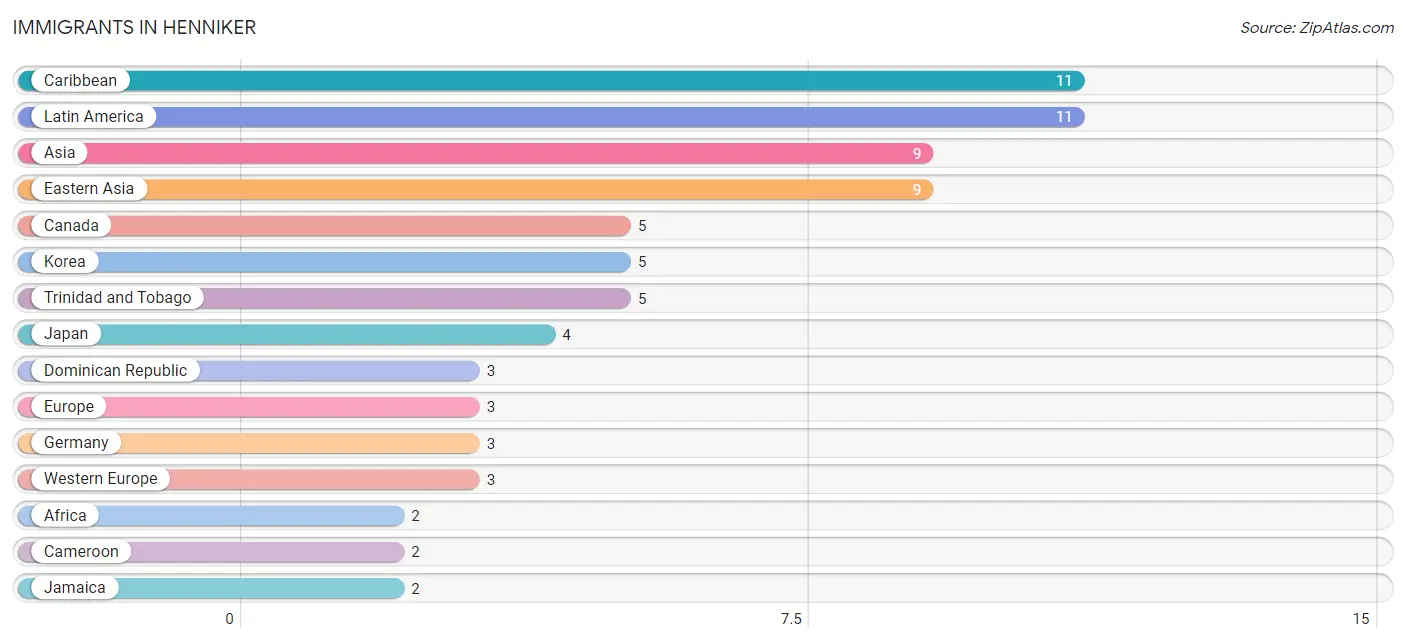
The most numerous immigrant groups reported in Henniker came from Caribbean (11 | 0.4%), Latin America (11 | 0.4%), Asia (9 | 0.3%), Eastern Asia (9 | 0.3%), and Canada (5 | 0.2%), together accounting for 1.6% of all Henniker residents.
| Immigration Origin | # Population | % Population |
| Africa | 2 | 0.1% |
| Asia | 9 | 0.3% |
| Cameroon | 2 | 0.1% |
| Canada | 5 | 0.2% |
| Caribbean | 11 | 0.4% |
| Dominican Republic | 3 | 0.1% |
| Eastern Asia | 9 | 0.3% |
| Europe | 3 | 0.1% |
| Germany | 3 | 0.1% |
| Haiti | 1 | 0.0% |
| Jamaica | 2 | 0.1% |
| Japan | 4 | 0.2% |
| Korea | 5 | 0.2% |
| Latin America | 11 | 0.4% |
| Middle Africa | 2 | 0.1% |
| Trinidad and Tobago | 5 | 0.2% |
| Western Europe | 3 | 0.1% | View All 17 Rows |
Sex and Age in Henniker
Sex and Age in Henniker
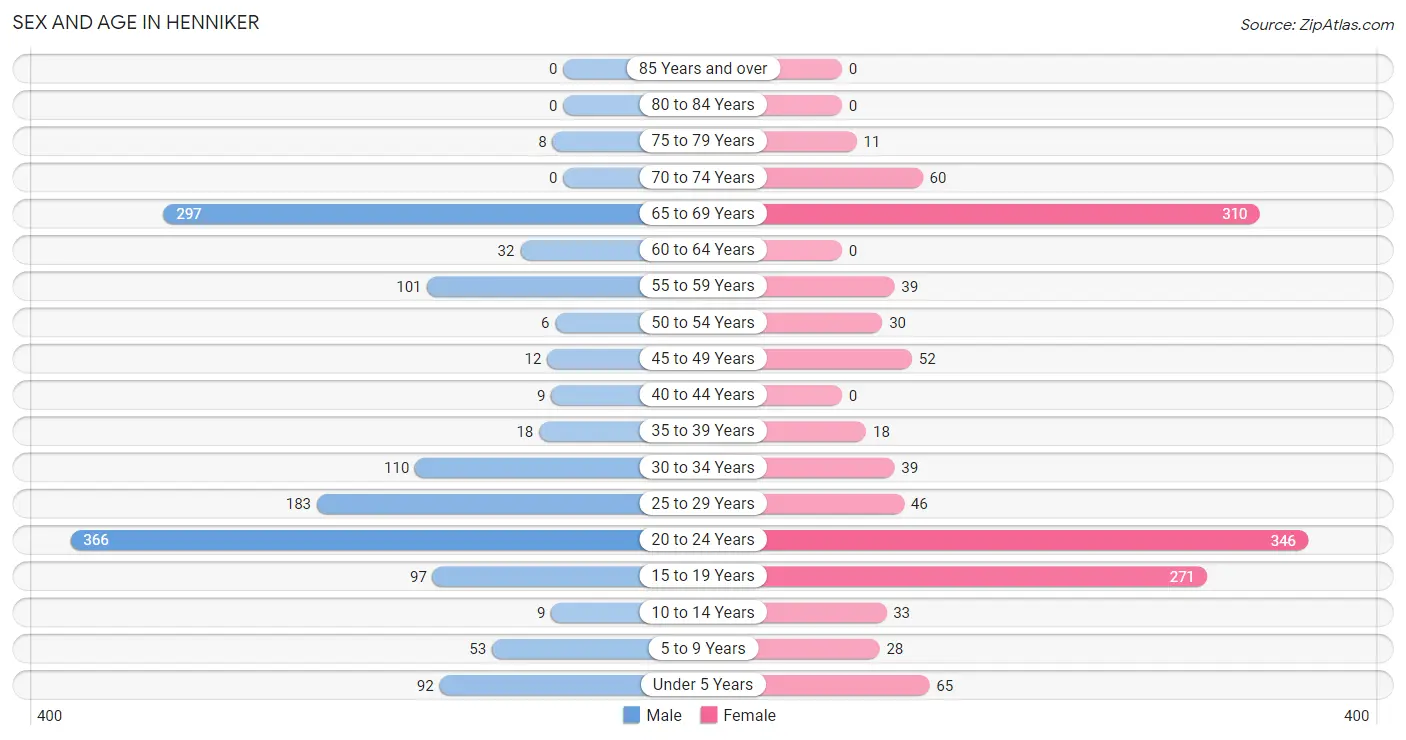
The most populous age groups in Henniker are 20 to 24 Years (366 | 26.3%) for men and 20 to 24 Years (346 | 25.7%) for women.
| Age Bracket | Male | Female |
| Under 5 Years | 92 (6.6%) | 65 (4.8%) |
| 5 to 9 Years | 53 (3.8%) | 28 (2.1%) |
| 10 to 14 Years | 9 (0.6%) | 33 (2.5%) |
| 15 to 19 Years | 97 (7.0%) | 271 (20.1%) |
| 20 to 24 Years | 366 (26.3%) | 346 (25.7%) |
| 25 to 29 Years | 183 (13.1%) | 46 (3.4%) |
| 30 to 34 Years | 110 (7.9%) | 39 (2.9%) |
| 35 to 39 Years | 18 (1.3%) | 18 (1.3%) |
| 40 to 44 Years | 9 (0.6%) | 0 (0.0%) |
| 45 to 49 Years | 12 (0.9%) | 52 (3.9%) |
| 50 to 54 Years | 6 (0.4%) | 30 (2.2%) |
| 55 to 59 Years | 101 (7.2%) | 39 (2.9%) |
| 60 to 64 Years | 32 (2.3%) | 0 (0.0%) |
| 65 to 69 Years | 297 (21.3%) | 310 (23.0%) |
| 70 to 74 Years | 0 (0.0%) | 60 (4.4%) |
| 75 to 79 Years | 8 (0.6%) | 11 (0.8%) |
| 80 to 84 Years | 0 (0.0%) | 0 (0.0%) |
| 85 Years and over | 0 (0.0%) | 0 (0.0%) |
| Total | 1,393 (100.0%) | 1,348 (100.0%) |
Families and Households in Henniker
Median Family Size in Henniker
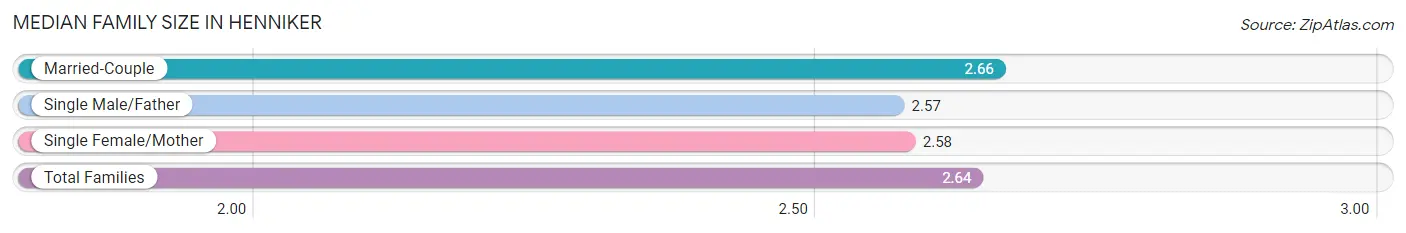
The median family size in Henniker is 2.64 persons per family, with married-couple families (370 | 79.2%) accounting for the largest median family size of 2.66 persons per family. On the other hand, single male/father families (47 | 10.1%) represent the smallest median family size with 2.57 persons per family.
| Family Type | # Families | Family Size |
| Married-Couple | 370 (79.2%) | 2.66 |
| Single Male/Father | 47 (10.1%) | 2.57 |
| Single Female/Mother | 50 (10.7%) | 2.58 |
| Total Families | 467 (100.0%) | 2.64 |
Median Household Size in Henniker
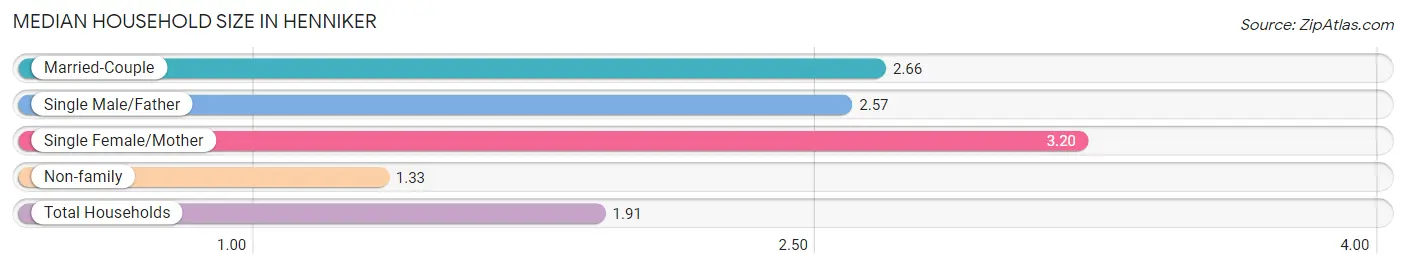
The median household size in Henniker is 1.91 persons per household, with single female/mother households (50 | 4.5%) accounting for the largest median household size of 3.2 persons per household. non-family households (648 | 58.1%) represent the smallest median household size with 1.33 persons per household.
| Household Type | # Households | Household Size |
| Married-Couple | 370 (33.2%) | 2.66 |
| Single Male/Father | 47 (4.2%) | 2.57 |
| Single Female/Mother | 50 (4.5%) | 3.20 |
| Non-family | 648 (58.1%) | 1.33 |
| Total Households | 1,115 (100.0%) | 1.91 |
Household Size by Marriage Status in Henniker
Out of a total of 1,115 households in Henniker, 467 (41.9%) are family households, while 648 (58.1%) are nonfamily households. The most numerous type of family households are 2-person households, comprising 326, and the most common type of nonfamily households are 1-person households, comprising 486.
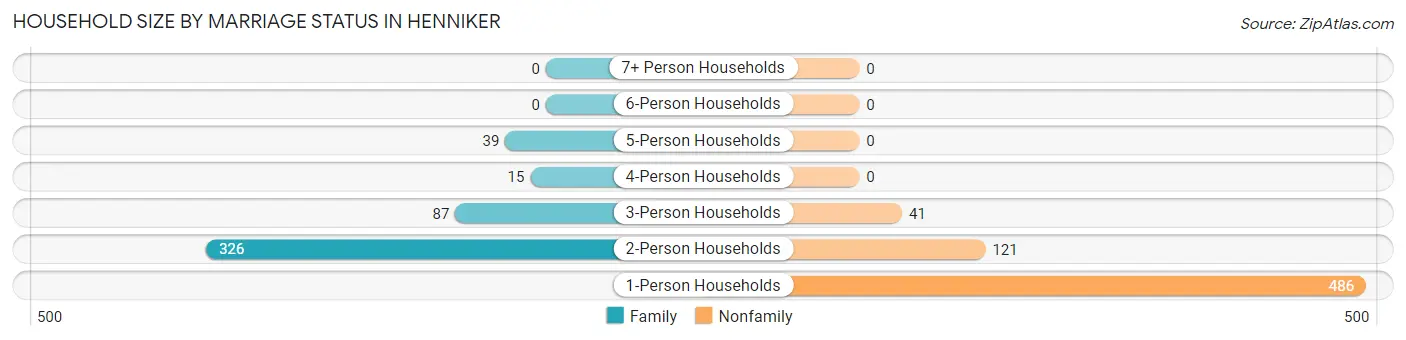
| Household Size | Family Households | Nonfamily Households |
| 1-Person Households | - | 486 (43.6%) |
| 2-Person Households | 326 (29.2%) | 121 (10.8%) |
| 3-Person Households | 87 (7.8%) | 41 (3.7%) |
| 4-Person Households | 15 (1.3%) | 0 (0.0%) |
| 5-Person Households | 39 (3.5%) | 0 (0.0%) |
| 6-Person Households | 0 (0.0%) | 0 (0.0%) |
| 7+ Person Households | 0 (0.0%) | 0 (0.0%) |
| Total | 467 (41.9%) | 648 (58.1%) |
Female Fertility in Henniker
Fertility by Age in Henniker
| Age Bracket | Women with Births | Births / 1,000 Women |
| 15 to 19 years | 0 (0.0%) | 0.0 |
| 20 to 34 years | 0 (0.0%) | 0.0 |
| 35 to 50 years | 0 (0.0%) | 0.0 |
| Total | 0 (0.0%) | 0.0 |
Fertility by Age by Marriage Status in Henniker
| Age Bracket | Married | Unmarried |
| 15 to 19 years | 0 (0.0%) | 0 (0.0%) |
| 20 to 34 years | 0 (0.0%) | 0 (0.0%) |
| 35 to 50 years | 0 (0.0%) | 0 (0.0%) |
| Total | 0 (0.0%) | 0 (0.0%) |
Fertility by Education in Henniker
| Educational Attainment | Women with Births | Births / 1,000 Women |
| Less than High School | 0 (0.0%) | 0.0 |
| High School Diploma | 0 (0.0%) | 0.0 |
| College or Associate's Degree | 0 (0.0%) | 0.0 |
| Bachelor's Degree | 0 (0.0%) | 0.0 |
| Graduate Degree | 0 (0.0%) | 0.0 |
| Total | 0 (0.0%) | 0.0 |
Fertility by Education by Marriage Status in Henniker
| Educational Attainment | Married | Unmarried |
| Less than High School | 0 (0.0%) | 0 (0.0%) |
| High School Diploma | 0 (0.0%) | 0 (0.0%) |
| College or Associate's Degree | 0 (0.0%) | 0 (0.0%) |
| Bachelor's Degree | 0 (0.0%) | 0 (0.0%) |
| Graduate Degree | 0 (0.0%) | 0 (0.0%) |
| Total | 0 (0.0%) | 0 (0.0%) |
Employment Characteristics in Henniker
Employment by Class of Employer in Henniker
Among the 1,294 employed individuals in Henniker, private company employees (842 | 65.1%), self-employed (incorporated) (184 | 14.2%), and not-for-profit organizations (138 | 10.7%) make up the most common classes of employment.
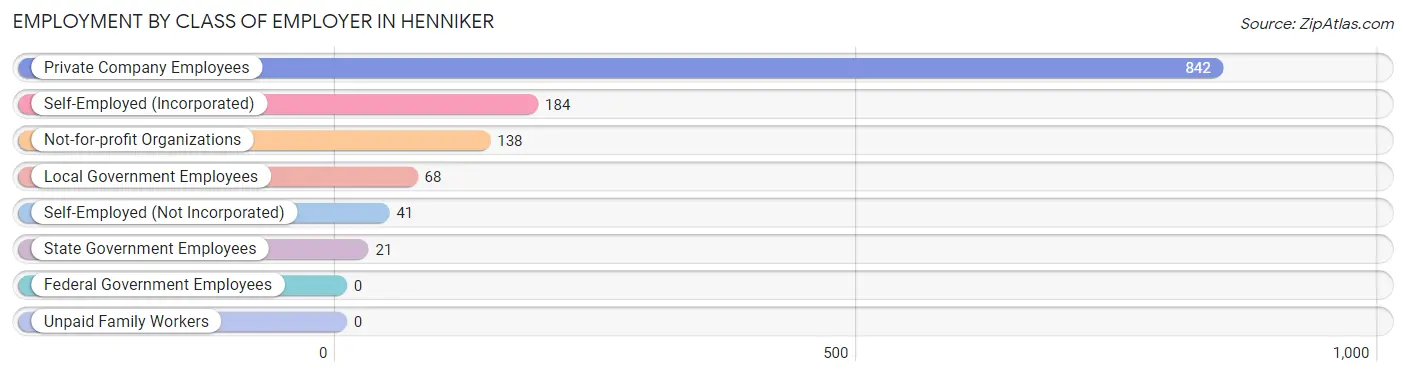
| Employer Class | # Employees | % Employees |
| Private Company Employees | 842 | 65.1% |
| Self-Employed (Incorporated) | 184 | 14.2% |
| Self-Employed (Not Incorporated) | 41 | 3.2% |
| Not-for-profit Organizations | 138 | 10.7% |
| Local Government Employees | 68 | 5.3% |
| State Government Employees | 21 | 1.6% |
| Federal Government Employees | 0 | 0.0% |
| Unpaid Family Workers | 0 | 0.0% |
| Total | 1,294 | 100.0% |
Employment Status by Age in Henniker
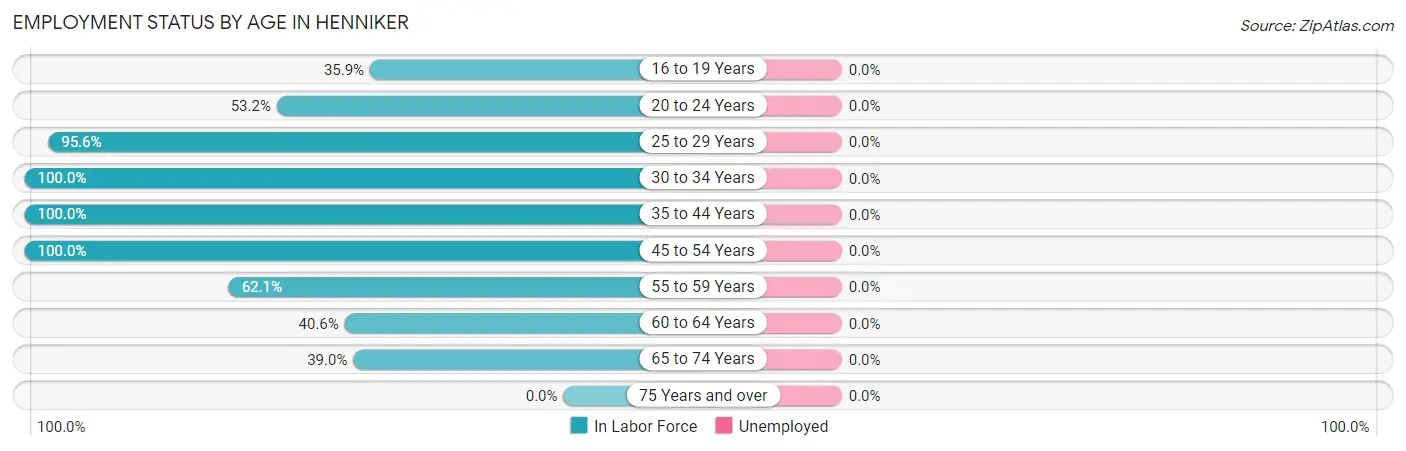
| Age Bracket | In Labor Force | Unemployed |
| 16 to 19 Years | 132 (35.9%) | 0 (0.0%) |
| 20 to 24 Years | 379 (53.2%) | 0 (0.0%) |
| 25 to 29 Years | 219 (95.6%) | 0 (0.0%) |
| 30 to 34 Years | 149 (100.0%) | 0 (0.0%) |
| 35 to 44 Years | 45 (100.0%) | 0 (0.0%) |
| 45 to 54 Years | 100 (100.0%) | 0 (0.0%) |
| 55 to 59 Years | 87 (62.1%) | 0 (0.0%) |
| 60 to 64 Years | 13 (40.6%) | 0 (0.0%) |
| 65 to 74 Years | 260 (39.0%) | 0 (0.0%) |
| 75 Years and over | 0 (0.0%) | 0 (0.0%) |
| Total | 1,383 (56.2%) | 0 (0.0%) |
Employment Status by Educational Attainment in Henniker
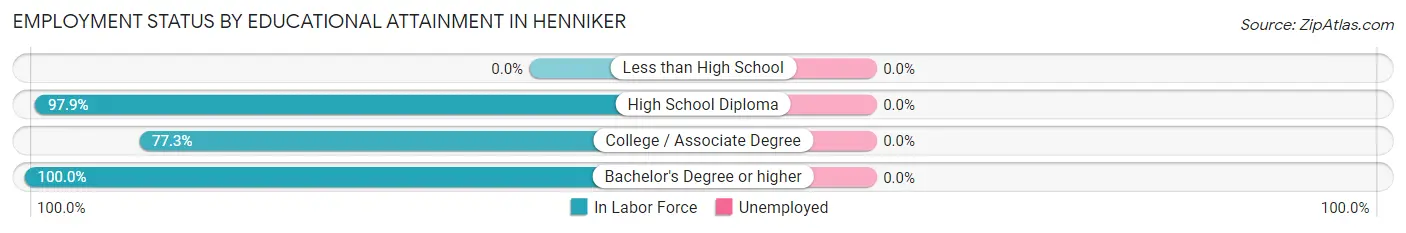
| Educational Attainment | In Labor Force | Unemployed |
| Less than High School | 0 (0.0%) | 0 (0.0%) |
| High School Diploma | 233 (97.9%) | 0 (0.0%) |
| College / Associate Degree | 198 (77.3%) | 0 (0.0%) |
| Bachelor's Degree or higher | 182 (100.0%) | 0 (0.0%) |
| Total | 613 (88.2%) | 0 (0.0%) |
Employment Occupations by Sex in Henniker
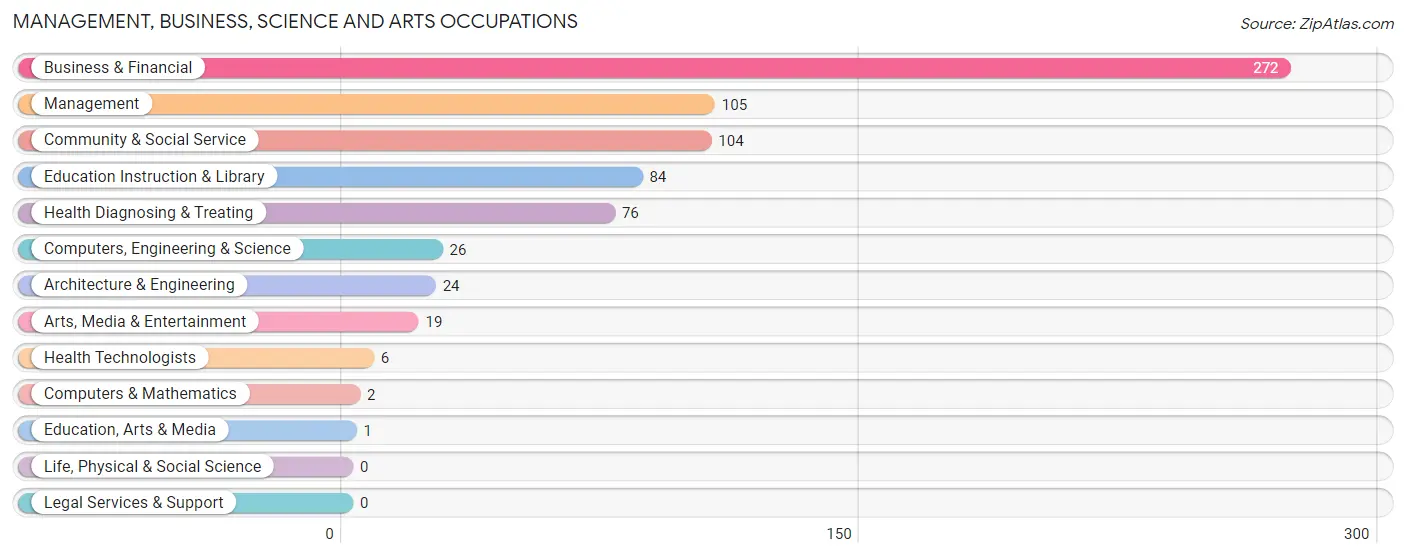
Management, Business, Science and Arts Occupations
The most common Management, Business, Science and Arts occupations in Henniker are Business & Financial (272 | 19.7%), Management (105 | 7.6%), Community & Social Service (104 | 7.5%), Education Instruction & Library (84 | 6.1%), and Health Diagnosing & Treating (76 | 5.5%).
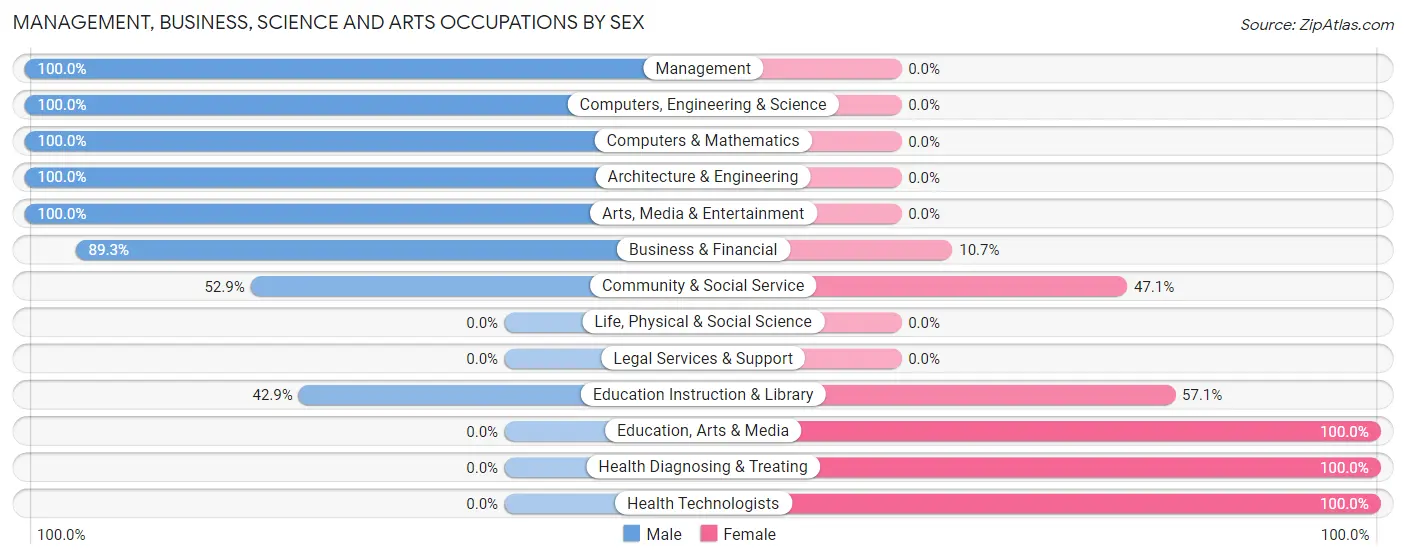
Management, Business, Science and Arts Occupations by Sex
Within the Management, Business, Science and Arts occupations in Henniker, the most male-oriented occupations are Management (100.0%), Computers, Engineering & Science (100.0%), and Computers & Mathematics (100.0%), while the most female-oriented occupations are Education, Arts & Media (100.0%), Health Diagnosing & Treating (100.0%), and Health Technologists (100.0%).
| Occupation | Male | Female |
| Management | 105 (100.0%) | 0 (0.0%) |
| Business & Financial | 243 (89.3%) | 29 (10.7%) |
| Computers, Engineering & Science | 26 (100.0%) | 0 (0.0%) |
| Computers & Mathematics | 2 (100.0%) | 0 (0.0%) |
| Architecture & Engineering | 24 (100.0%) | 0 (0.0%) |
| Life, Physical & Social Science | 0 (0.0%) | 0 (0.0%) |
| Community & Social Service | 55 (52.9%) | 49 (47.1%) |
| Education, Arts & Media | 0 (0.0%) | 1 (100.0%) |
| Legal Services & Support | 0 (0.0%) | 0 (0.0%) |
| Education Instruction & Library | 36 (42.9%) | 48 (57.1%) |
| Arts, Media & Entertainment | 19 (100.0%) | 0 (0.0%) |
| Health Diagnosing & Treating | 0 (0.0%) | 76 (100.0%) |
| Health Technologists | 0 (0.0%) | 6 (100.0%) |
| Total (Category) | 429 (73.6%) | 154 (26.4%) |
| Total (Overall) | 914 (66.0%) | 470 (34.0%) |
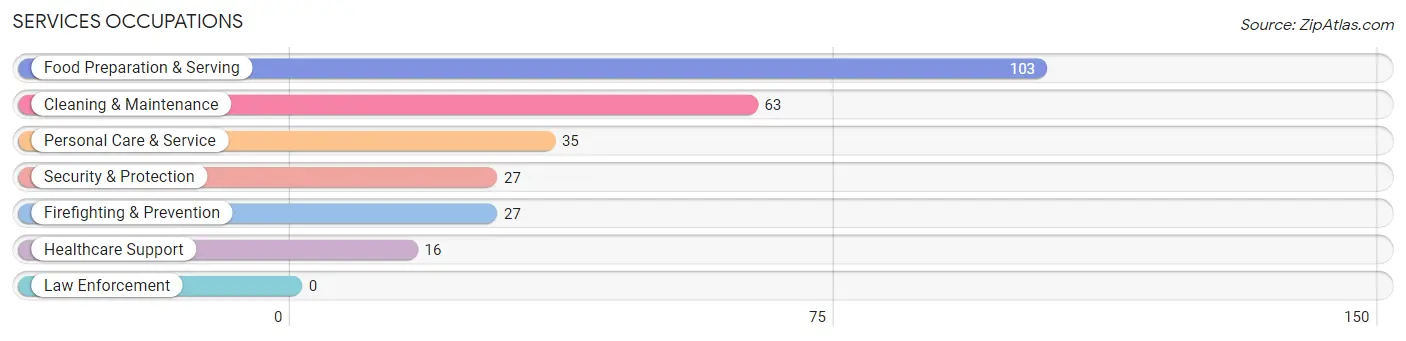
Services Occupations
The most common Services occupations in Henniker are Food Preparation & Serving (103 | 7.4%), Cleaning & Maintenance (63 | 4.5%), Personal Care & Service (35 | 2.5%), Security & Protection (27 | 1.9%), and Firefighting & Prevention (27 | 1.9%).
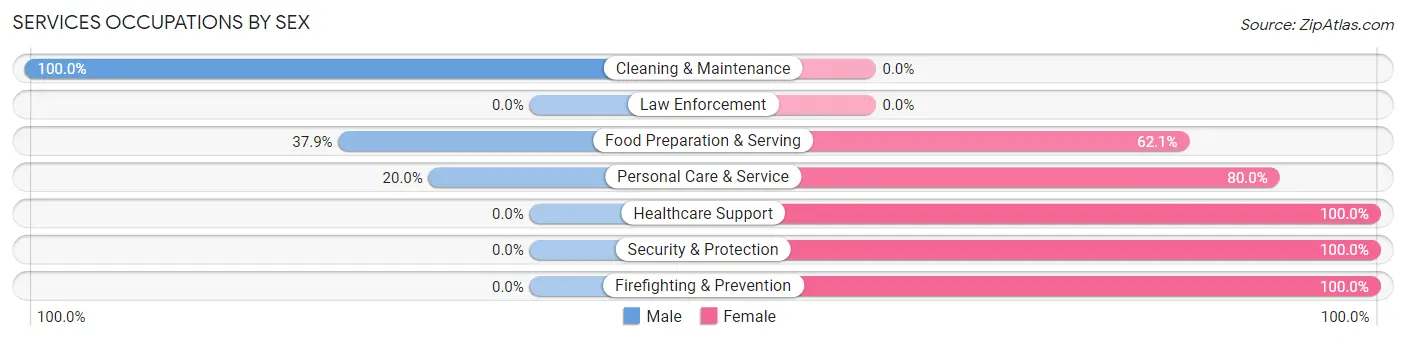
Services Occupations by Sex
Within the Services occupations in Henniker, the most male-oriented occupations are Cleaning & Maintenance (100.0%), Food Preparation & Serving (37.9%), and Personal Care & Service (20.0%), while the most female-oriented occupations are Healthcare Support (100.0%), Security & Protection (100.0%), and Firefighting & Prevention (100.0%).
| Occupation | Male | Female |
| Healthcare Support | 0 (0.0%) | 16 (100.0%) |
| Security & Protection | 0 (0.0%) | 27 (100.0%) |
| Firefighting & Prevention | 0 (0.0%) | 27 (100.0%) |
| Law Enforcement | 0 (0.0%) | 0 (0.0%) |
| Food Preparation & Serving | 39 (37.9%) | 64 (62.1%) |
| Cleaning & Maintenance | 63 (100.0%) | 0 (0.0%) |
| Personal Care & Service | 7 (20.0%) | 28 (80.0%) |
| Total (Category) | 109 (44.7%) | 135 (55.3%) |
| Total (Overall) | 914 (66.0%) | 470 (34.0%) |
Sales and Office Occupations
The most common Sales and Office occupations in Henniker are Sales & Related (167 | 12.1%), and Office & Administration (98 | 7.1%).
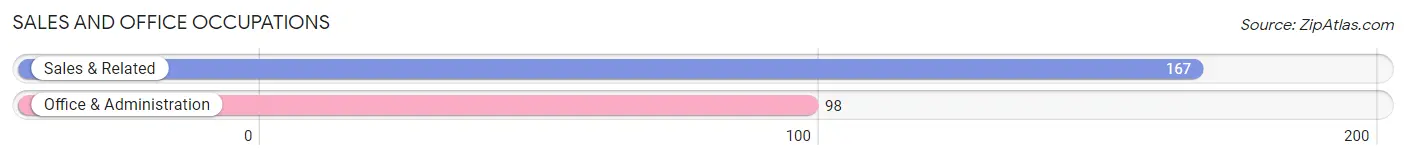
Sales and Office Occupations by Sex
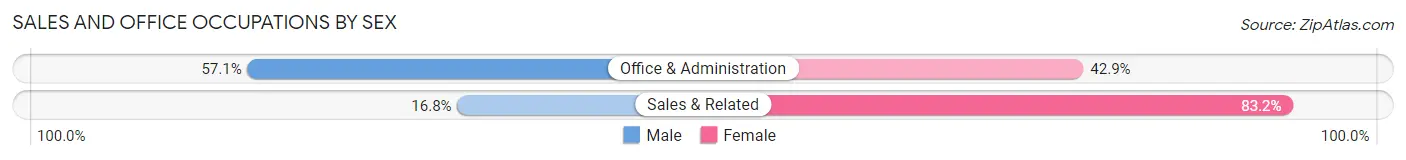
| Occupation | Male | Female |
| Sales & Related | 28 (16.8%) | 139 (83.2%) |
| Office & Administration | 56 (57.1%) | 42 (42.9%) |
| Total (Category) | 84 (31.7%) | 181 (68.3%) |
| Total (Overall) | 914 (66.0%) | 470 (34.0%) |
Natural Resources, Construction and Maintenance Occupations
The most common Natural Resources, Construction and Maintenance occupations in Henniker are Installation, Maintenance & Repair (186 | 13.4%), and Construction & Extraction (11 | 0.8%).
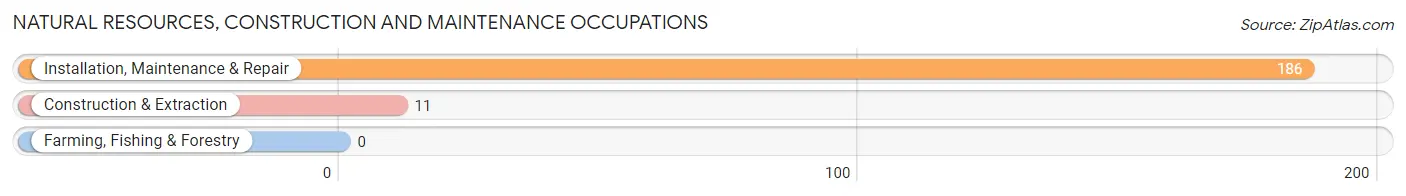
Natural Resources, Construction and Maintenance Occupations by Sex
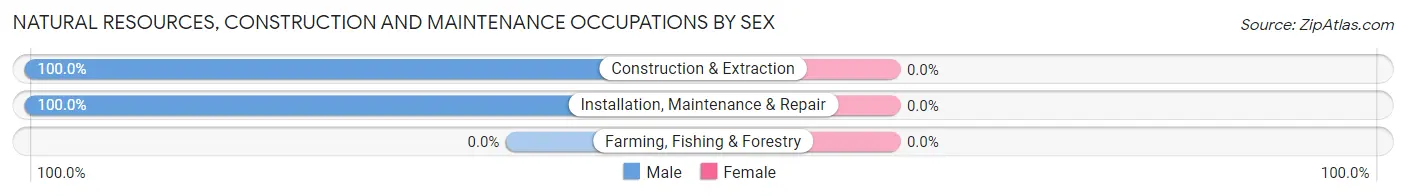
| Occupation | Male | Female |
| Farming, Fishing & Forestry | 0 (0.0%) | 0 (0.0%) |
| Construction & Extraction | 11 (100.0%) | 0 (0.0%) |
| Installation, Maintenance & Repair | 186 (100.0%) | 0 (0.0%) |
| Total (Category) | 197 (100.0%) | 0 (0.0%) |
| Total (Overall) | 914 (66.0%) | 470 (34.0%) |
Production, Transportation and Moving Occupations
The most common Production, Transportation and Moving occupations in Henniker are Material Moving (81 | 5.9%), and Production (14 | 1.0%).
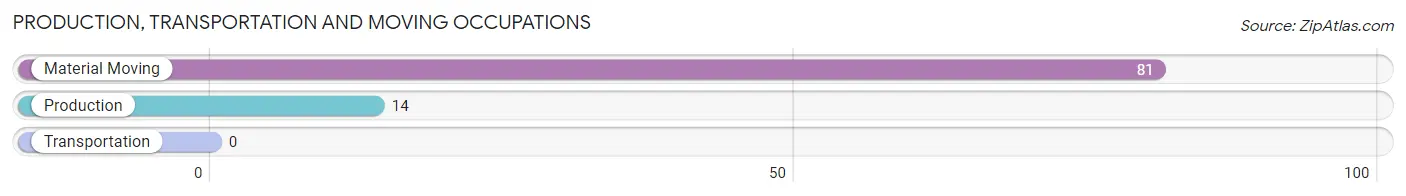
Production, Transportation and Moving Occupations by Sex
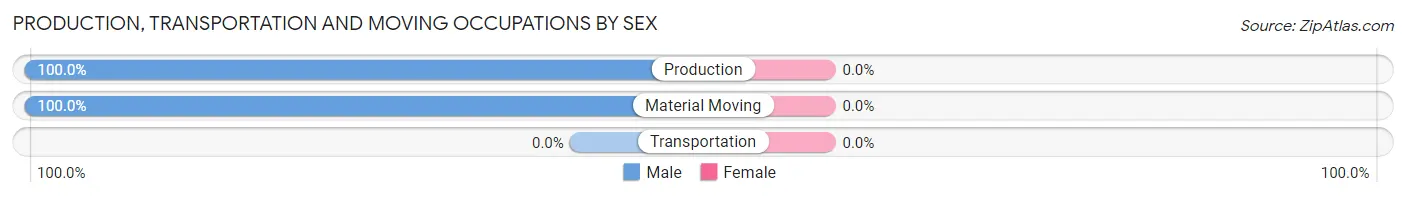
| Occupation | Male | Female |
| Production | 14 (100.0%) | 0 (0.0%) |
| Transportation | 0 (0.0%) | 0 (0.0%) |
| Material Moving | 81 (100.0%) | 0 (0.0%) |
| Total (Category) | 95 (100.0%) | 0 (0.0%) |
| Total (Overall) | 914 (66.0%) | 470 (34.0%) |
Employment Industries by Sex in Henniker
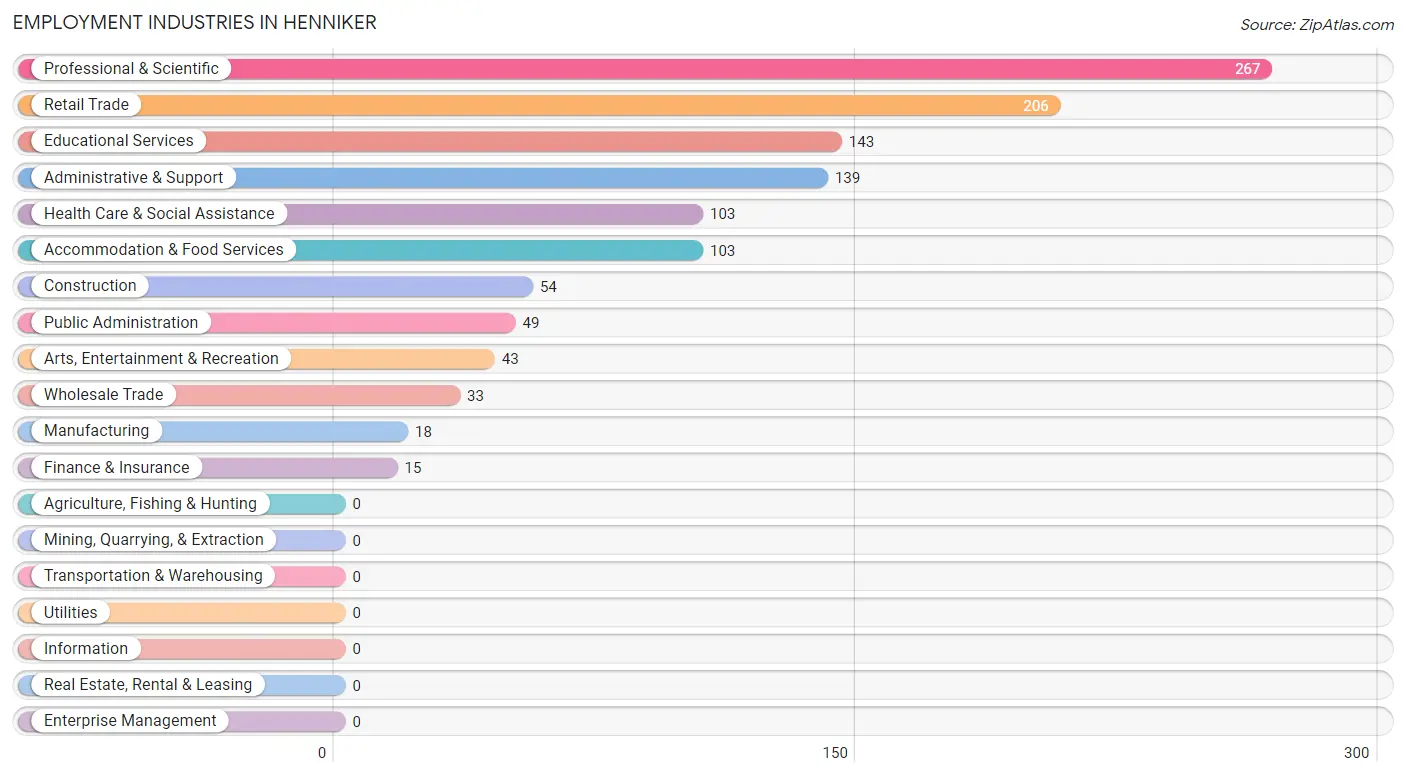
Employment Industries in Henniker
The major employment industries in Henniker include Professional & Scientific (267 | 19.3%), Retail Trade (206 | 14.9%), Educational Services (143 | 10.3%), Administrative & Support (139 | 10.0%), and Health Care & Social Assistance (103 | 7.4%).
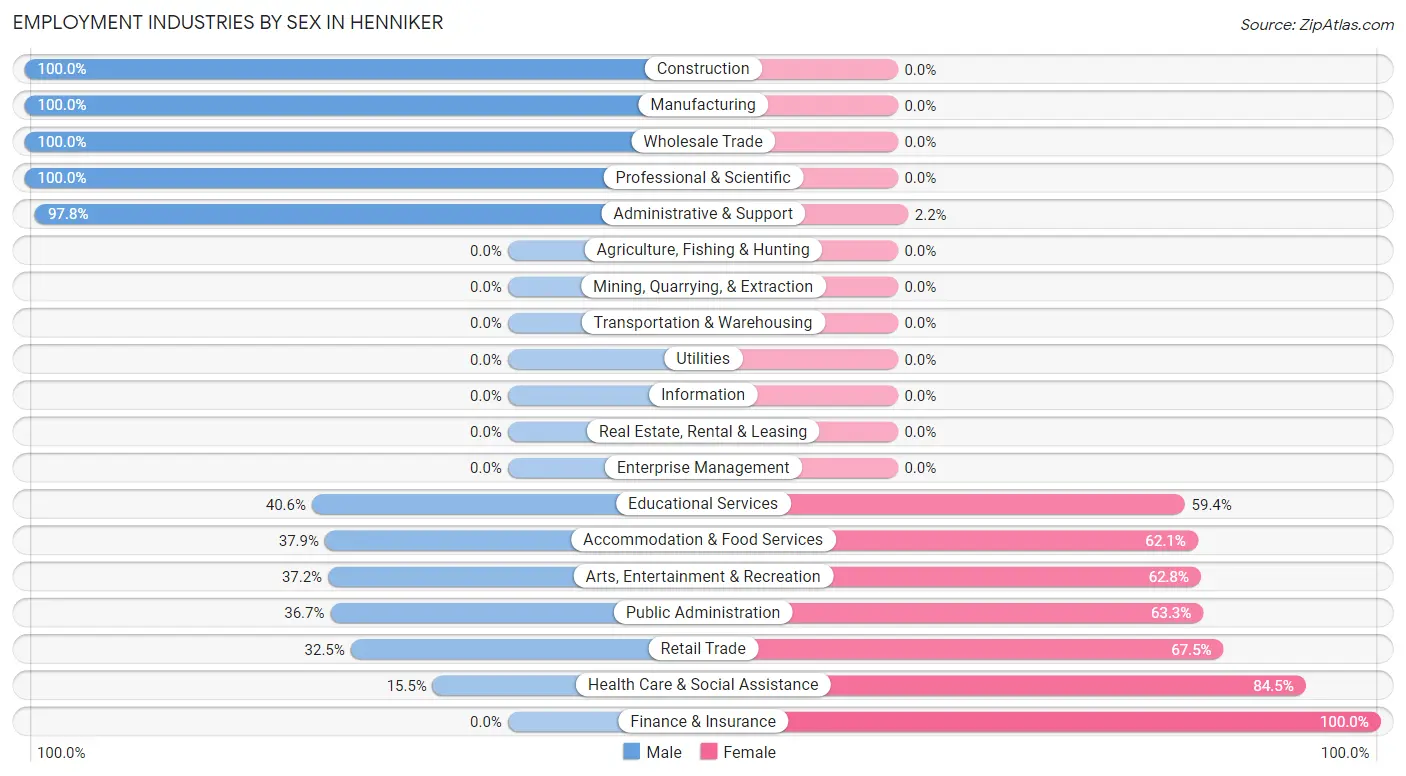
Employment Industries by Sex in Henniker
The Henniker industries that see more men than women are Construction (100.0%), Manufacturing (100.0%), and Wholesale Trade (100.0%), whereas the industries that tend to have a higher number of women are Finance & Insurance (100.0%), Health Care & Social Assistance (84.5%), and Retail Trade (67.5%).
| Industry | Male | Female |
| Agriculture, Fishing & Hunting | 0 (0.0%) | 0 (0.0%) |
| Mining, Quarrying, & Extraction | 0 (0.0%) | 0 (0.0%) |
| Construction | 54 (100.0%) | 0 (0.0%) |
| Manufacturing | 18 (100.0%) | 0 (0.0%) |
| Wholesale Trade | 33 (100.0%) | 0 (0.0%) |
| Retail Trade | 67 (32.5%) | 139 (67.5%) |
| Transportation & Warehousing | 0 (0.0%) | 0 (0.0%) |
| Utilities | 0 (0.0%) | 0 (0.0%) |
| Information | 0 (0.0%) | 0 (0.0%) |
| Finance & Insurance | 0 (0.0%) | 15 (100.0%) |
| Real Estate, Rental & Leasing | 0 (0.0%) | 0 (0.0%) |
| Professional & Scientific | 267 (100.0%) | 0 (0.0%) |
| Enterprise Management | 0 (0.0%) | 0 (0.0%) |
| Administrative & Support | 136 (97.8%) | 3 (2.2%) |
| Educational Services | 58 (40.6%) | 85 (59.4%) |
| Health Care & Social Assistance | 16 (15.5%) | 87 (84.5%) |
| Arts, Entertainment & Recreation | 16 (37.2%) | 27 (62.8%) |
| Accommodation & Food Services | 39 (37.9%) | 64 (62.1%) |
| Public Administration | 18 (36.7%) | 31 (63.3%) |
| Total | 914 (66.0%) | 470 (34.0%) |
Education in Henniker
School Enrollment in Henniker
The most common levels of schooling among the 1,041 students in Henniker are college / undergraduate (840 | 80.7%), middle school (51 | 4.9%), and high school (41 | 3.9%).
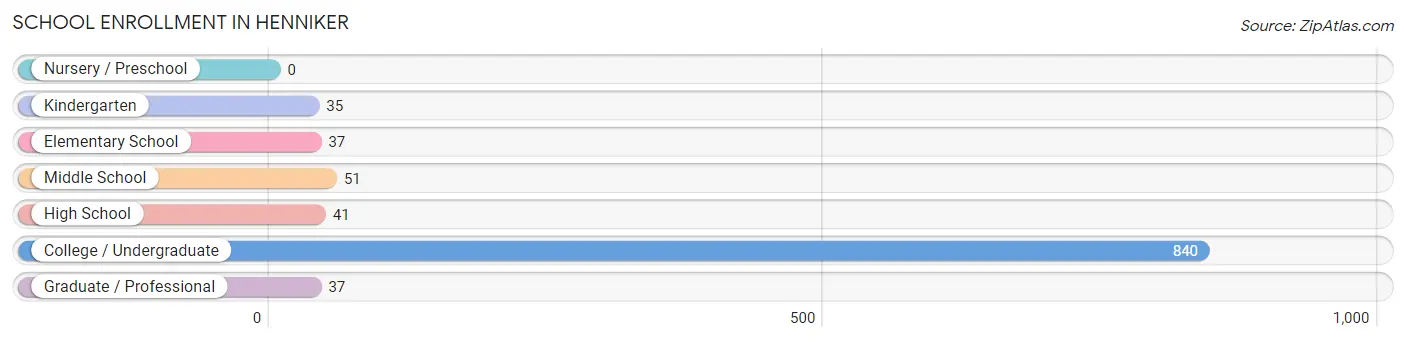
| School Level | # Students | % Students |
| Nursery / Preschool | 0 | 0.0% |
| Kindergarten | 35 | 3.4% |
| Elementary School | 37 | 3.5% |
| Middle School | 51 | 4.9% |
| High School | 41 | 3.9% |
| College / Undergraduate | 840 | 80.7% |
| Graduate / Professional | 37 | 3.5% |
| Total | 1,041 | 100.0% |
School Enrollment by Age by Funding Source in Henniker
Out of a total of 1,041 students who are enrolled in schools in Henniker, 631 (60.6%) attend a private institution, while the remaining 410 (39.4%) are enrolled in public schools. The age group of 25 to 34 year olds has the highest likelihood of being enrolled in private schools, with 15 (100.0% in the age bracket) enrolled. Conversely, the age group of 5 to 9 year old has the lowest likelihood of being enrolled in a private school, with 81 (100.0% in the age bracket) attending a public institution.
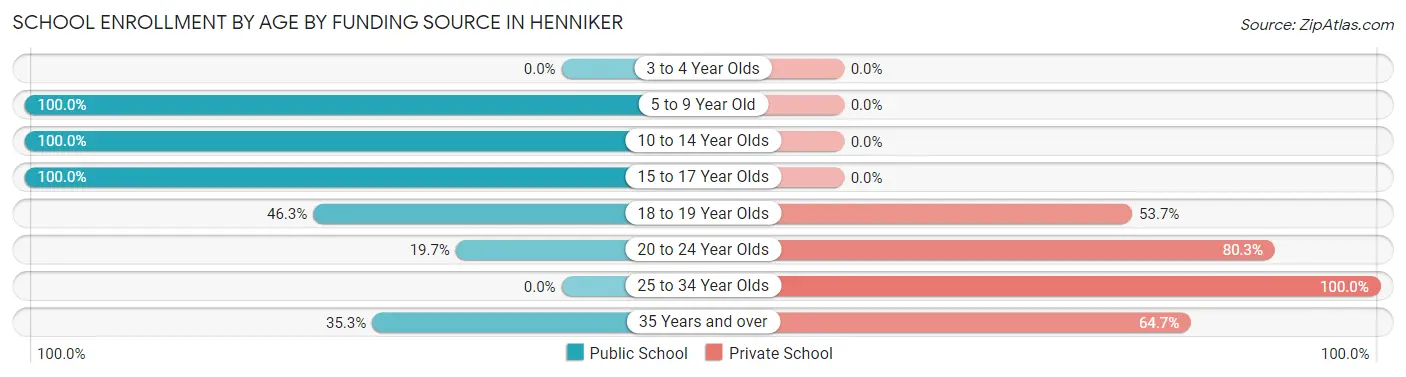
| Age Bracket | Public School | Private School |
| 3 to 4 Year Olds | 0 (0.0%) | 0 (0.0%) |
| 5 to 9 Year Old | 81 (100.0%) | 0 (0.0%) |
| 10 to 14 Year Olds | 42 (100.0%) | 0 (0.0%) |
| 15 to 17 Year Olds | 26 (100.0%) | 0 (0.0%) |
| 18 to 19 Year Olds | 149 (46.3%) | 173 (53.7%) |
| 20 to 24 Year Olds | 106 (19.7%) | 432 (80.3%) |
| 25 to 34 Year Olds | 0 (0.0%) | 15 (100.0%) |
| 35 Years and over | 6 (35.3%) | 11 (64.7%) |
| Total | 410 (39.4%) | 631 (60.6%) |
Educational Attainment by Field of Study in Henniker
Education (91 | 23.8%), arts & humanities (88 | 23.0%), business (86 | 22.5%), psychology (49 | 12.8%), and liberal arts & history (19 | 5.0%) are the most common fields of study among 382 individuals in Henniker who have obtained a bachelor's degree or higher.
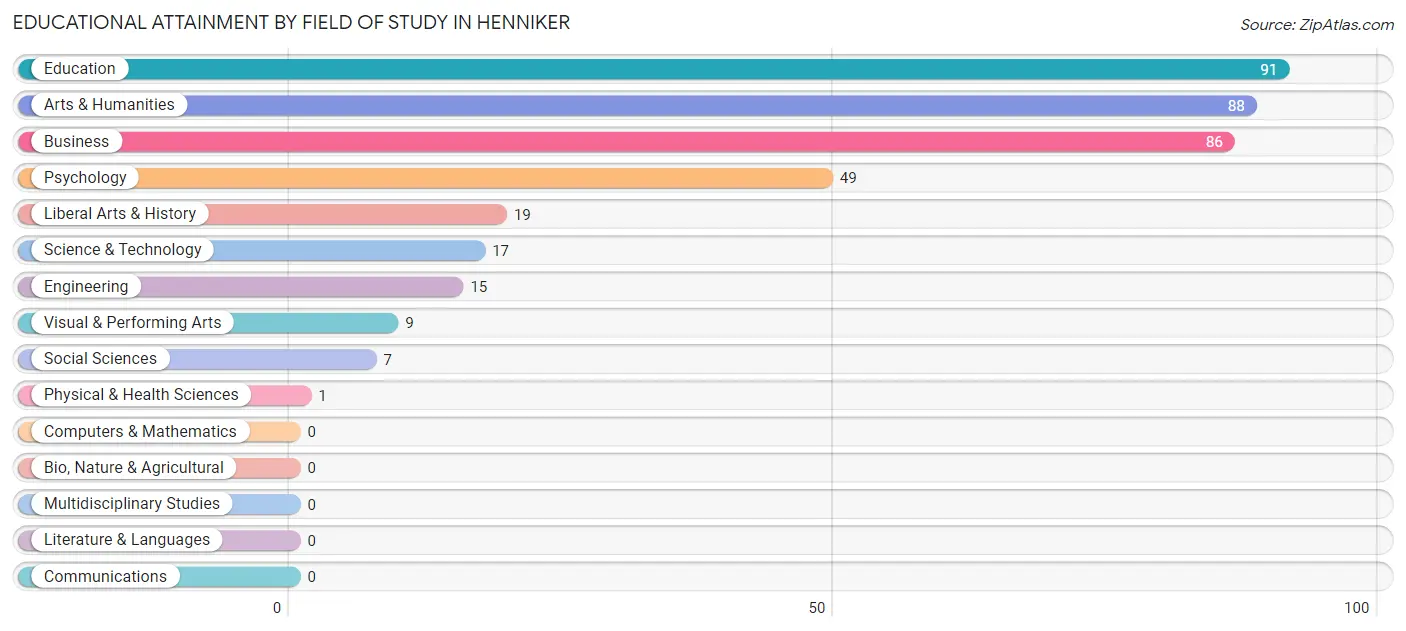
| Field of Study | # Graduates | % Graduates |
| Computers & Mathematics | 0 | 0.0% |
| Bio, Nature & Agricultural | 0 | 0.0% |
| Physical & Health Sciences | 1 | 0.3% |
| Psychology | 49 | 12.8% |
| Social Sciences | 7 | 1.8% |
| Engineering | 15 | 3.9% |
| Multidisciplinary Studies | 0 | 0.0% |
| Science & Technology | 17 | 4.4% |
| Business | 86 | 22.5% |
| Education | 91 | 23.8% |
| Literature & Languages | 0 | 0.0% |
| Liberal Arts & History | 19 | 5.0% |
| Visual & Performing Arts | 9 | 2.4% |
| Communications | 0 | 0.0% |
| Arts & Humanities | 88 | 23.0% |
| Total | 382 | 100.0% |
Transportation & Commute in Henniker
Vehicle Availability by Sex in Henniker
The most prevalent vehicle ownership categories in Henniker are males with 2 vehicles (525, accounting for 62.6%) and females with 2 vehicles (145, making up 145.4%).
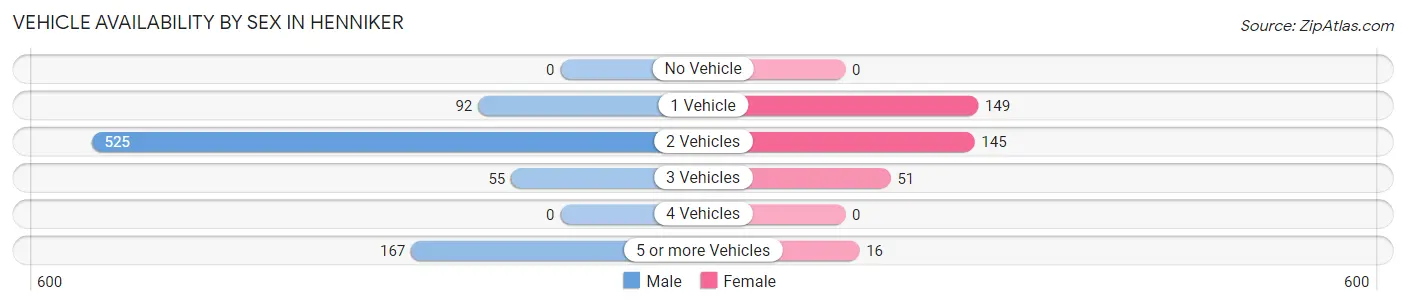
| Vehicles Available | Male | Female |
| No Vehicle | 0 (0.0%) | 0 (0.0%) |
| 1 Vehicle | 92 (11.0%) | 149 (41.3%) |
| 2 Vehicles | 525 (62.6%) | 145 (40.2%) |
| 3 Vehicles | 55 (6.6%) | 51 (14.1%) |
| 4 Vehicles | 0 (0.0%) | 0 (0.0%) |
| 5 or more Vehicles | 167 (19.9%) | 16 (4.4%) |
| Total | 839 (100.0%) | 361 (100.0%) |
Commute Time in Henniker
The most frequently occuring commute durations in Henniker are 20 to 24 minutes (330 commuters, 30.9%), less than 5 minutes (242 commuters, 22.7%), and 5 to 9 minutes (137 commuters, 12.8%).
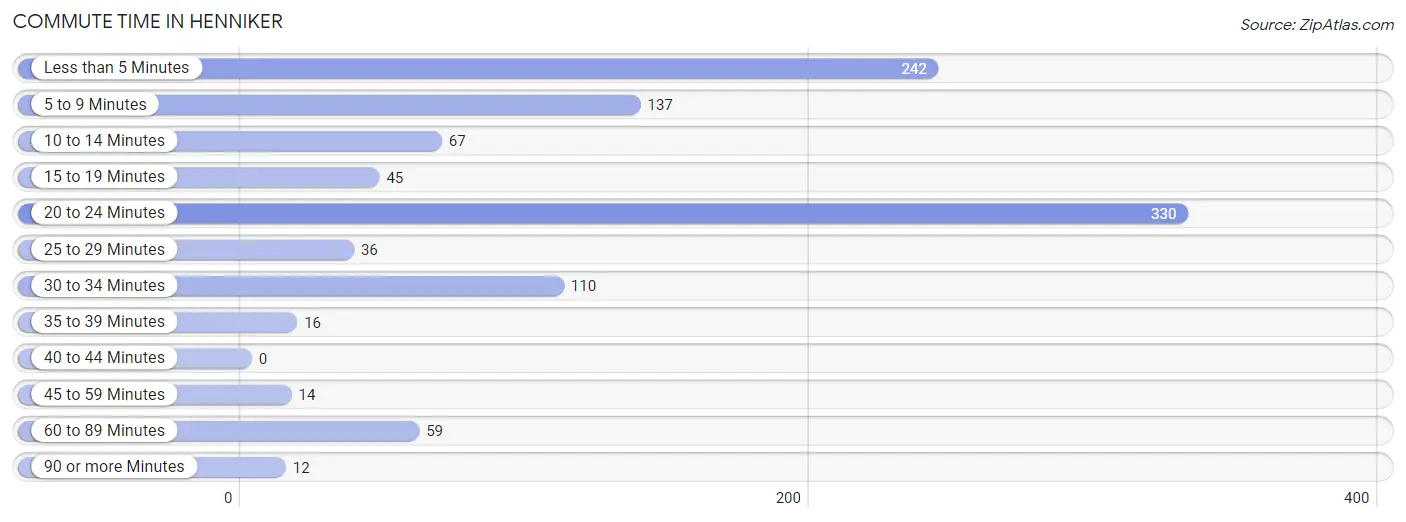
| Commute Time | # Commuters | % Commuters |
| Less than 5 Minutes | 242 | 22.7% |
| 5 to 9 Minutes | 137 | 12.8% |
| 10 to 14 Minutes | 67 | 6.3% |
| 15 to 19 Minutes | 45 | 4.2% |
| 20 to 24 Minutes | 330 | 30.9% |
| 25 to 29 Minutes | 36 | 3.4% |
| 30 to 34 Minutes | 110 | 10.3% |
| 35 to 39 Minutes | 16 | 1.5% |
| 40 to 44 Minutes | 0 | 0.0% |
| 45 to 59 Minutes | 14 | 1.3% |
| 60 to 89 Minutes | 59 | 5.5% |
| 90 or more Minutes | 12 | 1.1% |
Commute Time by Sex in Henniker
The most common commute times in Henniker are 20 to 24 minutes (267 commuters, 39.9%) for males and 30 to 34 minutes (110 commuters, 27.6%) for females.
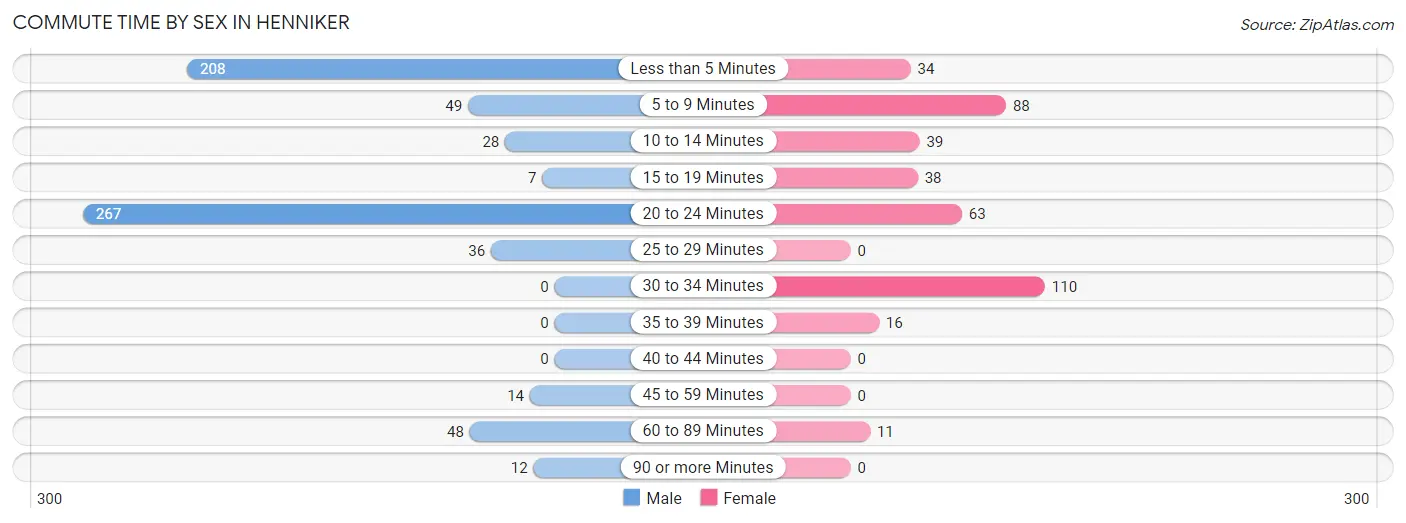
| Commute Time | Male | Female |
| Less than 5 Minutes | 208 (31.1%) | 34 (8.5%) |
| 5 to 9 Minutes | 49 (7.3%) | 88 (22.1%) |
| 10 to 14 Minutes | 28 (4.2%) | 39 (9.8%) |
| 15 to 19 Minutes | 7 (1.1%) | 38 (9.5%) |
| 20 to 24 Minutes | 267 (39.9%) | 63 (15.8%) |
| 25 to 29 Minutes | 36 (5.4%) | 0 (0.0%) |
| 30 to 34 Minutes | 0 (0.0%) | 110 (27.6%) |
| 35 to 39 Minutes | 0 (0.0%) | 16 (4.0%) |
| 40 to 44 Minutes | 0 (0.0%) | 0 (0.0%) |
| 45 to 59 Minutes | 14 (2.1%) | 0 (0.0%) |
| 60 to 89 Minutes | 48 (7.2%) | 11 (2.8%) |
| 90 or more Minutes | 12 (1.8%) | 0 (0.0%) |
Time of Departure to Work by Sex in Henniker
The most frequent times of departure to work in Henniker are 6:00 AM to 6:29 AM (235, 35.1%) for males and 7:30 AM to 7:59 AM (135, 33.8%) for females.
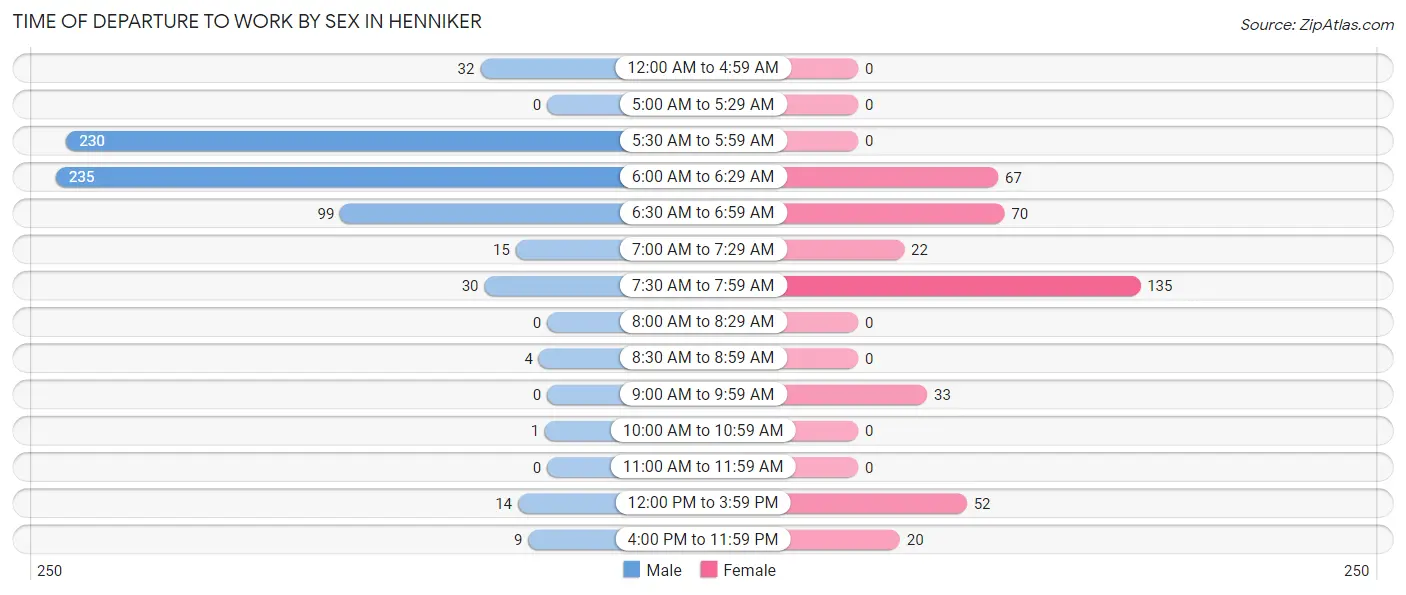
| Time of Departure | Male | Female |
| 12:00 AM to 4:59 AM | 32 (4.8%) | 0 (0.0%) |
| 5:00 AM to 5:29 AM | 0 (0.0%) | 0 (0.0%) |
| 5:30 AM to 5:59 AM | 230 (34.4%) | 0 (0.0%) |
| 6:00 AM to 6:29 AM | 235 (35.1%) | 67 (16.8%) |
| 6:30 AM to 6:59 AM | 99 (14.8%) | 70 (17.5%) |
| 7:00 AM to 7:29 AM | 15 (2.2%) | 22 (5.5%) |
| 7:30 AM to 7:59 AM | 30 (4.5%) | 135 (33.8%) |
| 8:00 AM to 8:29 AM | 0 (0.0%) | 0 (0.0%) |
| 8:30 AM to 8:59 AM | 4 (0.6%) | 0 (0.0%) |
| 9:00 AM to 9:59 AM | 0 (0.0%) | 33 (8.3%) |
| 10:00 AM to 10:59 AM | 1 (0.2%) | 0 (0.0%) |
| 11:00 AM to 11:59 AM | 0 (0.0%) | 0 (0.0%) |
| 12:00 PM to 3:59 PM | 14 (2.1%) | 52 (13.0%) |
| 4:00 PM to 11:59 PM | 9 (1.3%) | 20 (5.0%) |
| Total | 669 (100.0%) | 399 (100.0%) |
Housing Occupancy in Henniker
Occupancy by Ownership in Henniker
Of the total 1,115 dwellings in Henniker, owner-occupied units account for 537 (48.2%), while renter-occupied units make up 578 (51.8%).
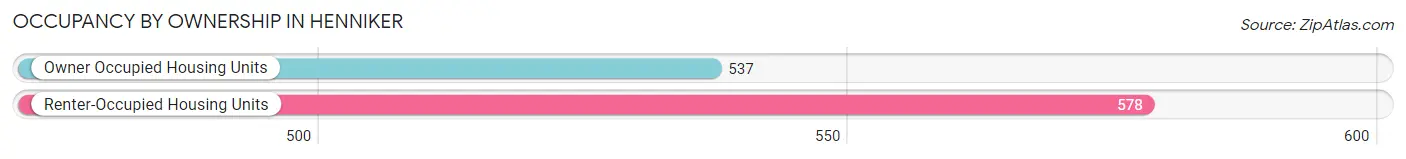
| Occupancy | # Housing Units | % Housing Units |
| Owner Occupied Housing Units | 537 | 48.2% |
| Renter-Occupied Housing Units | 578 | 51.8% |
| Total Occupied Housing Units | 1,115 | 100.0% |
Occupancy by Household Size in Henniker
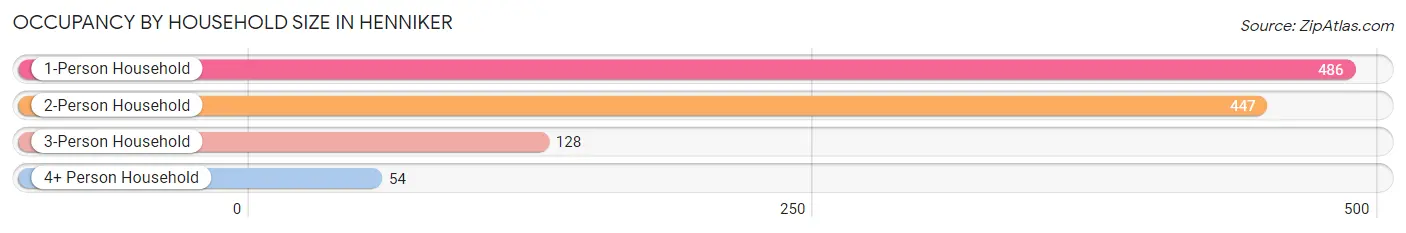
| Household Size | # Housing Units | % Housing Units |
| 1-Person Household | 486 | 43.6% |
| 2-Person Household | 447 | 40.1% |
| 3-Person Household | 128 | 11.5% |
| 4+ Person Household | 54 | 4.8% |
| Total Housing Units | 1,115 | 100.0% |
Occupancy by Ownership by Household Size in Henniker
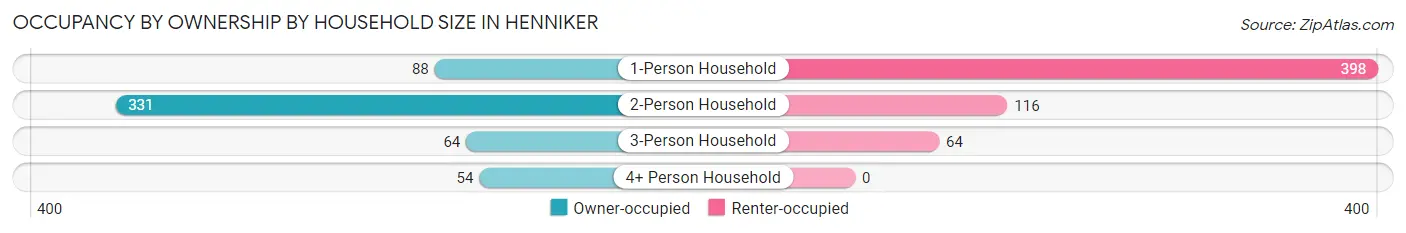
| Household Size | Owner-occupied | Renter-occupied |
| 1-Person Household | 88 (18.1%) | 398 (81.9%) |
| 2-Person Household | 331 (74.1%) | 116 (26.0%) |
| 3-Person Household | 64 (50.0%) | 64 (50.0%) |
| 4+ Person Household | 54 (100.0%) | 0 (0.0%) |
| Total Housing Units | 537 (48.2%) | 578 (51.8%) |
Occupancy by Educational Attainment in Henniker
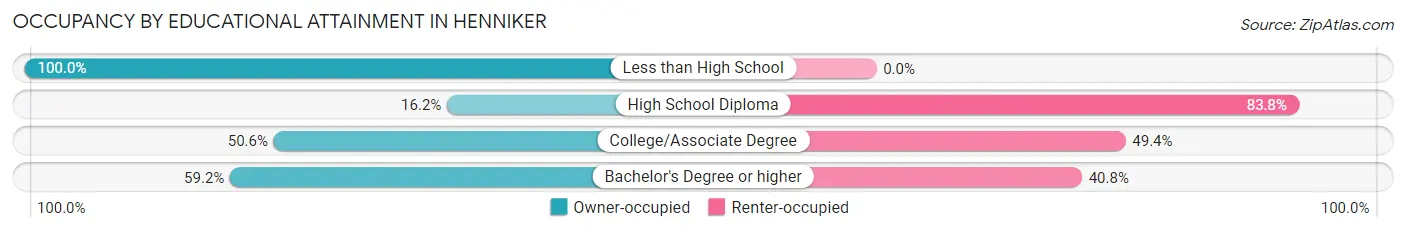
| Household Size | Owner-occupied | Renter-occupied |
| Less than High School | 19 (100.0%) | 0 (0.0%) |
| High School Diploma | 30 (16.2%) | 155 (83.8%) |
| College/Associate Degree | 302 (50.6%) | 295 (49.4%) |
| Bachelor's Degree or higher | 186 (59.2%) | 128 (40.8%) |
Occupancy by Age of Householder in Henniker
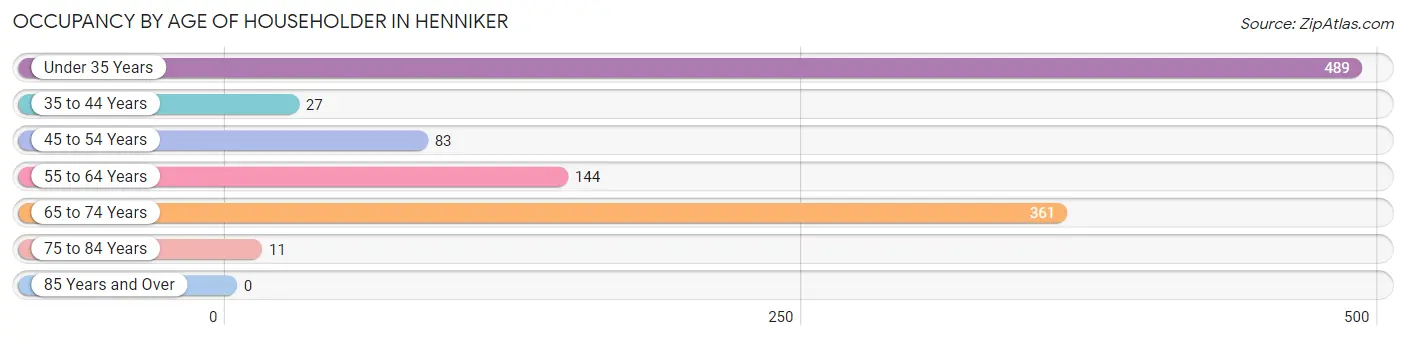
| Age Bracket | # Households | % Households |
| Under 35 Years | 489 | 43.9% |
| 35 to 44 Years | 27 | 2.4% |
| 45 to 54 Years | 83 | 7.4% |
| 55 to 64 Years | 144 | 12.9% |
| 65 to 74 Years | 361 | 32.4% |
| 75 to 84 Years | 11 | 1.0% |
| 85 Years and Over | 0 | 0.0% |
| Total | 1,115 | 100.0% |
Housing Finances in Henniker
Median Income by Occupancy in Henniker
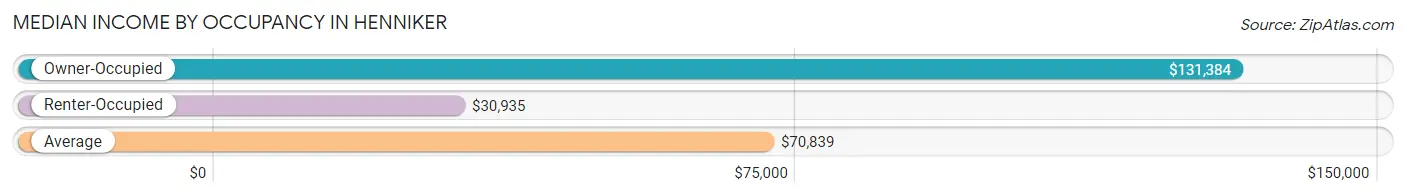
| Occupancy Type | # Households | Median Income |
| Owner-Occupied | 537 (48.2%) | $131,384 |
| Renter-Occupied | 578 (51.8%) | $30,935 |
| Average | 1,115 (100.0%) | $70,839 |
Occupancy by Householder Income Bracket in Henniker
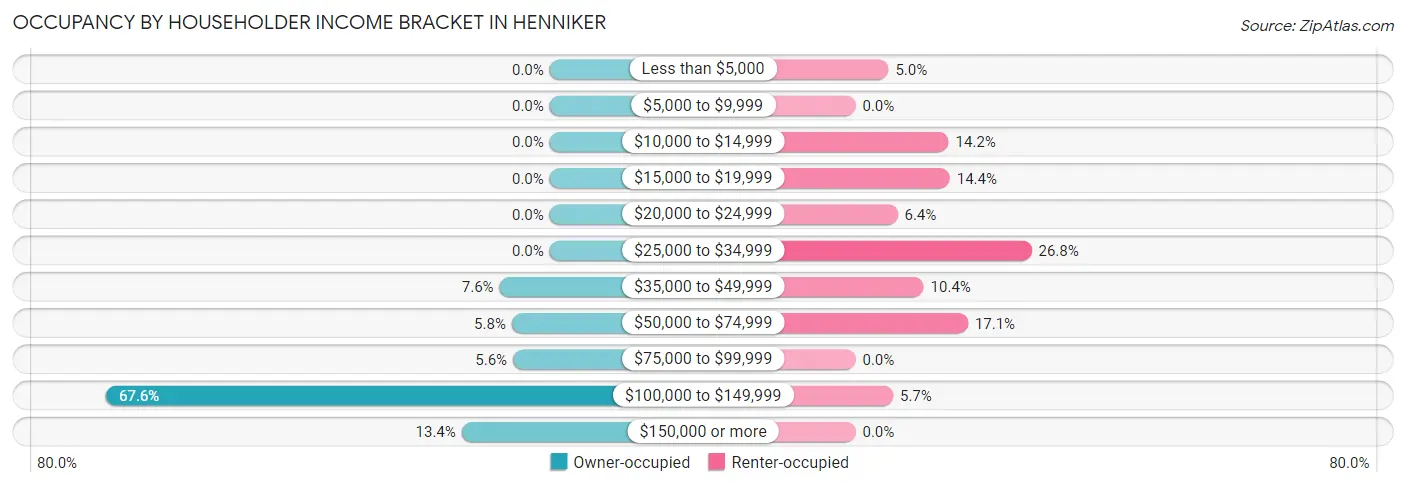
| Income Bracket | Owner-occupied | Renter-occupied |
| Less than $5,000 | 0 (0.0%) | 29 (5.0%) |
| $5,000 to $9,999 | 0 (0.0%) | 0 (0.0%) |
| $10,000 to $14,999 | 0 (0.0%) | 82 (14.2%) |
| $15,000 to $19,999 | 0 (0.0%) | 83 (14.4%) |
| $20,000 to $24,999 | 0 (0.0%) | 37 (6.4%) |
| $25,000 to $34,999 | 0 (0.0%) | 155 (26.8%) |
| $35,000 to $49,999 | 41 (7.6%) | 60 (10.4%) |
| $50,000 to $74,999 | 31 (5.8%) | 99 (17.1%) |
| $75,000 to $99,999 | 30 (5.6%) | 0 (0.0%) |
| $100,000 to $149,999 | 363 (67.6%) | 33 (5.7%) |
| $150,000 or more | 72 (13.4%) | 0 (0.0%) |
| Total | 537 (100.0%) | 578 (100.0%) |
Monthly Housing Cost Tiers in Henniker
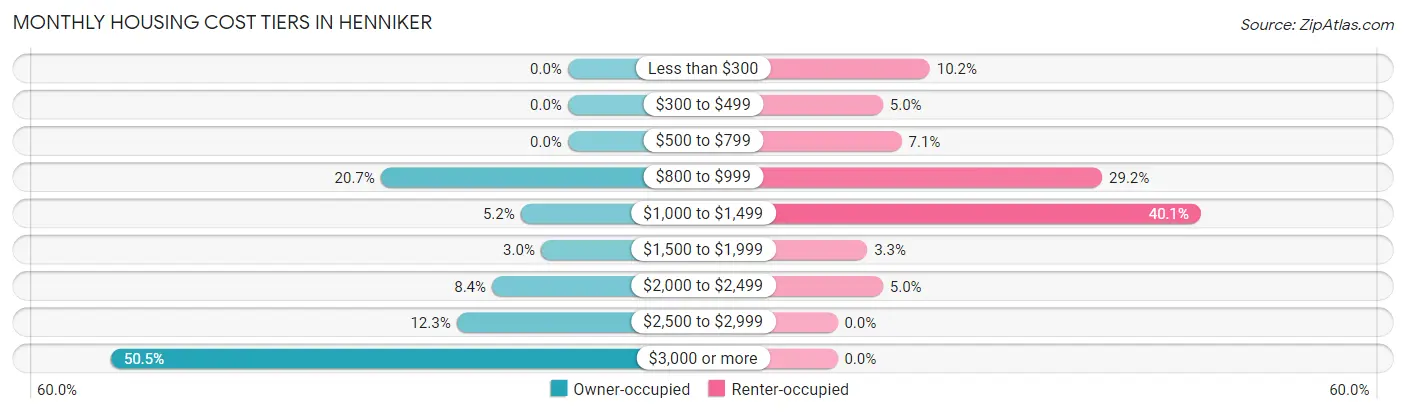
| Monthly Cost | Owner-occupied | Renter-occupied |
| Less than $300 | 0 (0.0%) | 59 (10.2%) |
| $300 to $499 | 0 (0.0%) | 29 (5.0%) |
| $500 to $799 | 0 (0.0%) | 41 (7.1%) |
| $800 to $999 | 111 (20.7%) | 169 (29.2%) |
| $1,000 to $1,499 | 28 (5.2%) | 232 (40.1%) |
| $1,500 to $1,999 | 16 (3.0%) | 19 (3.3%) |
| $2,000 to $2,499 | 45 (8.4%) | 29 (5.0%) |
| $2,500 to $2,999 | 66 (12.3%) | 0 (0.0%) |
| $3,000 or more | 271 (50.5%) | 0 (0.0%) |
| Total | 537 (100.0%) | 578 (100.0%) |
Physical Housing Characteristics in Henniker
Housing Structures in Henniker
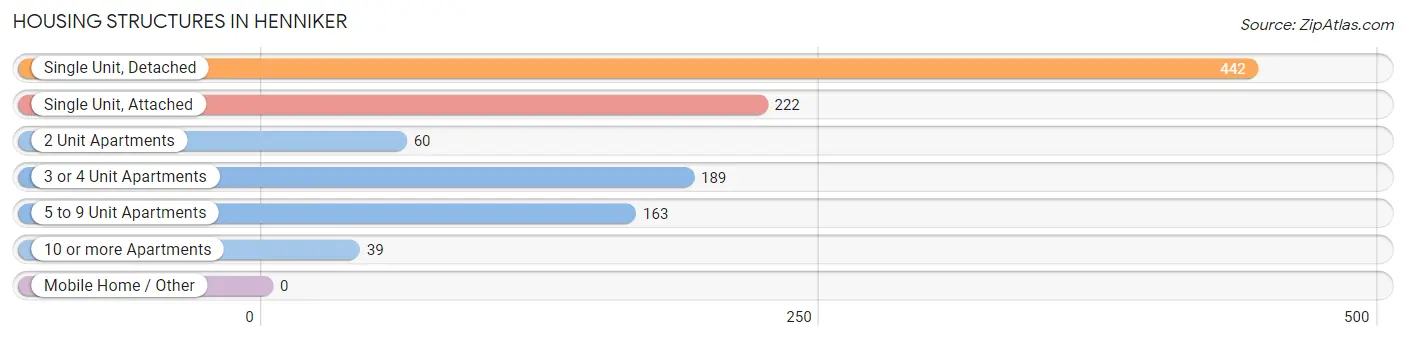
| Structure Type | # Housing Units | % Housing Units |
| Single Unit, Detached | 442 | 39.6% |
| Single Unit, Attached | 222 | 19.9% |
| 2 Unit Apartments | 60 | 5.4% |
| 3 or 4 Unit Apartments | 189 | 17.0% |
| 5 to 9 Unit Apartments | 163 | 14.6% |
| 10 or more Apartments | 39 | 3.5% |
| Mobile Home / Other | 0 | 0.0% |
| Total | 1,115 | 100.0% |
Housing Structures by Occupancy in Henniker
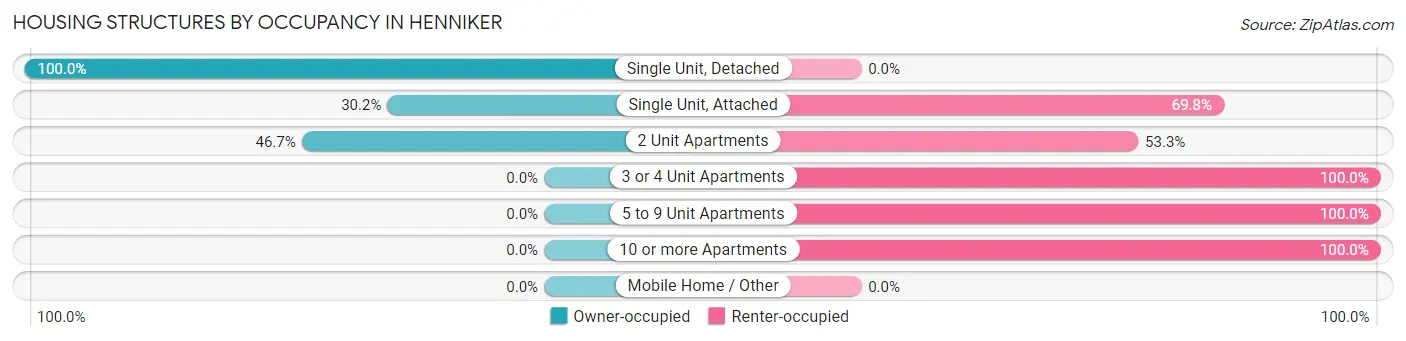
| Structure Type | Owner-occupied | Renter-occupied |
| Single Unit, Detached | 442 (100.0%) | 0 (0.0%) |
| Single Unit, Attached | 67 (30.2%) | 155 (69.8%) |
| 2 Unit Apartments | 28 (46.7%) | 32 (53.3%) |
| 3 or 4 Unit Apartments | 0 (0.0%) | 189 (100.0%) |
| 5 to 9 Unit Apartments | 0 (0.0%) | 163 (100.0%) |
| 10 or more Apartments | 0 (0.0%) | 39 (100.0%) |
| Mobile Home / Other | 0 (0.0%) | 0 (0.0%) |
| Total | 537 (48.2%) | 578 (51.8%) |
Housing Structures by Number of Rooms in Henniker
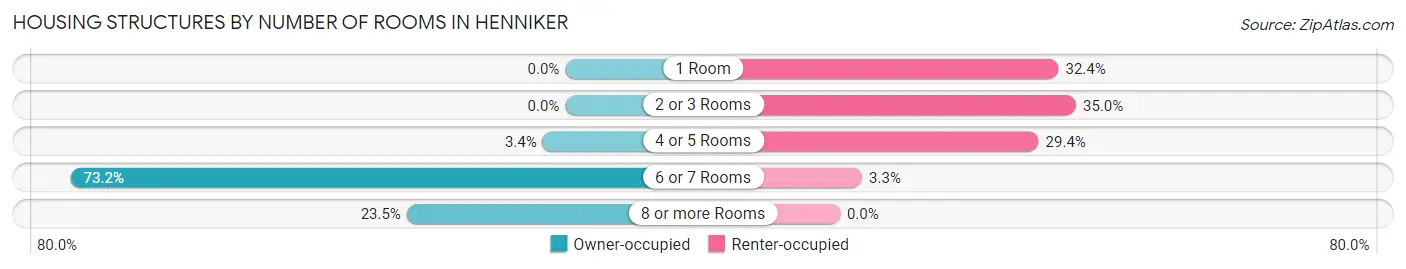
| Number of Rooms | Owner-occupied | Renter-occupied |
| 1 Room | 0 (0.0%) | 187 (32.4%) |
| 2 or 3 Rooms | 0 (0.0%) | 202 (34.9%) |
| 4 or 5 Rooms | 18 (3.4%) | 170 (29.4%) |
| 6 or 7 Rooms | 393 (73.2%) | 19 (3.3%) |
| 8 or more Rooms | 126 (23.5%) | 0 (0.0%) |
| Total | 537 (100.0%) | 578 (100.0%) |
Housing Structure by Heating Type in Henniker
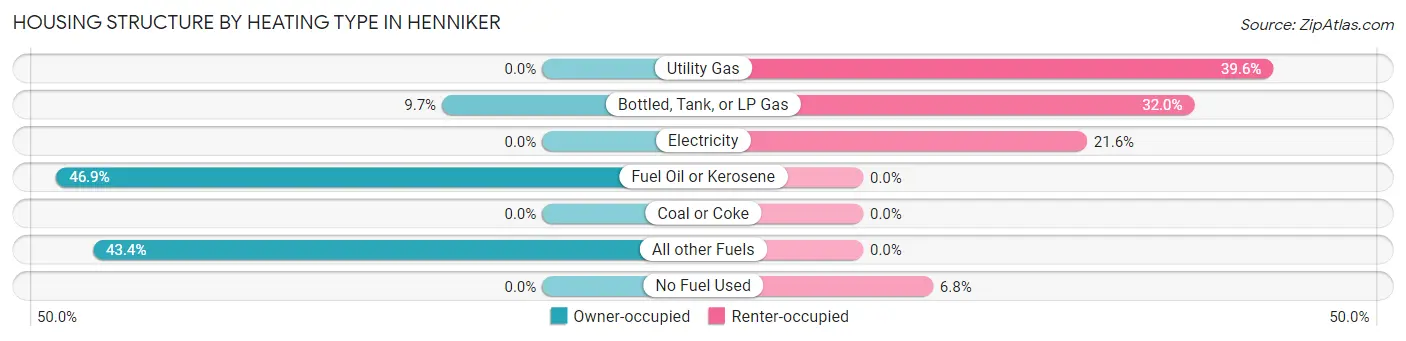
| Heating Type | Owner-occupied | Renter-occupied |
| Utility Gas | 0 (0.0%) | 229 (39.6%) |
| Bottled, Tank, or LP Gas | 52 (9.7%) | 185 (32.0%) |
| Electricity | 0 (0.0%) | 125 (21.6%) |
| Fuel Oil or Kerosene | 252 (46.9%) | 0 (0.0%) |
| Coal or Coke | 0 (0.0%) | 0 (0.0%) |
| All other Fuels | 233 (43.4%) | 0 (0.0%) |
| No Fuel Used | 0 (0.0%) | 39 (6.8%) |
| Total | 537 (100.0%) | 578 (100.0%) |
Household Vehicle Usage in Henniker
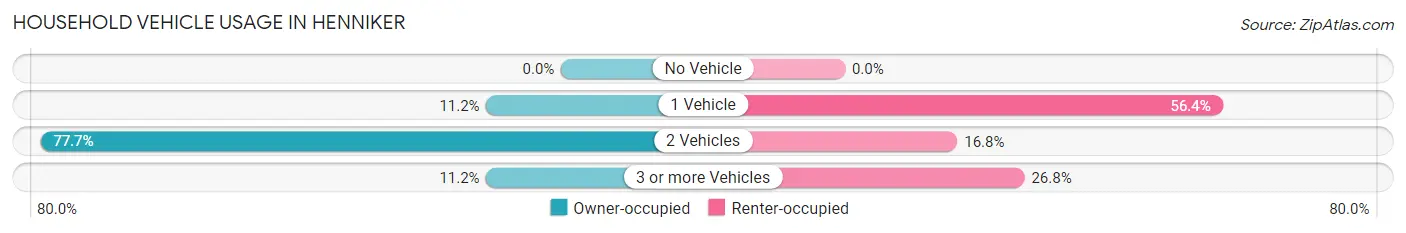
| Vehicles per Household | Owner-occupied | Renter-occupied |
| No Vehicle | 0 (0.0%) | 0 (0.0%) |
| 1 Vehicle | 60 (11.2%) | 326 (56.4%) |
| 2 Vehicles | 417 (77.6%) | 97 (16.8%) |
| 3 or more Vehicles | 60 (11.2%) | 155 (26.8%) |
| Total | 537 (100.0%) | 578 (100.0%) |
Real Estate & Mortgages in Henniker
Real Estate and Mortgage Overview in Henniker
| Characteristic | Without Mortgage | With Mortgage |
| Housing Units | 120 | 417 |
| Median Property Value | $280,700 | $243,100 |
| Median Household Income | $90,000 | $72 |
| Monthly Housing Costs | $950 | $271 |
| Real Estate Taxes | $6,351 | $0 |
Property Value by Mortgage Status in Henniker
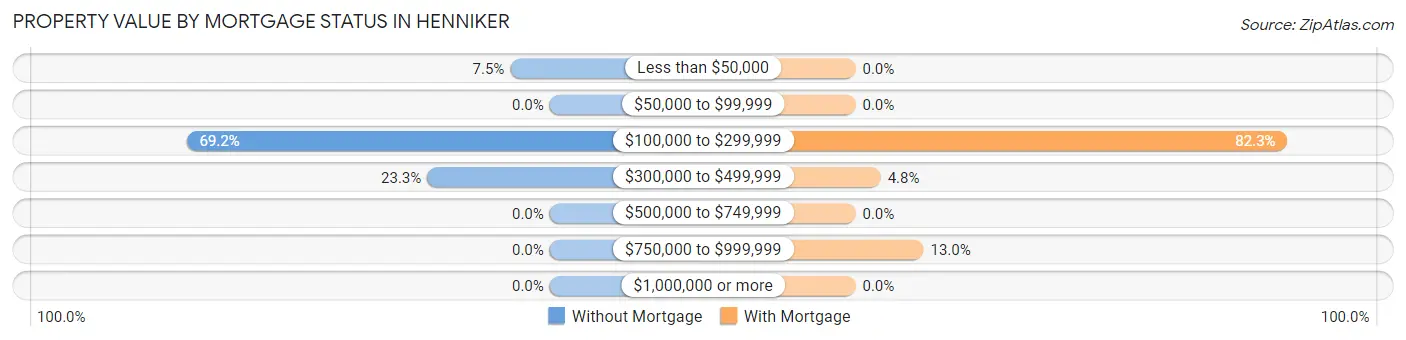
| Property Value | Without Mortgage | With Mortgage |
| Less than $50,000 | 9 (7.5%) | 0 (0.0%) |
| $50,000 to $99,999 | 0 (0.0%) | 0 (0.0%) |
| $100,000 to $299,999 | 83 (69.2%) | 343 (82.3%) |
| $300,000 to $499,999 | 28 (23.3%) | 20 (4.8%) |
| $500,000 to $749,999 | 0 (0.0%) | 0 (0.0%) |
| $750,000 to $999,999 | 0 (0.0%) | 54 (13.0%) |
| $1,000,000 or more | 0 (0.0%) | 0 (0.0%) |
| Total | 120 (100.0%) | 417 (100.0%) |
Household Income by Mortgage Status in Henniker
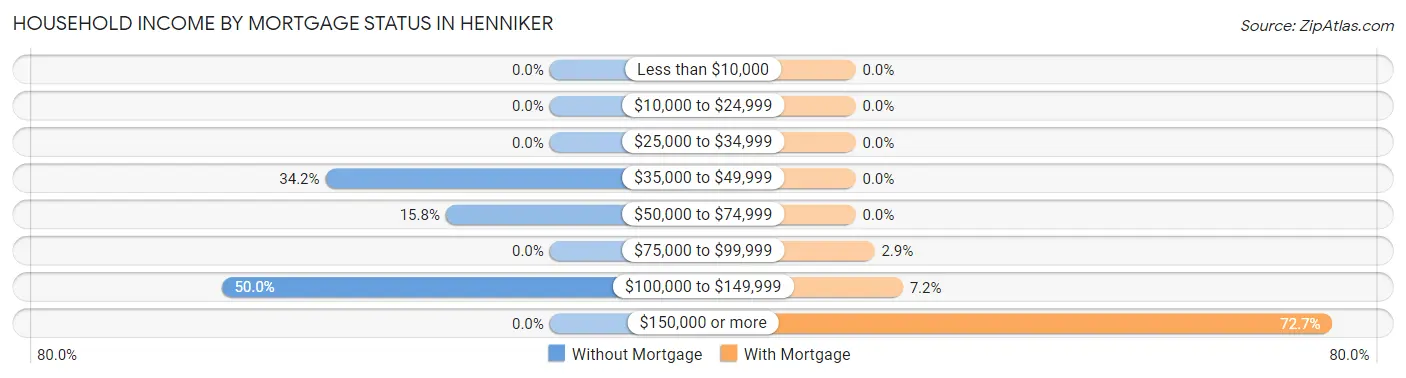
| Household Income | Without Mortgage | With Mortgage |
| Less than $10,000 | 0 (0.0%) | 0 (0.0%) |
| $10,000 to $24,999 | 0 (0.0%) | 0 (0.0%) |
| $25,000 to $34,999 | 0 (0.0%) | 0 (0.0%) |
| $35,000 to $49,999 | 41 (34.2%) | 0 (0.0%) |
| $50,000 to $74,999 | 19 (15.8%) | 0 (0.0%) |
| $75,000 to $99,999 | 0 (0.0%) | 12 (2.9%) |
| $100,000 to $149,999 | 60 (50.0%) | 30 (7.2%) |
| $150,000 or more | 0 (0.0%) | 303 (72.7%) |
| Total | 120 (100.0%) | 417 (100.0%) |
Property Value to Household Income Ratio in Henniker
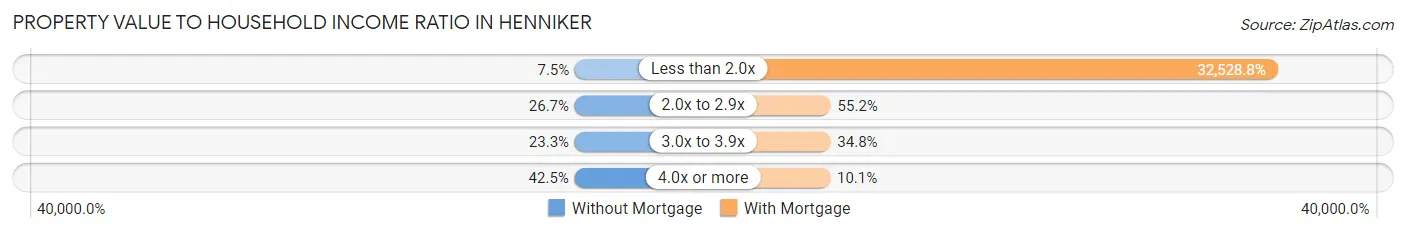
| Value-to-Income Ratio | Without Mortgage | With Mortgage |
| Less than 2.0x | 9 (7.5%) | 135,645 (32,528.8%) |
| 2.0x to 2.9x | 32 (26.7%) | 230 (55.2%) |
| 3.0x to 3.9x | 28 (23.3%) | 145 (34.8%) |
| 4.0x or more | 51 (42.5%) | 42 (10.1%) |
| Total | 120 (100.0%) | 417 (100.0%) |
Real Estate Taxes by Mortgage Status in Henniker
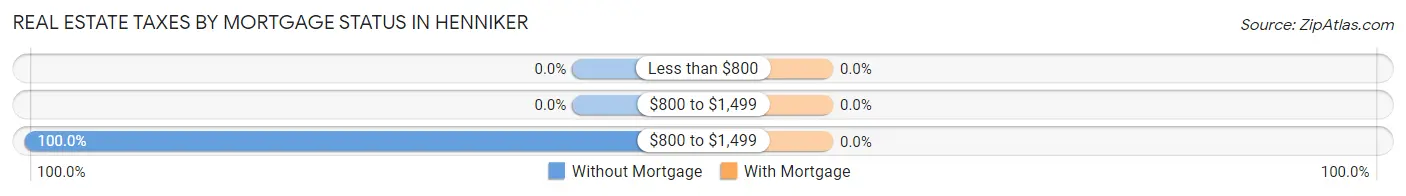
| Property Taxes | Without Mortgage | With Mortgage |
| Less than $800 | 0 (0.0%) | 0 (0.0%) |
| $800 to $1,499 | 0 (0.0%) | 0 (0.0%) |
| $800 to $1,499 | 120 (100.0%) | 0 (0.0%) |
| Total | 120 (100.0%) | 417 (100.0%) |
Health & Disability in Henniker
Health Insurance Coverage by Age in Henniker
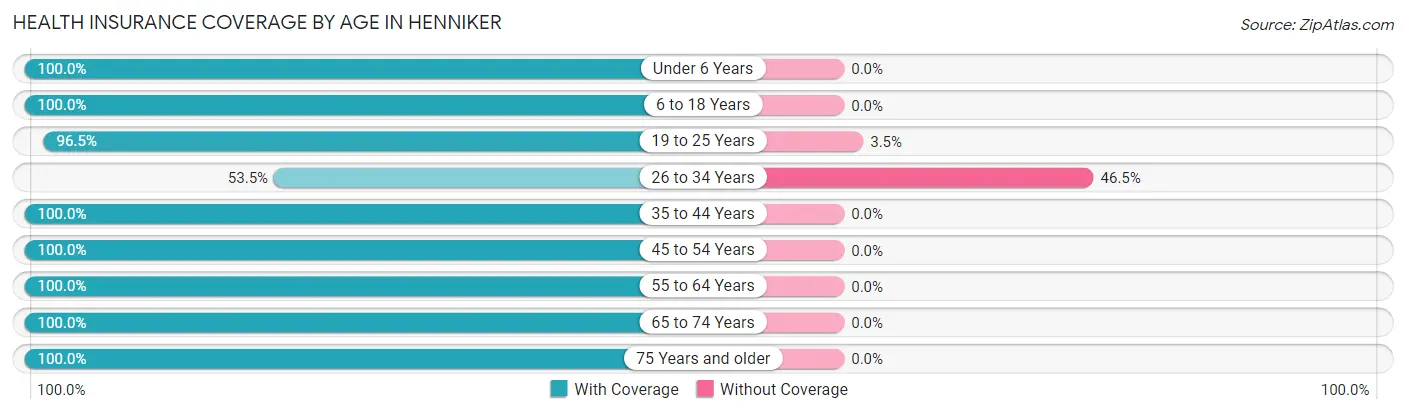
| Age Bracket | With Coverage | Without Coverage |
| Under 6 Years | 192 (100.0%) | 0 (0.0%) |
| 6 to 18 Years | 273 (100.0%) | 0 (0.0%) |
| 19 to 25 Years | 871 (96.5%) | 32 (3.5%) |
| 26 to 34 Years | 198 (53.5%) | 172 (46.5%) |
| 35 to 44 Years | 45 (100.0%) | 0 (0.0%) |
| 45 to 54 Years | 100 (100.0%) | 0 (0.0%) |
| 55 to 64 Years | 172 (100.0%) | 0 (0.0%) |
| 65 to 74 Years | 667 (100.0%) | 0 (0.0%) |
| 75 Years and older | 19 (100.0%) | 0 (0.0%) |
| Total | 2,537 (92.6%) | 204 (7.4%) |
Health Insurance Coverage by Citizenship Status in Henniker
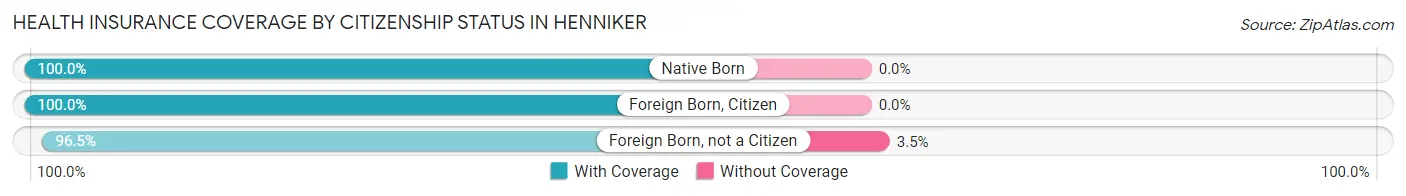
| Citizenship Status | With Coverage | Without Coverage |
| Native Born | 192 (100.0%) | 0 (0.0%) |
| Foreign Born, Citizen | 273 (100.0%) | 0 (0.0%) |
| Foreign Born, not a Citizen | 871 (96.5%) | 32 (3.5%) |
Health Insurance Coverage by Household Income in Henniker
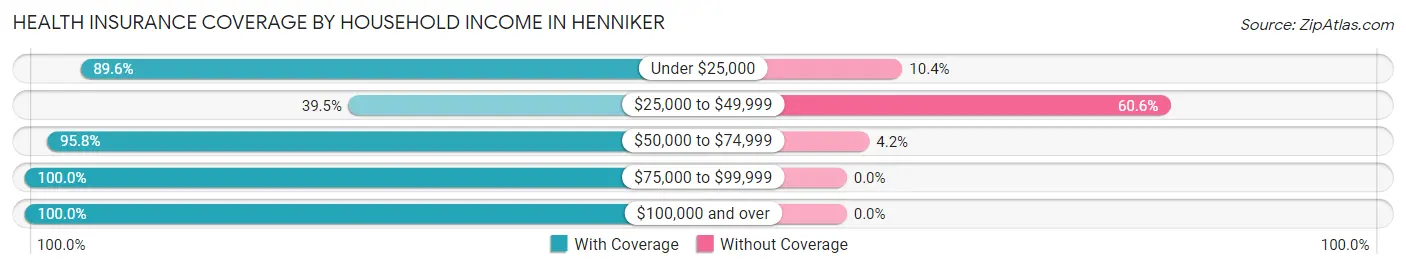
| Household Income | With Coverage | Without Coverage |
| Under $25,000 | 275 (89.6%) | 32 (10.4%) |
| $25,000 to $49,999 | 101 (39.5%) | 155 (60.6%) |
| $50,000 to $74,999 | 272 (95.8%) | 12 (4.2%) |
| $75,000 to $99,999 | 79 (100.0%) | 0 (0.0%) |
| $100,000 and over | 1,199 (100.0%) | 0 (0.0%) |
Public vs Private Health Insurance Coverage by Age in Henniker
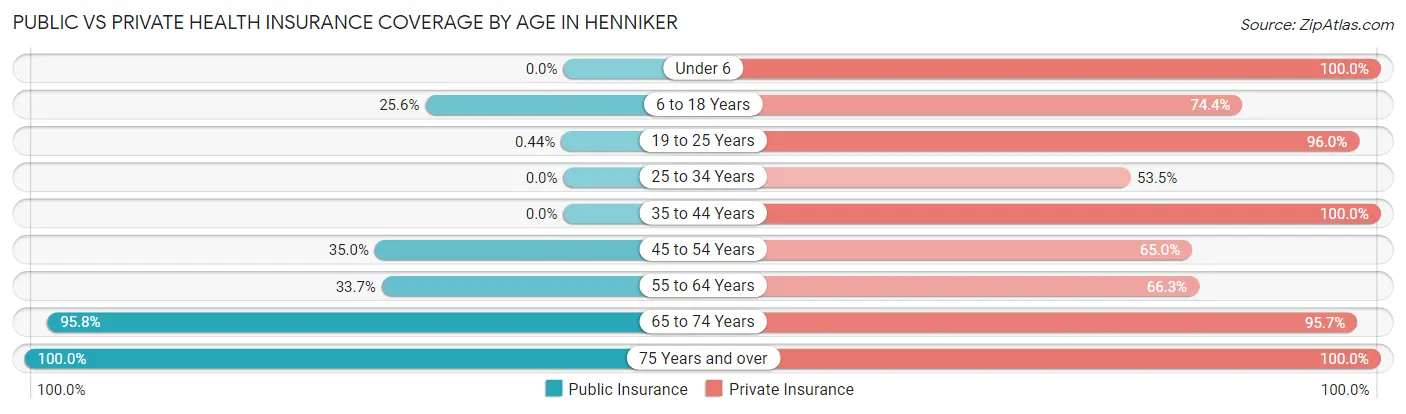
| Age Bracket | Public Insurance | Private Insurance |
| Under 6 | 0 (0.0%) | 192 (100.0%) |
| 6 to 18 Years | 70 (25.6%) | 203 (74.4%) |
| 19 to 25 Years | 4 (0.4%) | 867 (96.0%) |
| 25 to 34 Years | 0 (0.0%) | 198 (53.5%) |
| 35 to 44 Years | 0 (0.0%) | 45 (100.0%) |
| 45 to 54 Years | 35 (35.0%) | 65 (65.0%) |
| 55 to 64 Years | 58 (33.7%) | 114 (66.3%) |
| 65 to 74 Years | 639 (95.8%) | 638 (95.7%) |
| 75 Years and over | 19 (100.0%) | 19 (100.0%) |
| Total | 825 (30.1%) | 2,341 (85.4%) |
Disability Status by Sex by Age in Henniker
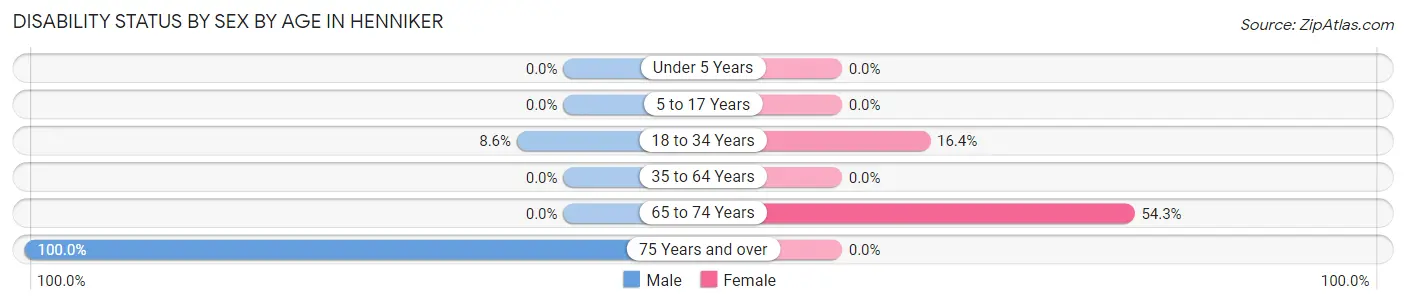
| Age Bracket | Male | Female |
| Under 5 Years | 0 (0.0%) | 0 (0.0%) |
| 5 to 17 Years | 0 (0.0%) | 0 (0.0%) |
| 18 to 34 Years | 64 (8.6%) | 113 (16.4%) |
| 35 to 64 Years | 0 (0.0%) | 0 (0.0%) |
| 65 to 74 Years | 0 (0.0%) | 201 (54.3%) |
| 75 Years and over | 8 (100.0%) | 0 (0.0%) |
Disability Class by Sex by Age in Henniker
Disability Class: Hearing Difficulty
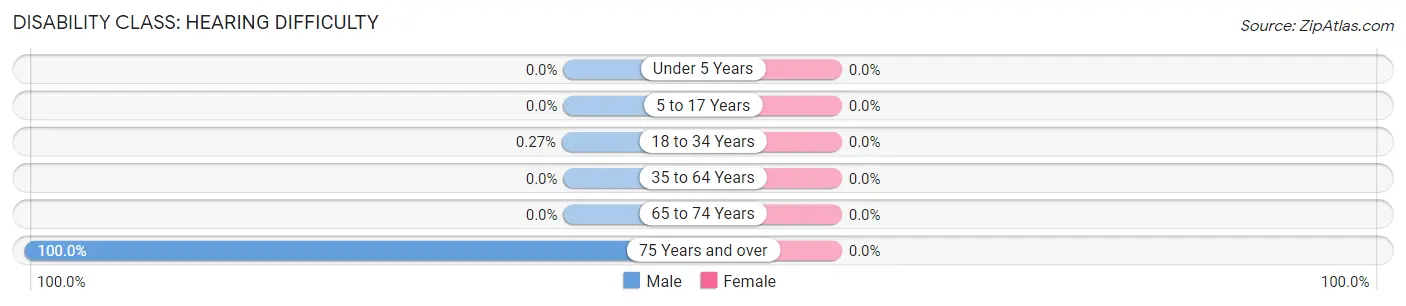
| Age Bracket | Male | Female |
| Under 5 Years | 0 (0.0%) | 0 (0.0%) |
| 5 to 17 Years | 0 (0.0%) | 0 (0.0%) |
| 18 to 34 Years | 2 (0.3%) | 0 (0.0%) |
| 35 to 64 Years | 0 (0.0%) | 0 (0.0%) |
| 65 to 74 Years | 0 (0.0%) | 0 (0.0%) |
| 75 Years and over | 8 (100.0%) | 0 (0.0%) |
Disability Class: Vision Difficulty
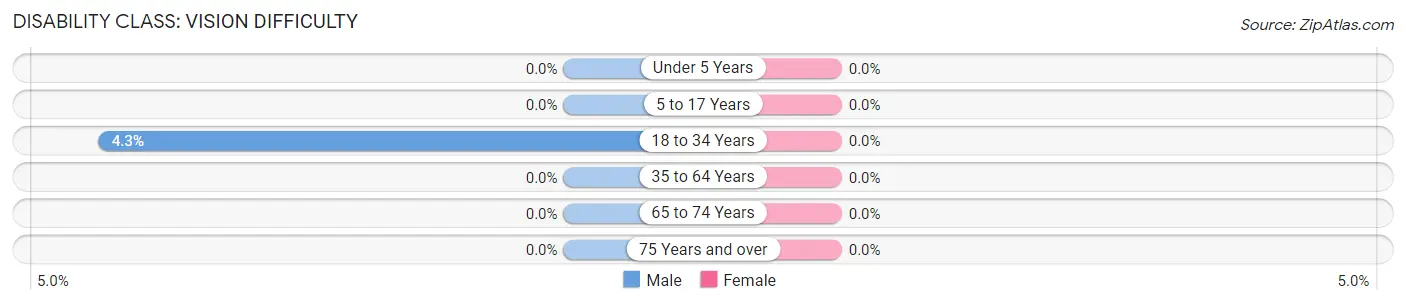
| Age Bracket | Male | Female |
| Under 5 Years | 0 (0.0%) | 0 (0.0%) |
| 5 to 17 Years | 0 (0.0%) | 0 (0.0%) |
| 18 to 34 Years | 32 (4.3%) | 0 (0.0%) |
| 35 to 64 Years | 0 (0.0%) | 0 (0.0%) |
| 65 to 74 Years | 0 (0.0%) | 0 (0.0%) |
| 75 Years and over | 0 (0.0%) | 0 (0.0%) |
Disability Class: Cognitive Difficulty
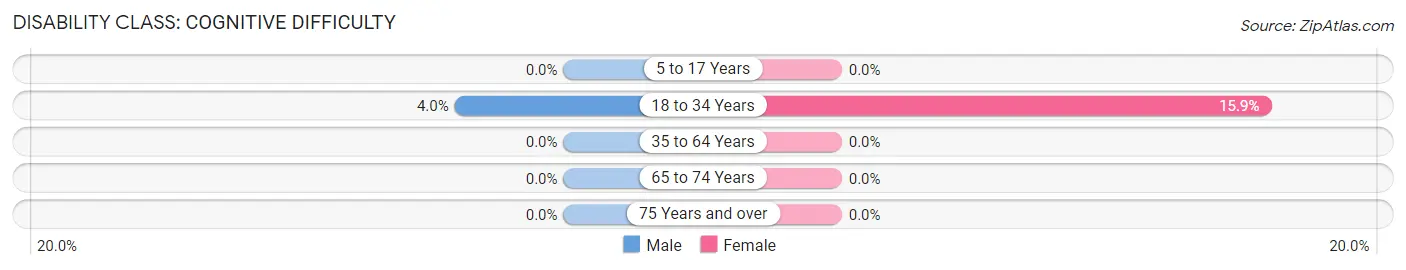
| Age Bracket | Male | Female |
| 5 to 17 Years | 0 (0.0%) | 0 (0.0%) |
| 18 to 34 Years | 30 (4.0%) | 110 (15.9%) |
| 35 to 64 Years | 0 (0.0%) | 0 (0.0%) |
| 65 to 74 Years | 0 (0.0%) | 0 (0.0%) |
| 75 Years and over | 0 (0.0%) | 0 (0.0%) |
Disability Class: Ambulatory Difficulty
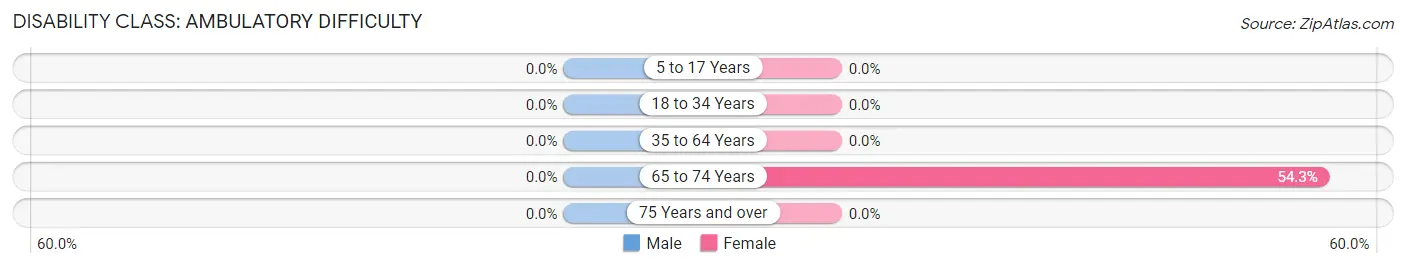
| Age Bracket | Male | Female |
| 5 to 17 Years | 0 (0.0%) | 0 (0.0%) |
| 18 to 34 Years | 0 (0.0%) | 0 (0.0%) |
| 35 to 64 Years | 0 (0.0%) | 0 (0.0%) |
| 65 to 74 Years | 0 (0.0%) | 201 (54.3%) |
| 75 Years and over | 0 (0.0%) | 0 (0.0%) |
Disability Class: Self-Care Difficulty
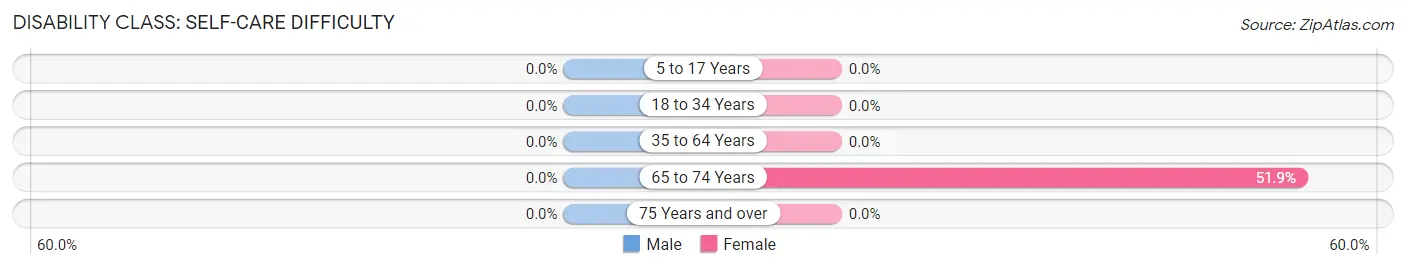
| Age Bracket | Male | Female |
| 5 to 17 Years | 0 (0.0%) | 0 (0.0%) |
| 18 to 34 Years | 0 (0.0%) | 0 (0.0%) |
| 35 to 64 Years | 0 (0.0%) | 0 (0.0%) |
| 65 to 74 Years | 0 (0.0%) | 192 (51.9%) |
| 75 Years and over | 0 (0.0%) | 0 (0.0%) |
Technology Access in Henniker
Computing Device Access in Henniker
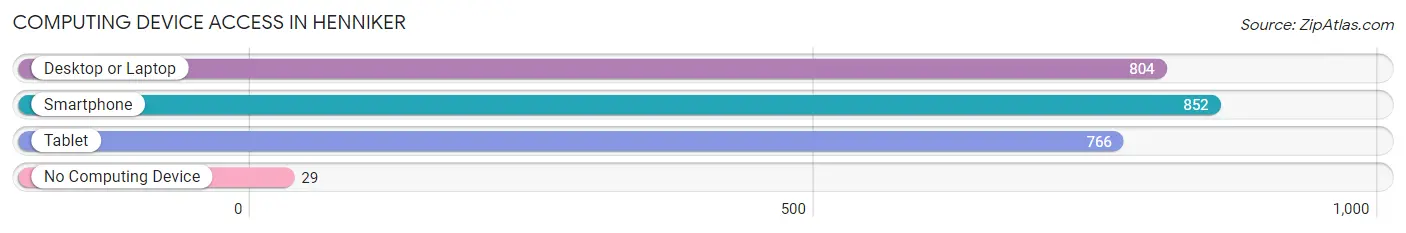
| Device Type | # Households | % Households |
| Desktop or Laptop | 804 | 72.1% |
| Smartphone | 852 | 76.4% |
| Tablet | 766 | 68.7% |
| No Computing Device | 29 | 2.6% |
| Total | 1,115 | 100.0% |
Internet Access in Henniker
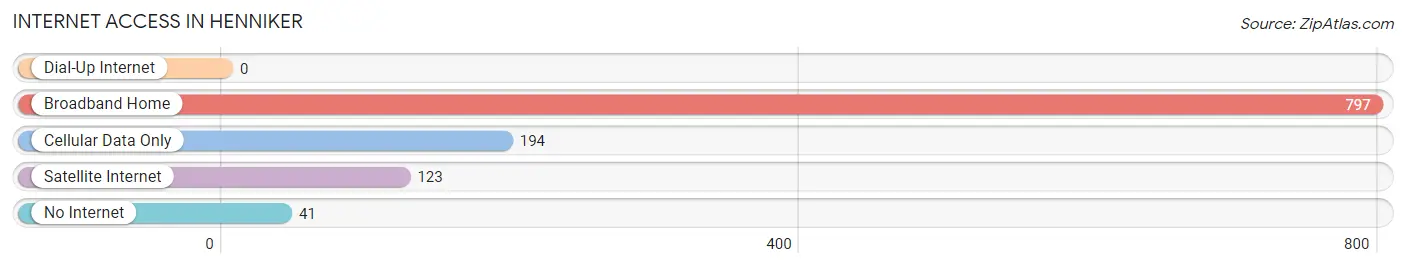
| Internet Type | # Households | % Households |
| Dial-Up Internet | 0 | 0.0% |
| Broadband Home | 797 | 71.5% |
| Cellular Data Only | 194 | 17.4% |
| Satellite Internet | 123 | 11.0% |
| No Internet | 41 | 3.7% |
| Total | 1,115 | 100.0% |
Henniker Summary
Henniker is a small town located in Merrimack County, New Hampshire, United States. It is situated in the foothills of the White Mountains, and is home to New England College. The town has a population of 3,556 as of the 2010 census.
Geography
Henniker is located in the southwestern corner of Merrimack County, bordered by the towns of Hopkinton to the north, Bradford to the east, and Warner to the south. The Contoocook River flows through the town, and the town is home to the Henniker State Forest. The town has a total area of 28.2 square miles, of which 28.1 square miles is land and 0.1 square miles is water.
History
Henniker was first settled in 1761 by settlers from Massachusetts. The town was incorporated in 1768, and was named after Sir John Henniker, an English baronet. The town was originally a farming community, and the first gristmill was built in 1768. In the 19th century, the town became a popular summer resort destination, and the first hotel was built in 1820.
In the late 19th century, the town became a center for the production of woodenware, and the Henniker Woodenware Company was established in 1891. The company was the largest producer of woodenware in the United States, and employed over 500 people at its peak. The company closed in the 1950s, and the town has since shifted to a more service-based economy.
Economy
Henniker’s economy is largely based on services, with the largest employers being New England College, the Henniker Community School District, and the Henniker General Store. The town is also home to several small businesses, including restaurants, retail stores, and a brewery.
Demographics
As of the 2010 census, there were 3,556 people, 1,521 households, and 890 families residing in the town. The population density was 126.2 people per square mile. The racial makeup of the town was 97.2% White, 0.7% African American, 0.3% Native American, 0.7% Asian, 0.1% Pacific Islander, 0.2% from other races, and 0.9% from two or more races. Hispanic or Latino of any race were 1.2% of the population.
The median age in the town was 33.7 years, with 24.2% of the population under the age of 18, and 11.7% over the age of 65. The median household income was $50,972, and the median family income was $62,917. The per capita income for the town was $25,945.
Conclusion
Henniker is a small town located in Merrimack County, New Hampshire, United States. It is situated in the foothills of the White Mountains, and is home to New England College. The town has a population of 3,556 as of the 2010 census. The town’s economy is largely based on services, with the largest employers being New England College, the Henniker Community School District, and the Henniker General Store. The racial makeup of the town was 97.2% White, 0.7% African American, 0.3% Native American, 0.7% Asian, 0.1% Pacific Islander, 0.2% from other races, and 0.9% from two or more races. The median household income was $50,972, and the median family income was $62,917.
Common Questions
What is Per Capita Income in Henniker?
Per Capita income in Henniker is $35,191.
What is the Median Family Income in Henniker?
Median Family Income in Henniker is $135,143.
What is the Median Household income in Henniker?
Median Household Income in Henniker is $70,839.
What is Income or Wage Gap in Henniker?
Income or Wage Gap in Henniker is 50.5%.
Women in Henniker earn 49.5 cents for every dollar earned by a man.
What is Inequality or Gini Index in Henniker?
Inequality or Gini Index in Henniker is 0.42.
What is the Total Population of Henniker?
Total Population of Henniker is 2,741.
What is the Total Male Population of Henniker?
Total Male Population of Henniker is 1,393.
What is the Total Female Population of Henniker?
Total Female Population of Henniker is 1,348.
What is the Ratio of Males per 100 Females in Henniker?
There are 103.34 Males per 100 Females in Henniker.
What is the Ratio of Females per 100 Males in Henniker?
There are 96.77 Females per 100 Males in Henniker.
What is the Median Population Age in Henniker?
Median Population Age in Henniker is 26.0 Years.
What is the Average Family Size in Henniker
Average Family Size in Henniker is 2.6 People.
What is the Average Household Size in Henniker
Average Household Size in Henniker is 1.9 People.
How Large is the Labor Force in Henniker?
There are 1,383 People in the Labor Forcein in Henniker.
What is the Percentage of People in the Labor Force in Henniker?
56.2% of People are in the Labor Force in Henniker.