Lisbon, NH Map & Demographics
Lisbon Map
Lisbon Overview
$32,119
PER CAPITA INCOME
$78,000
AVG FAMILY INCOME
$64,208
AVG HOUSEHOLD INCOME
32.8%
WAGE / INCOME GAP [ % ]
67.2¢/ $1
WAGE / INCOME GAP [ $ ]
$20,000
FAMILY INCOME DEFICIT
0.41
INEQUALITY / GINI INDEX
872
TOTAL POPULATION
433
MALE POPULATION
439
FEMALE POPULATION
98.63
MALES / 100 FEMALES
101.39
FEMALES / 100 MALES
41.4
MEDIAN AGE
3.1
AVG FAMILY SIZE
2.4
AVG HOUSEHOLD SIZE
446
LABOR FORCE [ PEOPLE ]
63.8%
PERCENT IN LABOR FORCE
8.1%
UNEMPLOYMENT RATE
Lisbon Zip Codes
Lisbon Area Codes
Income in Lisbon
Income Overview in Lisbon
Per Capita Income in Lisbon is $32,119, while median incomes of families and households are $78,000 and $64,208 respectively.
| Characteristic | Number | Measure |
| Per Capita Income | 872 | $32,119 |
| Median Family Income | 198 | $78,000 |
| Mean Family Income | 198 | $98,678 |
| Median Household Income | 369 | $64,208 |
| Mean Household Income | 369 | $75,651 |
| Income Deficit | 198 | $20,000 |
| Wage / Income Gap (%) | 872 | 32.78% |
| Wage / Income Gap ($) | 872 | 67.22¢ per $1 |
| Gini / Inequality Index | 872 | 0.41 |
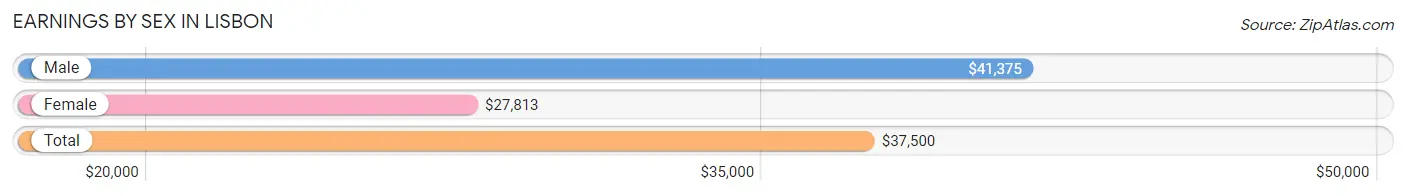
Earnings by Sex in Lisbon
Average Earnings in Lisbon are $37,500, $41,375 for men and $27,813 for women, a difference of 32.8%.
| Sex | Number | Average Earnings |
| Male | 243 (49.2%) | $41,375 |
| Female | 251 (50.8%) | $27,813 |
| Total | 494 (100.0%) | $37,500 |
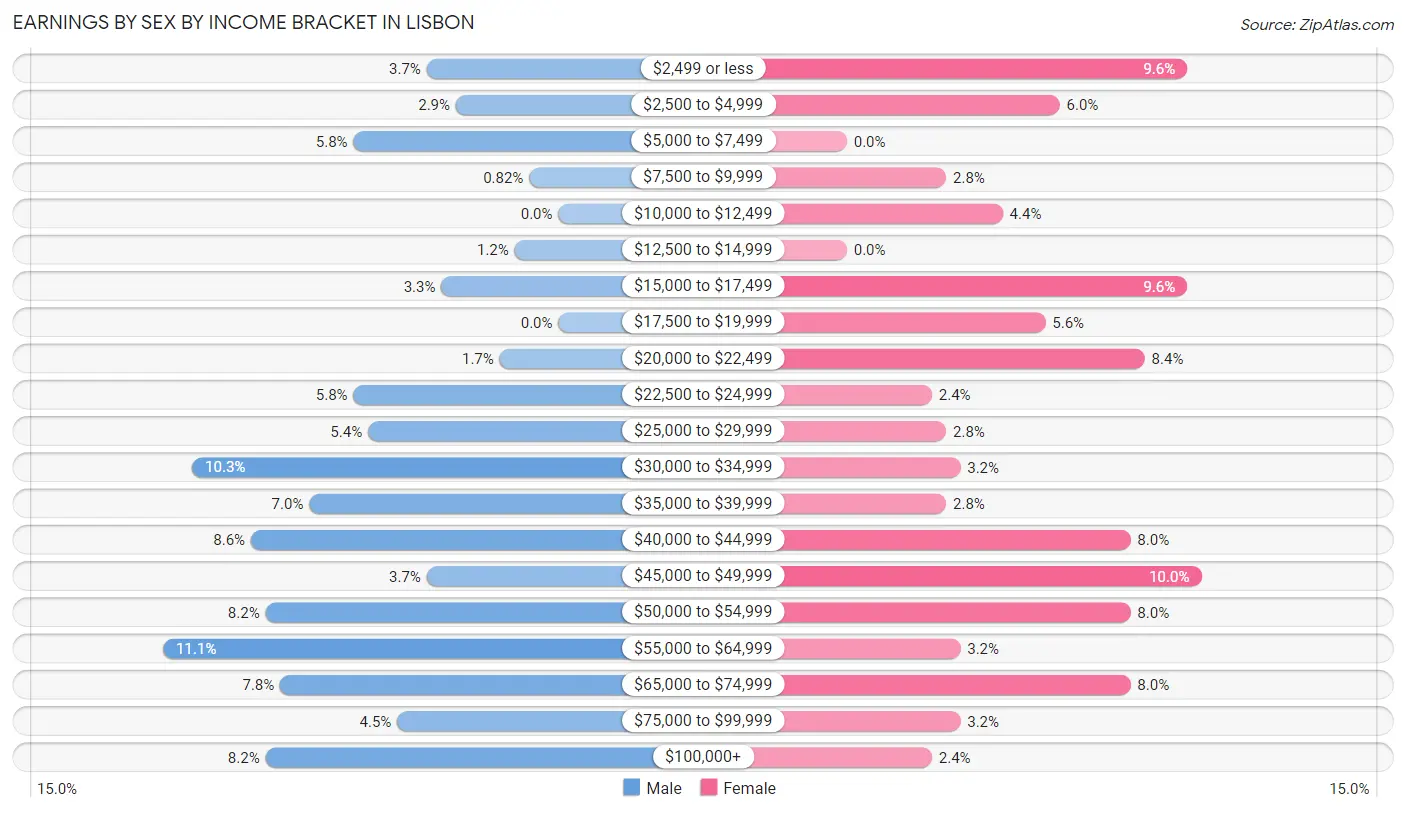
Earnings by Sex by Income Bracket in Lisbon
The most common earnings brackets in Lisbon are $55,000 to $64,999 for men (27 | 11.1%) and $45,000 to $49,999 for women (25 | 10.0%).
| Income | Male | Female |
| $2,499 or less | 9 (3.7%) | 24 (9.6%) |
| $2,500 to $4,999 | 7 (2.9%) | 15 (6.0%) |
| $5,000 to $7,499 | 14 (5.8%) | 0 (0.0%) |
| $7,500 to $9,999 | 2 (0.8%) | 7 (2.8%) |
| $10,000 to $12,499 | 0 (0.0%) | 11 (4.4%) |
| $12,500 to $14,999 | 3 (1.2%) | 0 (0.0%) |
| $15,000 to $17,499 | 8 (3.3%) | 24 (9.6%) |
| $17,500 to $19,999 | 0 (0.0%) | 14 (5.6%) |
| $20,000 to $22,499 | 4 (1.7%) | 21 (8.4%) |
| $22,500 to $24,999 | 14 (5.8%) | 6 (2.4%) |
| $25,000 to $29,999 | 13 (5.3%) | 7 (2.8%) |
| $30,000 to $34,999 | 25 (10.3%) | 8 (3.2%) |
| $35,000 to $39,999 | 17 (7.0%) | 7 (2.8%) |
| $40,000 to $44,999 | 21 (8.6%) | 20 (8.0%) |
| $45,000 to $49,999 | 9 (3.7%) | 25 (10.0%) |
| $50,000 to $54,999 | 20 (8.2%) | 20 (8.0%) |
| $55,000 to $64,999 | 27 (11.1%) | 8 (3.2%) |
| $65,000 to $74,999 | 19 (7.8%) | 20 (8.0%) |
| $75,000 to $99,999 | 11 (4.5%) | 8 (3.2%) |
| $100,000+ | 20 (8.2%) | 6 (2.4%) |
| Total | 243 (100.0%) | 251 (100.0%) |
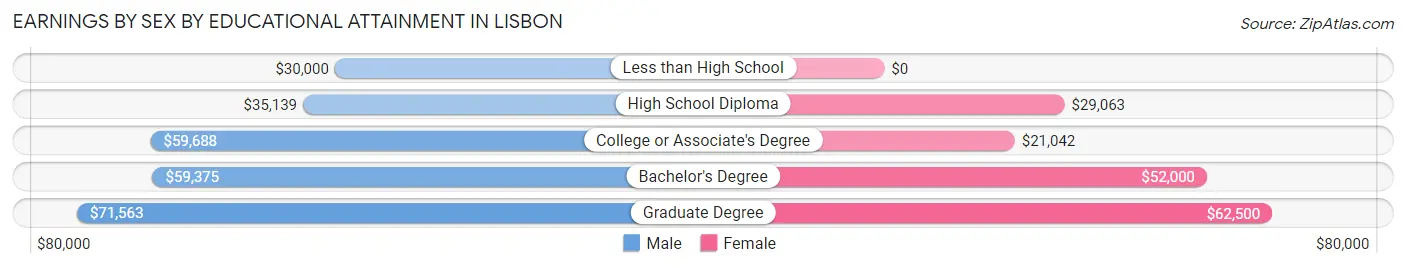
Earnings by Sex by Educational Attainment in Lisbon
Average earnings in Lisbon are $44,205 for men and $40,208 for women, a difference of 9.0%. Men with an educational attainment of graduate degree enjoy the highest average annual earnings of $71,563, while those with less than high school education earn the least with $30,000. Women with an educational attainment of graduate degree earn the most with the average annual earnings of $62,500, while those with college or associate's degree education have the smallest earnings of $21,042.
| Educational Attainment | Male Income | Female Income |
| Less than High School | $30,000 | $0 |
| High School Diploma | $35,139 | $29,063 |
| College or Associate's Degree | $59,688 | $21,042 |
| Bachelor's Degree | $59,375 | $52,000 |
| Graduate Degree | $71,563 | $62,500 |
| Total | $44,205 | $40,208 |
Family Income in Lisbon
Family Income Brackets in Lisbon
According to the Lisbon family income data, there are 53 families falling into the $50,000 to $74,999 income range, which is the most common income bracket and makes up 26.8% of all families. Conversely, the $10,000 to $14,999 income bracket is the least frequent group with only 4 families (2.0%) belonging to this category.
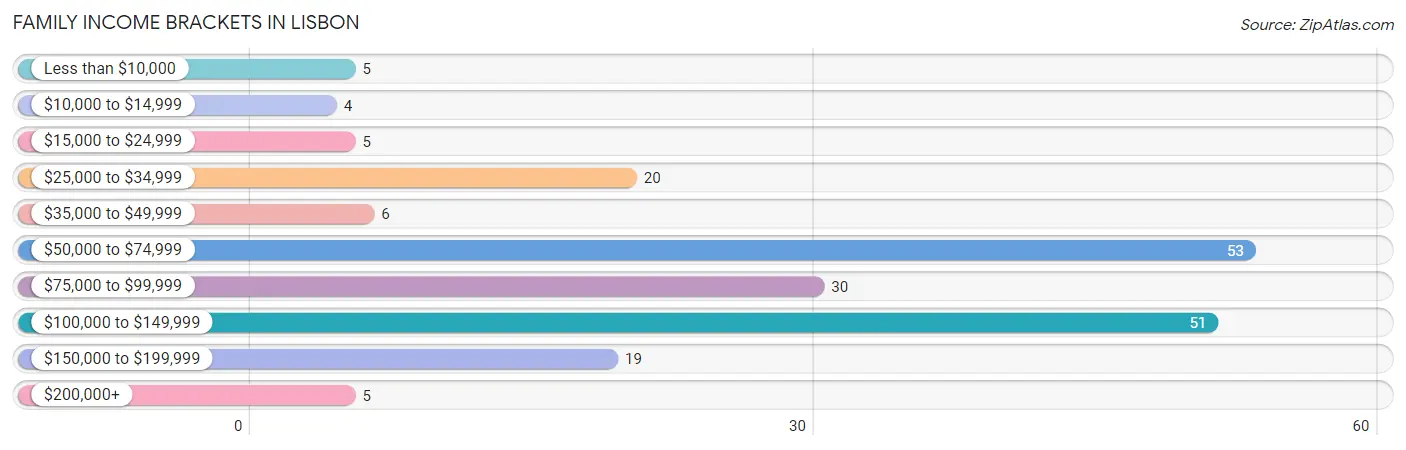
| Income Bracket | # Families | % Families |
| Less than $10,000 | 5 | 2.5% |
| $10,000 to $14,999 | 4 | 2.0% |
| $15,000 to $24,999 | 5 | 2.5% |
| $25,000 to $34,999 | 20 | 10.1% |
| $35,000 to $49,999 | 6 | 3.0% |
| $50,000 to $74,999 | 53 | 26.8% |
| $75,000 to $99,999 | 30 | 15.2% |
| $100,000 to $149,999 | 51 | 25.8% |
| $150,000 to $199,999 | 19 | 9.6% |
| $200,000+ | 5 | 2.5% |
Family Income by Famaliy Size in Lisbon
4-person families (41 | 20.7%) account for the highest median family income in Lisbon with $126,250 per family, while 2-person families (102 | 51.5%) have the highest median income of $37,500 per family member.
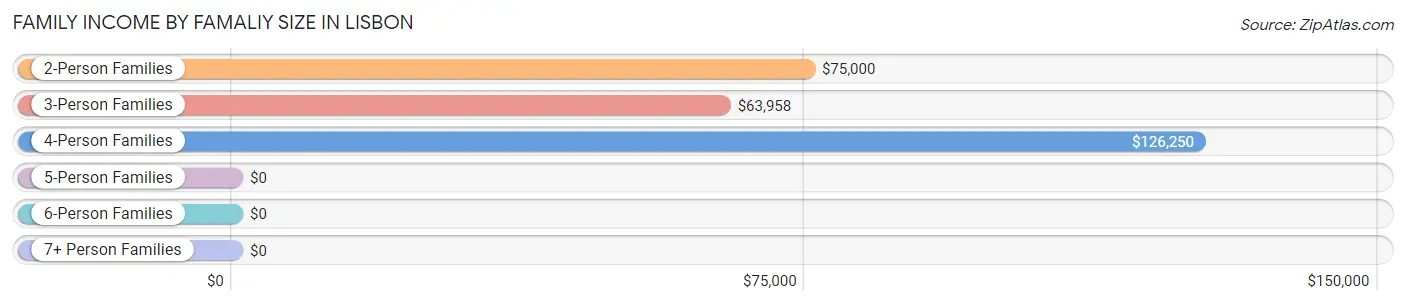
| Income Bracket | # Families | Median Income |
| 2-Person Families | 102 (51.5%) | $75,000 |
| 3-Person Families | 33 (16.7%) | $63,958 |
| 4-Person Families | 41 (20.7%) | $126,250 |
| 5-Person Families | 10 (5.1%) | $0 |
| 6-Person Families | 8 (4.0%) | $0 |
| 7+ Person Families | 4 (2.0%) | $0 |
| Total | 198 (100.0%) | $78,000 |
Family Income by Number of Earners in Lisbon
The median family income in Lisbon is $78,000, with families comprising 3+ earners (25) having the highest median family income of $145,625, while families with no earners (30) have the lowest median family income of $33,750, accounting for 12.6% and 15.1% of families, respectively.
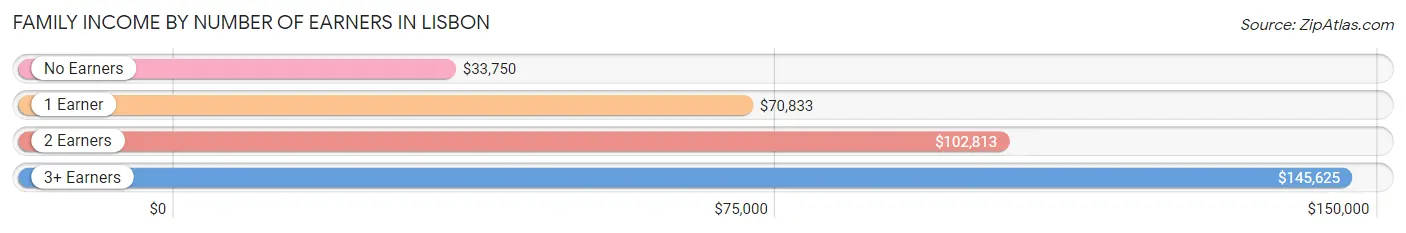
| Number of Earners | # Families | Median Income |
| No Earners | 30 (15.1%) | $33,750 |
| 1 Earner | 58 (29.3%) | $70,833 |
| 2 Earners | 85 (42.9%) | $102,813 |
| 3+ Earners | 25 (12.6%) | $145,625 |
| Total | 198 (100.0%) | $78,000 |
Household Income in Lisbon
Household Income Brackets in Lisbon
With 102 households falling in the category, the $50,000 to $74,999 income range is the most frequent in Lisbon, accounting for 27.6% of all households. In contrast, only 5 households (1.4%) fall into the $200,000+ income bracket, making it the least populous group.
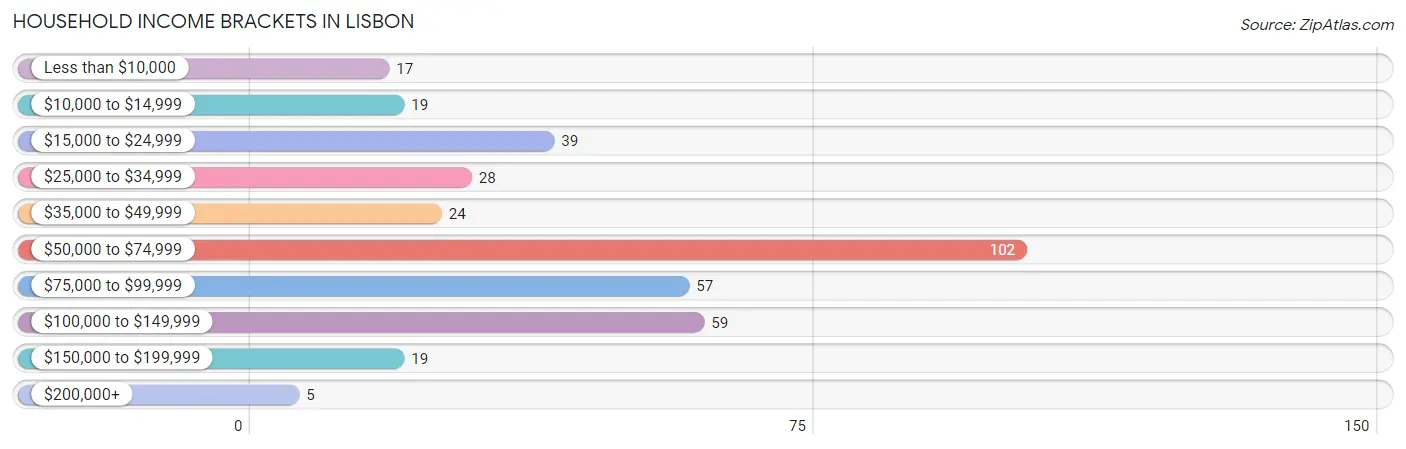
| Income Bracket | # Households | % Households |
| Less than $10,000 | 17 | 4.6% |
| $10,000 to $14,999 | 19 | 5.1% |
| $15,000 to $24,999 | 39 | 10.6% |
| $25,000 to $34,999 | 28 | 7.6% |
| $35,000 to $49,999 | 24 | 6.5% |
| $50,000 to $74,999 | 102 | 27.6% |
| $75,000 to $99,999 | 57 | 15.4% |
| $100,000 to $149,999 | 59 | 16.0% |
| $150,000 to $199,999 | 19 | 5.1% |
| $200,000+ | 5 | 1.4% |
Household Income by Householder Age in Lisbon
The median household income in Lisbon is $64,208, with the highest median household income of $80,250 found in the 25 to 44 years age bracket for the primary householder. A total of 79 households (21.4%) fall into this category. Meanwhile, the 15 to 24 years age bracket for the primary householder has the lowest median household income of $0, with 15 households (4.1%) in this group.
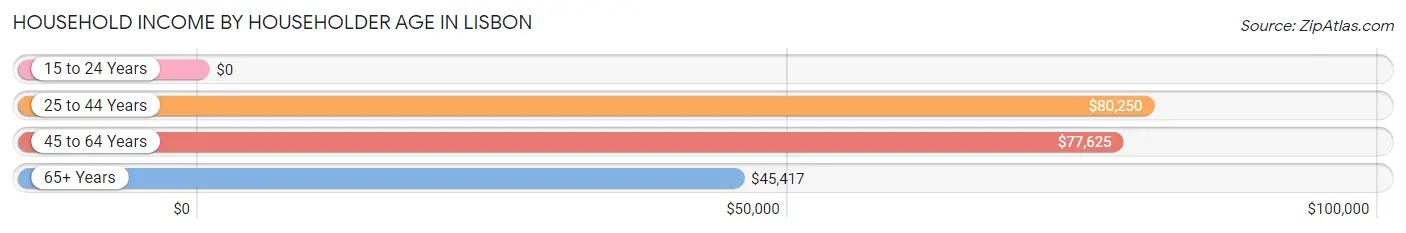
| Income Bracket | # Households | Median Income |
| 15 to 24 Years | 15 (4.1%) | $0 |
| 25 to 44 Years | 79 (21.4%) | $80,250 |
| 45 to 64 Years | 131 (35.5%) | $77,625 |
| 65+ Years | 144 (39.0%) | $45,417 |
| Total | 369 (100.0%) | $64,208 |
Poverty in Lisbon
Income Below Poverty by Sex and Age in Lisbon
With 10.0% poverty level for males and 11.7% for females among the residents of Lisbon, 5 year old males and under 5 year old females are the most vulnerable to poverty, with 4 males (100.0%) and 12 females (63.2%) in their respective age groups living below the poverty level.
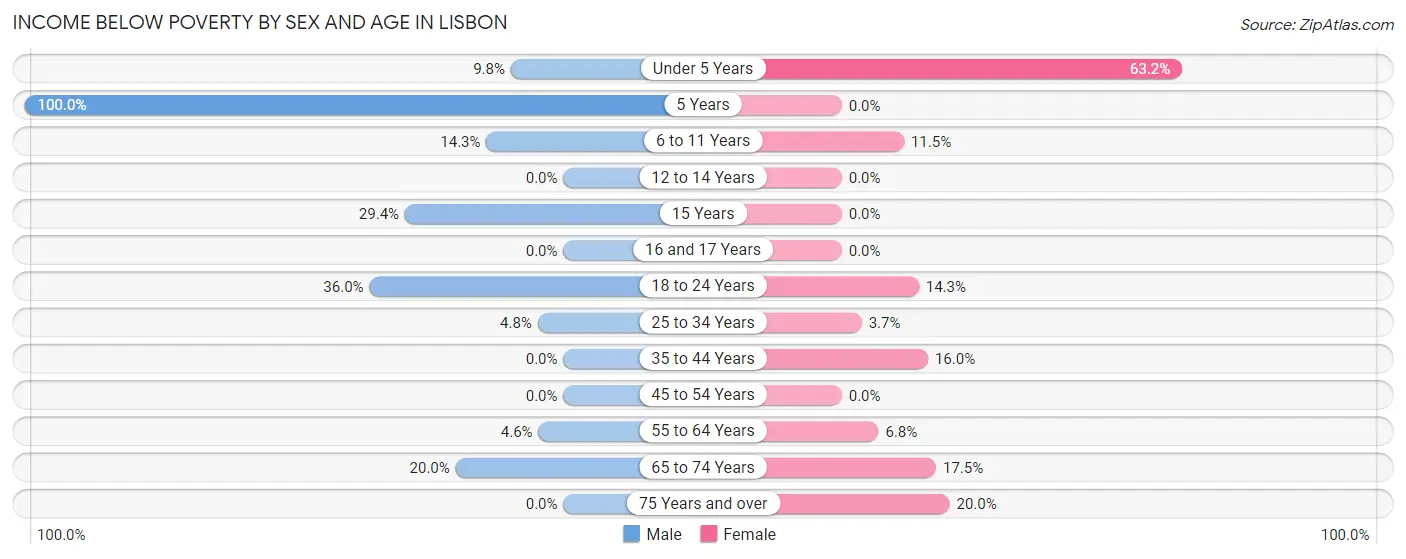
| Age Bracket | Male | Female |
| Under 5 Years | 4 (9.8%) | 12 (63.2%) |
| 5 Years | 4 (100.0%) | 0 (0.0%) |
| 6 to 11 Years | 2 (14.3%) | 3 (11.5%) |
| 12 to 14 Years | 0 (0.0%) | 0 (0.0%) |
| 15 Years | 5 (29.4%) | 0 (0.0%) |
| 16 and 17 Years | 0 (0.0%) | 0 (0.0%) |
| 18 to 24 Years | 9 (36.0%) | 7 (14.3%) |
| 25 to 34 Years | 3 (4.8%) | 2 (3.7%) |
| 35 to 44 Years | 0 (0.0%) | 4 (16.0%) |
| 45 to 54 Years | 0 (0.0%) | 0 (0.0%) |
| 55 to 64 Years | 3 (4.6%) | 3 (6.8%) |
| 65 to 74 Years | 13 (20.0%) | 14 (17.5%) |
| 75 Years and over | 0 (0.0%) | 6 (20.0%) |
| Total | 43 (10.0%) | 51 (11.7%) |
Income Above Poverty by Sex and Age in Lisbon
According to the poverty statistics in Lisbon, males aged 12 to 14 years and females aged 12 to 14 years are the age groups that are most secure financially, with 100.0% of males and 100.0% of females in these age groups living above the poverty line.
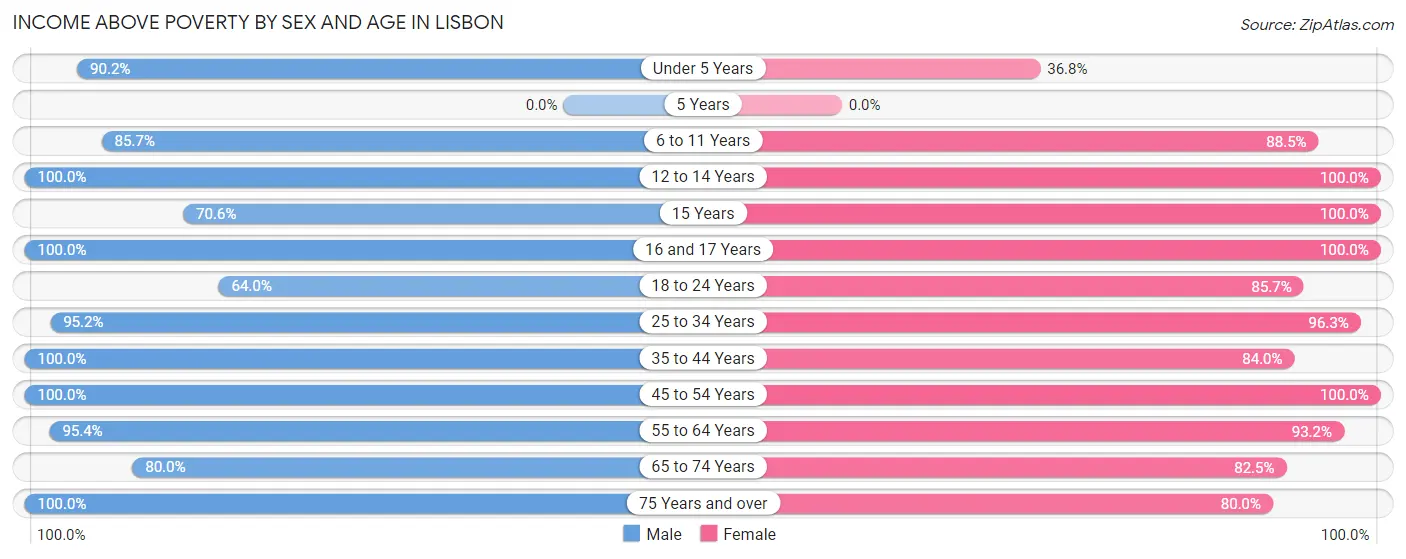
| Age Bracket | Male | Female |
| Under 5 Years | 37 (90.2%) | 7 (36.8%) |
| 5 Years | 0 (0.0%) | 0 (0.0%) |
| 6 to 11 Years | 12 (85.7%) | 23 (88.5%) |
| 12 to 14 Years | 11 (100.0%) | 30 (100.0%) |
| 15 Years | 12 (70.6%) | 4 (100.0%) |
| 16 and 17 Years | 20 (100.0%) | 17 (100.0%) |
| 18 to 24 Years | 16 (64.0%) | 42 (85.7%) |
| 25 to 34 Years | 60 (95.2%) | 52 (96.3%) |
| 35 to 44 Years | 40 (100.0%) | 21 (84.0%) |
| 45 to 54 Years | 52 (100.0%) | 58 (100.0%) |
| 55 to 64 Years | 62 (95.4%) | 41 (93.2%) |
| 65 to 74 Years | 52 (80.0%) | 66 (82.5%) |
| 75 Years and over | 12 (100.0%) | 24 (80.0%) |
| Total | 386 (90.0%) | 385 (88.3%) |
Income Below Poverty Among Married-Couple Families in Lisbon
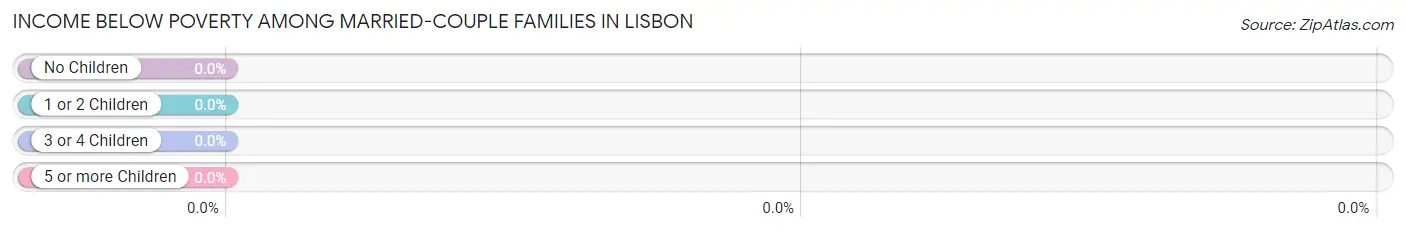
| Children | Above Poverty | Below Poverty |
| No Children | 97 (100.0%) | 0 (0.0%) |
| 1 or 2 Children | 55 (100.0%) | 0 (0.0%) |
| 3 or 4 Children | 10 (100.0%) | 0 (0.0%) |
| 5 or more Children | 0 (0.0%) | 0 (0.0%) |
| Total | 162 (100.0%) | 0 (0.0%) |
Income Below Poverty Among Single-Parent Households in Lisbon
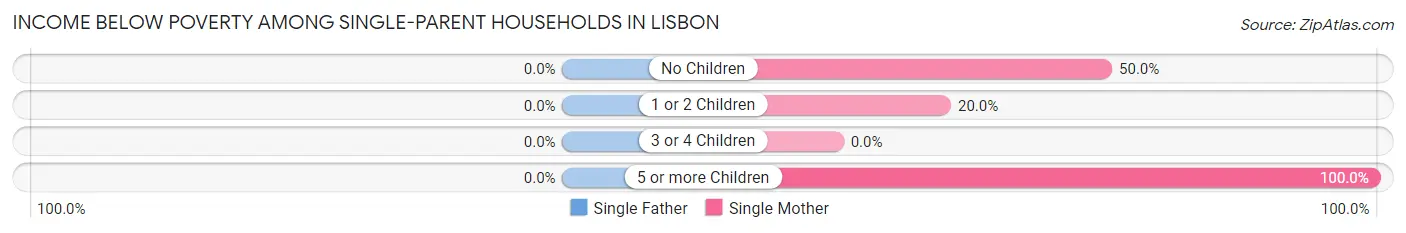
| Children | Single Father | Single Mother |
| No Children | 0 (0.0%) | 3 (50.0%) |
| 1 or 2 Children | 0 (0.0%) | 2 (20.0%) |
| 3 or 4 Children | 0 (0.0%) | 0 (0.0%) |
| 5 or more Children | 0 (0.0%) | 4 (100.0%) |
| Total | 0 (0.0%) | 9 (45.0%) |
Income Below Poverty Among Married-Couple vs Single-Parent Households in Lisbon
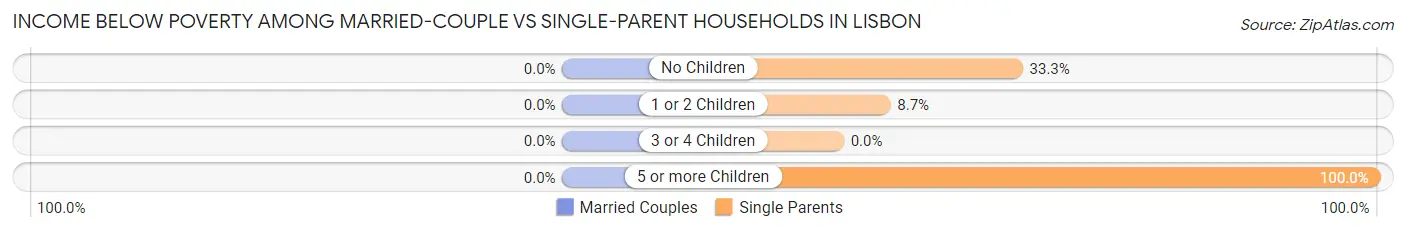
| Children | Married-Couple Families | Single-Parent Households |
| No Children | 0 (0.0%) | 3 (33.3%) |
| 1 or 2 Children | 0 (0.0%) | 2 (8.7%) |
| 3 or 4 Children | 0 (0.0%) | 0 (0.0%) |
| 5 or more Children | 0 (0.0%) | 4 (100.0%) |
| Total | 0 (0.0%) | 9 (25.0%) |
Race in Lisbon
The most populous races in Lisbon are White / Caucasian (858 | 98.4%), Hispanic or Latino (24 | 2.8%), and Two or more Races (11 | 1.3%).
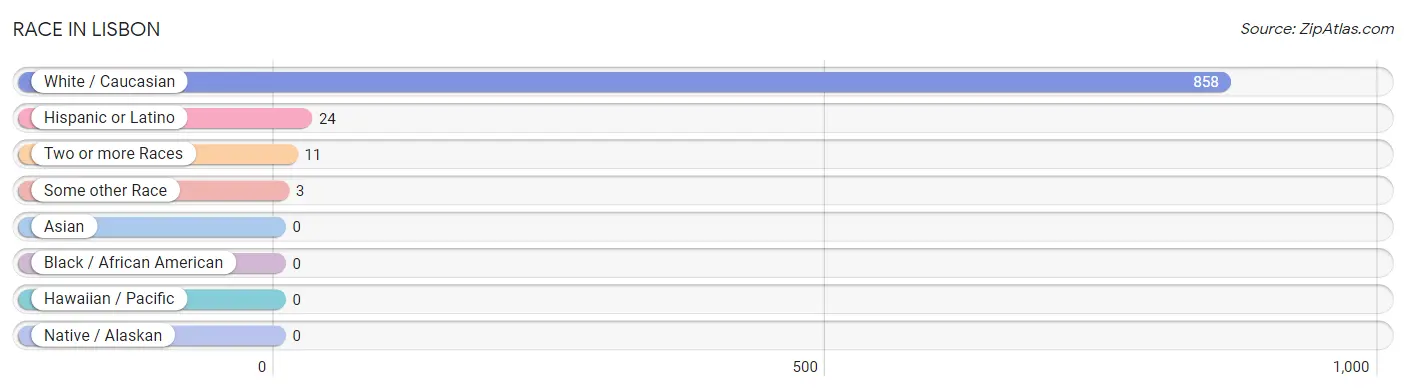
| Race | # Population | % Population |
| Asian | 0 | 0.0% |
| Black / African American | 0 | 0.0% |
| Hawaiian / Pacific | 0 | 0.0% |
| Hispanic or Latino | 24 | 2.8% |
| Native / Alaskan | 0 | 0.0% |
| White / Caucasian | 858 | 98.4% |
| Two or more Races | 11 | 1.3% |
| Some other Race | 3 | 0.3% |
| Total | 872 | 100.0% |
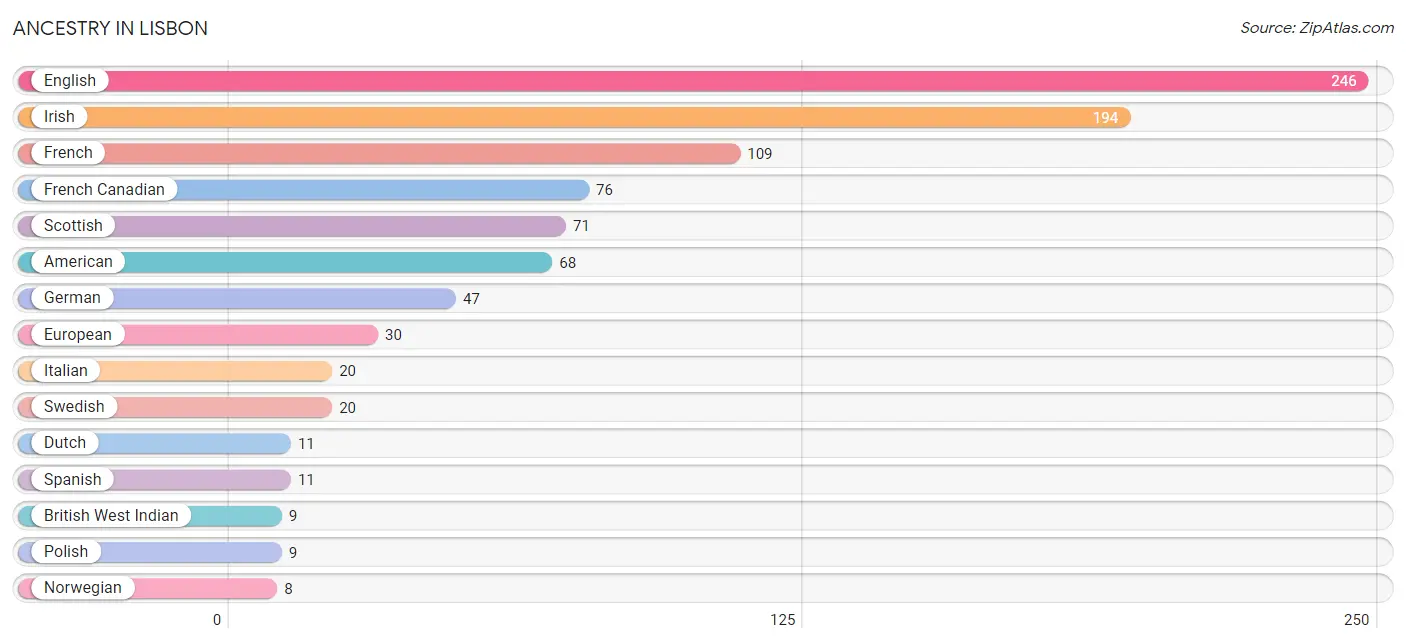
Ancestry in Lisbon
The most populous ancestries reported in Lisbon are English (246 | 28.2%), Irish (194 | 22.3%), French (109 | 12.5%), French Canadian (76 | 8.7%), and Scottish (71 | 8.1%), together accounting for 79.8% of all Lisbon residents.
| Ancestry | # Population | % Population |
| American | 68 | 7.8% |
| Arab | 7 | 0.8% |
| Austrian | 3 | 0.3% |
| Blackfeet | 2 | 0.2% |
| Brazilian | 4 | 0.5% |
| British | 3 | 0.3% |
| British West Indian | 9 | 1.0% |
| Canadian | 3 | 0.3% |
| Central American | 6 | 0.7% |
| Dutch | 11 | 1.3% |
| English | 246 | 28.2% |
| European | 30 | 3.4% |
| Finnish | 3 | 0.3% |
| French | 109 | 12.5% |
| French Canadian | 76 | 8.7% |
| German | 47 | 5.4% |
| Greek | 3 | 0.3% |
| Guatemalan | 6 | 0.7% |
| Irish | 194 | 22.3% |
| Italian | 20 | 2.3% |
| Mexican | 3 | 0.3% |
| Northern European | 4 | 0.5% |
| Norwegian | 8 | 0.9% |
| Polish | 9 | 1.0% |
| Portuguese | 7 | 0.8% |
| Puerto Rican | 4 | 0.5% |
| Scotch-Irish | 6 | 0.7% |
| Scottish | 71 | 8.1% |
| Spanish | 11 | 1.3% |
| Swedish | 20 | 2.3% |
| Syrian | 7 | 0.8% |
| Welsh | 5 | 0.6% |
| Yugoslavian | 8 | 0.9% | View All 33 Rows |
Immigrants in Lisbon
The most numerous immigrant groups reported in Lisbon came from Canada (11 | 1.3%), Europe (6 | 0.7%), Western Europe (6 | 0.7%), Australia (3 | 0.3%), and Austria (3 | 0.3%), together accounting for 3.3% of all Lisbon residents.
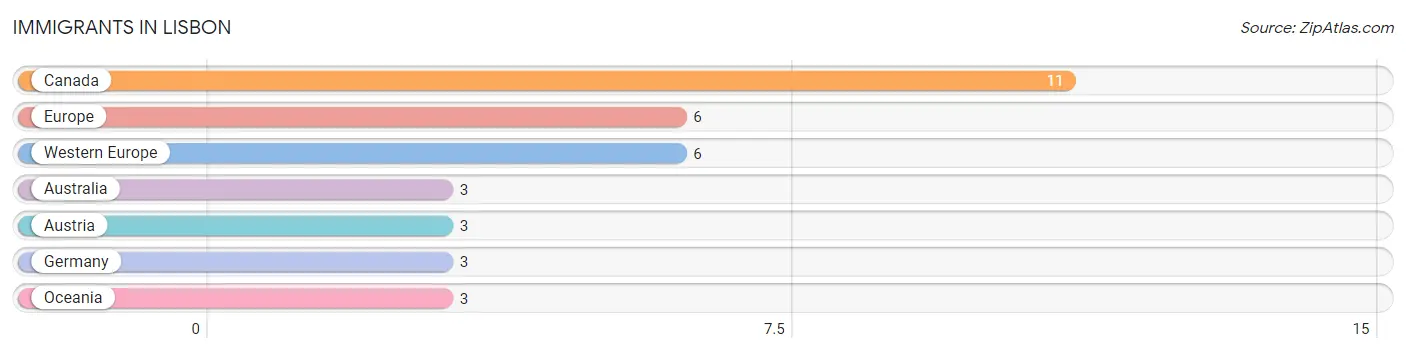
| Immigration Origin | # Population | % Population |
| Australia | 3 | 0.3% |
| Austria | 3 | 0.3% |
| Canada | 11 | 1.3% |
| Europe | 6 | 0.7% |
| Germany | 3 | 0.3% |
| Oceania | 3 | 0.3% |
| Western Europe | 6 | 0.7% | View All 7 Rows |
Sex and Age in Lisbon
Sex and Age in Lisbon
The most populous age groups in Lisbon are 70 to 74 Years (48 | 11.1%) for men and 10 to 14 Years (49 | 11.2%) for women.
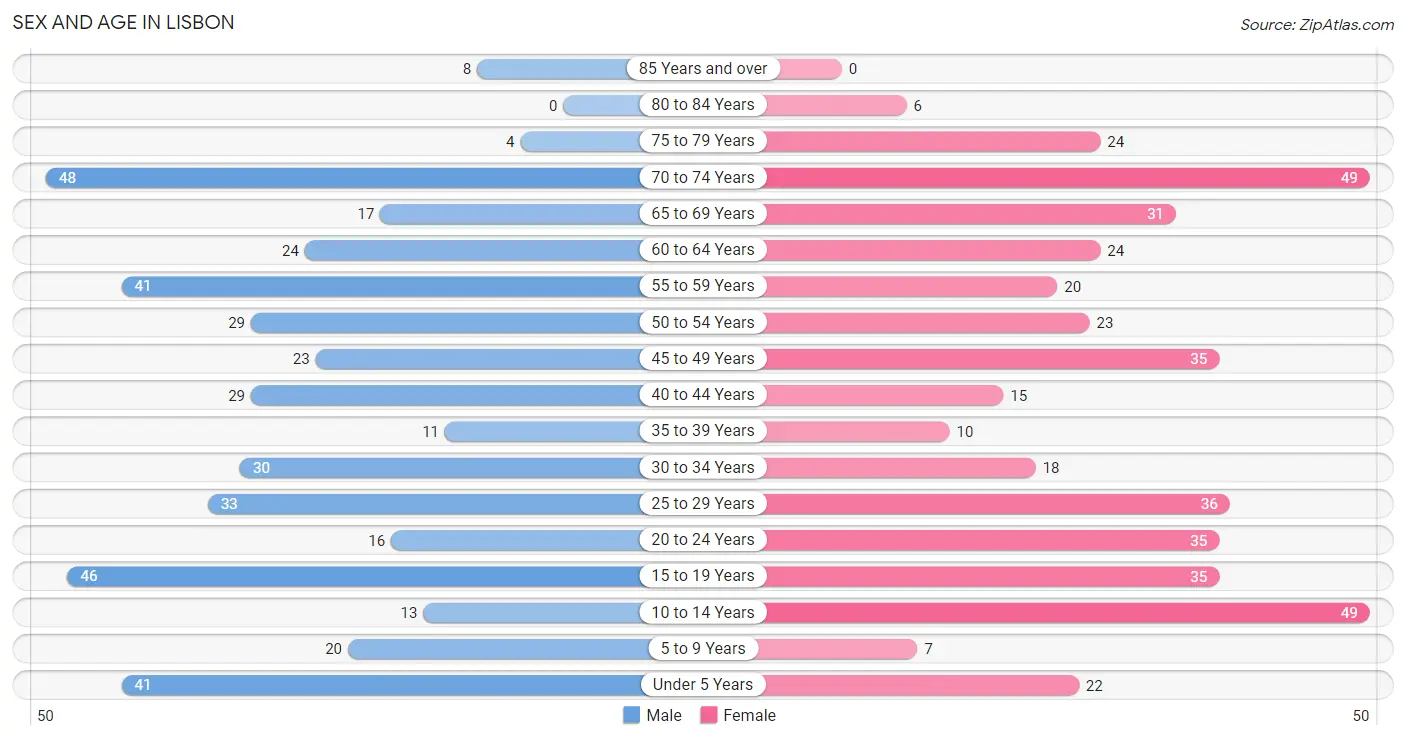
| Age Bracket | Male | Female |
| Under 5 Years | 41 (9.5%) | 22 (5.0%) |
| 5 to 9 Years | 20 (4.6%) | 7 (1.6%) |
| 10 to 14 Years | 13 (3.0%) | 49 (11.2%) |
| 15 to 19 Years | 46 (10.6%) | 35 (8.0%) |
| 20 to 24 Years | 16 (3.7%) | 35 (8.0%) |
| 25 to 29 Years | 33 (7.6%) | 36 (8.2%) |
| 30 to 34 Years | 30 (6.9%) | 18 (4.1%) |
| 35 to 39 Years | 11 (2.5%) | 10 (2.3%) |
| 40 to 44 Years | 29 (6.7%) | 15 (3.4%) |
| 45 to 49 Years | 23 (5.3%) | 35 (8.0%) |
| 50 to 54 Years | 29 (6.7%) | 23 (5.2%) |
| 55 to 59 Years | 41 (9.5%) | 20 (4.6%) |
| 60 to 64 Years | 24 (5.5%) | 24 (5.5%) |
| 65 to 69 Years | 17 (3.9%) | 31 (7.1%) |
| 70 to 74 Years | 48 (11.1%) | 49 (11.2%) |
| 75 to 79 Years | 4 (0.9%) | 24 (5.5%) |
| 80 to 84 Years | 0 (0.0%) | 6 (1.4%) |
| 85 Years and over | 8 (1.8%) | 0 (0.0%) |
| Total | 433 (100.0%) | 439 (100.0%) |
Families and Households in Lisbon
Median Family Size in Lisbon
The median family size in Lisbon is 3.15 persons per family, with single female/mother families (20 | 10.1%) accounting for the largest median family size of 4.15 persons per family. On the other hand, single male/father families (16 | 8.1%) represent the smallest median family size with 2.81 persons per family.
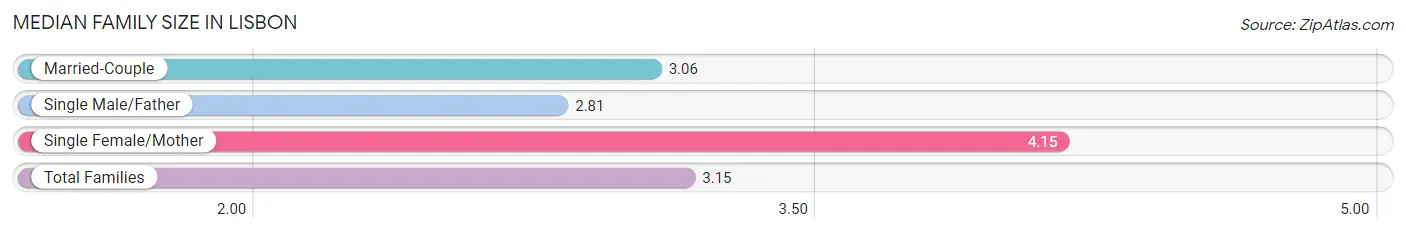
| Family Type | # Families | Family Size |
| Married-Couple | 162 (81.8%) | 3.06 |
| Single Male/Father | 16 (8.1%) | 2.81 |
| Single Female/Mother | 20 (10.1%) | 4.15 |
| Total Families | 198 (100.0%) | 3.15 |
Median Household Size in Lisbon
The median household size in Lisbon is 2.36 persons per household, with single female/mother households (20 | 5.4%) accounting for the largest median household size of 4.7 persons per household. non-family households (171 | 46.3%) represent the smallest median household size with 1.32 persons per household.
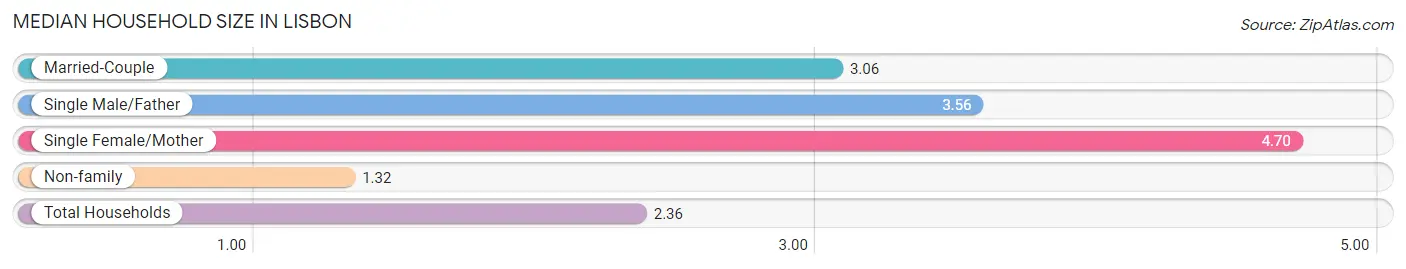
| Household Type | # Households | Household Size |
| Married-Couple | 162 (43.9%) | 3.06 |
| Single Male/Father | 16 (4.3%) | 3.56 |
| Single Female/Mother | 20 (5.4%) | 4.70 |
| Non-family | 171 (46.3%) | 1.32 |
| Total Households | 369 (100.0%) | 2.36 |
Household Size by Marriage Status in Lisbon
Out of a total of 369 households in Lisbon, 198 (53.7%) are family households, while 171 (46.3%) are nonfamily households. The most numerous type of family households are 2-person households, comprising 94, and the most common type of nonfamily households are 1-person households, comprising 137.
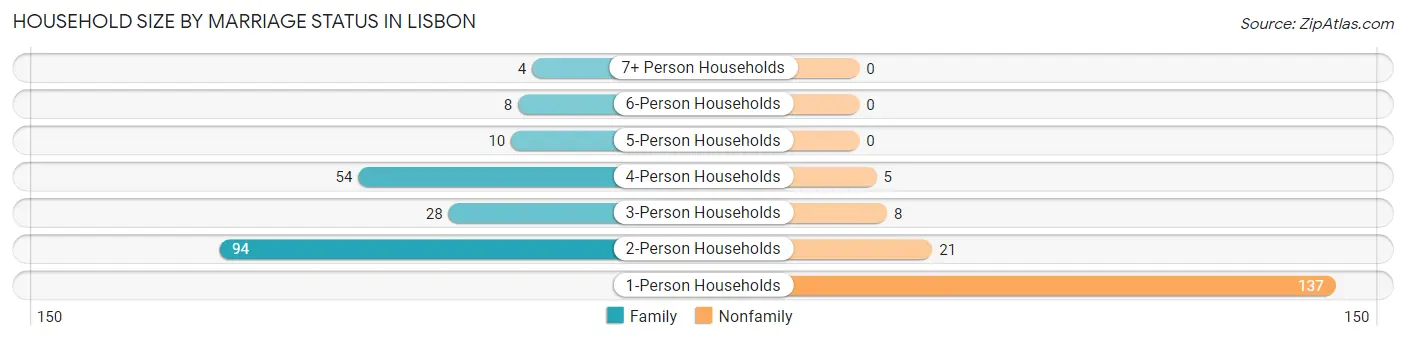
| Household Size | Family Households | Nonfamily Households |
| 1-Person Households | - | 137 (37.1%) |
| 2-Person Households | 94 (25.5%) | 21 (5.7%) |
| 3-Person Households | 28 (7.6%) | 8 (2.2%) |
| 4-Person Households | 54 (14.6%) | 5 (1.4%) |
| 5-Person Households | 10 (2.7%) | 0 (0.0%) |
| 6-Person Households | 8 (2.2%) | 0 (0.0%) |
| 7+ Person Households | 4 (1.1%) | 0 (0.0%) |
| Total | 198 (53.7%) | 171 (46.3%) |
Female Fertility in Lisbon
Fertility by Age in Lisbon
Average fertility rate in Lisbon is 37.0 births per 1,000 women. Women in the age bracket of 35 to 50 years have the highest fertility rate with 63.0 births per 1,000 women. Women in the age bracket of 35 to 50 years acount for 57.1% of all women with births.
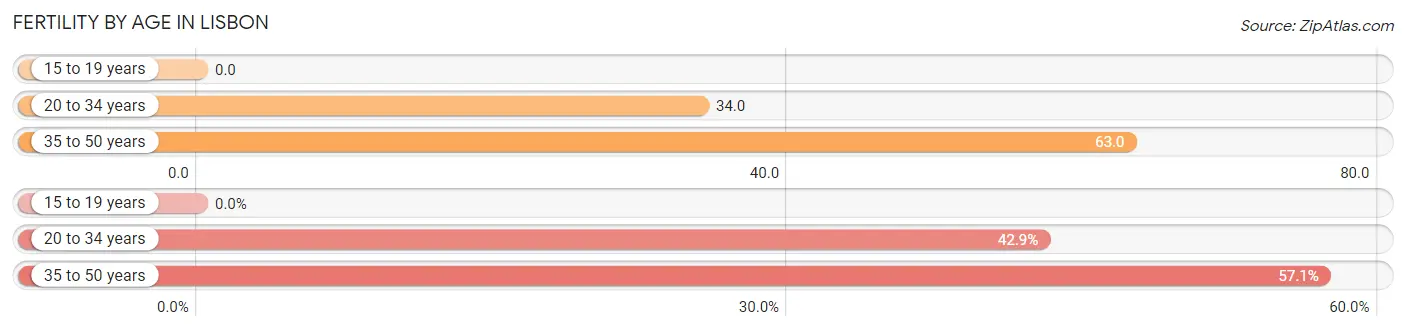
| Age Bracket | Women with Births | Births / 1,000 Women |
| 15 to 19 years | 0 (0.0%) | 0.0 |
| 20 to 34 years | 3 (42.9%) | 34.0 |
| 35 to 50 years | 4 (57.1%) | 63.0 |
| Total | 7 (100.0%) | 37.0 |
Fertility by Age by Marriage Status in Lisbon
42.9% of women with births (7) in Lisbon are married. The highest percentage of unmarried women with births falls into 35 to 50 years age bracket with 100.0% of them unmarried at the time of birth, while the lowest percentage of unmarried women with births belong to 20 to 34 years age bracket with 0.0% of them unmarried.
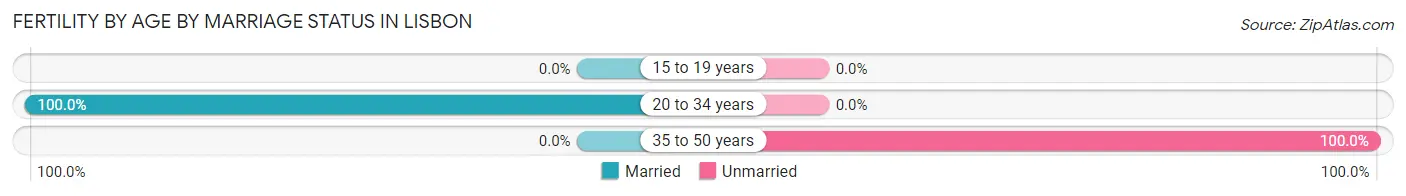
| Age Bracket | Married | Unmarried |
| 15 to 19 years | 0 (0.0%) | 0 (0.0%) |
| 20 to 34 years | 3 (100.0%) | 0 (0.0%) |
| 35 to 50 years | 0 (0.0%) | 4 (100.0%) |
| Total | 3 (42.9%) | 4 (57.1%) |
Fertility by Education in Lisbon
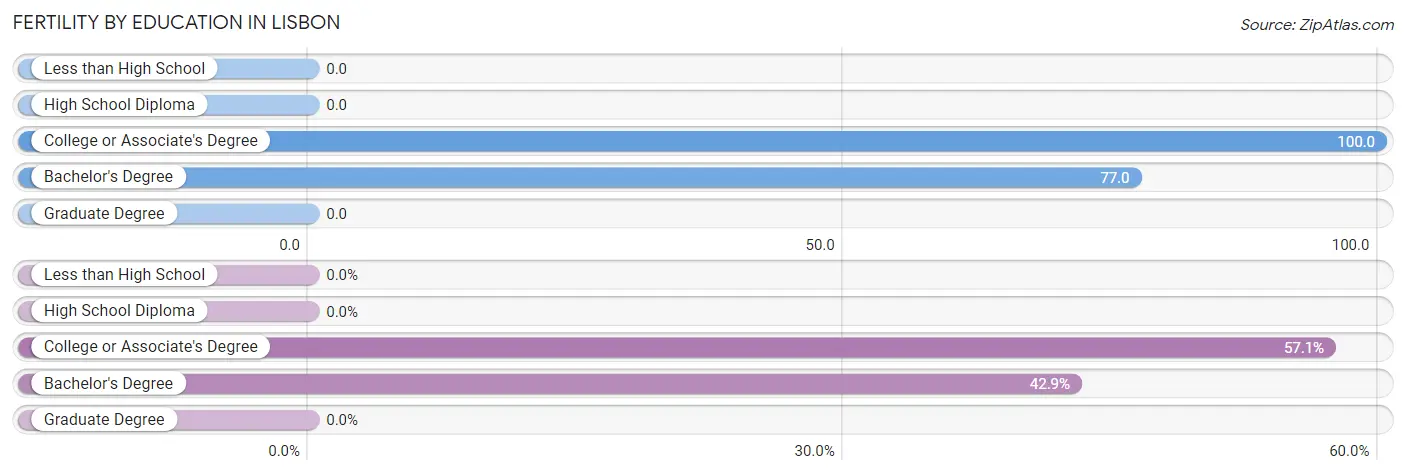
| Educational Attainment | Women with Births | Births / 1,000 Women |
| Less than High School | 0 (0.0%) | 0.0 |
| High School Diploma | 0 (0.0%) | 0.0 |
| College or Associate's Degree | 4 (57.1%) | 100.0 |
| Bachelor's Degree | 3 (42.9%) | 77.0 |
| Graduate Degree | 0 (0.0%) | 0.0 |
| Total | 7 (100.0%) | 37.0 |
Fertility by Education by Marriage Status in Lisbon
57.1% of women with births in Lisbon are unmarried. Women with the educational attainment of bachelor's degree are most likely to be married with 100.0% of them married at childbirth, while women with the educational attainment of college or associate's degree are least likely to be married with 100.0% of them unmarried at childbirth.
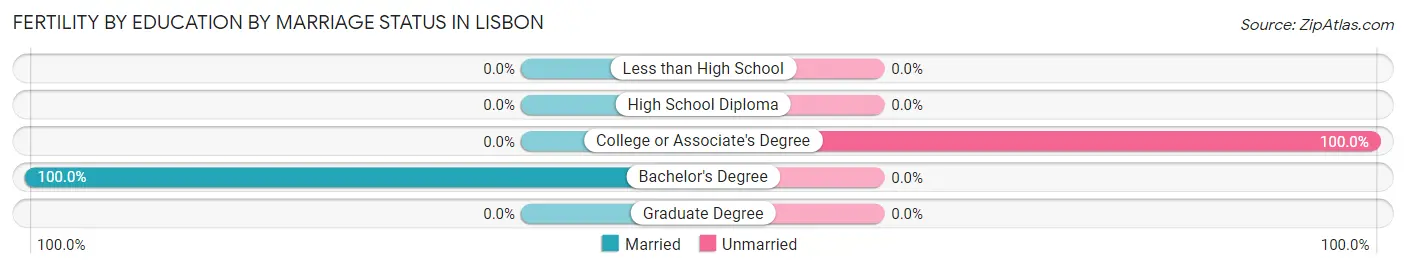
| Educational Attainment | Married | Unmarried |
| Less than High School | 0 (0.0%) | 0 (0.0%) |
| High School Diploma | 0 (0.0%) | 0 (0.0%) |
| College or Associate's Degree | 0 (0.0%) | 4 (100.0%) |
| Bachelor's Degree | 3 (100.0%) | 0 (0.0%) |
| Graduate Degree | 0 (0.0%) | 0 (0.0%) |
| Total | 3 (42.9%) | 4 (57.1%) |
Employment Characteristics in Lisbon
Employment by Class of Employer in Lisbon
Among the 410 employed individuals in Lisbon, private company employees (291 | 71.0%), self-employed (not incorporated) (28 | 6.8%), and local government employees (25 | 6.1%) make up the most common classes of employment.
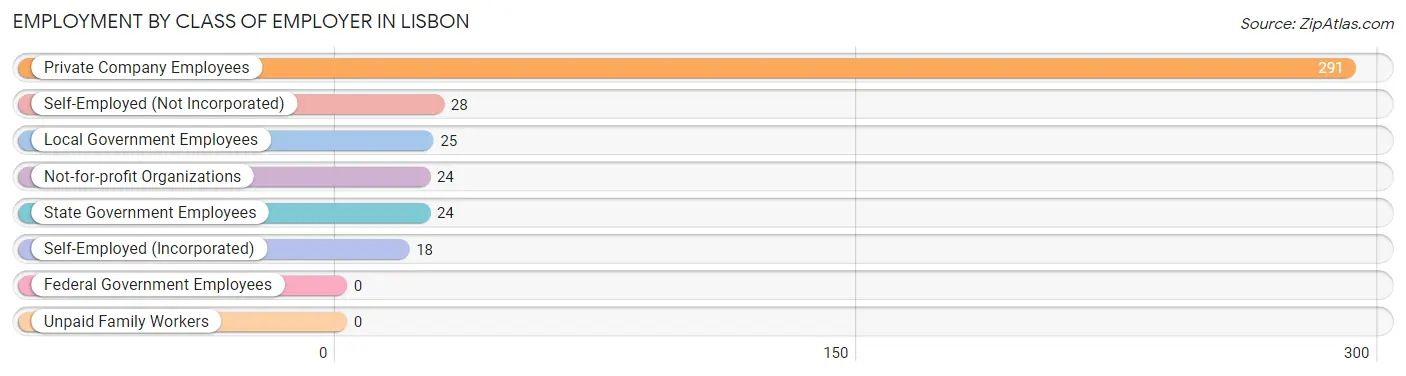
| Employer Class | # Employees | % Employees |
| Private Company Employees | 291 | 71.0% |
| Self-Employed (Incorporated) | 18 | 4.4% |
| Self-Employed (Not Incorporated) | 28 | 6.8% |
| Not-for-profit Organizations | 24 | 5.9% |
| Local Government Employees | 25 | 6.1% |
| State Government Employees | 24 | 5.9% |
| Federal Government Employees | 0 | 0.0% |
| Unpaid Family Workers | 0 | 0.0% |
| Total | 410 | 100.0% |
Employment Status by Age in Lisbon
According to the labor force statistics for Lisbon, out of the total population over 16 years of age (699), 63.8% or 446 individuals are in the labor force, with 8.1% or 36 of them unemployed. The age group with the highest labor force participation rate is 25 to 29 years, with 100.0% or 69 individuals in the labor force. Within the labor force, the 55 to 59 years age range has the highest percentage of unemployed individuals, with 23.1% or 9 of them being unemployed.
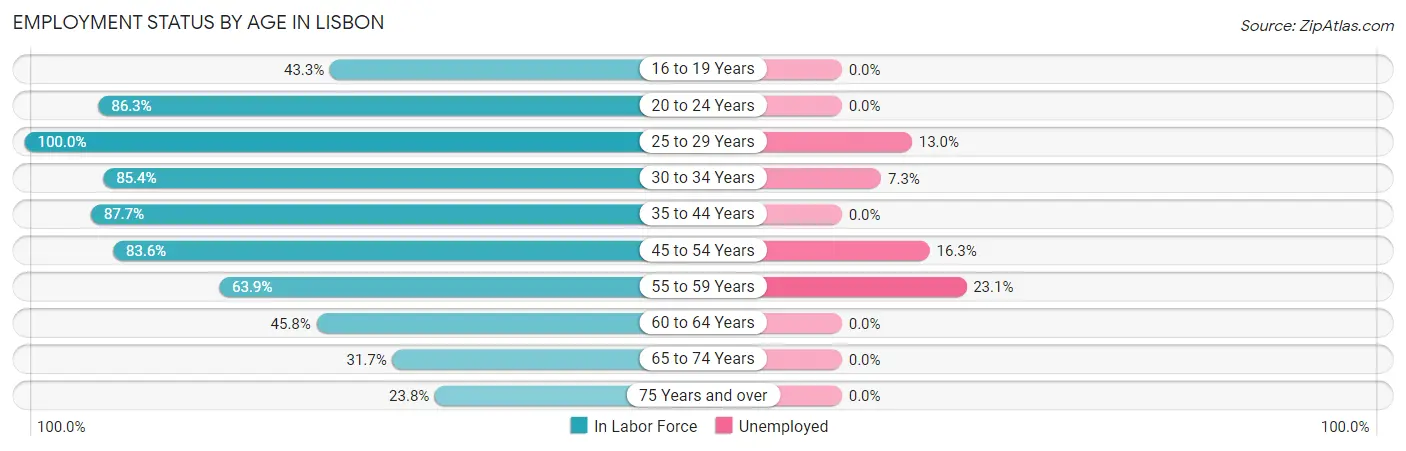
| Age Bracket | In Labor Force | Unemployed |
| 16 to 19 Years | 26 (43.3%) | 0 (0.0%) |
| 20 to 24 Years | 44 (86.3%) | 0 (0.0%) |
| 25 to 29 Years | 69 (100.0%) | 9 (13.0%) |
| 30 to 34 Years | 41 (85.4%) | 3 (7.3%) |
| 35 to 44 Years | 57 (87.7%) | 0 (0.0%) |
| 45 to 54 Years | 92 (83.6%) | 15 (16.3%) |
| 55 to 59 Years | 39 (63.9%) | 9 (23.1%) |
| 60 to 64 Years | 22 (45.8%) | 0 (0.0%) |
| 65 to 74 Years | 46 (31.7%) | 0 (0.0%) |
| 75 Years and over | 10 (23.8%) | 0 (0.0%) |
| Total | 446 (63.8%) | 36 (8.1%) |
Employment Status by Educational Attainment in Lisbon
According to labor force statistics for Lisbon, 79.8% of individuals (320) out of the total population between 25 and 64 years of age (401) are in the labor force, with 11.3% or 36 of them being unemployed. The group with the highest labor force participation rate are those with the educational attainment of bachelor's degree or higher, with 88.5% or 77 individuals in the labor force. Within the labor force, individuals with less than high school education have the highest percentage of unemployment, with 28.6% or 4 of them being unemployed.
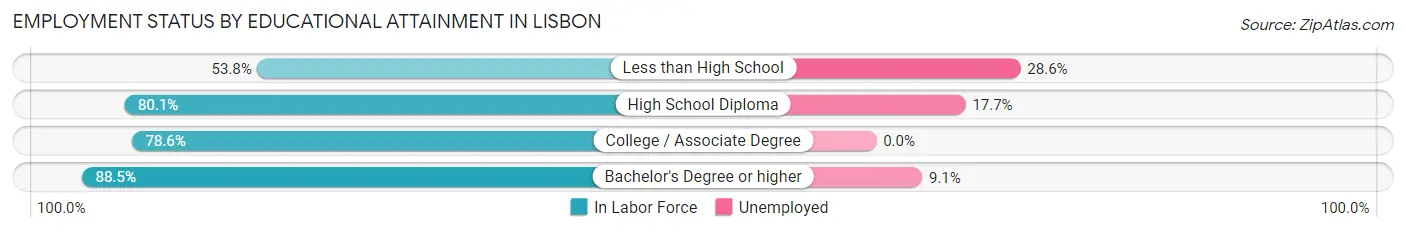
| Educational Attainment | In Labor Force | Unemployed |
| Less than High School | 14 (53.8%) | 7 (28.6%) |
| High School Diploma | 141 (80.1%) | 31 (17.7%) |
| College / Associate Degree | 88 (78.6%) | 0 (0.0%) |
| Bachelor's Degree or higher | 77 (88.5%) | 8 (9.1%) |
| Total | 320 (79.8%) | 45 (11.3%) |
Employment Occupations by Sex in Lisbon
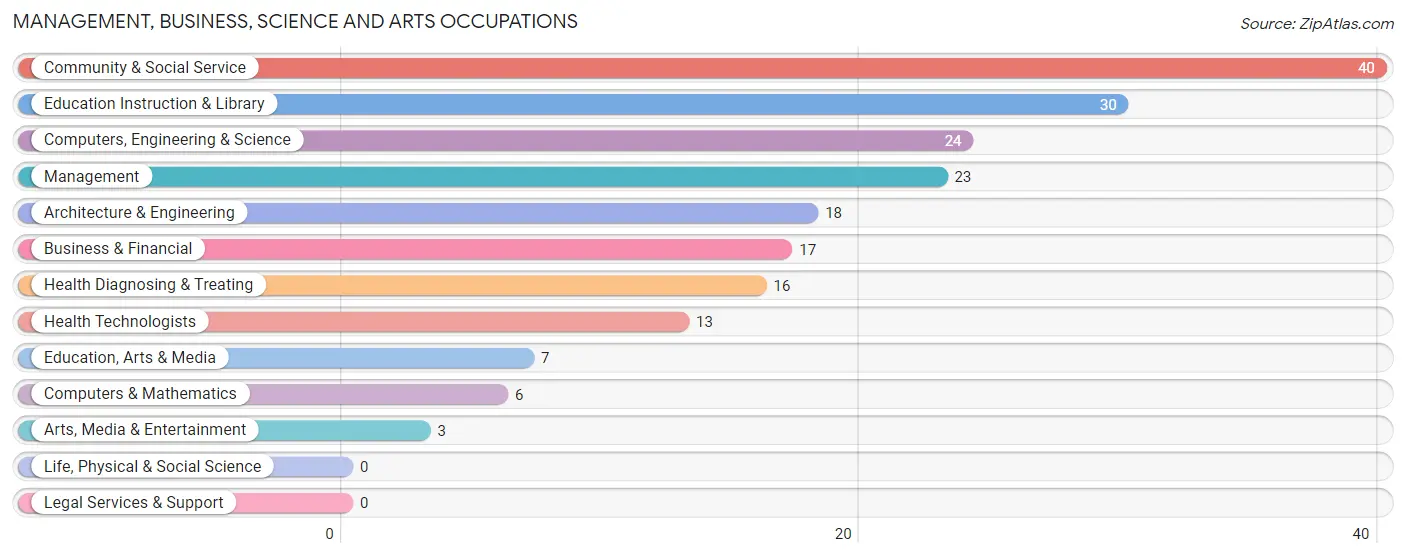
Management, Business, Science and Arts Occupations
The most common Management, Business, Science and Arts occupations in Lisbon are Community & Social Service (40 | 9.8%), Education Instruction & Library (30 | 7.3%), Computers, Engineering & Science (24 | 5.9%), Management (23 | 5.6%), and Architecture & Engineering (18 | 4.4%).
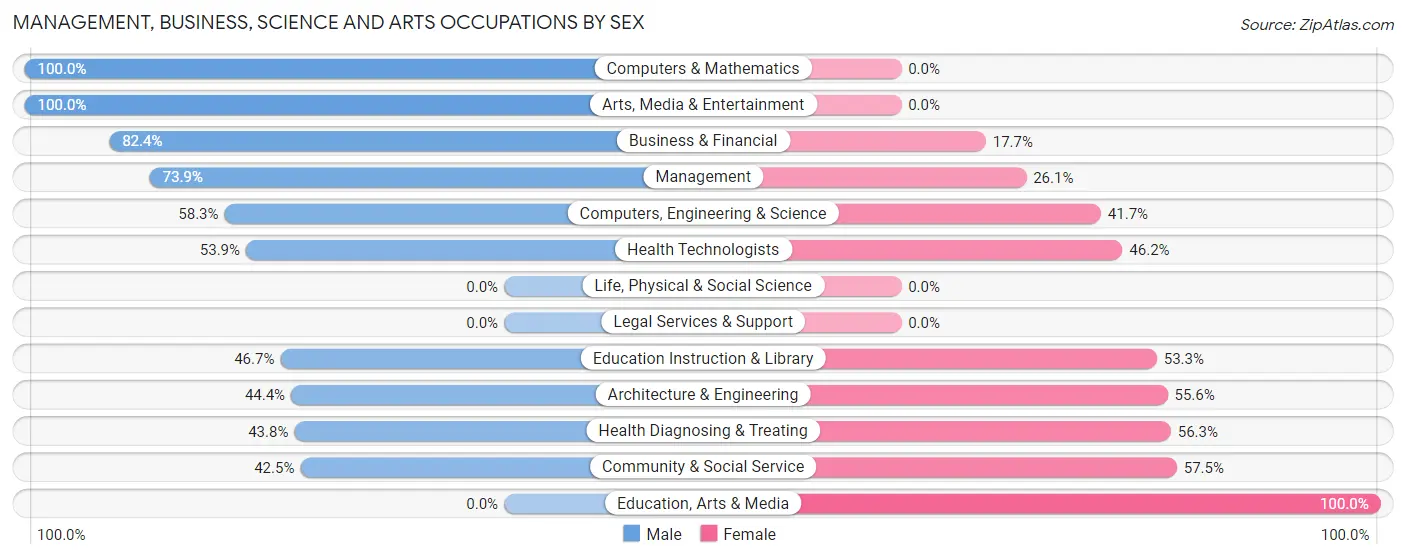
Management, Business, Science and Arts Occupations by Sex
Within the Management, Business, Science and Arts occupations in Lisbon, the most male-oriented occupations are Computers & Mathematics (100.0%), Arts, Media & Entertainment (100.0%), and Business & Financial (82.4%), while the most female-oriented occupations are Education, Arts & Media (100.0%), Community & Social Service (57.5%), and Health Diagnosing & Treating (56.2%).
| Occupation | Male | Female |
| Management | 17 (73.9%) | 6 (26.1%) |
| Business & Financial | 14 (82.4%) | 3 (17.6%) |
| Computers, Engineering & Science | 14 (58.3%) | 10 (41.7%) |
| Computers & Mathematics | 6 (100.0%) | 0 (0.0%) |
| Architecture & Engineering | 8 (44.4%) | 10 (55.6%) |
| Life, Physical & Social Science | 0 (0.0%) | 0 (0.0%) |
| Community & Social Service | 17 (42.5%) | 23 (57.5%) |
| Education, Arts & Media | 0 (0.0%) | 7 (100.0%) |
| Legal Services & Support | 0 (0.0%) | 0 (0.0%) |
| Education Instruction & Library | 14 (46.7%) | 16 (53.3%) |
| Arts, Media & Entertainment | 3 (100.0%) | 0 (0.0%) |
| Health Diagnosing & Treating | 7 (43.8%) | 9 (56.2%) |
| Health Technologists | 7 (53.8%) | 6 (46.2%) |
| Total (Category) | 69 (57.5%) | 51 (42.5%) |
| Total (Overall) | 195 (47.6%) | 215 (52.4%) |
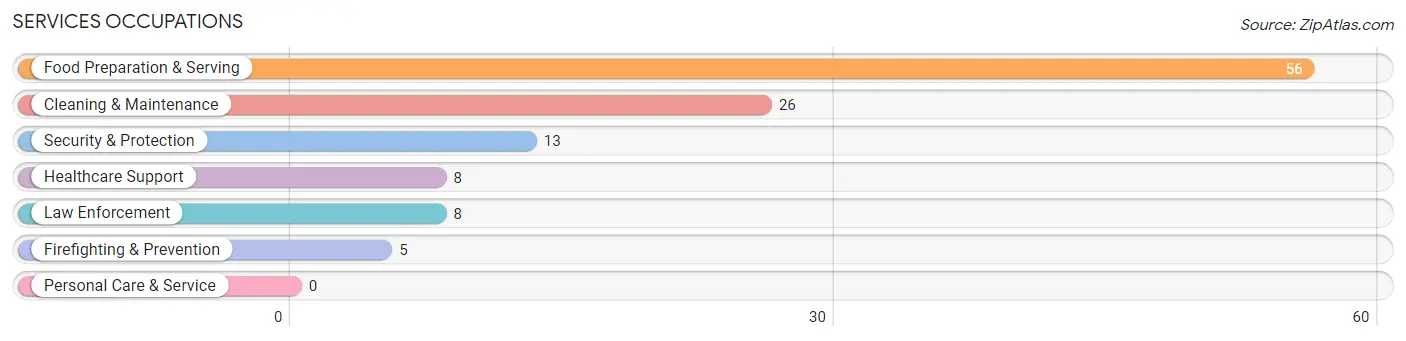
Services Occupations
The most common Services occupations in Lisbon are Food Preparation & Serving (56 | 13.7%), Cleaning & Maintenance (26 | 6.3%), Security & Protection (13 | 3.2%), Healthcare Support (8 | 1.9%), and Law Enforcement (8 | 1.9%).
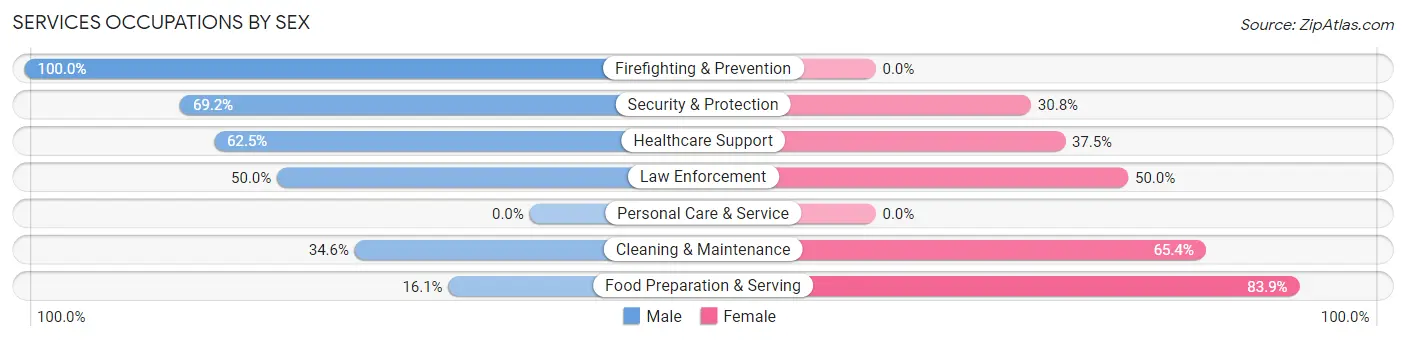
Services Occupations by Sex
Within the Services occupations in Lisbon, the most male-oriented occupations are Firefighting & Prevention (100.0%), Security & Protection (69.2%), and Healthcare Support (62.5%), while the most female-oriented occupations are Food Preparation & Serving (83.9%), Cleaning & Maintenance (65.4%), and Law Enforcement (50.0%).
| Occupation | Male | Female |
| Healthcare Support | 5 (62.5%) | 3 (37.5%) |
| Security & Protection | 9 (69.2%) | 4 (30.8%) |
| Firefighting & Prevention | 5 (100.0%) | 0 (0.0%) |
| Law Enforcement | 4 (50.0%) | 4 (50.0%) |
| Food Preparation & Serving | 9 (16.1%) | 47 (83.9%) |
| Cleaning & Maintenance | 9 (34.6%) | 17 (65.4%) |
| Personal Care & Service | 0 (0.0%) | 0 (0.0%) |
| Total (Category) | 32 (31.1%) | 71 (68.9%) |
| Total (Overall) | 195 (47.6%) | 215 (52.4%) |
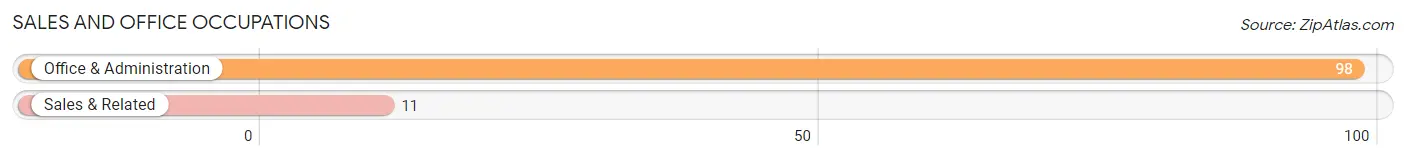
Sales and Office Occupations
The most common Sales and Office occupations in Lisbon are Office & Administration (98 | 23.9%), and Sales & Related (11 | 2.7%).
Sales and Office Occupations by Sex
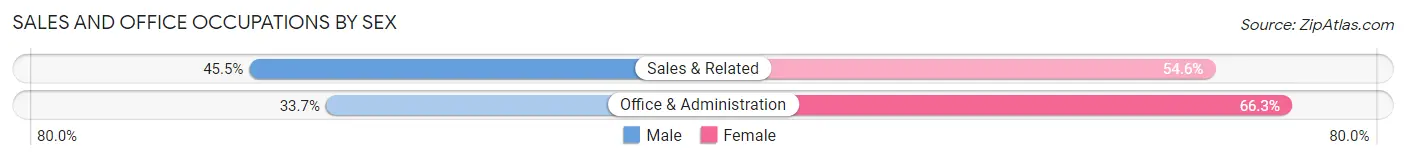
| Occupation | Male | Female |
| Sales & Related | 5 (45.5%) | 6 (54.5%) |
| Office & Administration | 33 (33.7%) | 65 (66.3%) |
| Total (Category) | 38 (34.9%) | 71 (65.1%) |
| Total (Overall) | 195 (47.6%) | 215 (52.4%) |
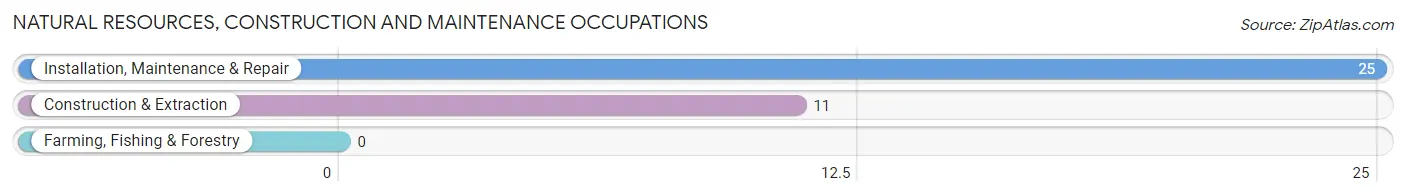
Natural Resources, Construction and Maintenance Occupations
The most common Natural Resources, Construction and Maintenance occupations in Lisbon are Installation, Maintenance & Repair (25 | 6.1%), and Construction & Extraction (11 | 2.7%).
Natural Resources, Construction and Maintenance Occupations by Sex
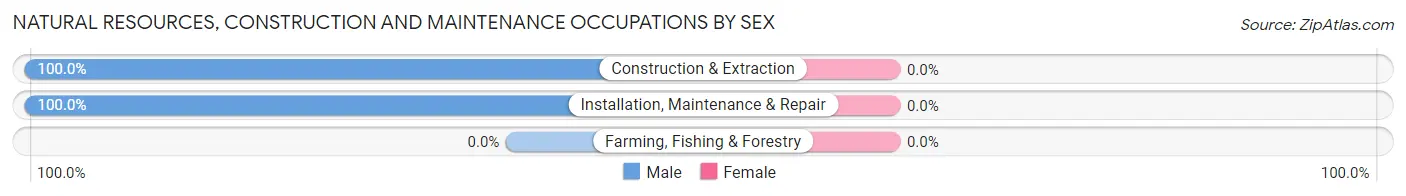
| Occupation | Male | Female |
| Farming, Fishing & Forestry | 0 (0.0%) | 0 (0.0%) |
| Construction & Extraction | 11 (100.0%) | 0 (0.0%) |
| Installation, Maintenance & Repair | 25 (100.0%) | 0 (0.0%) |
| Total (Category) | 36 (100.0%) | 0 (0.0%) |
| Total (Overall) | 195 (47.6%) | 215 (52.4%) |
Production, Transportation and Moving Occupations
The most common Production, Transportation and Moving occupations in Lisbon are , and Production (42 | 10.2%).
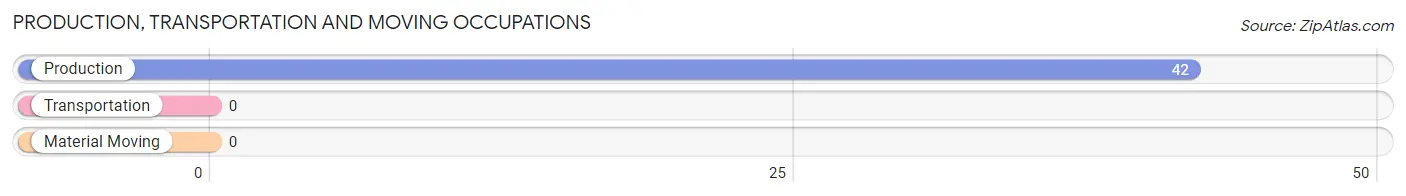
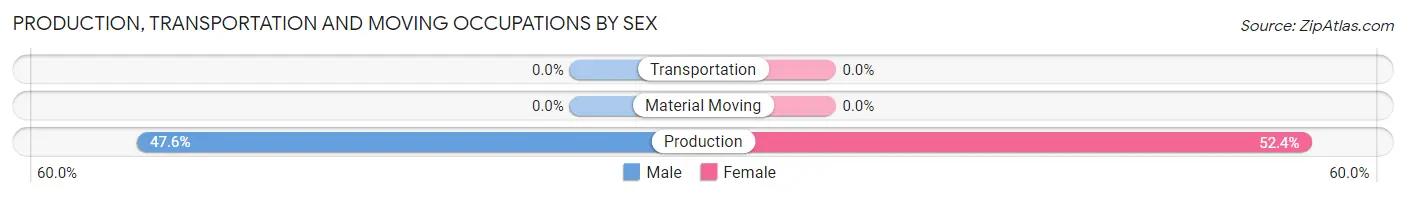
Production, Transportation and Moving Occupations by Sex
| Occupation | Male | Female |
| Production | 20 (47.6%) | 22 (52.4%) |
| Transportation | 0 (0.0%) | 0 (0.0%) |
| Material Moving | 0 (0.0%) | 0 (0.0%) |
| Total (Category) | 20 (47.6%) | 22 (52.4%) |
| Total (Overall) | 195 (47.6%) | 215 (52.4%) |
Employment Industries by Sex in Lisbon
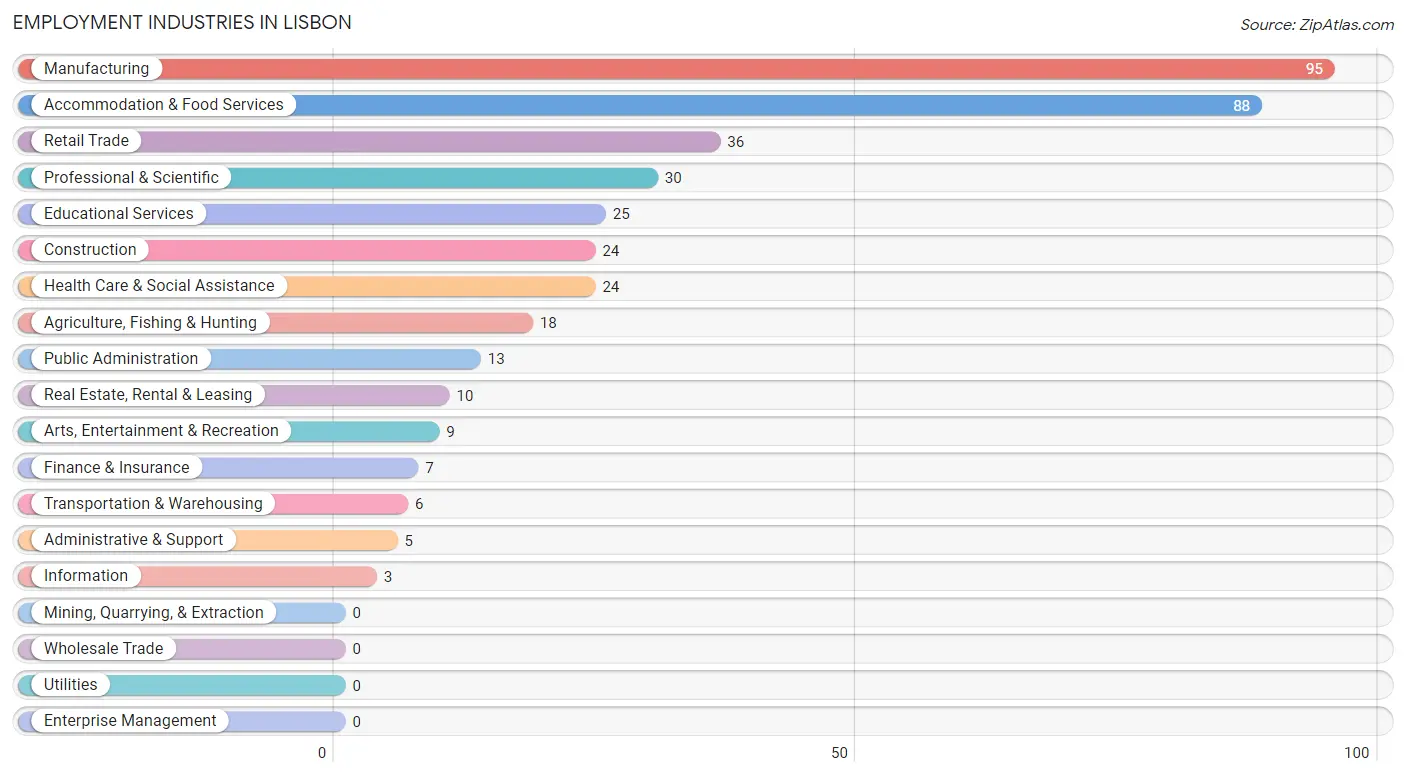
Employment Industries in Lisbon
The major employment industries in Lisbon include Manufacturing (95 | 23.2%), Accommodation & Food Services (88 | 21.5%), Retail Trade (36 | 8.8%), Professional & Scientific (30 | 7.3%), and Educational Services (25 | 6.1%).
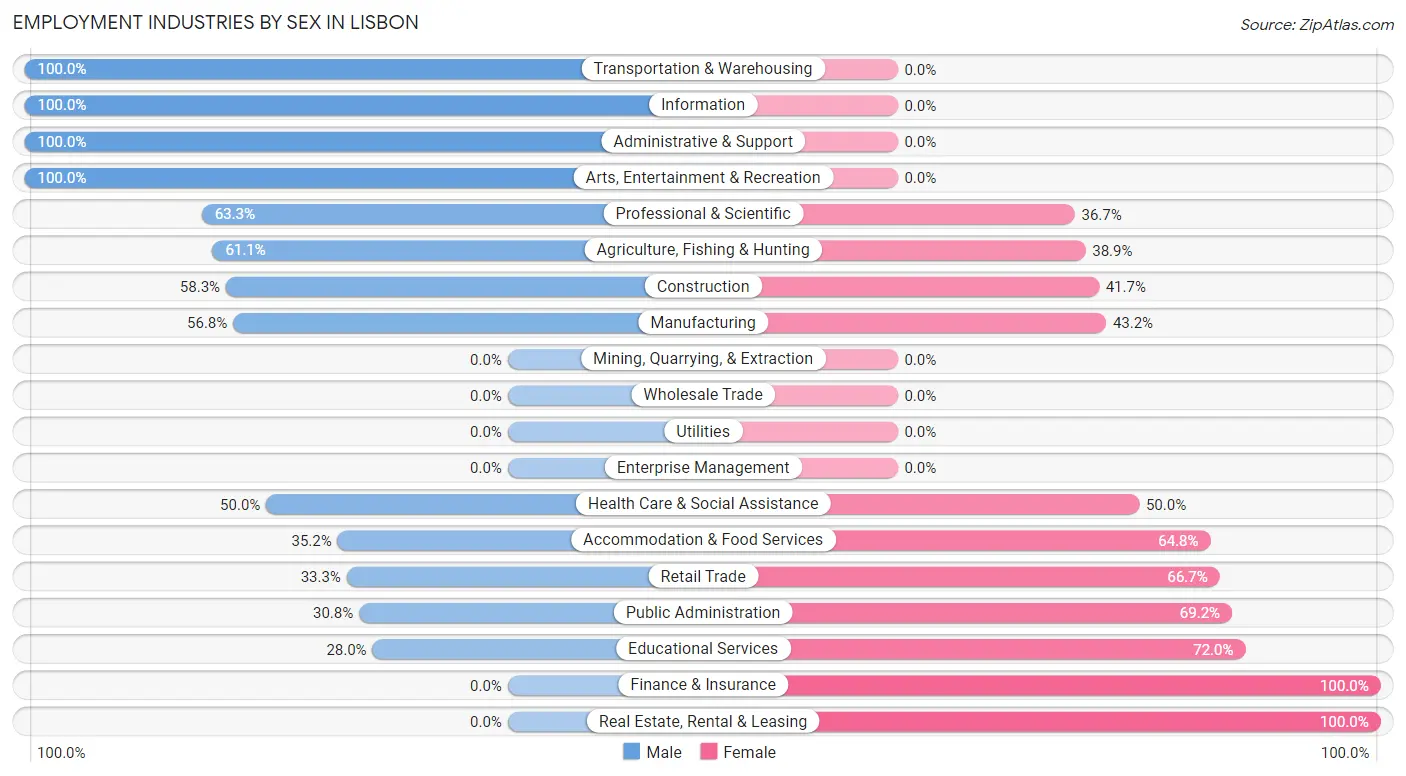
Employment Industries by Sex in Lisbon
The Lisbon industries that see more men than women are Transportation & Warehousing (100.0%), Information (100.0%), and Administrative & Support (100.0%), whereas the industries that tend to have a higher number of women are Finance & Insurance (100.0%), Real Estate, Rental & Leasing (100.0%), and Educational Services (72.0%).
| Industry | Male | Female |
| Agriculture, Fishing & Hunting | 11 (61.1%) | 7 (38.9%) |
| Mining, Quarrying, & Extraction | 0 (0.0%) | 0 (0.0%) |
| Construction | 14 (58.3%) | 10 (41.7%) |
| Manufacturing | 54 (56.8%) | 41 (43.2%) |
| Wholesale Trade | 0 (0.0%) | 0 (0.0%) |
| Retail Trade | 12 (33.3%) | 24 (66.7%) |
| Transportation & Warehousing | 6 (100.0%) | 0 (0.0%) |
| Utilities | 0 (0.0%) | 0 (0.0%) |
| Information | 3 (100.0%) | 0 (0.0%) |
| Finance & Insurance | 0 (0.0%) | 7 (100.0%) |
| Real Estate, Rental & Leasing | 0 (0.0%) | 10 (100.0%) |
| Professional & Scientific | 19 (63.3%) | 11 (36.7%) |
| Enterprise Management | 0 (0.0%) | 0 (0.0%) |
| Administrative & Support | 5 (100.0%) | 0 (0.0%) |
| Educational Services | 7 (28.0%) | 18 (72.0%) |
| Health Care & Social Assistance | 12 (50.0%) | 12 (50.0%) |
| Arts, Entertainment & Recreation | 9 (100.0%) | 0 (0.0%) |
| Accommodation & Food Services | 31 (35.2%) | 57 (64.8%) |
| Public Administration | 4 (30.8%) | 9 (69.2%) |
| Total | 195 (47.6%) | 215 (52.4%) |
Education in Lisbon
School Enrollment in Lisbon
The most common levels of schooling among the 198 students in Lisbon are high school (75 | 37.9%), middle school (57 | 28.8%), and elementary school (28 | 14.1%).
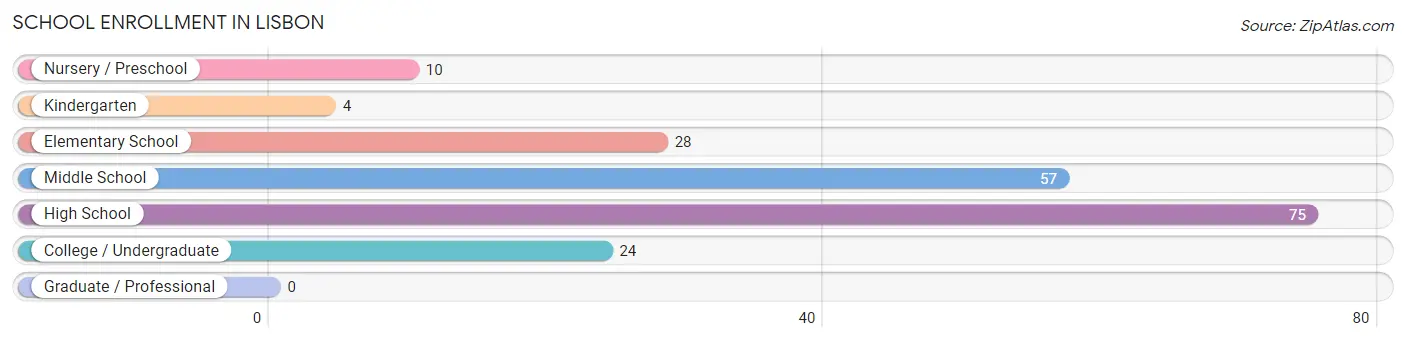
| School Level | # Students | % Students |
| Nursery / Preschool | 10 | 5.1% |
| Kindergarten | 4 | 2.0% |
| Elementary School | 28 | 14.1% |
| Middle School | 57 | 28.8% |
| High School | 75 | 37.9% |
| College / Undergraduate | 24 | 12.1% |
| Graduate / Professional | 0 | 0.0% |
| Total | 198 | 100.0% |
School Enrollment by Age by Funding Source in Lisbon
Out of a total of 198 students who are enrolled in schools in Lisbon, 13 (6.6%) attend a private institution, while the remaining 185 (93.4%) are enrolled in public schools. The age group of 15 to 17 year olds has the highest likelihood of being enrolled in private schools, with 9 (15.5% in the age bracket) enrolled. Conversely, the age group of 3 to 4 year olds has the lowest likelihood of being enrolled in a private school, with 10 (100.0% in the age bracket) attending a public institution.
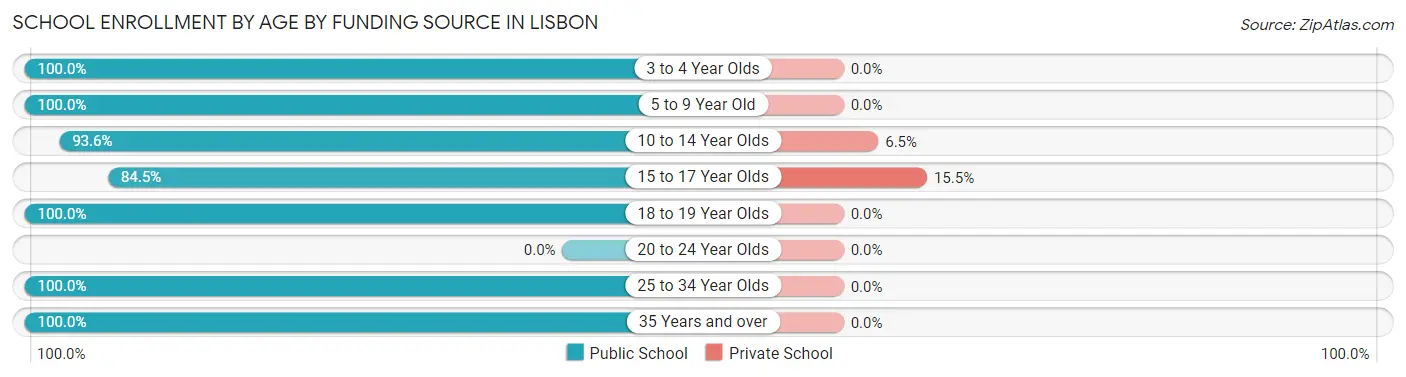
| Age Bracket | Public School | Private School |
| 3 to 4 Year Olds | 10 (100.0%) | 0 (0.0%) |
| 5 to 9 Year Old | 27 (100.0%) | 0 (0.0%) |
| 10 to 14 Year Olds | 58 (93.5%) | 4 (6.5%) |
| 15 to 17 Year Olds | 49 (84.5%) | 9 (15.5%) |
| 18 to 19 Year Olds | 17 (100.0%) | 0 (0.0%) |
| 20 to 24 Year Olds | 0 (0.0%) | 0 (0.0%) |
| 25 to 34 Year Olds | 4 (100.0%) | 0 (0.0%) |
| 35 Years and over | 20 (100.0%) | 0 (0.0%) |
| Total | 185 (93.4%) | 13 (6.6%) |
Educational Attainment by Field of Study in Lisbon
Arts & humanities (34 | 23.3%), business (27 | 18.5%), education (24 | 16.4%), literature & languages (12 | 8.2%), and social sciences (9 | 6.2%) are the most common fields of study among 146 individuals in Lisbon who have obtained a bachelor's degree or higher.
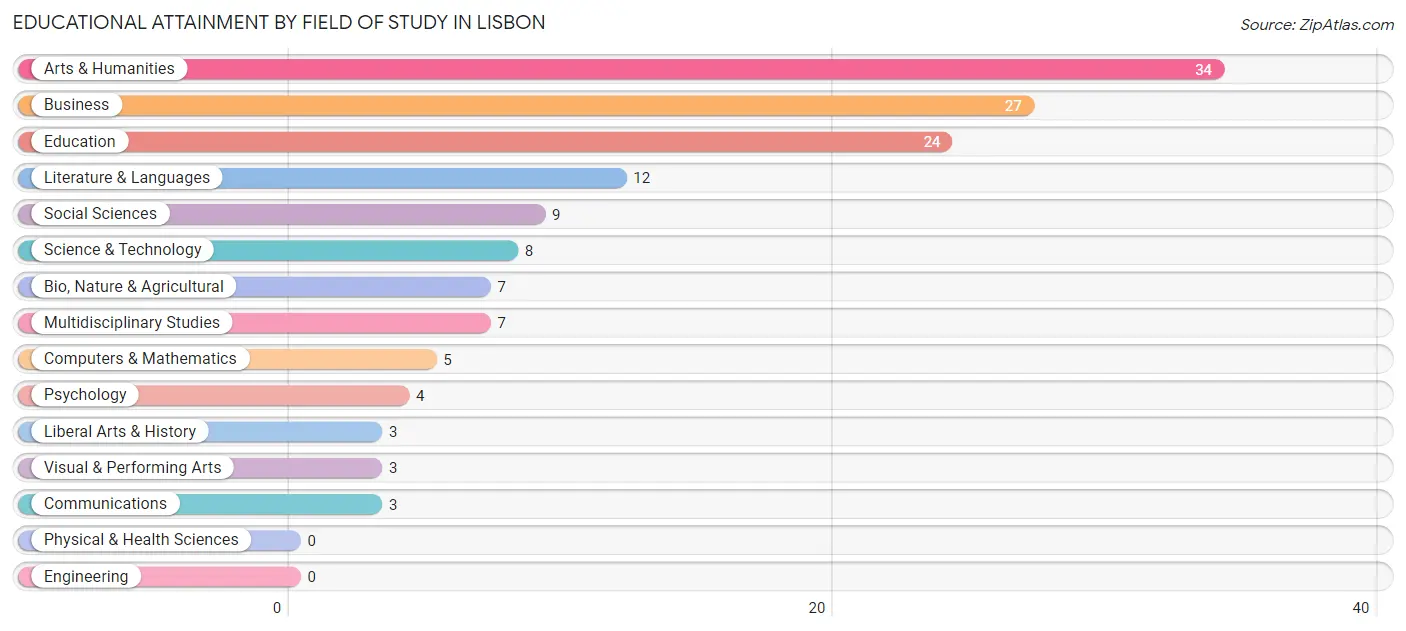
| Field of Study | # Graduates | % Graduates |
| Computers & Mathematics | 5 | 3.4% |
| Bio, Nature & Agricultural | 7 | 4.8% |
| Physical & Health Sciences | 0 | 0.0% |
| Psychology | 4 | 2.7% |
| Social Sciences | 9 | 6.2% |
| Engineering | 0 | 0.0% |
| Multidisciplinary Studies | 7 | 4.8% |
| Science & Technology | 8 | 5.5% |
| Business | 27 | 18.5% |
| Education | 24 | 16.4% |
| Literature & Languages | 12 | 8.2% |
| Liberal Arts & History | 3 | 2.1% |
| Visual & Performing Arts | 3 | 2.1% |
| Communications | 3 | 2.1% |
| Arts & Humanities | 34 | 23.3% |
| Total | 146 | 100.0% |
Transportation & Commute in Lisbon
Vehicle Availability by Sex in Lisbon
The most prevalent vehicle ownership categories in Lisbon are males with 2 vehicles (74, accounting for 38.0%) and females with 2 vehicles (90, making up 34.4%).
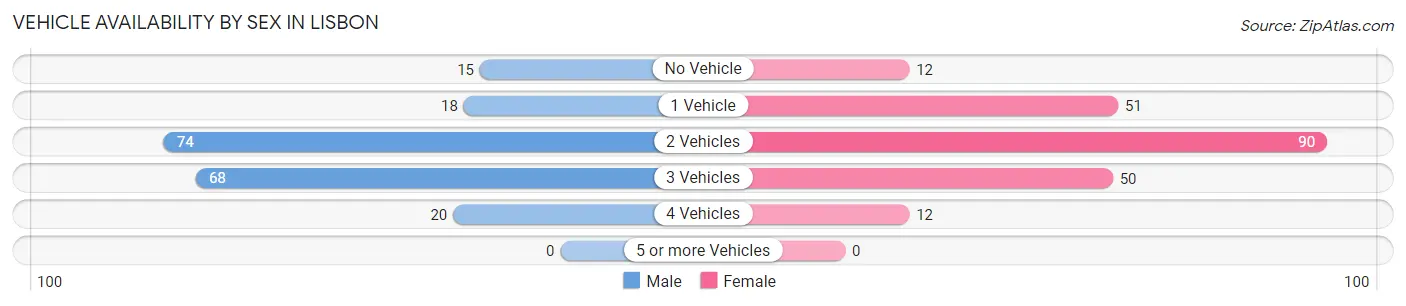
| Vehicles Available | Male | Female |
| No Vehicle | 15 (7.7%) | 12 (5.6%) |
| 1 Vehicle | 18 (9.2%) | 51 (23.7%) |
| 2 Vehicles | 74 (38.0%) | 90 (41.9%) |
| 3 Vehicles | 68 (34.9%) | 50 (23.3%) |
| 4 Vehicles | 20 (10.3%) | 12 (5.6%) |
| 5 or more Vehicles | 0 (0.0%) | 0 (0.0%) |
| Total | 195 (100.0%) | 215 (100.0%) |
Commute Time in Lisbon
The most frequently occuring commute durations in Lisbon are 15 to 19 minutes (110 commuters, 30.0%), 5 to 9 minutes (60 commuters, 16.4%), and 20 to 24 minutes (44 commuters, 12.0%).
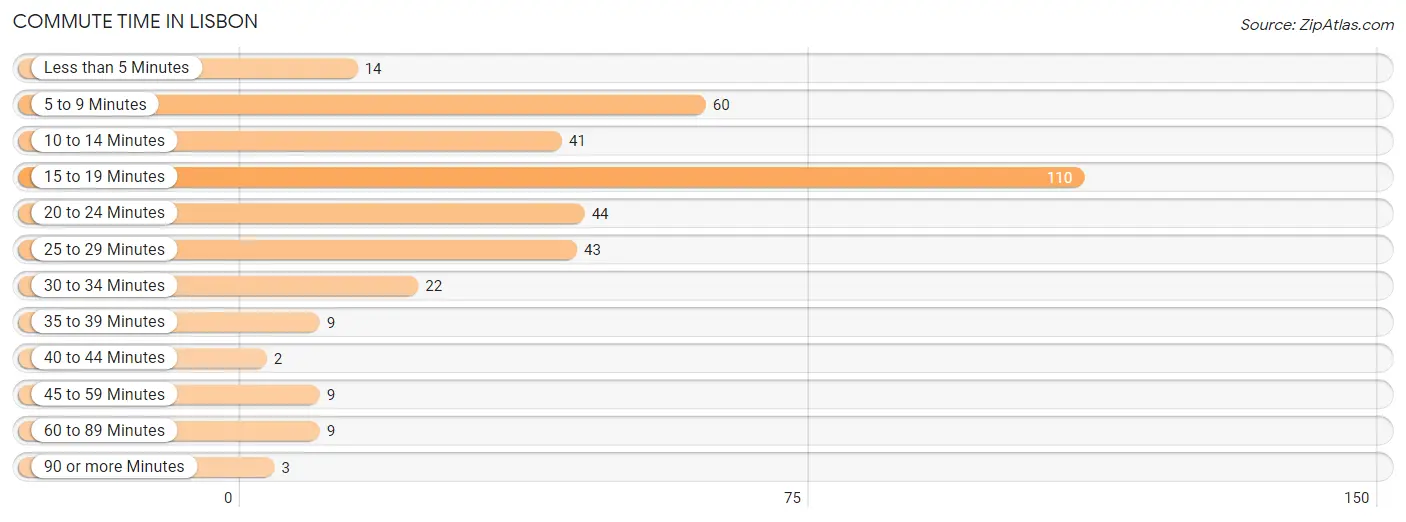
| Commute Time | # Commuters | % Commuters |
| Less than 5 Minutes | 14 | 3.8% |
| 5 to 9 Minutes | 60 | 16.4% |
| 10 to 14 Minutes | 41 | 11.2% |
| 15 to 19 Minutes | 110 | 30.0% |
| 20 to 24 Minutes | 44 | 12.0% |
| 25 to 29 Minutes | 43 | 11.7% |
| 30 to 34 Minutes | 22 | 6.0% |
| 35 to 39 Minutes | 9 | 2.5% |
| 40 to 44 Minutes | 2 | 0.5% |
| 45 to 59 Minutes | 9 | 2.5% |
| 60 to 89 Minutes | 9 | 2.5% |
| 90 or more Minutes | 3 | 0.8% |
Commute Time by Sex in Lisbon
The most common commute times in Lisbon are 5 to 9 minutes (37 commuters, 23.3%) for males and 15 to 19 minutes (74 commuters, 35.7%) for females.
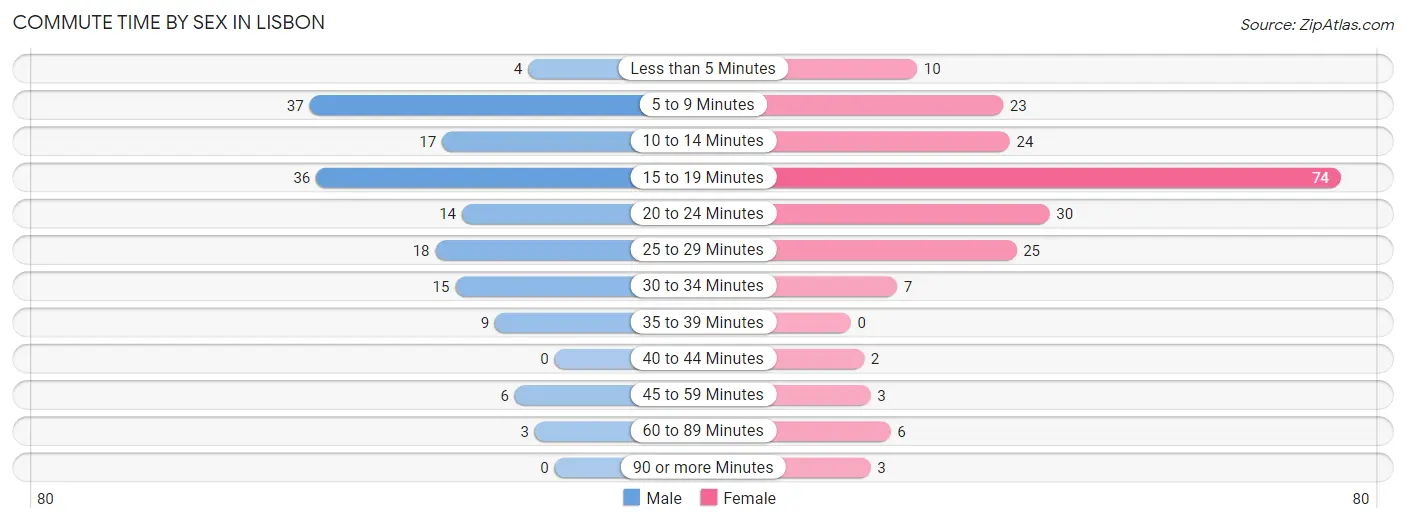
| Commute Time | Male | Female |
| Less than 5 Minutes | 4 (2.5%) | 10 (4.8%) |
| 5 to 9 Minutes | 37 (23.3%) | 23 (11.1%) |
| 10 to 14 Minutes | 17 (10.7%) | 24 (11.6%) |
| 15 to 19 Minutes | 36 (22.6%) | 74 (35.7%) |
| 20 to 24 Minutes | 14 (8.8%) | 30 (14.5%) |
| 25 to 29 Minutes | 18 (11.3%) | 25 (12.1%) |
| 30 to 34 Minutes | 15 (9.4%) | 7 (3.4%) |
| 35 to 39 Minutes | 9 (5.7%) | 0 (0.0%) |
| 40 to 44 Minutes | 0 (0.0%) | 2 (1.0%) |
| 45 to 59 Minutes | 6 (3.8%) | 3 (1.5%) |
| 60 to 89 Minutes | 3 (1.9%) | 6 (2.9%) |
| 90 or more Minutes | 0 (0.0%) | 3 (1.5%) |
Time of Departure to Work by Sex in Lisbon
The most frequent times of departure to work in Lisbon are 7:00 AM to 7:29 AM (30, 18.9%) for males and 6:30 AM to 6:59 AM (32, 15.5%) for females.
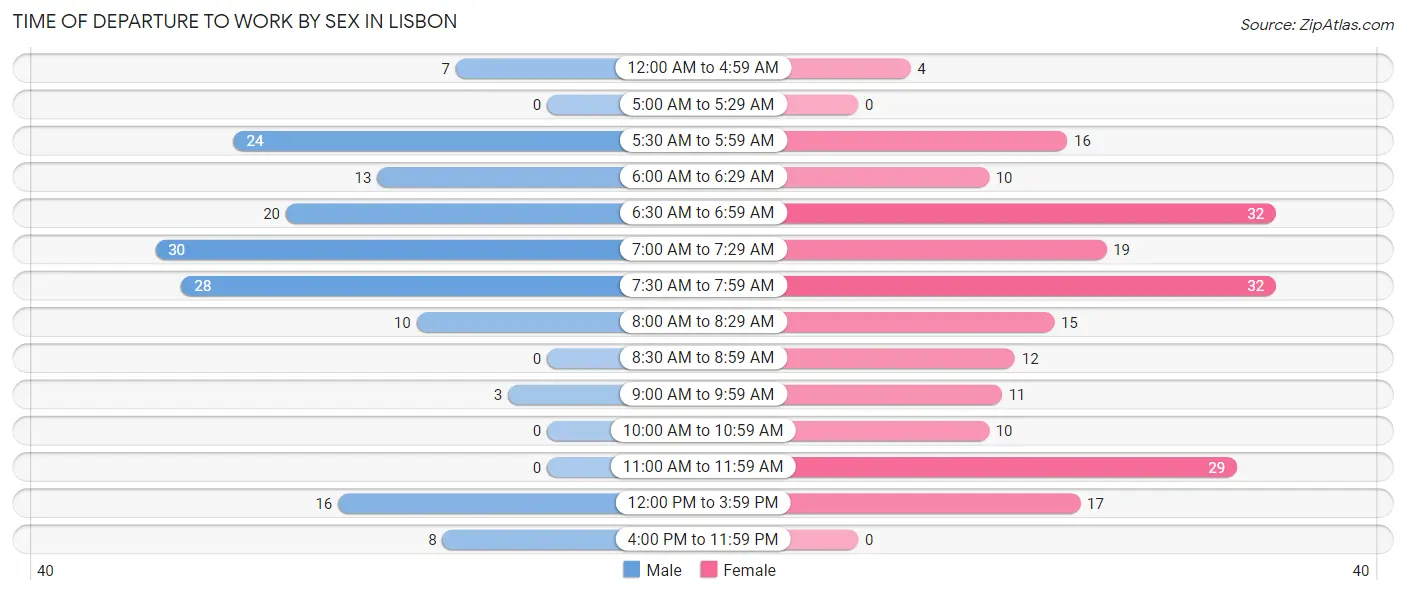
| Time of Departure | Male | Female |
| 12:00 AM to 4:59 AM | 7 (4.4%) | 4 (1.9%) |
| 5:00 AM to 5:29 AM | 0 (0.0%) | 0 (0.0%) |
| 5:30 AM to 5:59 AM | 24 (15.1%) | 16 (7.7%) |
| 6:00 AM to 6:29 AM | 13 (8.2%) | 10 (4.8%) |
| 6:30 AM to 6:59 AM | 20 (12.6%) | 32 (15.5%) |
| 7:00 AM to 7:29 AM | 30 (18.9%) | 19 (9.2%) |
| 7:30 AM to 7:59 AM | 28 (17.6%) | 32 (15.5%) |
| 8:00 AM to 8:29 AM | 10 (6.3%) | 15 (7.2%) |
| 8:30 AM to 8:59 AM | 0 (0.0%) | 12 (5.8%) |
| 9:00 AM to 9:59 AM | 3 (1.9%) | 11 (5.3%) |
| 10:00 AM to 10:59 AM | 0 (0.0%) | 10 (4.8%) |
| 11:00 AM to 11:59 AM | 0 (0.0%) | 29 (14.0%) |
| 12:00 PM to 3:59 PM | 16 (10.1%) | 17 (8.2%) |
| 4:00 PM to 11:59 PM | 8 (5.0%) | 0 (0.0%) |
| Total | 159 (100.0%) | 207 (100.0%) |
Housing Occupancy in Lisbon
Occupancy by Ownership in Lisbon
Of the total 369 dwellings in Lisbon, owner-occupied units account for 241 (65.3%), while renter-occupied units make up 128 (34.7%).
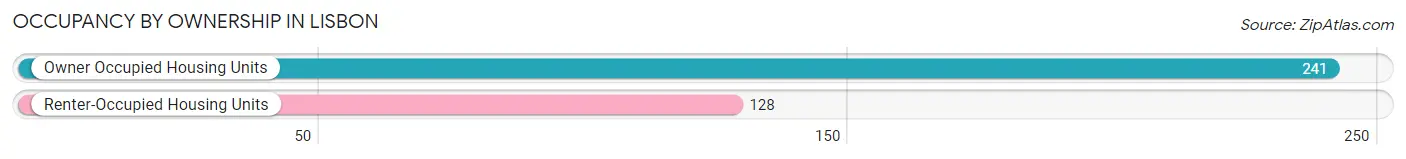
| Occupancy | # Housing Units | % Housing Units |
| Owner Occupied Housing Units | 241 | 65.3% |
| Renter-Occupied Housing Units | 128 | 34.7% |
| Total Occupied Housing Units | 369 | 100.0% |
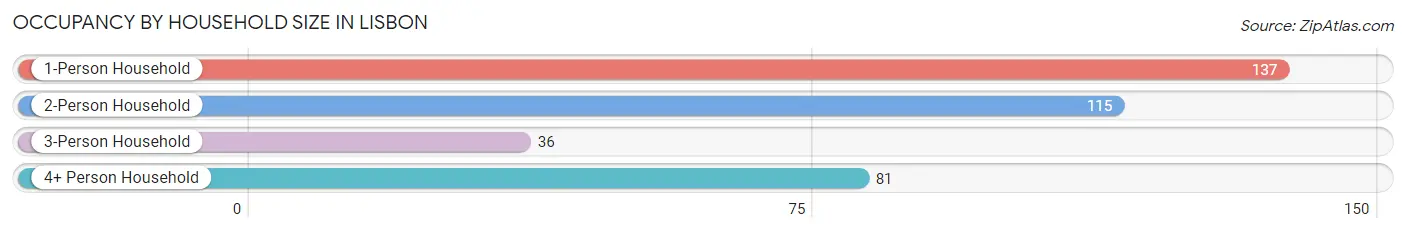
Occupancy by Household Size in Lisbon
| Household Size | # Housing Units | % Housing Units |
| 1-Person Household | 137 | 37.1% |
| 2-Person Household | 115 | 31.2% |
| 3-Person Household | 36 | 9.8% |
| 4+ Person Household | 81 | 22.0% |
| Total Housing Units | 369 | 100.0% |
Occupancy by Ownership by Household Size in Lisbon
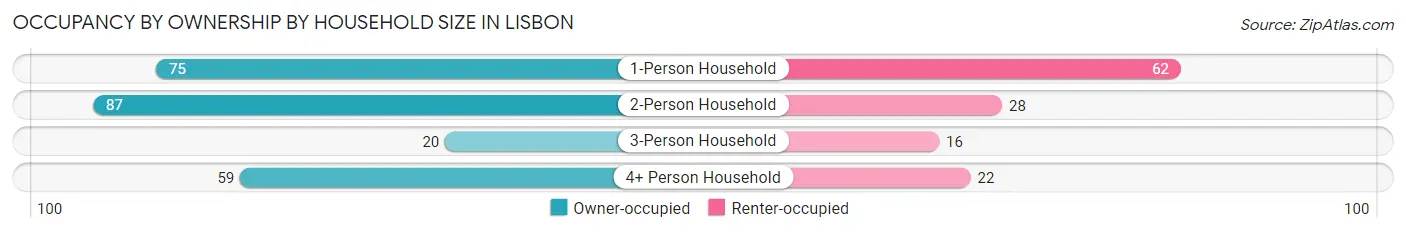
| Household Size | Owner-occupied | Renter-occupied |
| 1-Person Household | 75 (54.7%) | 62 (45.3%) |
| 2-Person Household | 87 (75.6%) | 28 (24.3%) |
| 3-Person Household | 20 (55.6%) | 16 (44.4%) |
| 4+ Person Household | 59 (72.8%) | 22 (27.2%) |
| Total Housing Units | 241 (65.3%) | 128 (34.7%) |
Occupancy by Educational Attainment in Lisbon
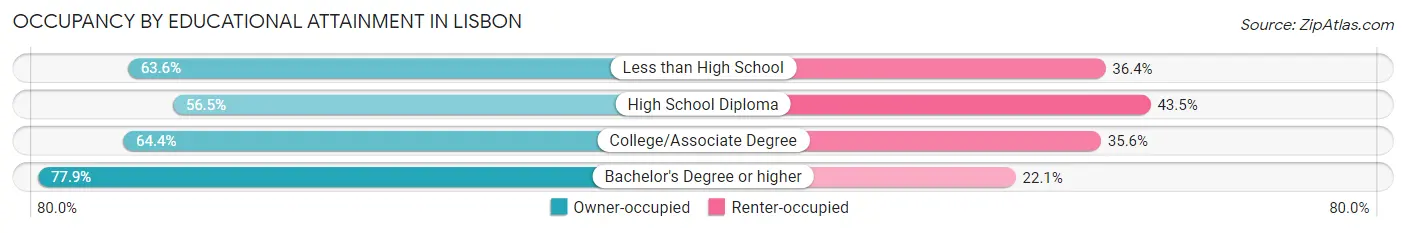
| Household Size | Owner-occupied | Renter-occupied |
| Less than High School | 21 (63.6%) | 12 (36.4%) |
| High School Diploma | 74 (56.5%) | 57 (43.5%) |
| College/Associate Degree | 65 (64.4%) | 36 (35.6%) |
| Bachelor's Degree or higher | 81 (77.9%) | 23 (22.1%) |
Occupancy by Age of Householder in Lisbon
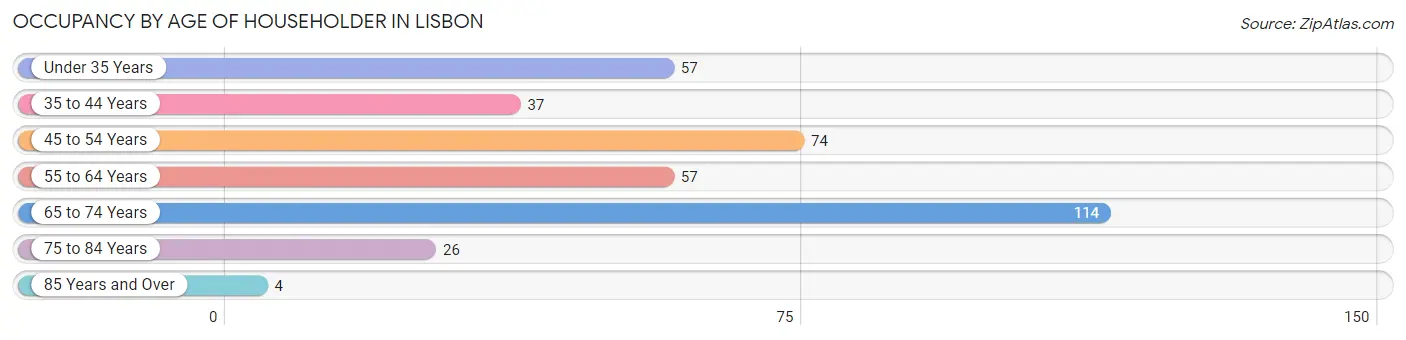
| Age Bracket | # Households | % Households |
| Under 35 Years | 57 | 15.4% |
| 35 to 44 Years | 37 | 10.0% |
| 45 to 54 Years | 74 | 20.1% |
| 55 to 64 Years | 57 | 15.4% |
| 65 to 74 Years | 114 | 30.9% |
| 75 to 84 Years | 26 | 7.0% |
| 85 Years and Over | 4 | 1.1% |
| Total | 369 | 100.0% |
Housing Finances in Lisbon
Median Income by Occupancy in Lisbon
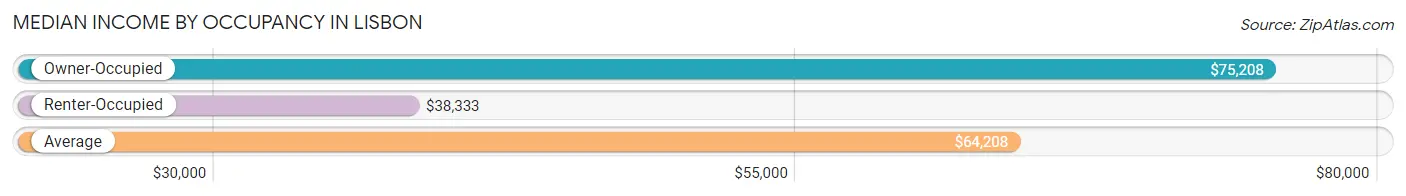
| Occupancy Type | # Households | Median Income |
| Owner-Occupied | 241 (65.3%) | $75,208 |
| Renter-Occupied | 128 (34.7%) | $38,333 |
| Average | 369 (100.0%) | $64,208 |
Occupancy by Householder Income Bracket in Lisbon
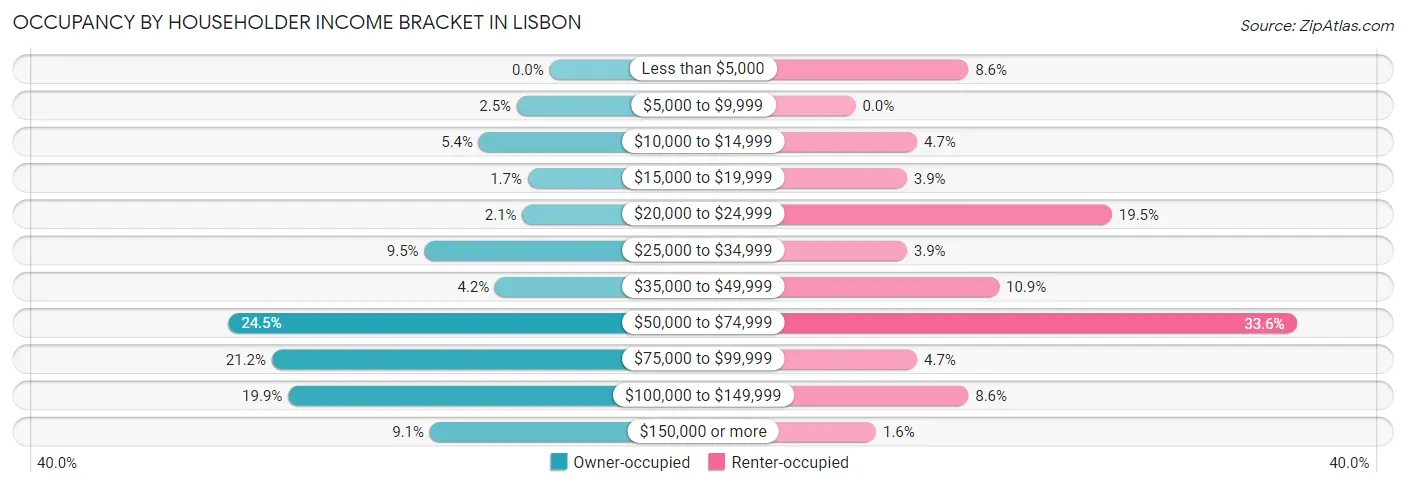
| Income Bracket | Owner-occupied | Renter-occupied |
| Less than $5,000 | 0 (0.0%) | 11 (8.6%) |
| $5,000 to $9,999 | 6 (2.5%) | 0 (0.0%) |
| $10,000 to $14,999 | 13 (5.4%) | 6 (4.7%) |
| $15,000 to $19,999 | 4 (1.7%) | 5 (3.9%) |
| $20,000 to $24,999 | 5 (2.1%) | 25 (19.5%) |
| $25,000 to $34,999 | 23 (9.5%) | 5 (3.9%) |
| $35,000 to $49,999 | 10 (4.2%) | 14 (10.9%) |
| $50,000 to $74,999 | 59 (24.5%) | 43 (33.6%) |
| $75,000 to $99,999 | 51 (21.2%) | 6 (4.7%) |
| $100,000 to $149,999 | 48 (19.9%) | 11 (8.6%) |
| $150,000 or more | 22 (9.1%) | 2 (1.6%) |
| Total | 241 (100.0%) | 128 (100.0%) |
Monthly Housing Cost Tiers in Lisbon
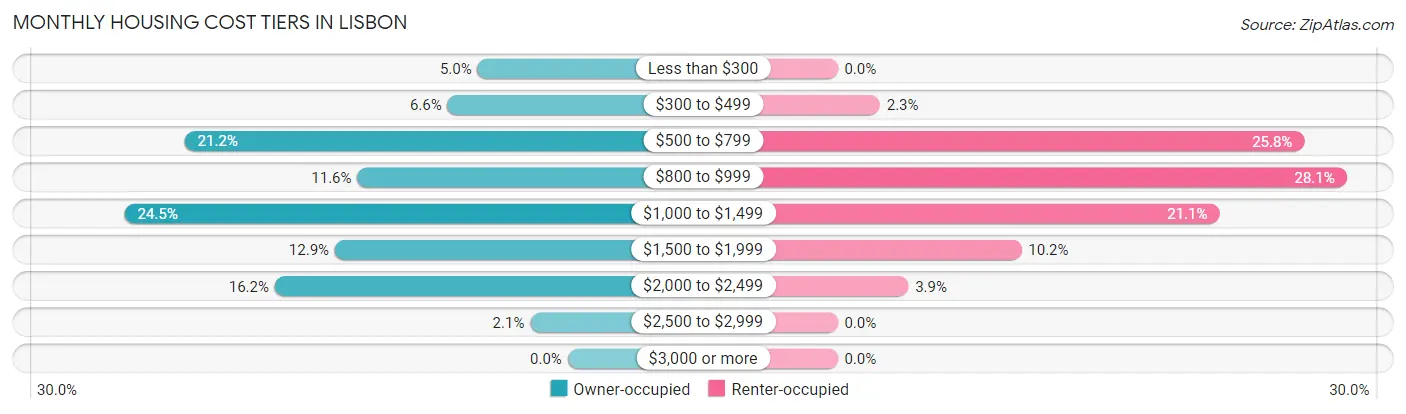
| Monthly Cost | Owner-occupied | Renter-occupied |
| Less than $300 | 12 (5.0%) | 0 (0.0%) |
| $300 to $499 | 16 (6.6%) | 3 (2.3%) |
| $500 to $799 | 51 (21.2%) | 33 (25.8%) |
| $800 to $999 | 28 (11.6%) | 36 (28.1%) |
| $1,000 to $1,499 | 59 (24.5%) | 27 (21.1%) |
| $1,500 to $1,999 | 31 (12.9%) | 13 (10.2%) |
| $2,000 to $2,499 | 39 (16.2%) | 5 (3.9%) |
| $2,500 to $2,999 | 5 (2.1%) | 0 (0.0%) |
| $3,000 or more | 0 (0.0%) | 0 (0.0%) |
| Total | 241 (100.0%) | 128 (100.0%) |
Physical Housing Characteristics in Lisbon
Housing Structures in Lisbon
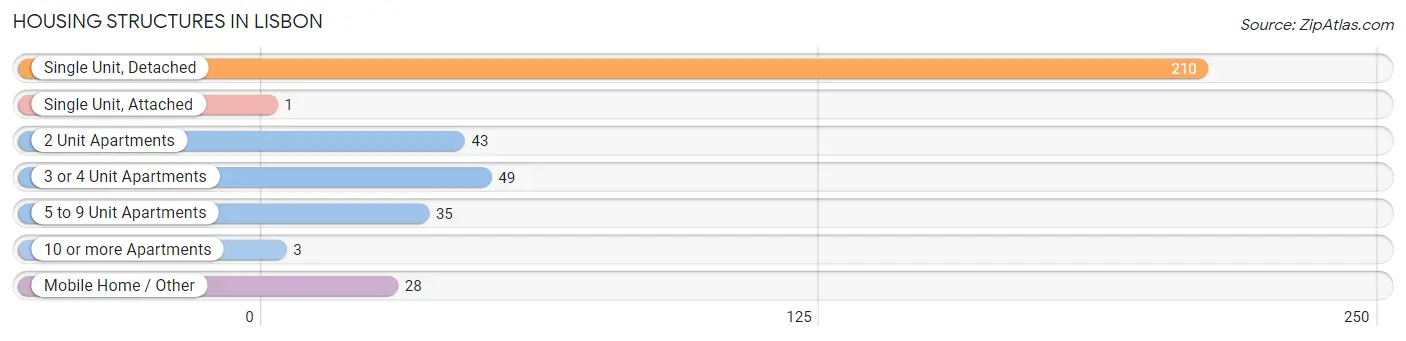
| Structure Type | # Housing Units | % Housing Units |
| Single Unit, Detached | 210 | 56.9% |
| Single Unit, Attached | 1 | 0.3% |
| 2 Unit Apartments | 43 | 11.7% |
| 3 or 4 Unit Apartments | 49 | 13.3% |
| 5 to 9 Unit Apartments | 35 | 9.5% |
| 10 or more Apartments | 3 | 0.8% |
| Mobile Home / Other | 28 | 7.6% |
| Total | 369 | 100.0% |
Housing Structures by Occupancy in Lisbon
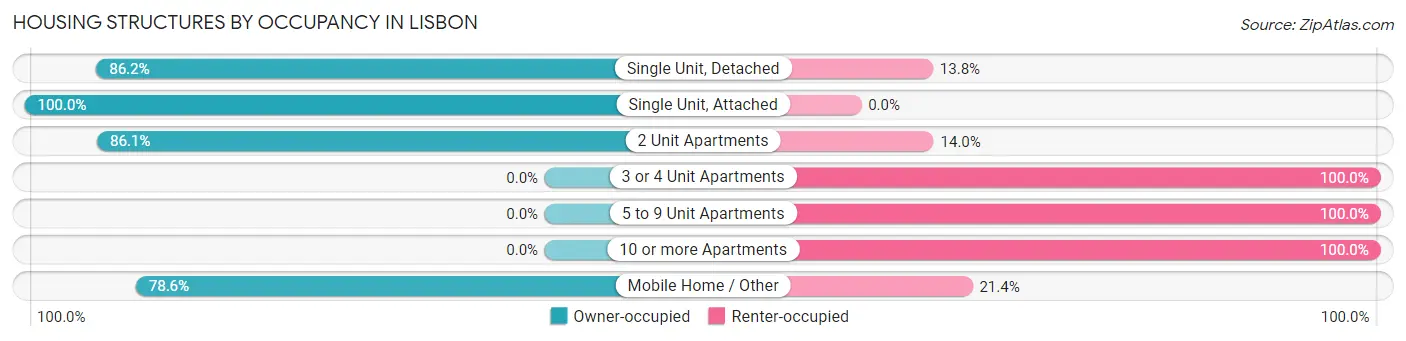
| Structure Type | Owner-occupied | Renter-occupied |
| Single Unit, Detached | 181 (86.2%) | 29 (13.8%) |
| Single Unit, Attached | 1 (100.0%) | 0 (0.0%) |
| 2 Unit Apartments | 37 (86.1%) | 6 (14.0%) |
| 3 or 4 Unit Apartments | 0 (0.0%) | 49 (100.0%) |
| 5 to 9 Unit Apartments | 0 (0.0%) | 35 (100.0%) |
| 10 or more Apartments | 0 (0.0%) | 3 (100.0%) |
| Mobile Home / Other | 22 (78.6%) | 6 (21.4%) |
| Total | 241 (65.3%) | 128 (34.7%) |
Housing Structures by Number of Rooms in Lisbon
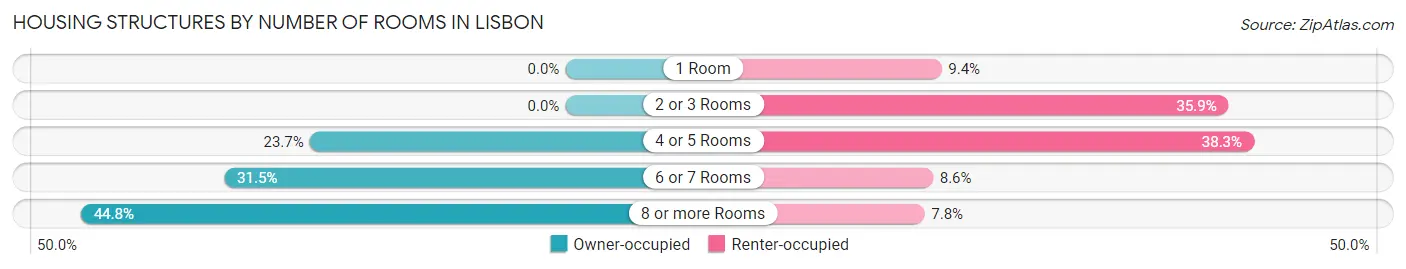
| Number of Rooms | Owner-occupied | Renter-occupied |
| 1 Room | 0 (0.0%) | 12 (9.4%) |
| 2 or 3 Rooms | 0 (0.0%) | 46 (35.9%) |
| 4 or 5 Rooms | 57 (23.6%) | 49 (38.3%) |
| 6 or 7 Rooms | 76 (31.5%) | 11 (8.6%) |
| 8 or more Rooms | 108 (44.8%) | 10 (7.8%) |
| Total | 241 (100.0%) | 128 (100.0%) |
Housing Structure by Heating Type in Lisbon
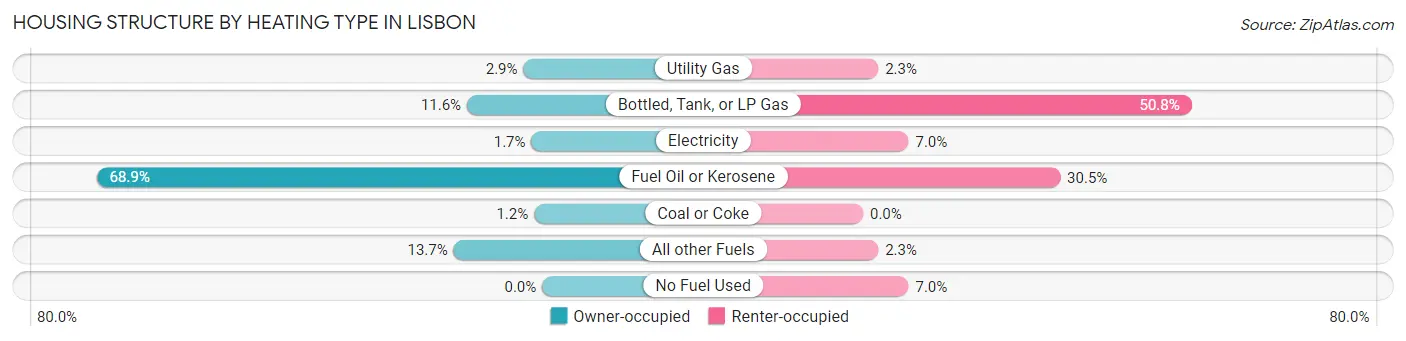
| Heating Type | Owner-occupied | Renter-occupied |
| Utility Gas | 7 (2.9%) | 3 (2.3%) |
| Bottled, Tank, or LP Gas | 28 (11.6%) | 65 (50.8%) |
| Electricity | 4 (1.7%) | 9 (7.0%) |
| Fuel Oil or Kerosene | 166 (68.9%) | 39 (30.5%) |
| Coal or Coke | 3 (1.2%) | 0 (0.0%) |
| All other Fuels | 33 (13.7%) | 3 (2.3%) |
| No Fuel Used | 0 (0.0%) | 9 (7.0%) |
| Total | 241 (100.0%) | 128 (100.0%) |
Household Vehicle Usage in Lisbon
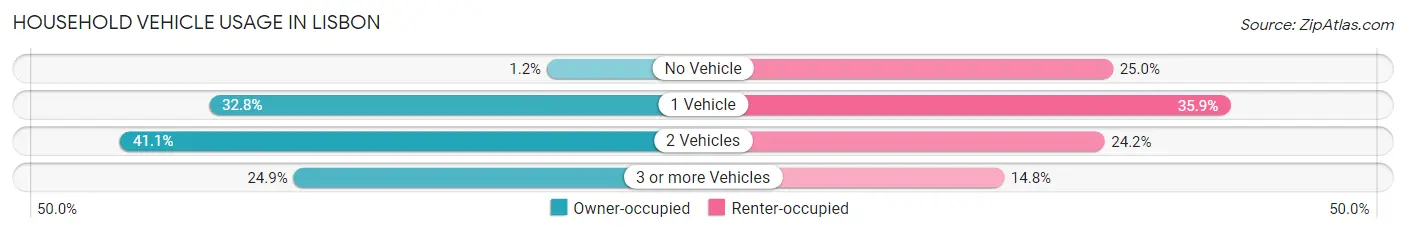
| Vehicles per Household | Owner-occupied | Renter-occupied |
| No Vehicle | 3 (1.2%) | 32 (25.0%) |
| 1 Vehicle | 79 (32.8%) | 46 (35.9%) |
| 2 Vehicles | 99 (41.1%) | 31 (24.2%) |
| 3 or more Vehicles | 60 (24.9%) | 19 (14.8%) |
| Total | 241 (100.0%) | 128 (100.0%) |
Real Estate & Mortgages in Lisbon
Real Estate and Mortgage Overview in Lisbon
| Characteristic | Without Mortgage | With Mortgage |
| Housing Units | 115 | 126 |
| Median Property Value | $135,300 | $163,200 |
| Median Household Income | $63,125 | $22 |
| Monthly Housing Costs | $634 | $0 |
| Real Estate Taxes | $3,630 | $0 |
Property Value by Mortgage Status in Lisbon
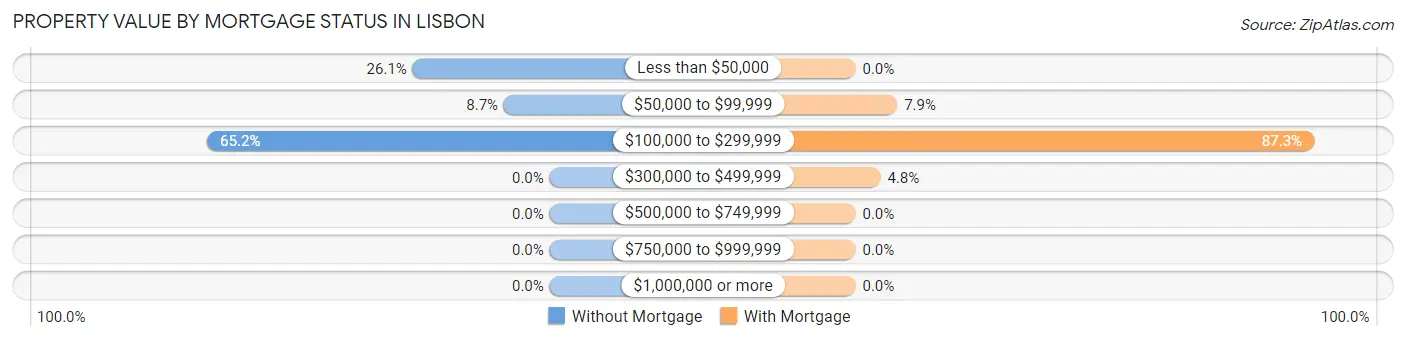
| Property Value | Without Mortgage | With Mortgage |
| Less than $50,000 | 30 (26.1%) | 0 (0.0%) |
| $50,000 to $99,999 | 10 (8.7%) | 10 (7.9%) |
| $100,000 to $299,999 | 75 (65.2%) | 110 (87.3%) |
| $300,000 to $499,999 | 0 (0.0%) | 6 (4.8%) |
| $500,000 to $749,999 | 0 (0.0%) | 0 (0.0%) |
| $750,000 to $999,999 | 0 (0.0%) | 0 (0.0%) |
| $1,000,000 or more | 0 (0.0%) | 0 (0.0%) |
| Total | 115 (100.0%) | 126 (100.0%) |
Household Income by Mortgage Status in Lisbon
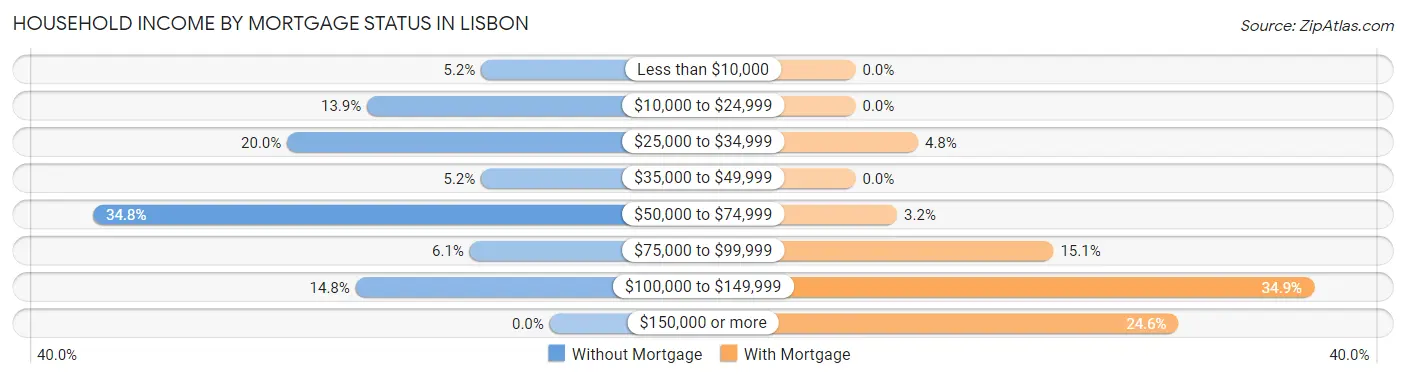
| Household Income | Without Mortgage | With Mortgage |
| Less than $10,000 | 6 (5.2%) | 0 (0.0%) |
| $10,000 to $24,999 | 16 (13.9%) | 0 (0.0%) |
| $25,000 to $34,999 | 23 (20.0%) | 6 (4.8%) |
| $35,000 to $49,999 | 6 (5.2%) | 0 (0.0%) |
| $50,000 to $74,999 | 40 (34.8%) | 4 (3.2%) |
| $75,000 to $99,999 | 7 (6.1%) | 19 (15.1%) |
| $100,000 to $149,999 | 17 (14.8%) | 44 (34.9%) |
| $150,000 or more | 0 (0.0%) | 31 (24.6%) |
| Total | 115 (100.0%) | 126 (100.0%) |
Property Value to Household Income Ratio in Lisbon
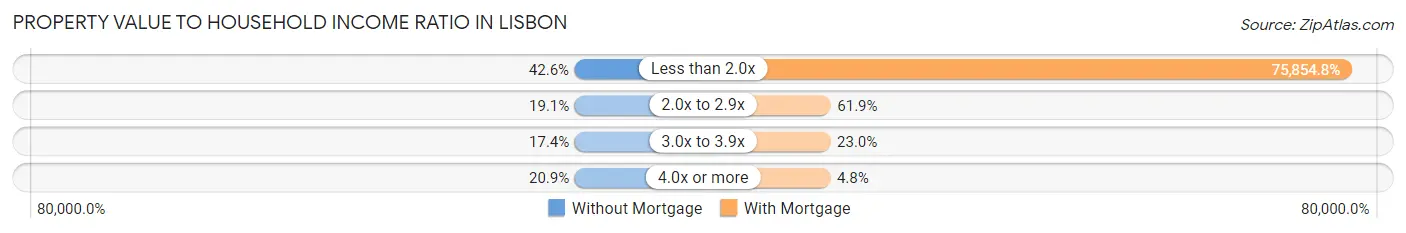
| Value-to-Income Ratio | Without Mortgage | With Mortgage |
| Less than 2.0x | 49 (42.6%) | 95,577 (75,854.8%) |
| 2.0x to 2.9x | 22 (19.1%) | 78 (61.9%) |
| 3.0x to 3.9x | 20 (17.4%) | 29 (23.0%) |
| 4.0x or more | 24 (20.9%) | 6 (4.8%) |
| Total | 115 (100.0%) | 126 (100.0%) |
Real Estate Taxes by Mortgage Status in Lisbon
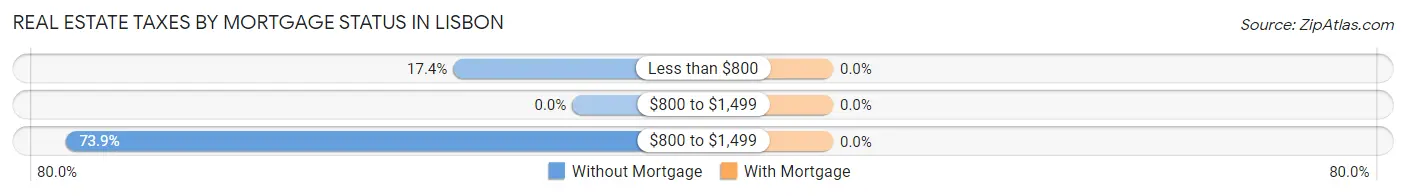
| Property Taxes | Without Mortgage | With Mortgage |
| Less than $800 | 20 (17.4%) | 0 (0.0%) |
| $800 to $1,499 | 0 (0.0%) | 0 (0.0%) |
| $800 to $1,499 | 85 (73.9%) | 0 (0.0%) |
| Total | 115 (100.0%) | 126 (100.0%) |
Health & Disability in Lisbon
Health Insurance Coverage by Age in Lisbon
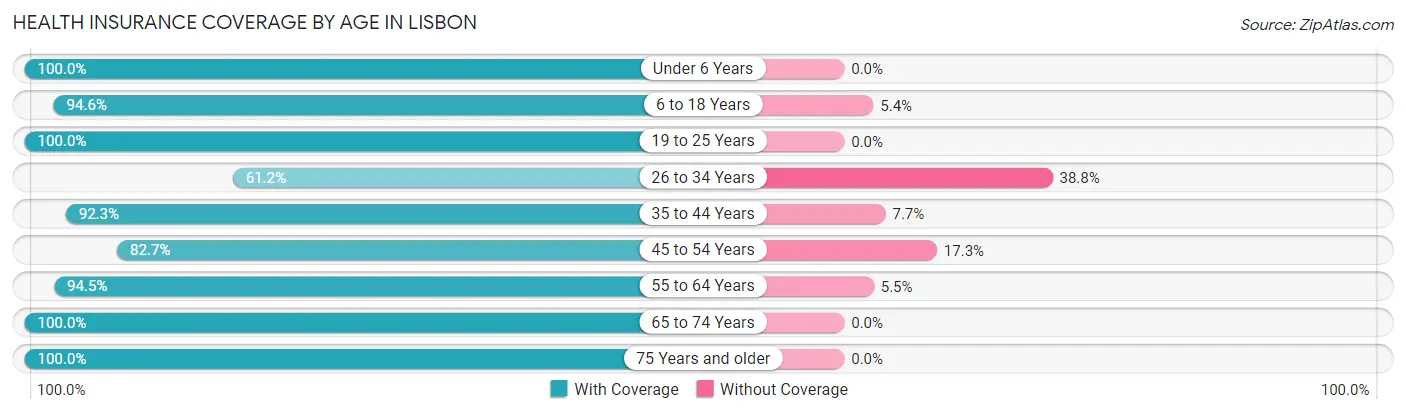
| Age Bracket | With Coverage | Without Coverage |
| Under 6 Years | 67 (100.0%) | 0 (0.0%) |
| 6 to 18 Years | 157 (94.6%) | 9 (5.4%) |
| 19 to 25 Years | 65 (100.0%) | 0 (0.0%) |
| 26 to 34 Years | 63 (61.2%) | 40 (38.8%) |
| 35 to 44 Years | 60 (92.3%) | 5 (7.7%) |
| 45 to 54 Years | 91 (82.7%) | 19 (17.3%) |
| 55 to 64 Years | 103 (94.5%) | 6 (5.5%) |
| 65 to 74 Years | 145 (100.0%) | 0 (0.0%) |
| 75 Years and older | 42 (100.0%) | 0 (0.0%) |
| Total | 793 (90.9%) | 79 (9.1%) |
Health Insurance Coverage by Citizenship Status in Lisbon
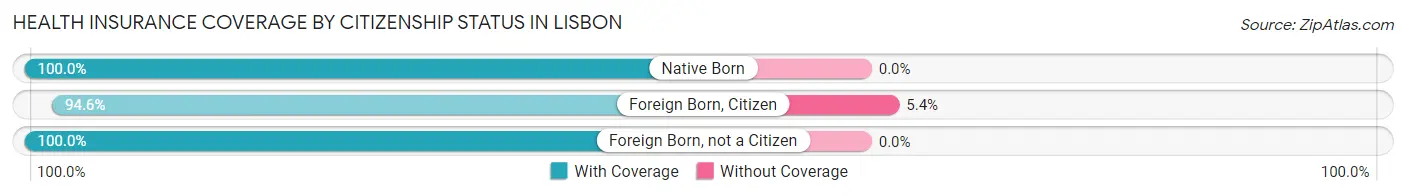
| Citizenship Status | With Coverage | Without Coverage |
| Native Born | 67 (100.0%) | 0 (0.0%) |
| Foreign Born, Citizen | 157 (94.6%) | 9 (5.4%) |
| Foreign Born, not a Citizen | 65 (100.0%) | 0 (0.0%) |
Health Insurance Coverage by Household Income in Lisbon
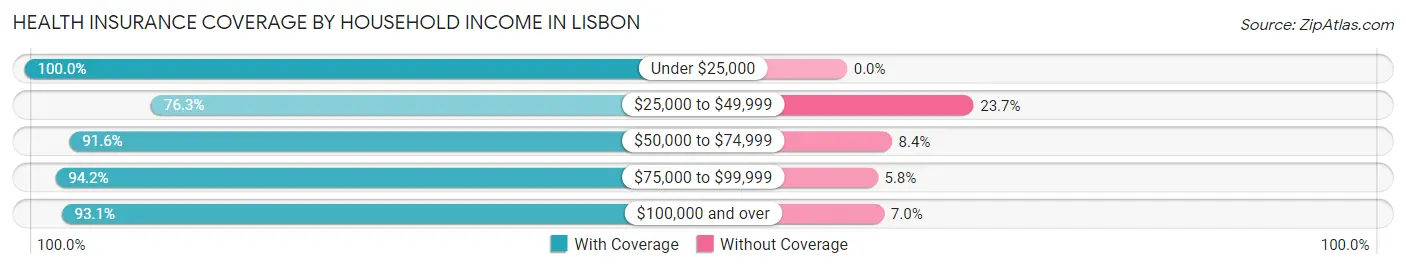
| Household Income | With Coverage | Without Coverage |
| Under $25,000 | 89 (100.0%) | 0 (0.0%) |
| $25,000 to $49,999 | 103 (76.3%) | 32 (23.7%) |
| $50,000 to $74,999 | 229 (91.6%) | 21 (8.4%) |
| $75,000 to $99,999 | 131 (94.2%) | 8 (5.8%) |
| $100,000 and over | 241 (93.0%) | 18 (7.0%) |
Public vs Private Health Insurance Coverage by Age in Lisbon
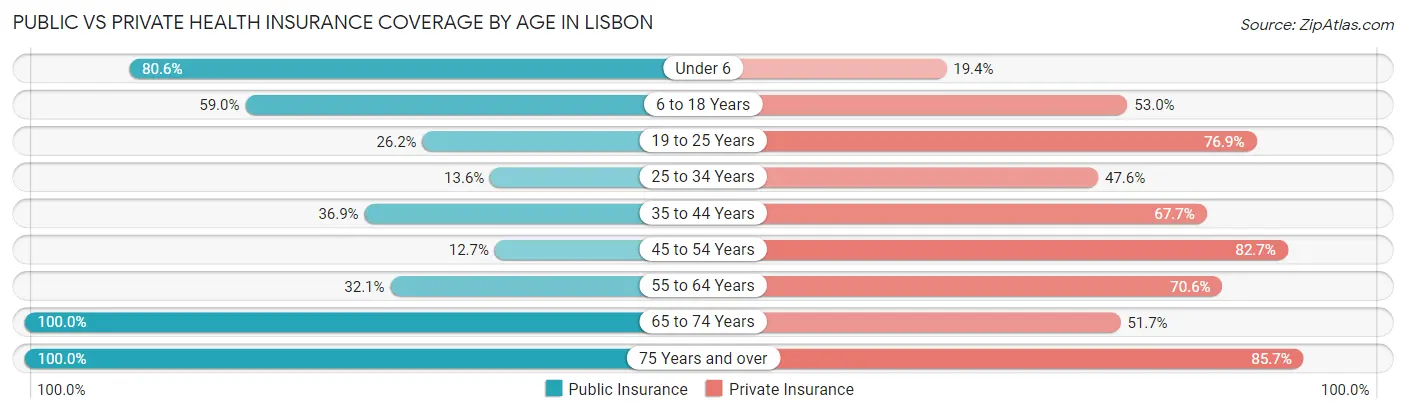
| Age Bracket | Public Insurance | Private Insurance |
| Under 6 | 54 (80.6%) | 13 (19.4%) |
| 6 to 18 Years | 98 (59.0%) | 88 (53.0%) |
| 19 to 25 Years | 17 (26.2%) | 50 (76.9%) |
| 25 to 34 Years | 14 (13.6%) | 49 (47.6%) |
| 35 to 44 Years | 24 (36.9%) | 44 (67.7%) |
| 45 to 54 Years | 14 (12.7%) | 91 (82.7%) |
| 55 to 64 Years | 35 (32.1%) | 77 (70.6%) |
| 65 to 74 Years | 145 (100.0%) | 75 (51.7%) |
| 75 Years and over | 42 (100.0%) | 36 (85.7%) |
| Total | 443 (50.8%) | 523 (60.0%) |
Disability Status by Sex by Age in Lisbon
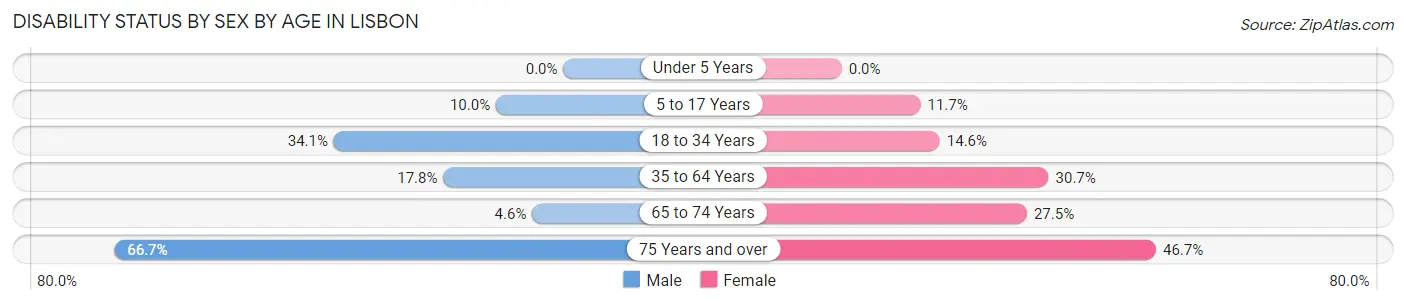
| Age Bracket | Male | Female |
| Under 5 Years | 0 (0.0%) | 0 (0.0%) |
| 5 to 17 Years | 7 (10.0%) | 9 (11.7%) |
| 18 to 34 Years | 30 (34.1%) | 15 (14.6%) |
| 35 to 64 Years | 28 (17.8%) | 39 (30.7%) |
| 65 to 74 Years | 3 (4.6%) | 22 (27.5%) |
| 75 Years and over | 8 (66.7%) | 14 (46.7%) |
Disability Class by Sex by Age in Lisbon
Disability Class: Hearing Difficulty
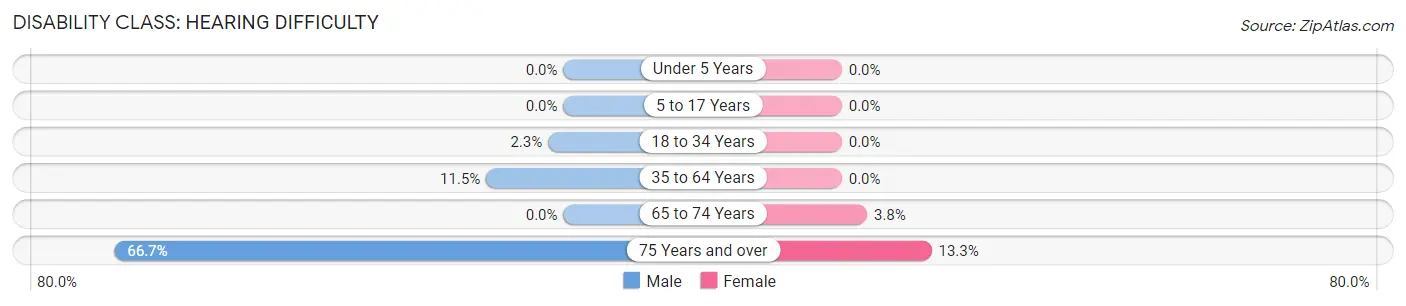
| Age Bracket | Male | Female |
| Under 5 Years | 0 (0.0%) | 0 (0.0%) |
| 5 to 17 Years | 0 (0.0%) | 0 (0.0%) |
| 18 to 34 Years | 2 (2.3%) | 0 (0.0%) |
| 35 to 64 Years | 18 (11.5%) | 0 (0.0%) |
| 65 to 74 Years | 0 (0.0%) | 3 (3.7%) |
| 75 Years and over | 8 (66.7%) | 4 (13.3%) |
Disability Class: Vision Difficulty
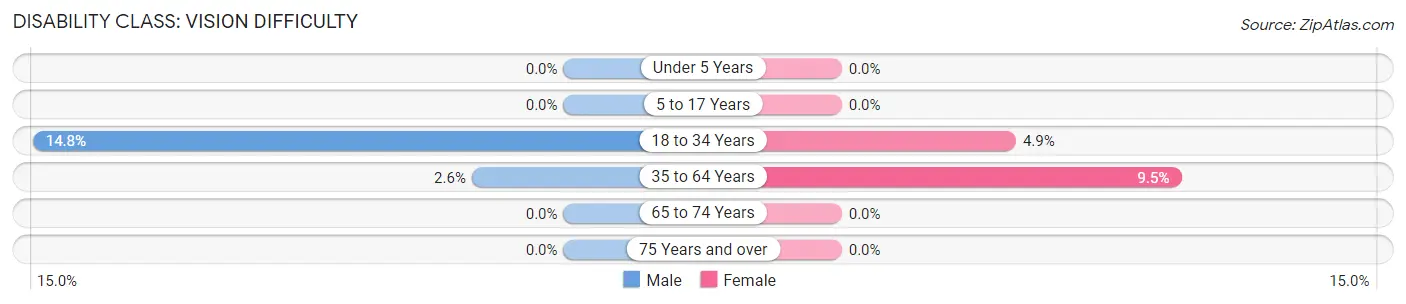
| Age Bracket | Male | Female |
| Under 5 Years | 0 (0.0%) | 0 (0.0%) |
| 5 to 17 Years | 0 (0.0%) | 0 (0.0%) |
| 18 to 34 Years | 13 (14.8%) | 5 (4.9%) |
| 35 to 64 Years | 4 (2.5%) | 12 (9.5%) |
| 65 to 74 Years | 0 (0.0%) | 0 (0.0%) |
| 75 Years and over | 0 (0.0%) | 0 (0.0%) |
Disability Class: Cognitive Difficulty
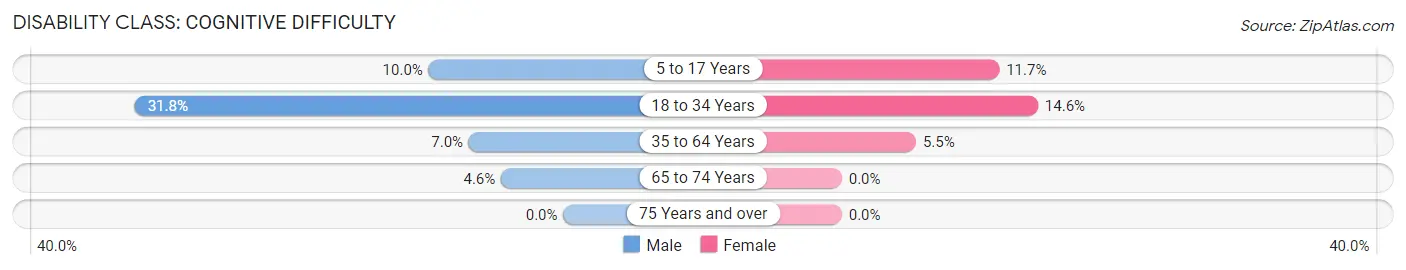
| Age Bracket | Male | Female |
| 5 to 17 Years | 7 (10.0%) | 9 (11.7%) |
| 18 to 34 Years | 28 (31.8%) | 15 (14.6%) |
| 35 to 64 Years | 11 (7.0%) | 7 (5.5%) |
| 65 to 74 Years | 3 (4.6%) | 0 (0.0%) |
| 75 Years and over | 0 (0.0%) | 0 (0.0%) |
Disability Class: Ambulatory Difficulty
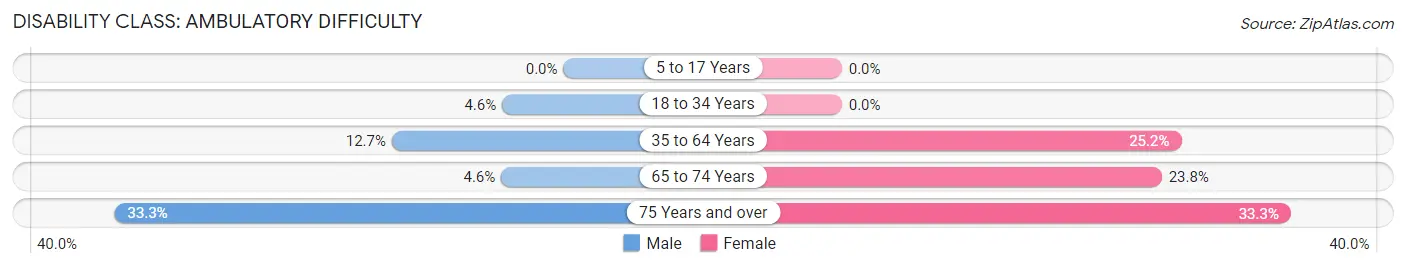
| Age Bracket | Male | Female |
| 5 to 17 Years | 0 (0.0%) | 0 (0.0%) |
| 18 to 34 Years | 4 (4.5%) | 0 (0.0%) |
| 35 to 64 Years | 20 (12.7%) | 32 (25.2%) |
| 65 to 74 Years | 3 (4.6%) | 19 (23.7%) |
| 75 Years and over | 4 (33.3%) | 10 (33.3%) |
Disability Class: Self-Care Difficulty
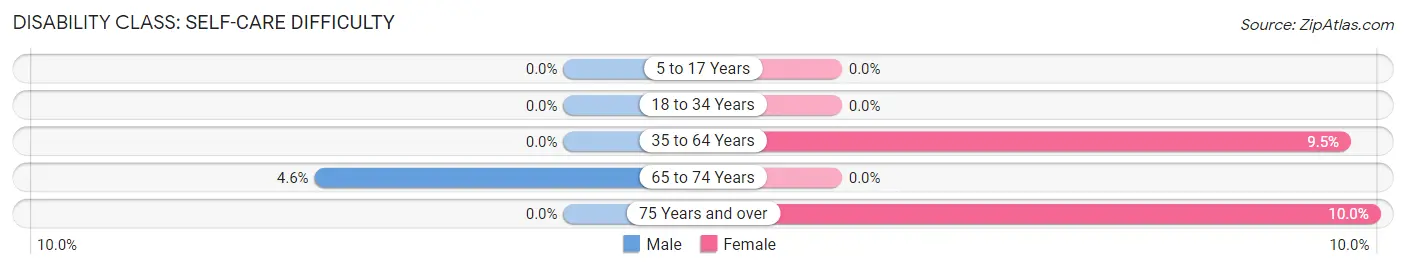
| Age Bracket | Male | Female |
| 5 to 17 Years | 0 (0.0%) | 0 (0.0%) |
| 18 to 34 Years | 0 (0.0%) | 0 (0.0%) |
| 35 to 64 Years | 0 (0.0%) | 12 (9.5%) |
| 65 to 74 Years | 3 (4.6%) | 0 (0.0%) |
| 75 Years and over | 0 (0.0%) | 3 (10.0%) |
Technology Access in Lisbon
Computing Device Access in Lisbon
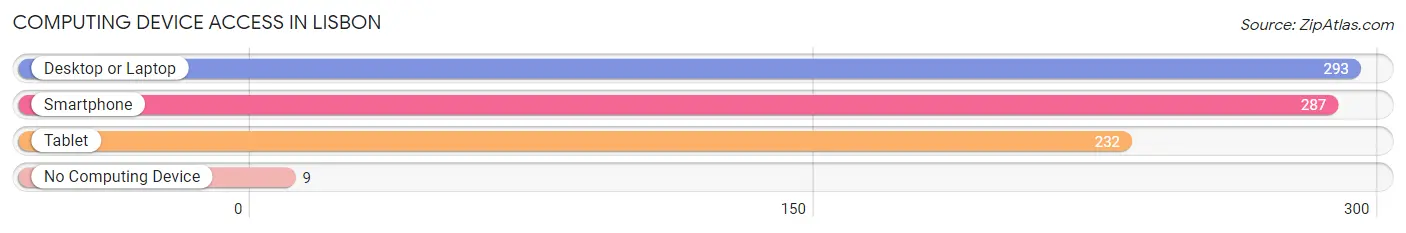
| Device Type | # Households | % Households |
| Desktop or Laptop | 293 | 79.4% |
| Smartphone | 287 | 77.8% |
| Tablet | 232 | 62.9% |
| No Computing Device | 9 | 2.4% |
| Total | 369 | 100.0% |
Internet Access in Lisbon
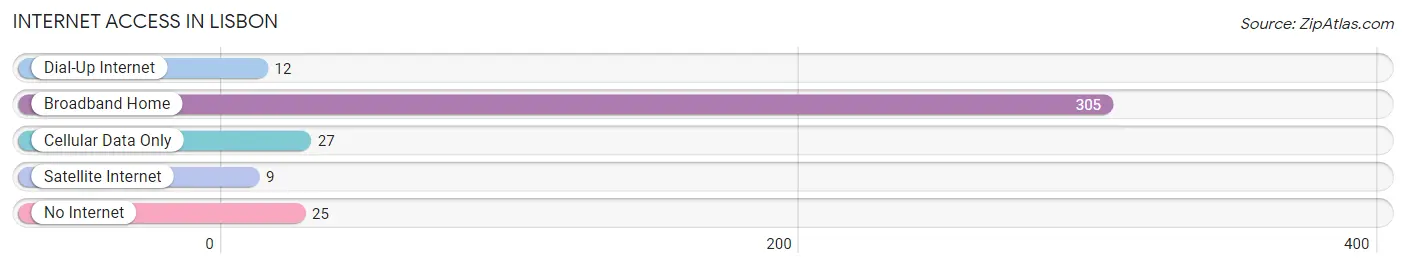
| Internet Type | # Households | % Households |
| Dial-Up Internet | 12 | 3.3% |
| Broadband Home | 305 | 82.7% |
| Cellular Data Only | 27 | 7.3% |
| Satellite Internet | 9 | 2.4% |
| No Internet | 25 | 6.8% |
| Total | 369 | 100.0% |
Lisbon Summary
Lisbon is a town located in Grafton County, New Hampshire, United States. The population was 2,165 at the 2010 census. Lisbon is located in the White Mountains region of New Hampshire and is home to the White Mountain National Forest.
History
Lisbon was first settled in 1764 by a group of settlers from Massachusetts. The town was named after Lisbon, Portugal, and was incorporated in 1773. The town was originally part of a larger tract of land known as the "New Hampshire Grants" which was granted to settlers by the Province of New Hampshire.
In the early 19th century, Lisbon was a thriving agricultural community. The town was home to several mills, including a sawmill, gristmill, and a woolen mill. The town also had a tannery and a blacksmith shop.
In the late 19th century, the town began to experience a decline in population as many of its residents moved away to find work in the larger cities of New England. By the early 20th century, the town had become a quiet rural community.
Geography
Lisbon is located in the White Mountains region of New Hampshire. The town is bordered by the towns of Landaff to the north, Franconia to the east, Bethlehem to the south, and Littleton to the west.
The town is located in the White Mountain National Forest and is home to several mountains, including Mount Moosilauke, Mount Kinsman, and Mount Lafayette. The town is also home to several rivers, including the Ammonoosuc River, the Pemigewasset River, and the Gale River.
Economy
Lisbon is a rural community with a small economy. The town is home to several small businesses, including a general store, a hardware store, and a few restaurants. The town is also home to several small farms, which produce a variety of crops and livestock.
The town is also home to several tourist attractions, including the White Mountain National Forest, the Franconia Notch State Park, and the Mount Washington Auto Road. These attractions bring in a significant amount of tourism to the area, which helps to support the local economy.
Demographics
As of the 2010 census, there were 2,165 people, 890 households, and 590 families residing in the town. The population density was 44.3 people per square mile (17.1/km2). There were 1,039 housing units at an average density of 21.4 per square mile (8.3/km2). The racial makeup of the town was 97.3% White, 0.3% African American, 0.3% Native American, 0.3% Asian, 0.2% from other races, and 1.5% from two or more races. Hispanic or Latino of any race were 0.7% of the population.
There were 890 households, out of which 28.2% had children under the age of 18 living with them, 51.2% were married couples living together, 9.7% had a female householder with no husband present, and 34.2% were non-families. 28.2% of all households were made up of individuals, and 11.7% had someone living alone who was 65 years of age or older. The average household size was 2.41 and the average family size was 2.93.
In the town, the population was spread out, with 23.2% under the age of 18, 6.2% from 18 to 24, 28.2% from 25 to 44, 27.2% from 45 to 64, and 15.2% who were 65 years of age or older. The median age was 40 years. For every 100 females, there were 97.2 males. For every 100 females age 18 and over, there were 95.2 males.
The median income for a household in the town was $41,250, and the median income for a family was $50,000. Males had a median income of $35,000 versus $25,000 for females. The per capita income for the town was $20,945. About 6.2% of families and 8.7% of the population were below the poverty line, including 10.2% of those under age 18 and 8.2% of those age 65 or over.
Common Questions
What is Per Capita Income in Lisbon?
Per Capita income in Lisbon is $32,119.
What is the Median Family Income in Lisbon?
Median Family Income in Lisbon is $78,000.
What is the Median Household income in Lisbon?
Median Household Income in Lisbon is $64,208.
What is Income or Wage Gap in Lisbon?
Income or Wage Gap in Lisbon is 32.8%.
Women in Lisbon earn 67.2 cents for every dollar earned by a man.
What is Family Income Deficit in Lisbon?
Family Income Deficit in Lisbon is $20,000.
Families that are below poverty line in Lisbon earn $20,000 less on average than the poverty threshold level.
What is Inequality or Gini Index in Lisbon?
Inequality or Gini Index in Lisbon is 0.41.
What is the Total Population of Lisbon?
Total Population of Lisbon is 872.
What is the Total Male Population of Lisbon?
Total Male Population of Lisbon is 433.
What is the Total Female Population of Lisbon?
Total Female Population of Lisbon is 439.
What is the Ratio of Males per 100 Females in Lisbon?
There are 98.63 Males per 100 Females in Lisbon.
What is the Ratio of Females per 100 Males in Lisbon?
There are 101.39 Females per 100 Males in Lisbon.
What is the Median Population Age in Lisbon?
Median Population Age in Lisbon is 41.4 Years.
What is the Average Family Size in Lisbon
Average Family Size in Lisbon is 3.1 People.
What is the Average Household Size in Lisbon
Average Household Size in Lisbon is 2.4 People.
How Large is the Labor Force in Lisbon?
There are 446 People in the Labor Forcein in Lisbon.
What is the Percentage of People in the Labor Force in Lisbon?
63.8% of People are in the Labor Force in Lisbon.
What is the Unemployment Rate in Lisbon?
Unemployment Rate in Lisbon is 8.1%.