Groveton, NH Map & Demographics
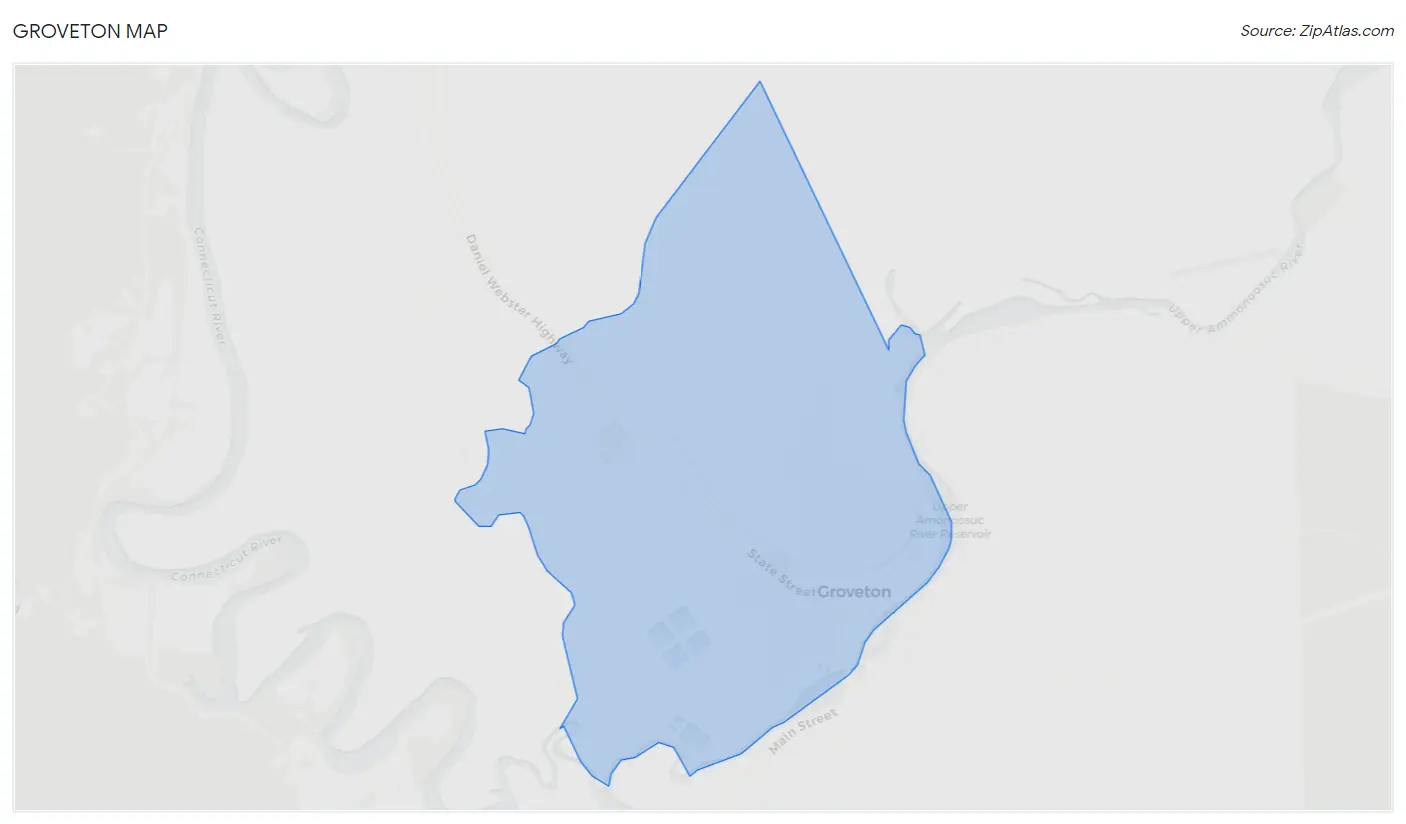
Groveton Map
Groveton Overview
$24,806
PER CAPITA INCOME
$75,089
AVG FAMILY INCOME
$51,711
AVG HOUSEHOLD INCOME
29.5%
WAGE / INCOME GAP [ % ]
70.5¢/ $1
WAGE / INCOME GAP [ $ ]
0.33
INEQUALITY / GINI INDEX
839
TOTAL POPULATION
378
MALE POPULATION
461
FEMALE POPULATION
82.00
MALES / 100 FEMALES
121.96
FEMALES / 100 MALES
37.7
MEDIAN AGE
2.7
AVG FAMILY SIZE
2.3
AVG HOUSEHOLD SIZE
410
LABOR FORCE [ PEOPLE ]
60.9%
PERCENT IN LABOR FORCE
3.7%
UNEMPLOYMENT RATE
Groveton Zip Codes
Groveton Area Codes
Income in Groveton
Income Overview in Groveton
Per Capita Income in Groveton is $24,806, while median incomes of families and households are $75,089 and $51,711 respectively.
| Characteristic | Number | Measure |
| Per Capita Income | 839 | $24,806 |
| Median Family Income | 228 | $75,089 |
| Mean Family Income | 228 | $66,554 |
| Median Household Income | 362 | $51,711 |
| Mean Household Income | 362 | $54,378 |
| Income Deficit | 228 | $0 |
| Wage / Income Gap (%) | 839 | 29.54% |
| Wage / Income Gap ($) | 839 | 70.46¢ per $1 |
| Gini / Inequality Index | 839 | 0.33 |
Earnings by Sex in Groveton
Average Earnings in Groveton are $37,417, $44,063 for men and $31,048 for women, a difference of 29.5%.
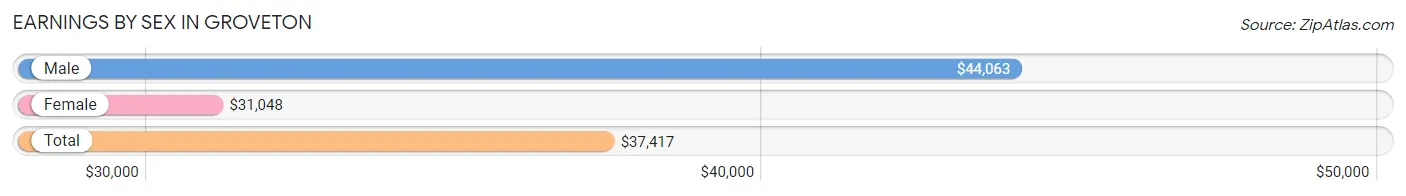
| Sex | Number | Average Earnings |
| Male | 235 (54.3%) | $44,063 |
| Female | 198 (45.7%) | $31,048 |
| Total | 433 (100.0%) | $37,417 |
Earnings by Sex by Income Bracket in Groveton
The most common earnings brackets in Groveton are $35,000 to $39,999 for men (39 | 16.6%) and $30,000 to $34,999 for women (62 | 31.3%).
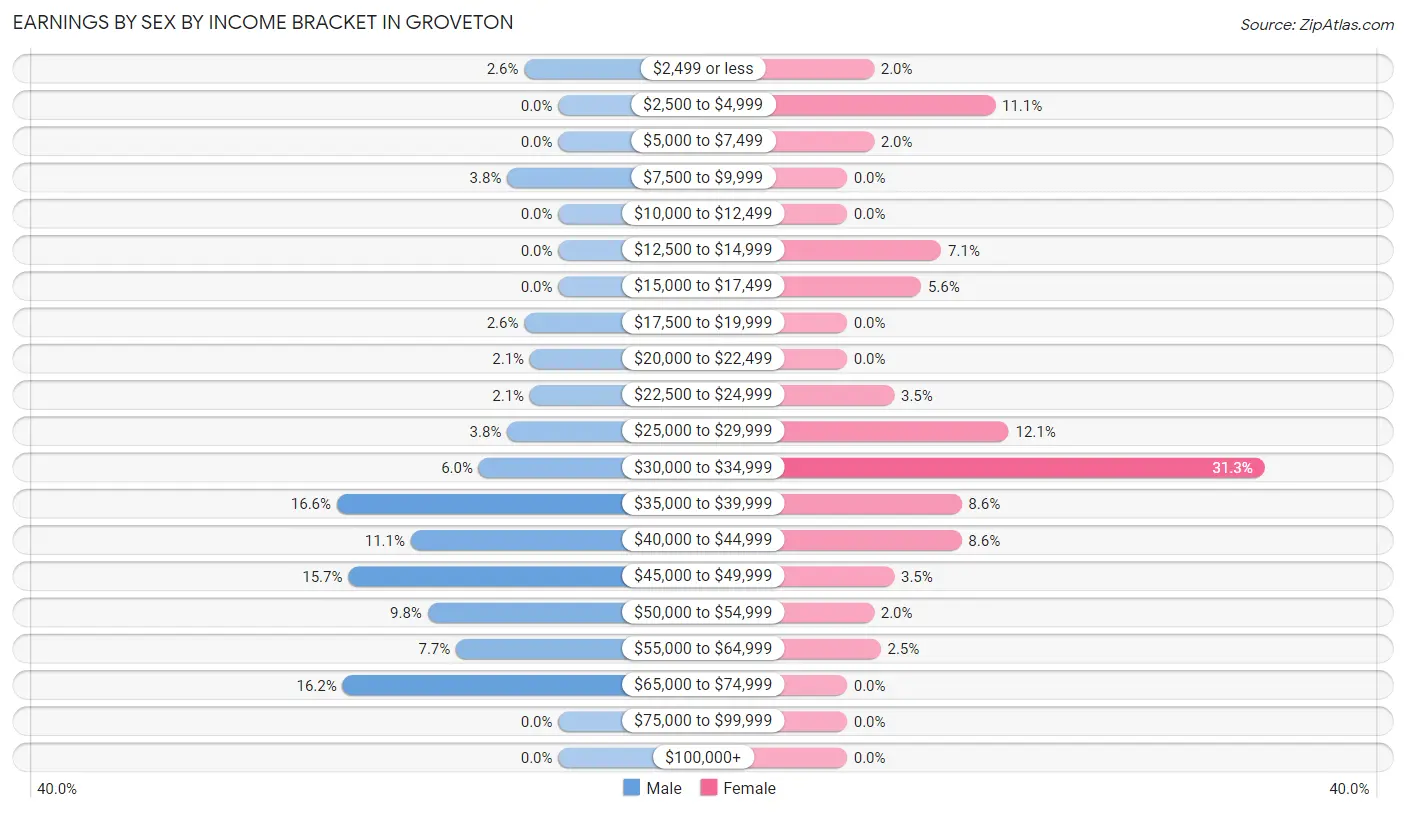
| Income | Male | Female |
| $2,499 or less | 6 (2.5%) | 4 (2.0%) |
| $2,500 to $4,999 | 0 (0.0%) | 22 (11.1%) |
| $5,000 to $7,499 | 0 (0.0%) | 4 (2.0%) |
| $7,500 to $9,999 | 9 (3.8%) | 0 (0.0%) |
| $10,000 to $12,499 | 0 (0.0%) | 0 (0.0%) |
| $12,500 to $14,999 | 0 (0.0%) | 14 (7.1%) |
| $15,000 to $17,499 | 0 (0.0%) | 11 (5.6%) |
| $17,500 to $19,999 | 6 (2.5%) | 0 (0.0%) |
| $20,000 to $22,499 | 5 (2.1%) | 0 (0.0%) |
| $22,500 to $24,999 | 5 (2.1%) | 7 (3.5%) |
| $25,000 to $29,999 | 9 (3.8%) | 24 (12.1%) |
| $30,000 to $34,999 | 14 (6.0%) | 62 (31.3%) |
| $35,000 to $39,999 | 39 (16.6%) | 17 (8.6%) |
| $40,000 to $44,999 | 26 (11.1%) | 17 (8.6%) |
| $45,000 to $49,999 | 37 (15.7%) | 7 (3.5%) |
| $50,000 to $54,999 | 23 (9.8%) | 4 (2.0%) |
| $55,000 to $64,999 | 18 (7.7%) | 5 (2.5%) |
| $65,000 to $74,999 | 38 (16.2%) | 0 (0.0%) |
| $75,000 to $99,999 | 0 (0.0%) | 0 (0.0%) |
| $100,000+ | 0 (0.0%) | 0 (0.0%) |
| Total | 235 (100.0%) | 198 (100.0%) |
Earnings by Sex by Educational Attainment in Groveton
Average earnings in Groveton are $46,466 for men and $32,097 for women, a difference of 30.9%. Men with an educational attainment of college or associate's degree enjoy the highest average annual earnings of $50,625, while those with high school diploma education earn the least with $45,625. Women with an educational attainment of college or associate's degree earn the most with the average annual earnings of $33,750, while those with high school diploma education have the smallest earnings of $25,694.
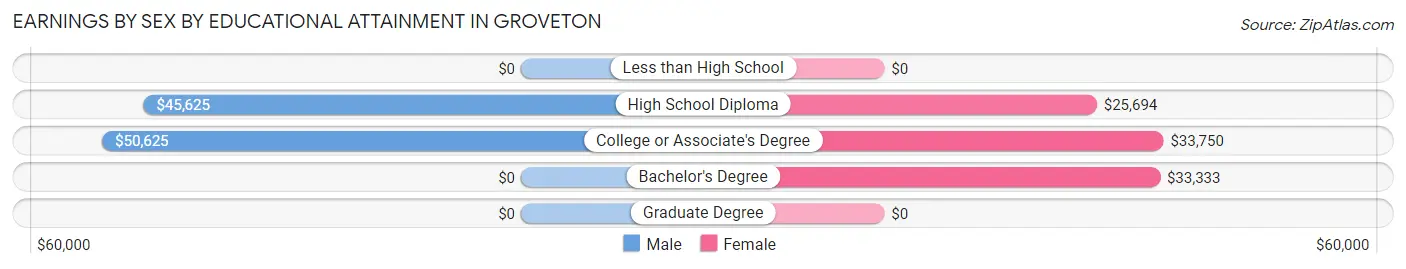
| Educational Attainment | Male Income | Female Income |
| Less than High School | - | - |
| High School Diploma | $45,625 | $25,694 |
| College or Associate's Degree | $50,625 | $33,750 |
| Bachelor's Degree | - | - |
| Graduate Degree | - | - |
| Total | $46,466 | $32,097 |
Family Income in Groveton
Family Income Brackets in Groveton
According to the Groveton family income data, there are 76 families falling into the $75,000 to $99,999 income range, which is the most common income bracket and makes up 33.3% of all families.
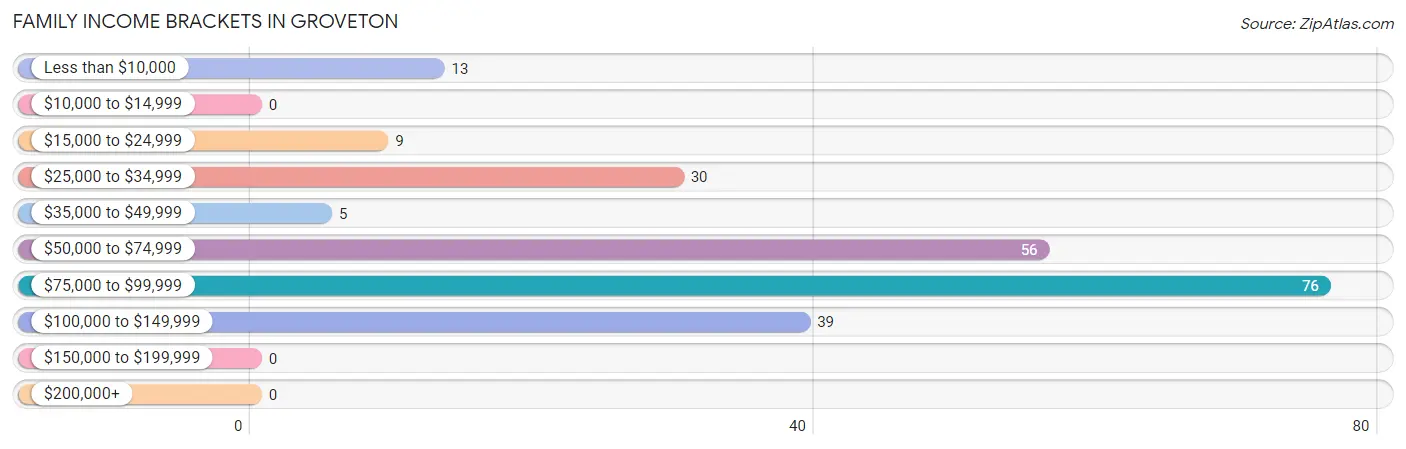
| Income Bracket | # Families | % Families |
| Less than $10,000 | 13 | 5.7% |
| $10,000 to $14,999 | 0 | 0.0% |
| $15,000 to $24,999 | 9 | 3.9% |
| $25,000 to $34,999 | 30 | 13.2% |
| $35,000 to $49,999 | 5 | 2.2% |
| $50,000 to $74,999 | 56 | 24.6% |
| $75,000 to $99,999 | 76 | 33.3% |
| $100,000 to $149,999 | 39 | 17.1% |
| $150,000 to $199,999 | 0 | 0.0% |
| $200,000+ | 0 | 0.0% |
Family Income by Famaliy Size in Groveton
4-person families (21 | 9.2%) account for the highest median family income in Groveton with $76,641 per family, while 2-person families (121 | 53.1%) have the highest median income of $34,602 per family member.
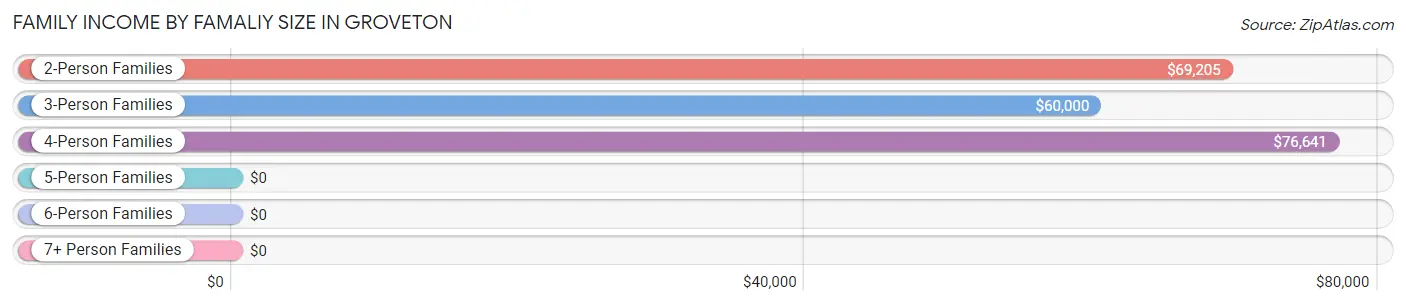
| Income Bracket | # Families | Median Income |
| 2-Person Families | 121 (53.1%) | $69,205 |
| 3-Person Families | 86 (37.7%) | $60,000 |
| 4-Person Families | 21 (9.2%) | $76,641 |
| 5-Person Families | 0 (0.0%) | $0 |
| 6-Person Families | 0 (0.0%) | $0 |
| 7+ Person Families | 0 (0.0%) | $0 |
| Total | 228 (100.0%) | $75,089 |
Family Income by Number of Earners in Groveton
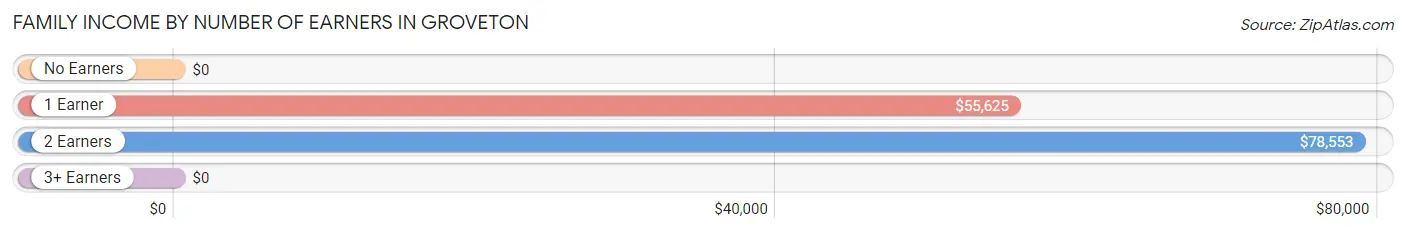
| Number of Earners | # Families | Median Income |
| No Earners | 27 (11.8%) | $0 |
| 1 Earner | 84 (36.8%) | $55,625 |
| 2 Earners | 98 (43.0%) | $78,553 |
| 3+ Earners | 19 (8.3%) | $0 |
| Total | 228 (100.0%) | $75,089 |
Household Income in Groveton
Household Income Brackets in Groveton
With 92 households falling in the category, the $50,000 to $74,999 income range is the most frequent in Groveton, accounting for 25.4% of all households.
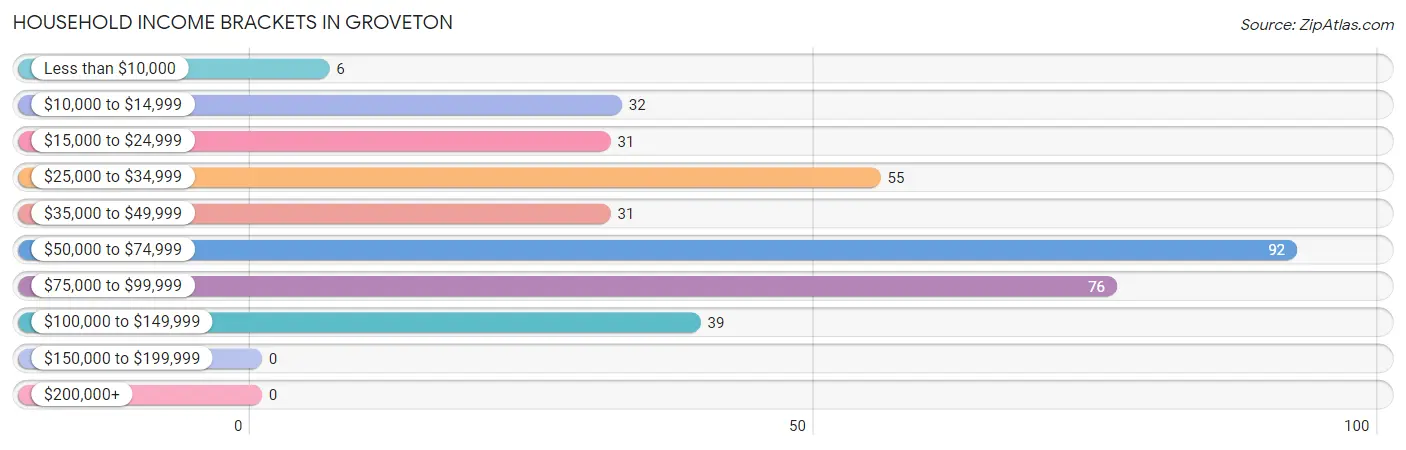
| Income Bracket | # Households | % Households |
| Less than $10,000 | 6 | 1.7% |
| $10,000 to $14,999 | 32 | 8.8% |
| $15,000 to $24,999 | 31 | 8.6% |
| $25,000 to $34,999 | 55 | 15.2% |
| $35,000 to $49,999 | 31 | 8.6% |
| $50,000 to $74,999 | 92 | 25.4% |
| $75,000 to $99,999 | 76 | 21.0% |
| $100,000 to $149,999 | 39 | 10.8% |
| $150,000 to $199,999 | 0 | 0.0% |
| $200,000+ | 0 | 0.0% |
Household Income by Householder Age in Groveton
The median household income in Groveton is $51,711, with the highest median household income of $56,591 found in the 45 to 64 years age bracket for the primary householder. A total of 108 households (29.8%) fall into this category. Meanwhile, the 15 to 24 years age bracket for the primary householder has the lowest median household income of $0, with 21 households (5.8%) in this group.
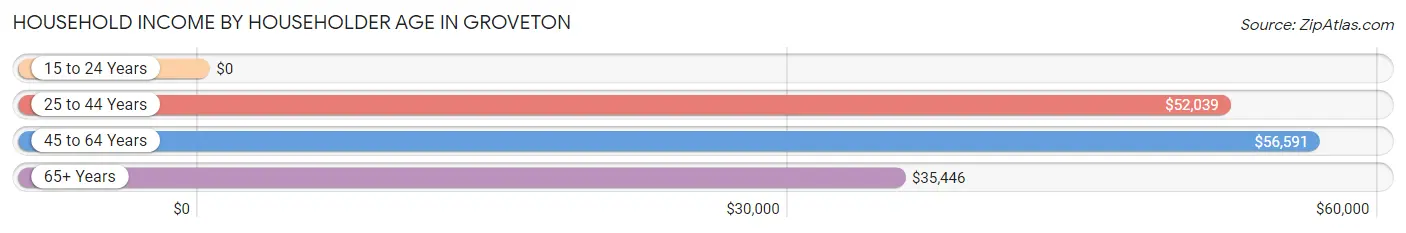
| Income Bracket | # Households | Median Income |
| 15 to 24 Years | 21 (5.8%) | $0 |
| 25 to 44 Years | 134 (37.0%) | $52,039 |
| 45 to 64 Years | 108 (29.8%) | $56,591 |
| 65+ Years | 99 (27.4%) | $35,446 |
| Total | 362 (100.0%) | $51,711 |
Poverty in Groveton
Income Below Poverty by Sex and Age in Groveton
With 7.9% poverty level for males and 16.7% for females among the residents of Groveton, 55 to 64 year old males and 25 to 34 year old females are the most vulnerable to poverty, with 23 males (37.7%) and 41 females (52.6%) in their respective age groups living below the poverty level.
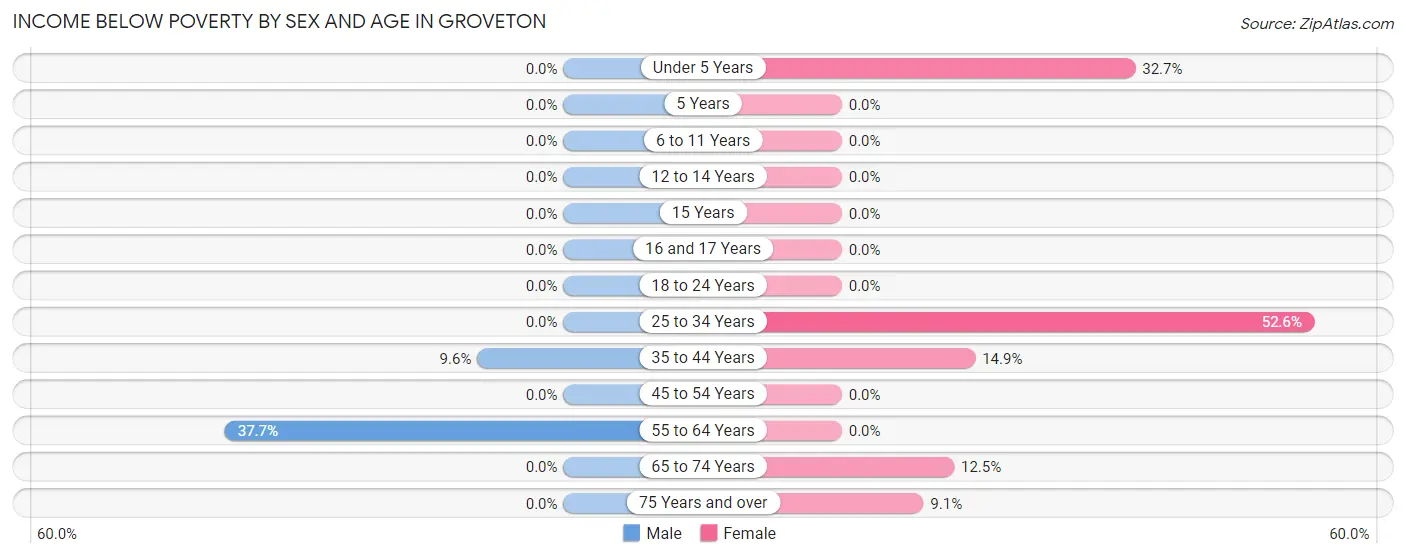
| Age Bracket | Male | Female |
| Under 5 Years | 0 (0.0%) | 17 (32.7%) |
| 5 Years | 0 (0.0%) | 0 (0.0%) |
| 6 to 11 Years | 0 (0.0%) | 0 (0.0%) |
| 12 to 14 Years | 0 (0.0%) | 0 (0.0%) |
| 15 Years | 0 (0.0%) | 0 (0.0%) |
| 16 and 17 Years | 0 (0.0%) | 0 (0.0%) |
| 18 to 24 Years | 0 (0.0%) | 0 (0.0%) |
| 25 to 34 Years | 0 (0.0%) | 41 (52.6%) |
| 35 to 44 Years | 7 (9.6%) | 11 (14.9%) |
| 45 to 54 Years | 0 (0.0%) | 0 (0.0%) |
| 55 to 64 Years | 23 (37.7%) | 0 (0.0%) |
| 65 to 74 Years | 0 (0.0%) | 5 (12.5%) |
| 75 Years and over | 0 (0.0%) | 2 (9.1%) |
| Total | 30 (7.9%) | 76 (16.7%) |
Income Above Poverty by Sex and Age in Groveton
According to the poverty statistics in Groveton, males aged under 5 years and females aged 6 to 11 years are the age groups that are most secure financially, with 100.0% of males and 100.0% of females in these age groups living above the poverty line.
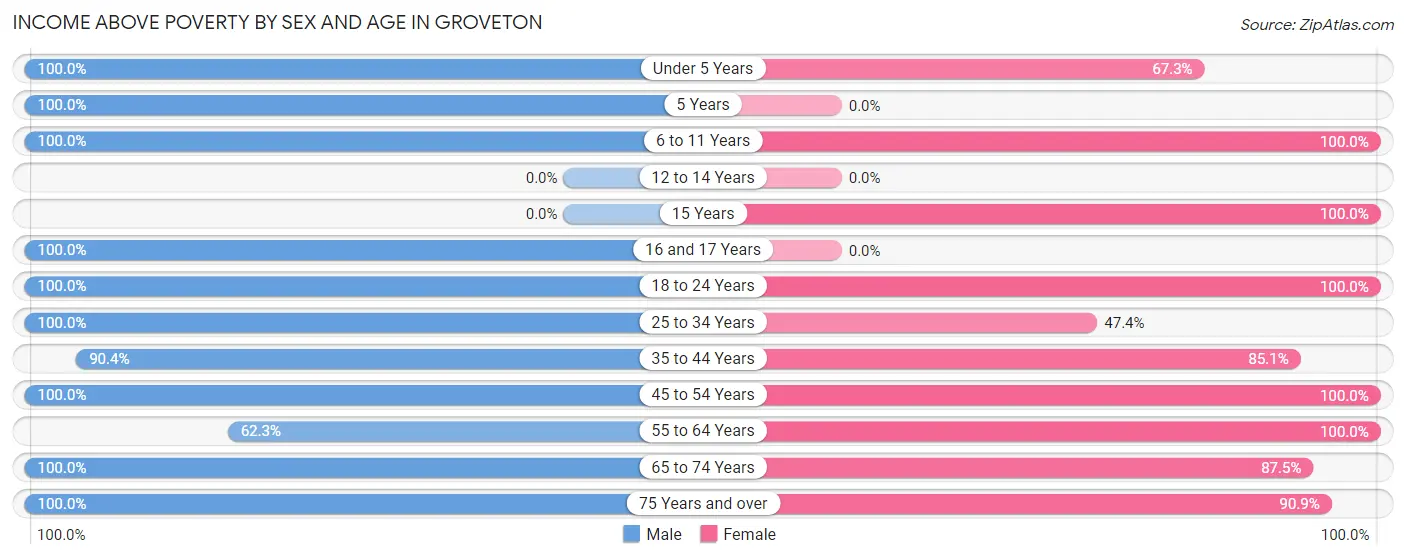
| Age Bracket | Male | Female |
| Under 5 Years | 21 (100.0%) | 35 (67.3%) |
| 5 Years | 5 (100.0%) | 0 (0.0%) |
| 6 to 11 Years | 20 (100.0%) | 55 (100.0%) |
| 12 to 14 Years | 0 (0.0%) | 0 (0.0%) |
| 15 Years | 0 (0.0%) | 8 (100.0%) |
| 16 and 17 Years | 17 (100.0%) | 0 (0.0%) |
| 18 to 24 Years | 66 (100.0%) | 26 (100.0%) |
| 25 to 34 Years | 15 (100.0%) | 37 (47.4%) |
| 35 to 44 Years | 66 (90.4%) | 63 (85.1%) |
| 45 to 54 Years | 35 (100.0%) | 47 (100.0%) |
| 55 to 64 Years | 38 (62.3%) | 54 (100.0%) |
| 65 to 74 Years | 24 (100.0%) | 35 (87.5%) |
| 75 Years and over | 41 (100.0%) | 20 (90.9%) |
| Total | 348 (92.1%) | 380 (83.3%) |
Income Below Poverty Among Married-Couple Families in Groveton
| Children | Above Poverty | Below Poverty |
| No Children | 78 (100.0%) | 0 (0.0%) |
| 1 or 2 Children | 55 (100.0%) | 0 (0.0%) |
| 3 or 4 Children | 0 (0.0%) | 0 (0.0%) |
| 5 or more Children | 0 (0.0%) | 0 (0.0%) |
| Total | 133 (100.0%) | 0 (0.0%) |
Income Below Poverty Among Single-Parent Households in Groveton
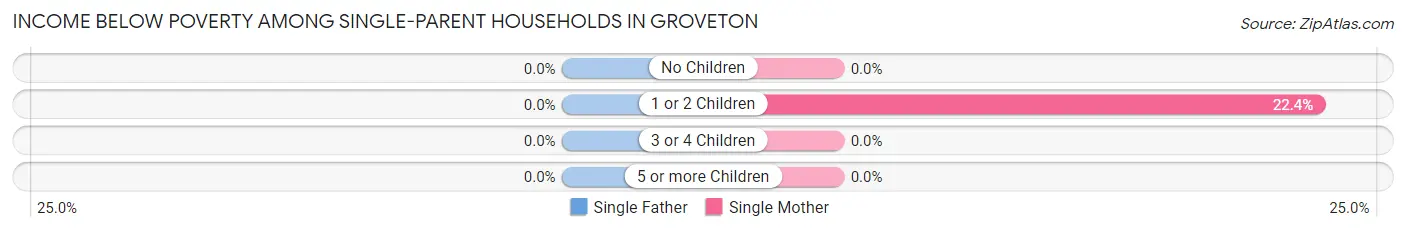
| Children | Single Father | Single Mother |
| No Children | 0 (0.0%) | 0 (0.0%) |
| 1 or 2 Children | 0 (0.0%) | 13 (22.4%) |
| 3 or 4 Children | 0 (0.0%) | 0 (0.0%) |
| 5 or more Children | 0 (0.0%) | 0 (0.0%) |
| Total | 0 (0.0%) | 13 (17.6%) |
Income Below Poverty Among Married-Couple vs Single-Parent Households in Groveton
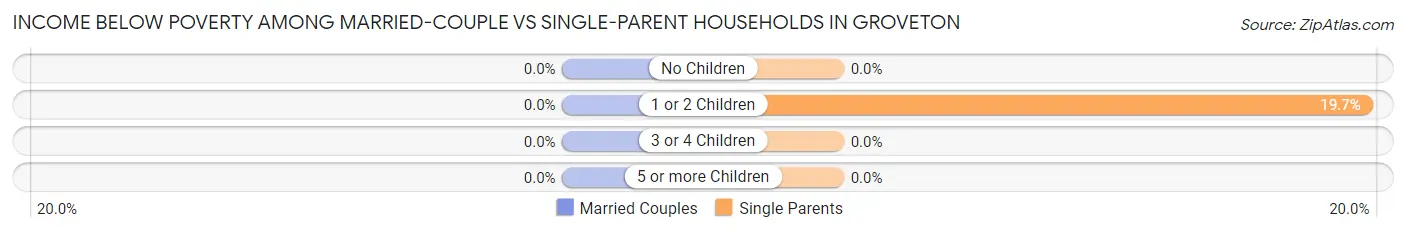
| Children | Married-Couple Families | Single-Parent Households |
| No Children | 0 (0.0%) | 0 (0.0%) |
| 1 or 2 Children | 0 (0.0%) | 13 (19.7%) |
| 3 or 4 Children | 0 (0.0%) | 0 (0.0%) |
| 5 or more Children | 0 (0.0%) | 0 (0.0%) |
| Total | 0 (0.0%) | 13 (13.7%) |
Race in Groveton
The most populous races in Groveton are White / Caucasian (772 | 92.0%), Two or more Races (54 | 6.4%), and Asian (13 | 1.5%).
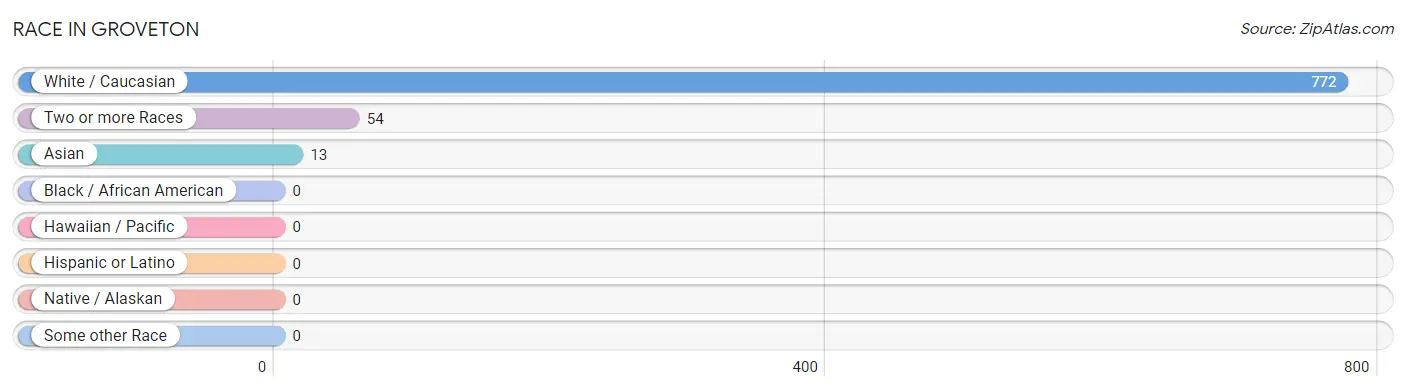
| Race | # Population | % Population |
| Asian | 13 | 1.5% |
| Black / African American | 0 | 0.0% |
| Hawaiian / Pacific | 0 | 0.0% |
| Hispanic or Latino | 0 | 0.0% |
| Native / Alaskan | 0 | 0.0% |
| White / Caucasian | 772 | 92.0% |
| Two or more Races | 54 | 6.4% |
| Some other Race | 0 | 0.0% |
| Total | 839 | 100.0% |
Ancestry in Groveton
The most populous ancestries reported in Groveton are French (112 | 13.4%), American (109 | 13.0%), Irish (105 | 12.5%), English (71 | 8.5%), and French Canadian (55 | 6.6%), together accounting for 53.9% of all Groveton residents.
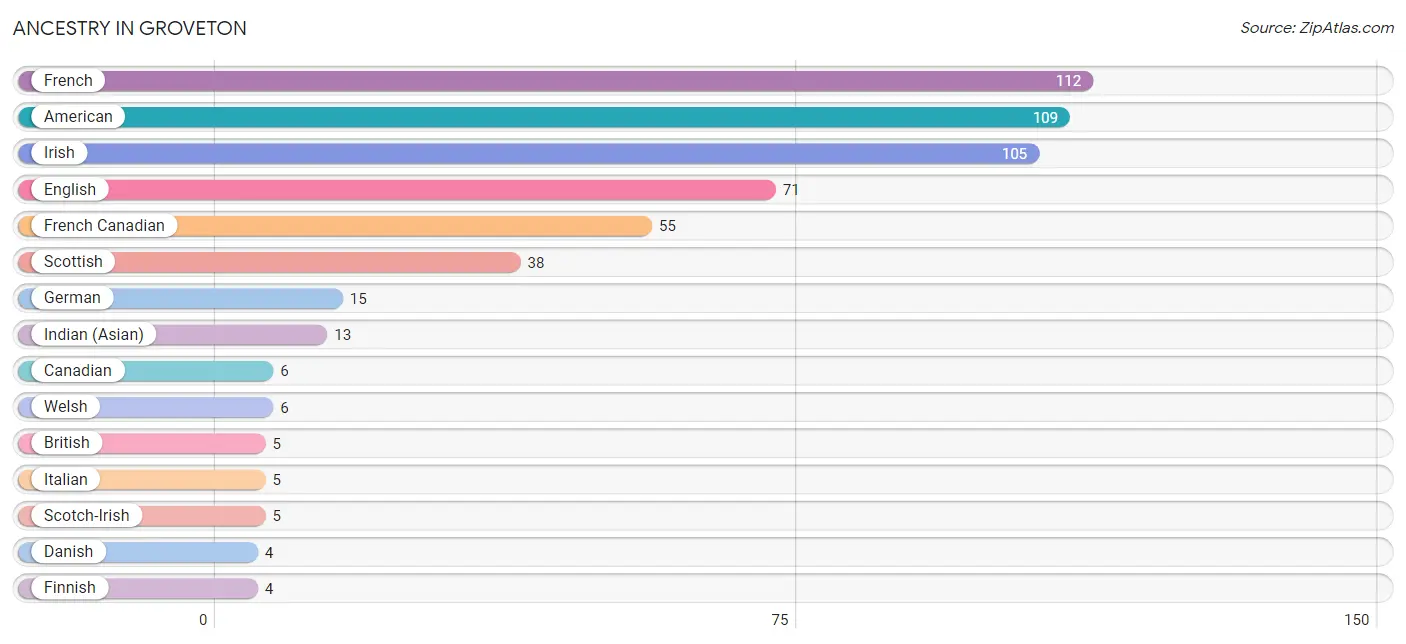
| Ancestry | # Population | % Population |
| American | 109 | 13.0% |
| British | 5 | 0.6% |
| Canadian | 6 | 0.7% |
| Danish | 4 | 0.5% |
| English | 71 | 8.5% |
| Finnish | 4 | 0.5% |
| French | 112 | 13.4% |
| French Canadian | 55 | 6.6% |
| German | 15 | 1.8% |
| Indian (Asian) | 13 | 1.5% |
| Irish | 105 | 12.5% |
| Iroquois | 2 | 0.2% |
| Italian | 5 | 0.6% |
| Scotch-Irish | 5 | 0.6% |
| Scottish | 38 | 4.5% |
| Welsh | 6 | 0.7% | View All 16 Rows |
Immigrants in Groveton
The most numerous immigrant groups reported in Groveton came from Brazil (19 | 2.3%), Latin America (19 | 2.3%), South America (19 | 2.3%), and Oceania (14 | 1.7%), together accounting for 8.4% of all Groveton residents.
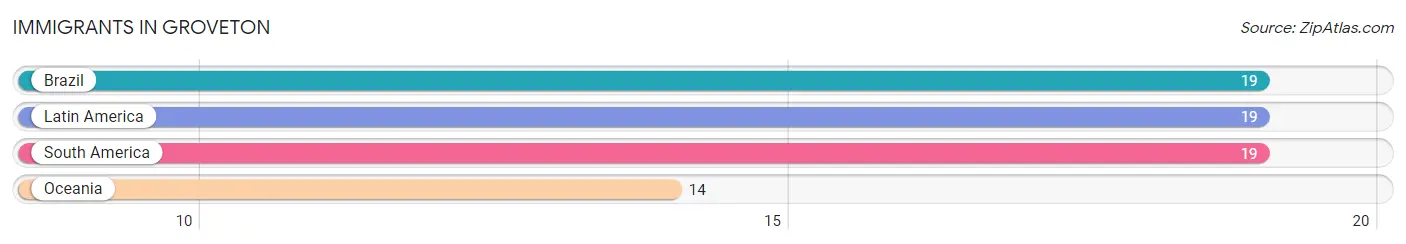
| Immigration Origin | # Population | % Population |
| Brazil | 19 | 2.3% |
| Latin America | 19 | 2.3% |
| Oceania | 14 | 1.7% |
| South America | 19 | 2.3% | View All 4 Rows |
Sex and Age in Groveton
Sex and Age in Groveton
The most populous age groups in Groveton are 20 to 24 Years (57 | 15.1%) for men and Under 5 Years (57 | 12.4%) for women.
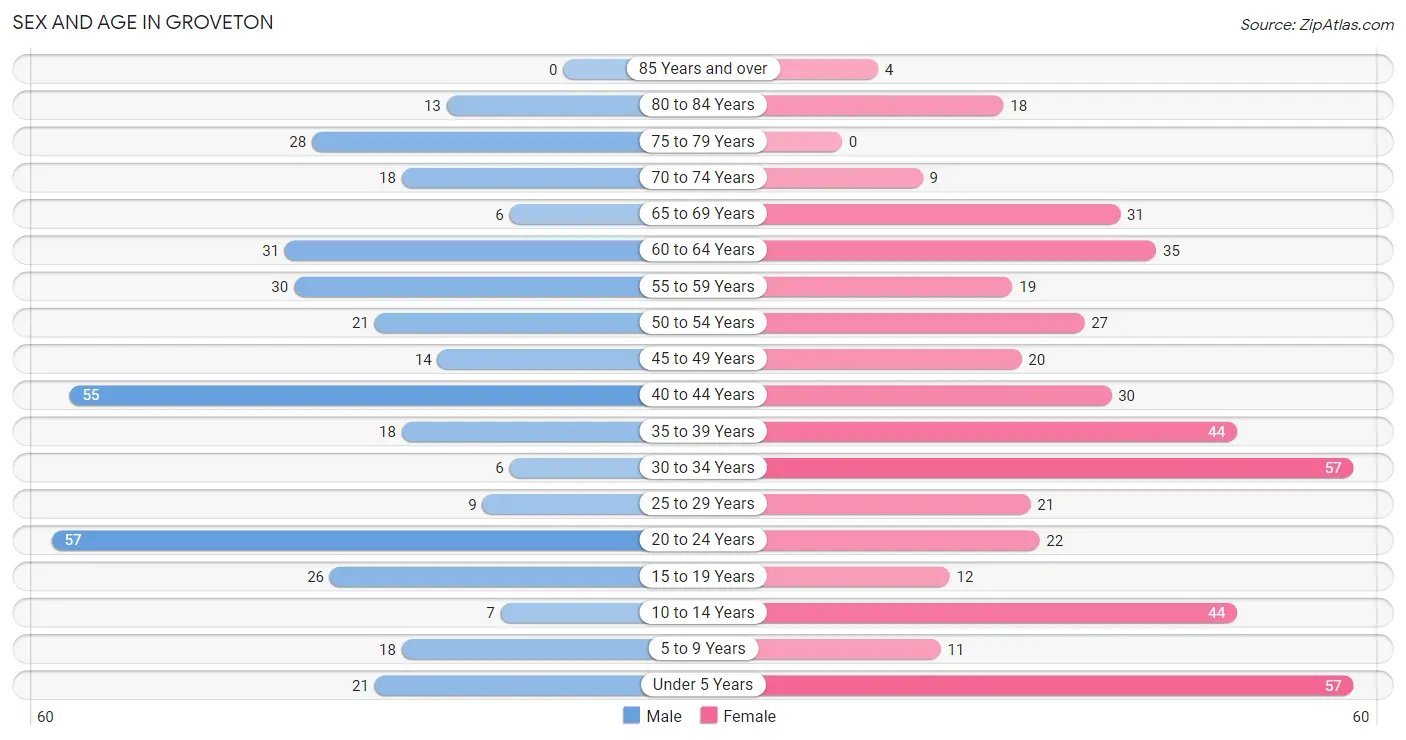
| Age Bracket | Male | Female |
| Under 5 Years | 21 (5.6%) | 57 (12.4%) |
| 5 to 9 Years | 18 (4.8%) | 11 (2.4%) |
| 10 to 14 Years | 7 (1.8%) | 44 (9.5%) |
| 15 to 19 Years | 26 (6.9%) | 12 (2.6%) |
| 20 to 24 Years | 57 (15.1%) | 22 (4.8%) |
| 25 to 29 Years | 9 (2.4%) | 21 (4.6%) |
| 30 to 34 Years | 6 (1.6%) | 57 (12.4%) |
| 35 to 39 Years | 18 (4.8%) | 44 (9.5%) |
| 40 to 44 Years | 55 (14.5%) | 30 (6.5%) |
| 45 to 49 Years | 14 (3.7%) | 20 (4.3%) |
| 50 to 54 Years | 21 (5.6%) | 27 (5.9%) |
| 55 to 59 Years | 30 (7.9%) | 19 (4.1%) |
| 60 to 64 Years | 31 (8.2%) | 35 (7.6%) |
| 65 to 69 Years | 6 (1.6%) | 31 (6.7%) |
| 70 to 74 Years | 18 (4.8%) | 9 (1.9%) |
| 75 to 79 Years | 28 (7.4%) | 0 (0.0%) |
| 80 to 84 Years | 13 (3.4%) | 18 (3.9%) |
| 85 Years and over | 0 (0.0%) | 4 (0.9%) |
| Total | 378 (100.0%) | 461 (100.0%) |
Families and Households in Groveton
Median Family Size in Groveton
The median family size in Groveton is 2.68 persons per family, with married-couple families (133 | 58.3%) accounting for the largest median family size of 2.86 persons per family. On the other hand, single male/father families (21 | 9.2%) represent the smallest median family size with 1.90 persons per family.
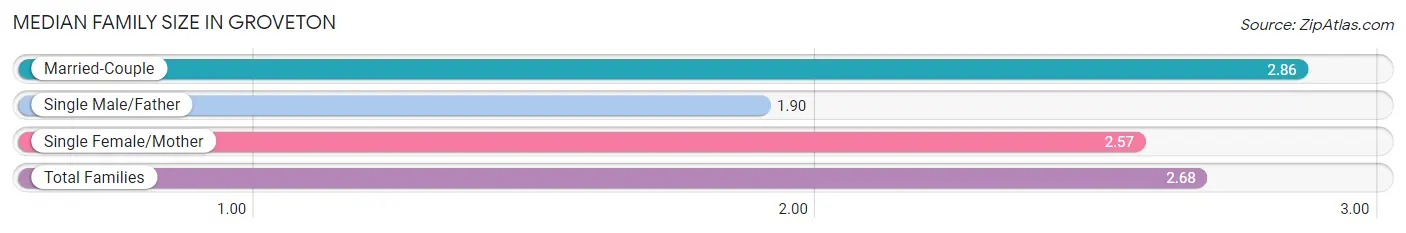
| Family Type | # Families | Family Size |
| Married-Couple | 133 (58.3%) | 2.86 |
| Single Male/Father | 21 (9.2%) | 1.90 |
| Single Female/Mother | 74 (32.5%) | 2.57 |
| Total Families | 228 (100.0%) | 2.68 |
Median Household Size in Groveton
The median household size in Groveton is 2.32 persons per household, with married-couple households (133 | 36.7%) accounting for the largest median household size of 2.9 persons per household. non-family households (134 | 37.0%) represent the smallest median household size with 1.38 persons per household.
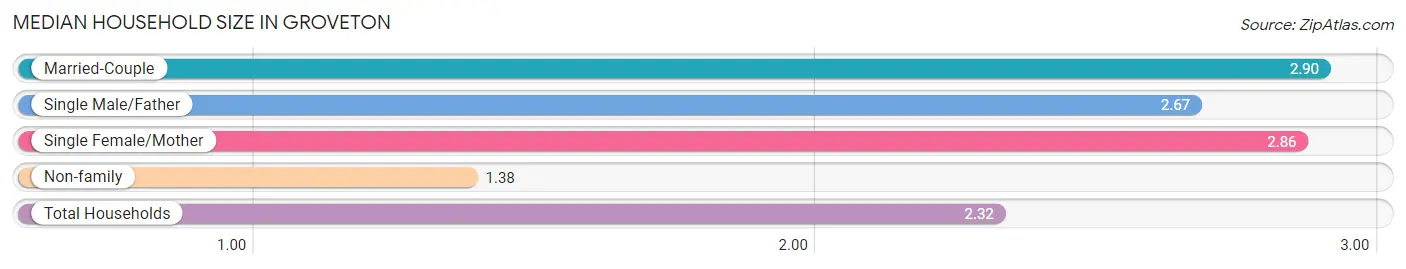
| Household Type | # Households | Household Size |
| Married-Couple | 133 (36.7%) | 2.90 |
| Single Male/Father | 21 (5.8%) | 2.67 |
| Single Female/Mother | 74 (20.4%) | 2.86 |
| Non-family | 134 (37.0%) | 1.38 |
| Total Households | 362 (100.0%) | 2.32 |
Household Size by Marriage Status in Groveton
Out of a total of 362 households in Groveton, 228 (63.0%) are family households, while 134 (37.0%) are nonfamily households. The most numerous type of family households are 2-person households, comprising 99, and the most common type of nonfamily households are 1-person households, comprising 103.
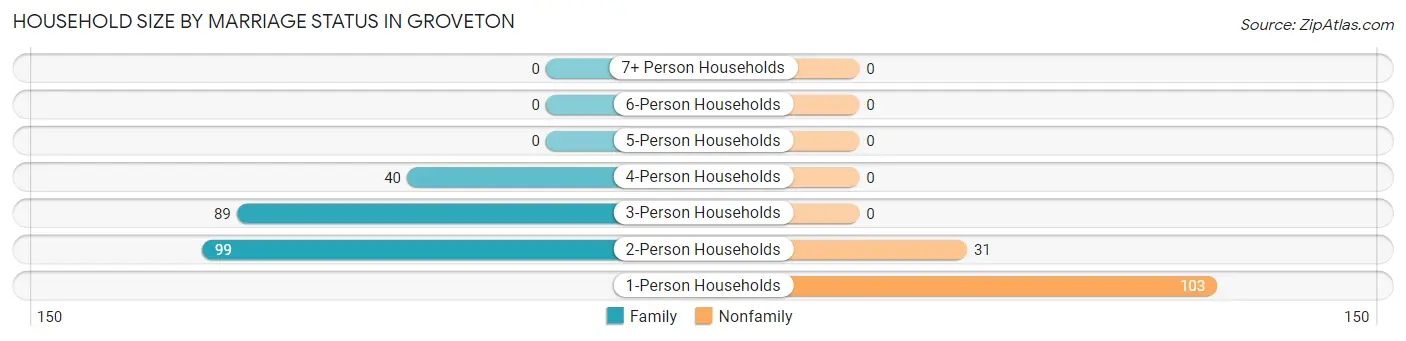
| Household Size | Family Households | Nonfamily Households |
| 1-Person Households | - | 103 (28.4%) |
| 2-Person Households | 99 (27.4%) | 31 (8.6%) |
| 3-Person Households | 89 (24.6%) | 0 (0.0%) |
| 4-Person Households | 40 (11.1%) | 0 (0.0%) |
| 5-Person Households | 0 (0.0%) | 0 (0.0%) |
| 6-Person Households | 0 (0.0%) | 0 (0.0%) |
| 7+ Person Households | 0 (0.0%) | 0 (0.0%) |
| Total | 228 (63.0%) | 134 (37.0%) |
Female Fertility in Groveton
Fertility by Age in Groveton
Average fertility rate in Groveton is 104.0 births per 1,000 women. Women in the age bracket of 20 to 34 years have the highest fertility rate with 220.0 births per 1,000 women. Women in the age bracket of 20 to 34 years acount for 100.0% of all women with births.
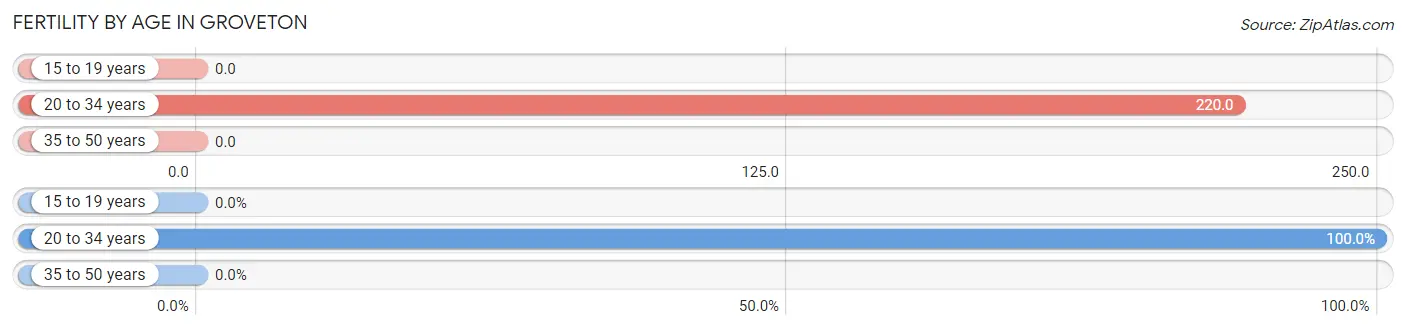
| Age Bracket | Women with Births | Births / 1,000 Women |
| 15 to 19 years | 0 (0.0%) | 0.0 |
| 20 to 34 years | 22 (100.0%) | 220.0 |
| 35 to 50 years | 0 (0.0%) | 0.0 |
| Total | 22 (100.0%) | 104.0 |
Fertility by Age by Marriage Status in Groveton
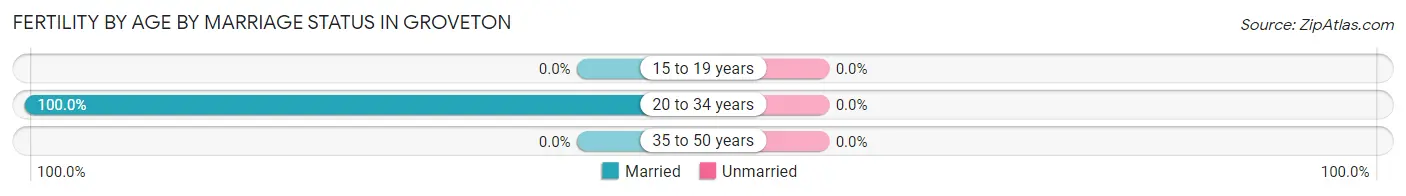
| Age Bracket | Married | Unmarried |
| 15 to 19 years | 0 (0.0%) | 0 (0.0%) |
| 20 to 34 years | 22 (100.0%) | 0 (0.0%) |
| 35 to 50 years | 0 (0.0%) | 0 (0.0%) |
| Total | 22 (100.0%) | 0 (0.0%) |
Fertility by Education in Groveton
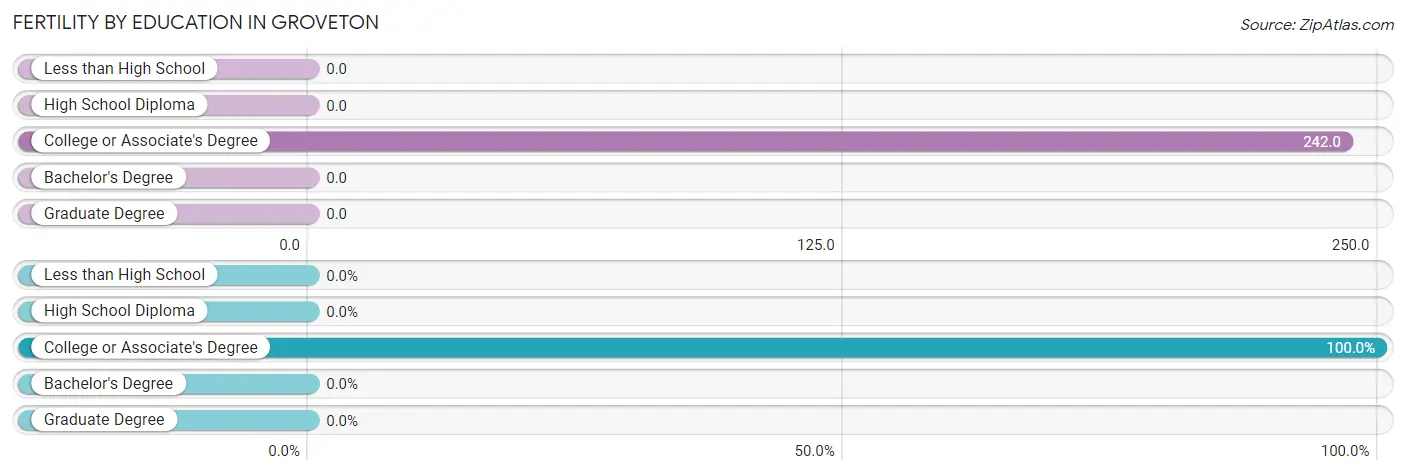
| Educational Attainment | Women with Births | Births / 1,000 Women |
| Less than High School | 0 (0.0%) | 0.0 |
| High School Diploma | 0 (0.0%) | 0.0 |
| College or Associate's Degree | 22 (100.0%) | 242.0 |
| Bachelor's Degree | 0 (0.0%) | 0.0 |
| Graduate Degree | 0 (0.0%) | 0.0 |
| Total | 22 (100.0%) | 104.0 |
Fertility by Education by Marriage Status in Groveton
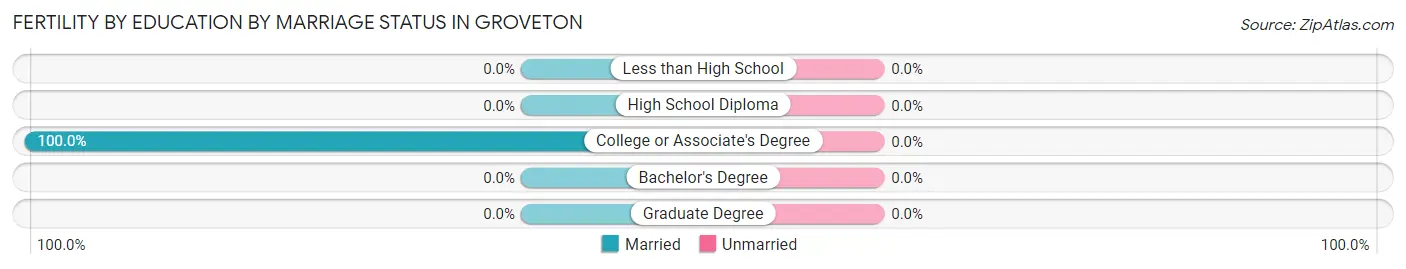
| Educational Attainment | Married | Unmarried |
| Less than High School | 0 (0.0%) | 0 (0.0%) |
| High School Diploma | 0 (0.0%) | 0 (0.0%) |
| College or Associate's Degree | 22 (100.0%) | 0 (0.0%) |
| Bachelor's Degree | 0 (0.0%) | 0 (0.0%) |
| Graduate Degree | 0 (0.0%) | 0 (0.0%) |
| Total | 22 (100.0%) | 0 (0.0%) |
Employment Characteristics in Groveton
Employment by Class of Employer in Groveton
Among the 344 employed individuals in Groveton, private company employees (207 | 60.2%), not-for-profit organizations (54 | 15.7%), and state government employees (41 | 11.9%) make up the most common classes of employment.
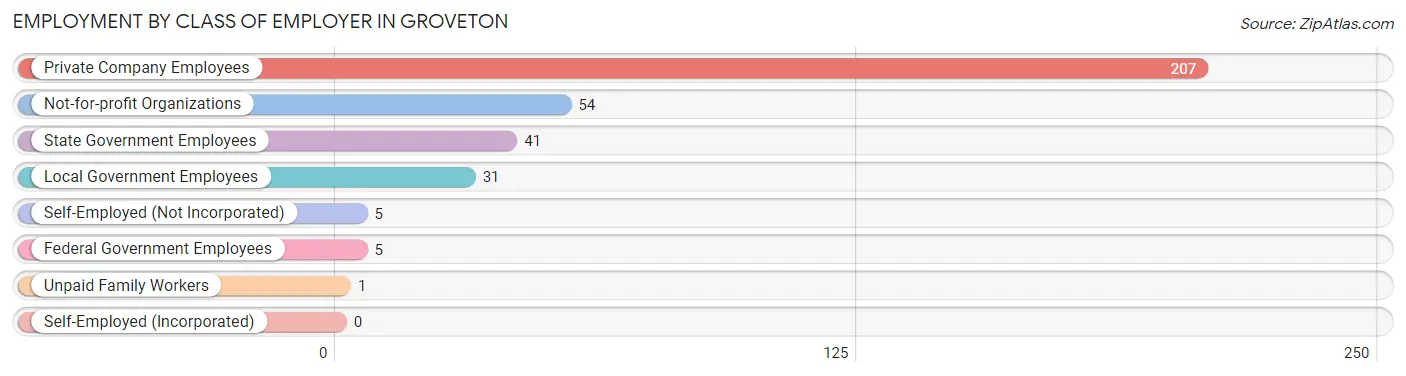
| Employer Class | # Employees | % Employees |
| Private Company Employees | 207 | 60.2% |
| Self-Employed (Incorporated) | 0 | 0.0% |
| Self-Employed (Not Incorporated) | 5 | 1.5% |
| Not-for-profit Organizations | 54 | 15.7% |
| Local Government Employees | 31 | 9.0% |
| State Government Employees | 41 | 11.9% |
| Federal Government Employees | 5 | 1.5% |
| Unpaid Family Workers | 1 | 0.3% |
| Total | 344 | 100.0% |
Employment Status by Age in Groveton
According to the labor force statistics for Groveton, out of the total population over 16 years of age (673), 60.9% or 410 individuals are in the labor force, with 3.7% or 15 of them unemployed. The age group with the highest labor force participation rate is 20 to 24 years, with 93.7% or 74 individuals in the labor force. Within the labor force, the 16 to 19 years age range has the highest percentage of unemployed individuals, with 100.0% or 9 of them being unemployed.
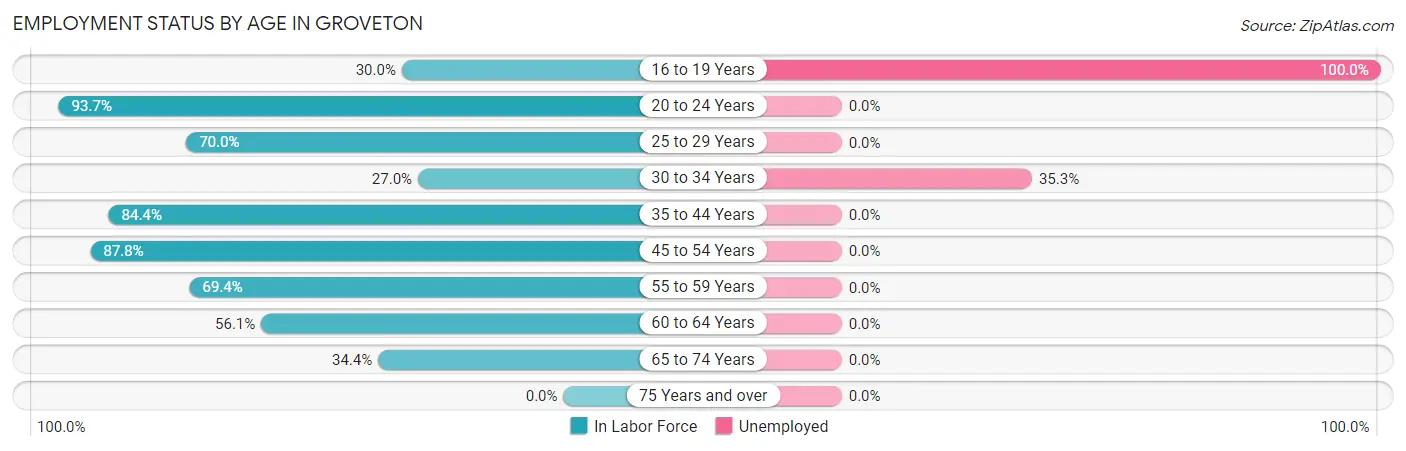
| Age Bracket | In Labor Force | Unemployed |
| 16 to 19 Years | 9 (30.0%) | 9 (100.0%) |
| 20 to 24 Years | 74 (93.7%) | 0 (0.0%) |
| 25 to 29 Years | 21 (70.0%) | 0 (0.0%) |
| 30 to 34 Years | 17 (27.0%) | 6 (35.3%) |
| 35 to 44 Years | 124 (84.4%) | 0 (0.0%) |
| 45 to 54 Years | 72 (87.8%) | 0 (0.0%) |
| 55 to 59 Years | 34 (69.4%) | 0 (0.0%) |
| 60 to 64 Years | 37 (56.1%) | 0 (0.0%) |
| 65 to 74 Years | 22 (34.4%) | 0 (0.0%) |
| 75 Years and over | 0 (0.0%) | 0 (0.0%) |
| Total | 410 (60.9%) | 15 (3.7%) |
Employment Status by Educational Attainment in Groveton
According to labor force statistics for Groveton, 69.8% of individuals (305) out of the total population between 25 and 64 years of age (437) are in the labor force, with 2.0% or 6 of them being unemployed. The group with the highest labor force participation rate are those with the educational attainment of bachelor's degree or higher, with 87.8% or 36 individuals in the labor force. Within the labor force, individuals with less than high school education have the highest percentage of unemployment, with 16.2% or 6 of them being unemployed.
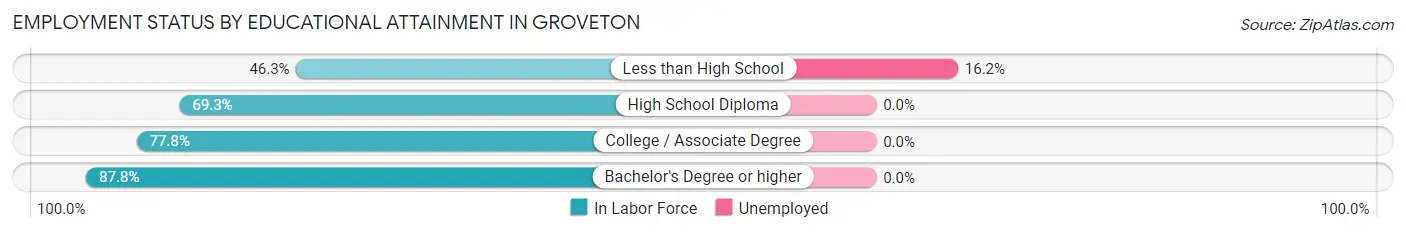
| Educational Attainment | In Labor Force | Unemployed |
| Less than High School | 37 (46.3%) | 13 (16.2%) |
| High School Diploma | 113 (69.3%) | 0 (0.0%) |
| College / Associate Degree | 119 (77.8%) | 0 (0.0%) |
| Bachelor's Degree or higher | 36 (87.8%) | 0 (0.0%) |
| Total | 305 (69.8%) | 9 (2.0%) |
Employment Occupations by Sex in Groveton
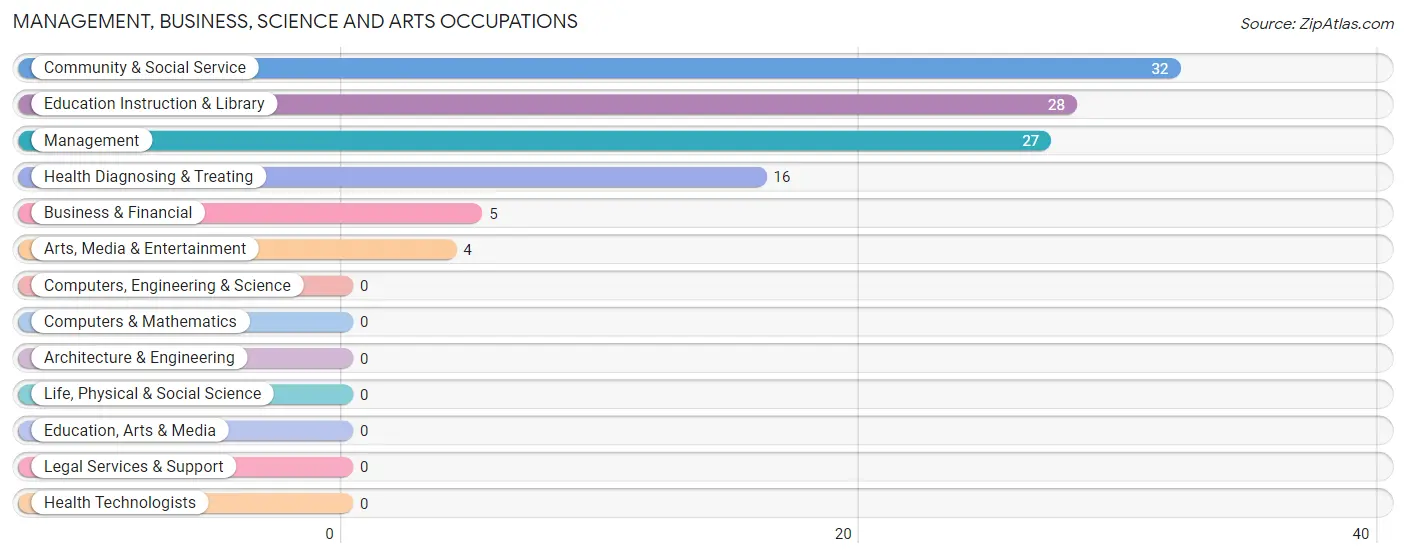
Management, Business, Science and Arts Occupations
The most common Management, Business, Science and Arts occupations in Groveton are Community & Social Service (32 | 8.1%), Education Instruction & Library (28 | 7.1%), Management (27 | 6.8%), Health Diagnosing & Treating (16 | 4.1%), and Business & Financial (5 | 1.3%).
Management, Business, Science and Arts Occupations by Sex
Within the Management, Business, Science and Arts occupations in Groveton, the most male-oriented occupations are Arts, Media & Entertainment (100.0%), Management (85.2%), and Community & Social Service (12.5%), while the most female-oriented occupations are Business & Financial (100.0%), Education Instruction & Library (100.0%), and Health Diagnosing & Treating (100.0%).
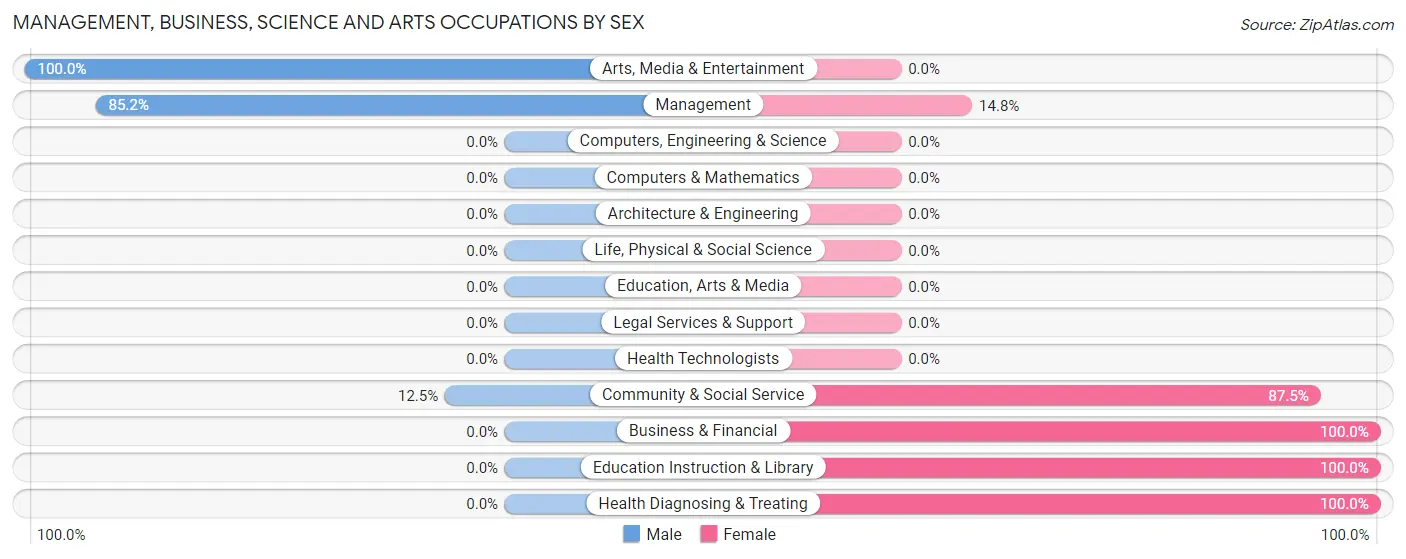
| Occupation | Male | Female |
| Management | 23 (85.2%) | 4 (14.8%) |
| Business & Financial | 0 (0.0%) | 5 (100.0%) |
| Computers, Engineering & Science | 0 (0.0%) | 0 (0.0%) |
| Computers & Mathematics | 0 (0.0%) | 0 (0.0%) |
| Architecture & Engineering | 0 (0.0%) | 0 (0.0%) |
| Life, Physical & Social Science | 0 (0.0%) | 0 (0.0%) |
| Community & Social Service | 4 (12.5%) | 28 (87.5%) |
| Education, Arts & Media | 0 (0.0%) | 0 (0.0%) |
| Legal Services & Support | 0 (0.0%) | 0 (0.0%) |
| Education Instruction & Library | 0 (0.0%) | 28 (100.0%) |
| Arts, Media & Entertainment | 4 (100.0%) | 0 (0.0%) |
| Health Diagnosing & Treating | 0 (0.0%) | 16 (100.0%) |
| Health Technologists | 0 (0.0%) | 0 (0.0%) |
| Total (Category) | 27 (33.8%) | 53 (66.2%) |
| Total (Overall) | 206 (52.1%) | 189 (47.8%) |
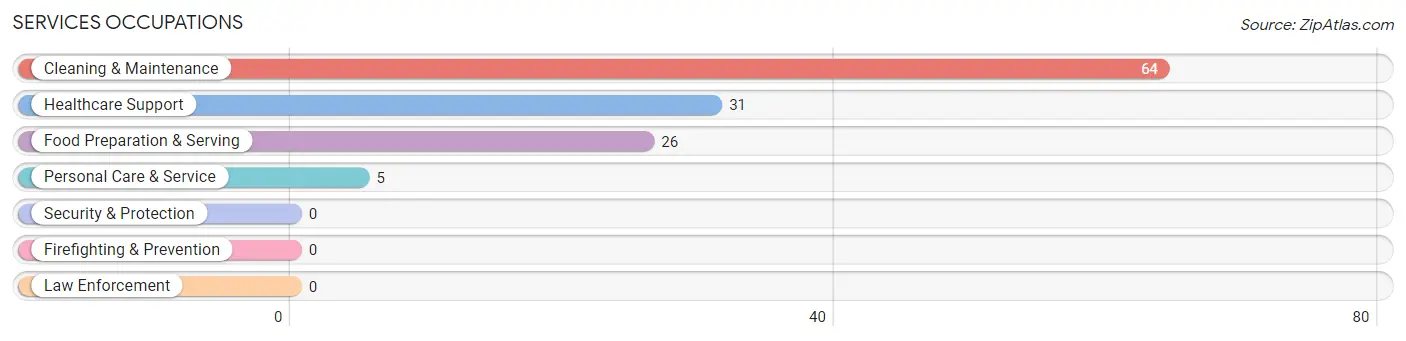
Services Occupations
The most common Services occupations in Groveton are Cleaning & Maintenance (64 | 16.2%), Healthcare Support (31 | 7.9%), Food Preparation & Serving (26 | 6.6%), and Personal Care & Service (5 | 1.3%).
Services Occupations by Sex
Within the Services occupations in Groveton, the most male-oriented occupations are Cleaning & Maintenance (75.0%), and Food Preparation & Serving (3.8%), while the most female-oriented occupations are Healthcare Support (100.0%), Personal Care & Service (100.0%), and Food Preparation & Serving (96.2%).
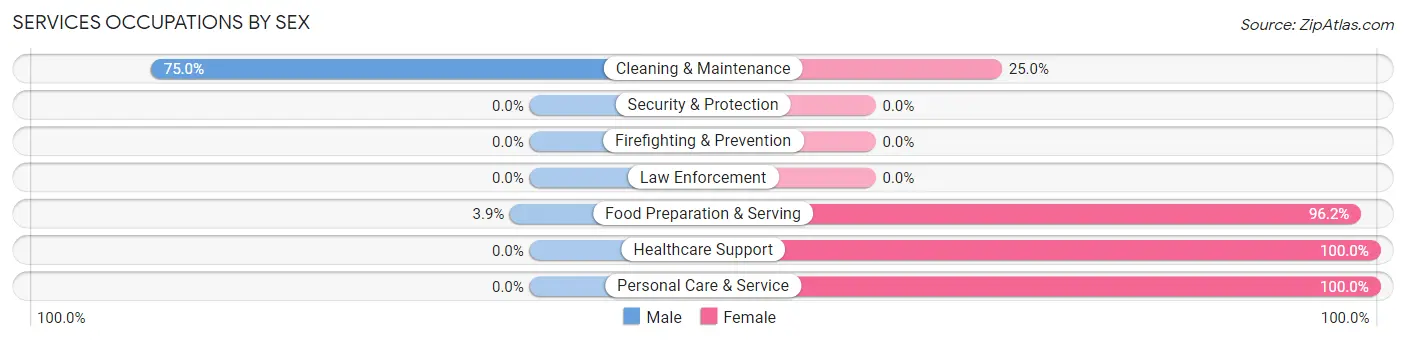
| Occupation | Male | Female |
| Healthcare Support | 0 (0.0%) | 31 (100.0%) |
| Security & Protection | 0 (0.0%) | 0 (0.0%) |
| Firefighting & Prevention | 0 (0.0%) | 0 (0.0%) |
| Law Enforcement | 0 (0.0%) | 0 (0.0%) |
| Food Preparation & Serving | 1 (3.8%) | 25 (96.2%) |
| Cleaning & Maintenance | 48 (75.0%) | 16 (25.0%) |
| Personal Care & Service | 0 (0.0%) | 5 (100.0%) |
| Total (Category) | 49 (38.9%) | 77 (61.1%) |
| Total (Overall) | 206 (52.1%) | 189 (47.8%) |
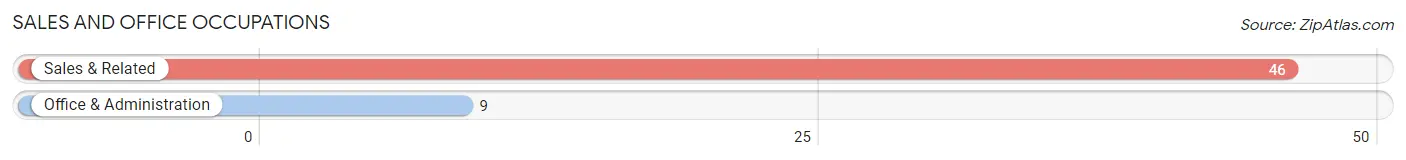
Sales and Office Occupations
The most common Sales and Office occupations in Groveton are Sales & Related (46 | 11.7%), and Office & Administration (9 | 2.3%).
Sales and Office Occupations by Sex
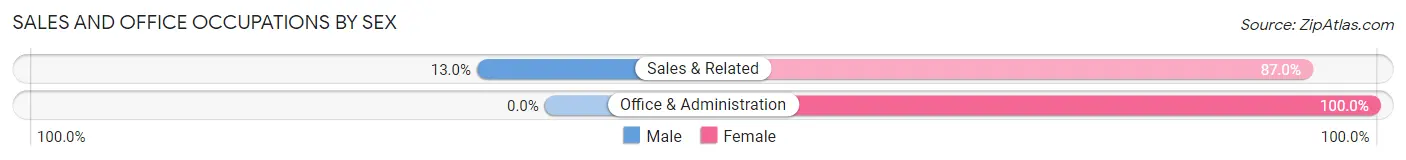
| Occupation | Male | Female |
| Sales & Related | 6 (13.0%) | 40 (87.0%) |
| Office & Administration | 0 (0.0%) | 9 (100.0%) |
| Total (Category) | 6 (10.9%) | 49 (89.1%) |
| Total (Overall) | 206 (52.1%) | 189 (47.8%) |
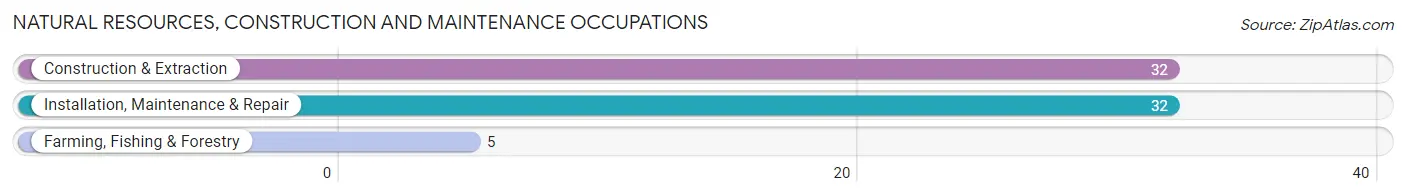
Natural Resources, Construction and Maintenance Occupations
The most common Natural Resources, Construction and Maintenance occupations in Groveton are Construction & Extraction (32 | 8.1%), Installation, Maintenance & Repair (32 | 8.1%), and Farming, Fishing & Forestry (5 | 1.3%).
Natural Resources, Construction and Maintenance Occupations by Sex
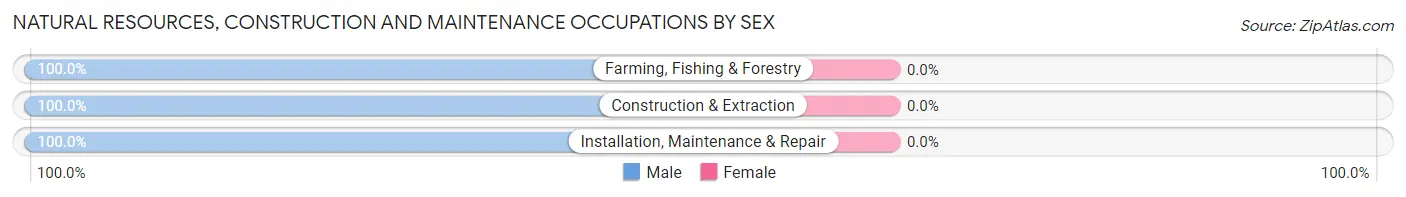
| Occupation | Male | Female |
| Farming, Fishing & Forestry | 5 (100.0%) | 0 (0.0%) |
| Construction & Extraction | 32 (100.0%) | 0 (0.0%) |
| Installation, Maintenance & Repair | 32 (100.0%) | 0 (0.0%) |
| Total (Category) | 69 (100.0%) | 0 (0.0%) |
| Total (Overall) | 206 (52.1%) | 189 (47.8%) |
Production, Transportation and Moving Occupations
The most common Production, Transportation and Moving occupations in Groveton are Production (49 | 12.4%), Material Moving (10 | 2.5%), and Transportation (6 | 1.5%).
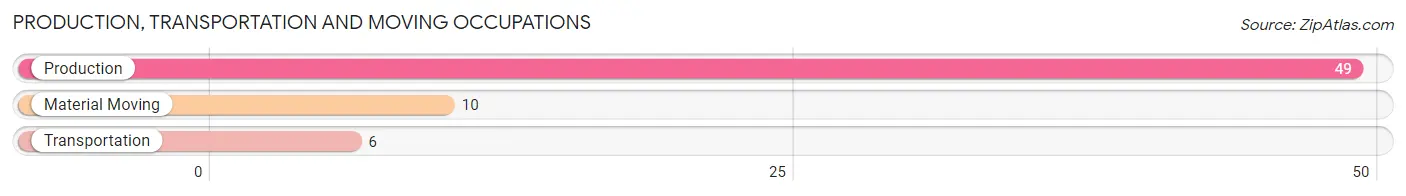
Production, Transportation and Moving Occupations by Sex
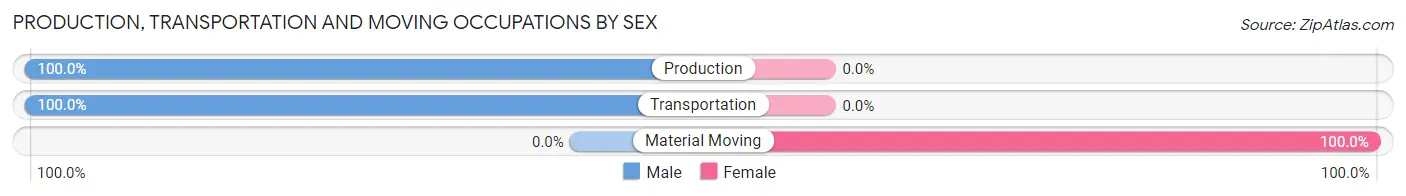
| Occupation | Male | Female |
| Production | 49 (100.0%) | 0 (0.0%) |
| Transportation | 6 (100.0%) | 0 (0.0%) |
| Material Moving | 0 (0.0%) | 10 (100.0%) |
| Total (Category) | 55 (84.6%) | 10 (15.4%) |
| Total (Overall) | 206 (52.1%) | 189 (47.8%) |
Employment Industries by Sex in Groveton
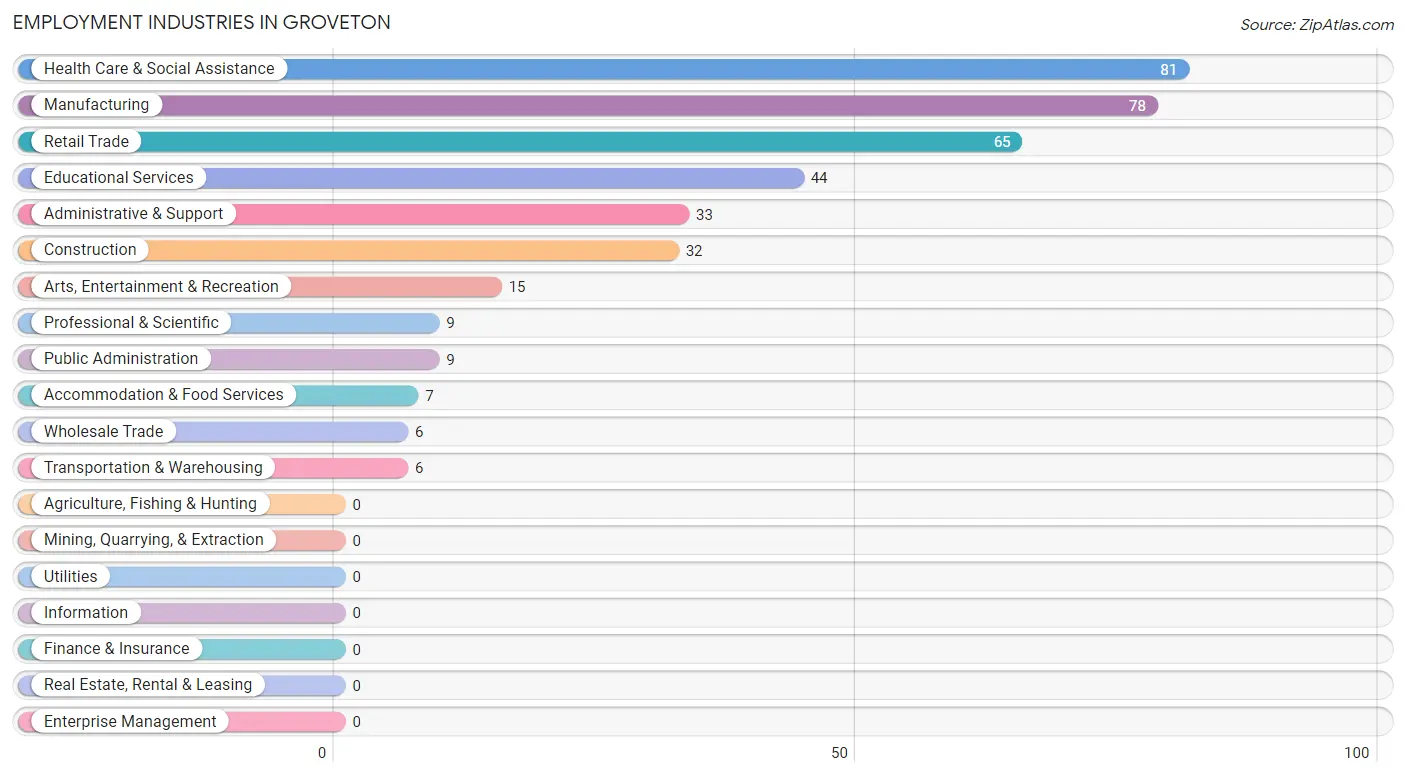
Employment Industries in Groveton
The major employment industries in Groveton include Health Care & Social Assistance (81 | 20.5%), Manufacturing (78 | 19.8%), Retail Trade (65 | 16.5%), Educational Services (44 | 11.1%), and Administrative & Support (33 | 8.4%).
Employment Industries by Sex in Groveton
The Groveton industries that see more men than women are Construction (100.0%), Wholesale Trade (100.0%), and Transportation & Warehousing (100.0%), whereas the industries that tend to have a higher number of women are Health Care & Social Assistance (100.0%), Public Administration (100.0%), and Educational Services (72.7%).
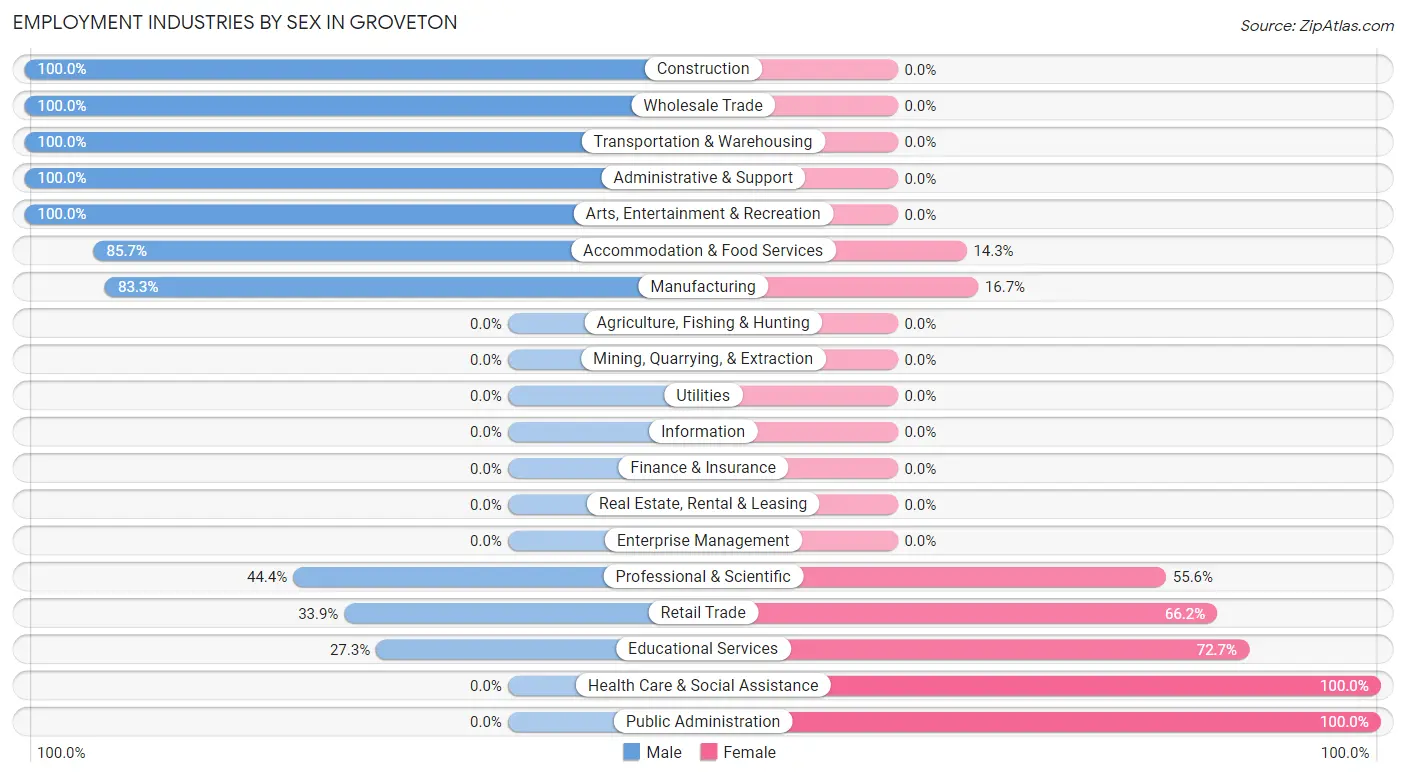
| Industry | Male | Female |
| Agriculture, Fishing & Hunting | 0 (0.0%) | 0 (0.0%) |
| Mining, Quarrying, & Extraction | 0 (0.0%) | 0 (0.0%) |
| Construction | 32 (100.0%) | 0 (0.0%) |
| Manufacturing | 65 (83.3%) | 13 (16.7%) |
| Wholesale Trade | 6 (100.0%) | 0 (0.0%) |
| Retail Trade | 22 (33.9%) | 43 (66.1%) |
| Transportation & Warehousing | 6 (100.0%) | 0 (0.0%) |
| Utilities | 0 (0.0%) | 0 (0.0%) |
| Information | 0 (0.0%) | 0 (0.0%) |
| Finance & Insurance | 0 (0.0%) | 0 (0.0%) |
| Real Estate, Rental & Leasing | 0 (0.0%) | 0 (0.0%) |
| Professional & Scientific | 4 (44.4%) | 5 (55.6%) |
| Enterprise Management | 0 (0.0%) | 0 (0.0%) |
| Administrative & Support | 33 (100.0%) | 0 (0.0%) |
| Educational Services | 12 (27.3%) | 32 (72.7%) |
| Health Care & Social Assistance | 0 (0.0%) | 81 (100.0%) |
| Arts, Entertainment & Recreation | 15 (100.0%) | 0 (0.0%) |
| Accommodation & Food Services | 6 (85.7%) | 1 (14.3%) |
| Public Administration | 0 (0.0%) | 9 (100.0%) |
| Total | 206 (52.1%) | 189 (47.8%) |
Education in Groveton
School Enrollment in Groveton
The most common levels of schooling among the 157 students in Groveton are elementary school (53 | 33.8%), college / undergraduate (35 | 22.3%), and high school (29 | 18.5%).
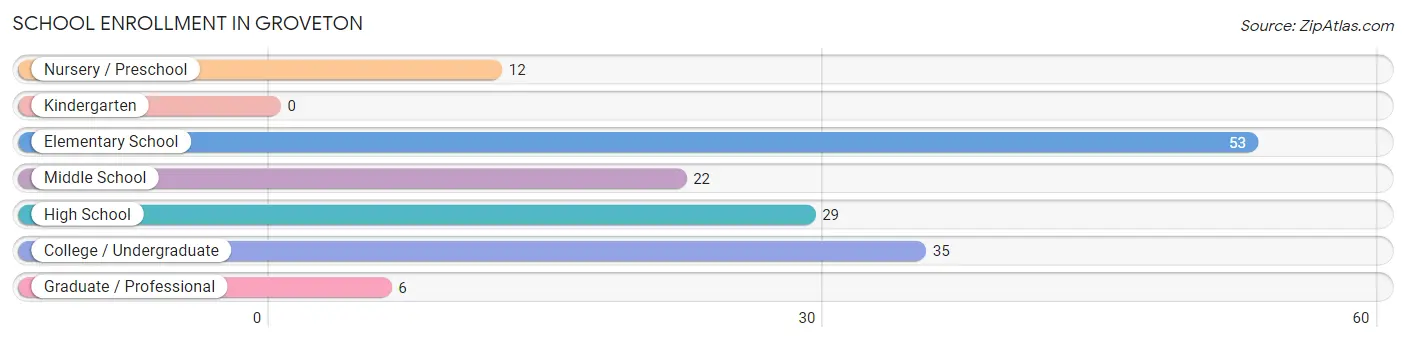
| School Level | # Students | % Students |
| Nursery / Preschool | 12 | 7.6% |
| Kindergarten | 0 | 0.0% |
| Elementary School | 53 | 33.8% |
| Middle School | 22 | 14.0% |
| High School | 29 | 18.5% |
| College / Undergraduate | 35 | 22.3% |
| Graduate / Professional | 6 | 3.8% |
| Total | 157 | 100.0% |
School Enrollment by Age by Funding Source in Groveton
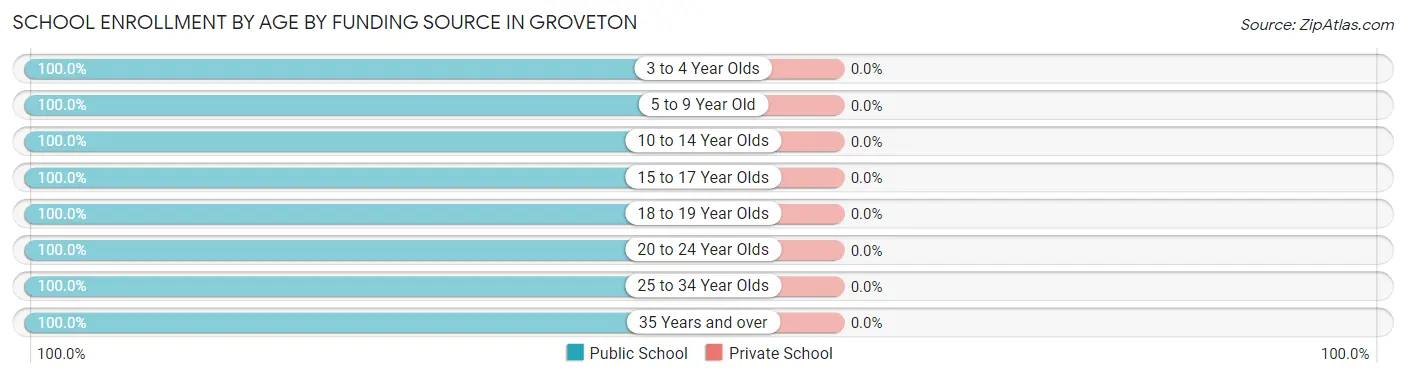
| Age Bracket | Public School | Private School |
| 3 to 4 Year Olds | 12 (100.0%) | 0 (0.0%) |
| 5 to 9 Year Old | 24 (100.0%) | 0 (0.0%) |
| 10 to 14 Year Olds | 51 (100.0%) | 0 (0.0%) |
| 15 to 17 Year Olds | 25 (100.0%) | 0 (0.0%) |
| 18 to 19 Year Olds | 4 (100.0%) | 0 (0.0%) |
| 20 to 24 Year Olds | 22 (100.0%) | 0 (0.0%) |
| 25 to 34 Year Olds | 15 (100.0%) | 0 (0.0%) |
| 35 Years and over | 4 (100.0%) | 0 (0.0%) |
| Total | 157 (100.0%) | 0 (0.0%) |
Educational Attainment by Field of Study in Groveton
Arts & humanities (15 | 32.6%), education (12 | 26.1%), business (9 | 19.6%), literature & languages (5 | 10.9%), and liberal arts & history (5 | 10.9%) are the most common fields of study among 46 individuals in Groveton who have obtained a bachelor's degree or higher.
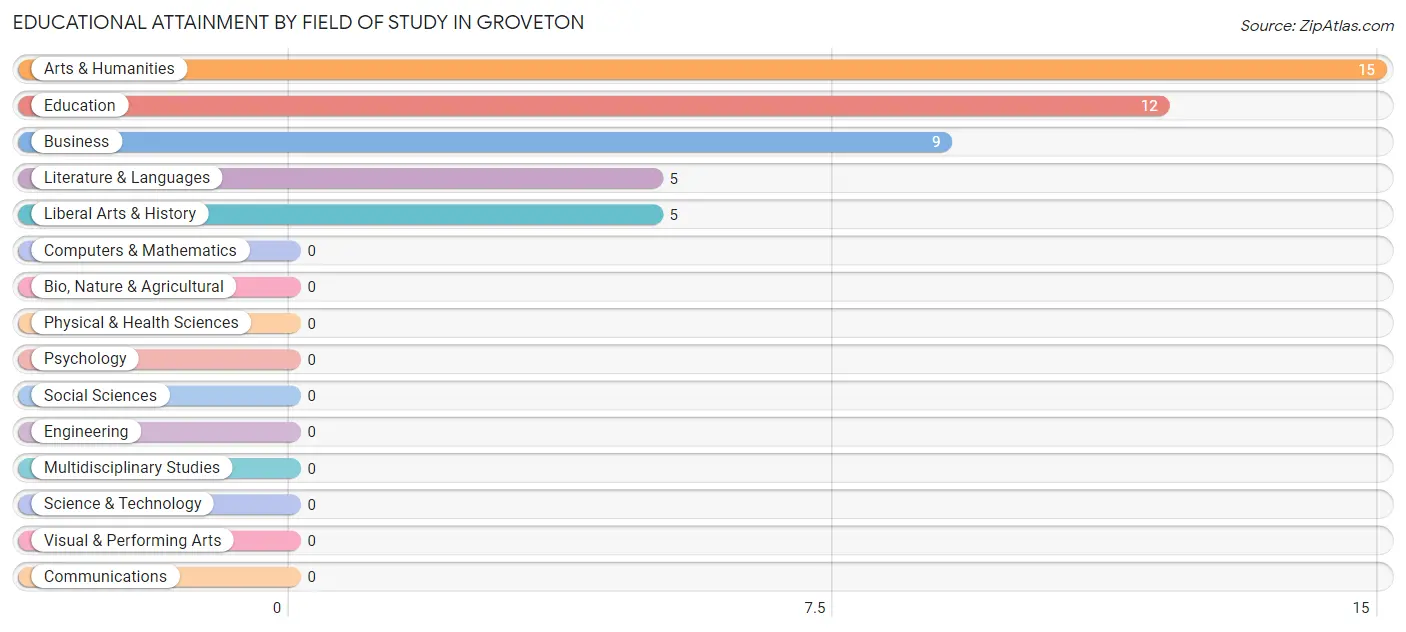
| Field of Study | # Graduates | % Graduates |
| Computers & Mathematics | 0 | 0.0% |
| Bio, Nature & Agricultural | 0 | 0.0% |
| Physical & Health Sciences | 0 | 0.0% |
| Psychology | 0 | 0.0% |
| Social Sciences | 0 | 0.0% |
| Engineering | 0 | 0.0% |
| Multidisciplinary Studies | 0 | 0.0% |
| Science & Technology | 0 | 0.0% |
| Business | 9 | 19.6% |
| Education | 12 | 26.1% |
| Literature & Languages | 5 | 10.9% |
| Liberal Arts & History | 5 | 10.9% |
| Visual & Performing Arts | 0 | 0.0% |
| Communications | 0 | 0.0% |
| Arts & Humanities | 15 | 32.6% |
| Total | 46 | 100.0% |
Transportation & Commute in Groveton
Vehicle Availability by Sex in Groveton
The most prevalent vehicle ownership categories in Groveton are males with 2 vehicles (109, accounting for 59.9%) and females with 2 vehicles (79, making up 67.3%).
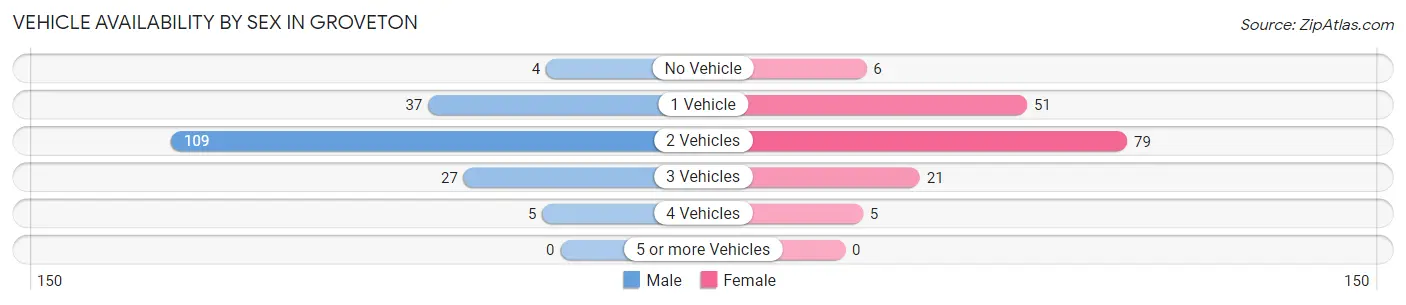
| Vehicles Available | Male | Female |
| No Vehicle | 4 (2.2%) | 6 (3.7%) |
| 1 Vehicle | 37 (20.3%) | 51 (31.5%) |
| 2 Vehicles | 109 (59.9%) | 79 (48.8%) |
| 3 Vehicles | 27 (14.8%) | 21 (13.0%) |
| 4 Vehicles | 5 (2.8%) | 5 (3.1%) |
| 5 or more Vehicles | 0 (0.0%) | 0 (0.0%) |
| Total | 182 (100.0%) | 162 (100.0%) |
Commute Time in Groveton
The most frequently occuring commute durations in Groveton are 20 to 24 minutes (106 commuters, 31.2%), 45 to 59 minutes (44 commuters, 12.9%), and 15 to 19 minutes (42 commuters, 12.3%).
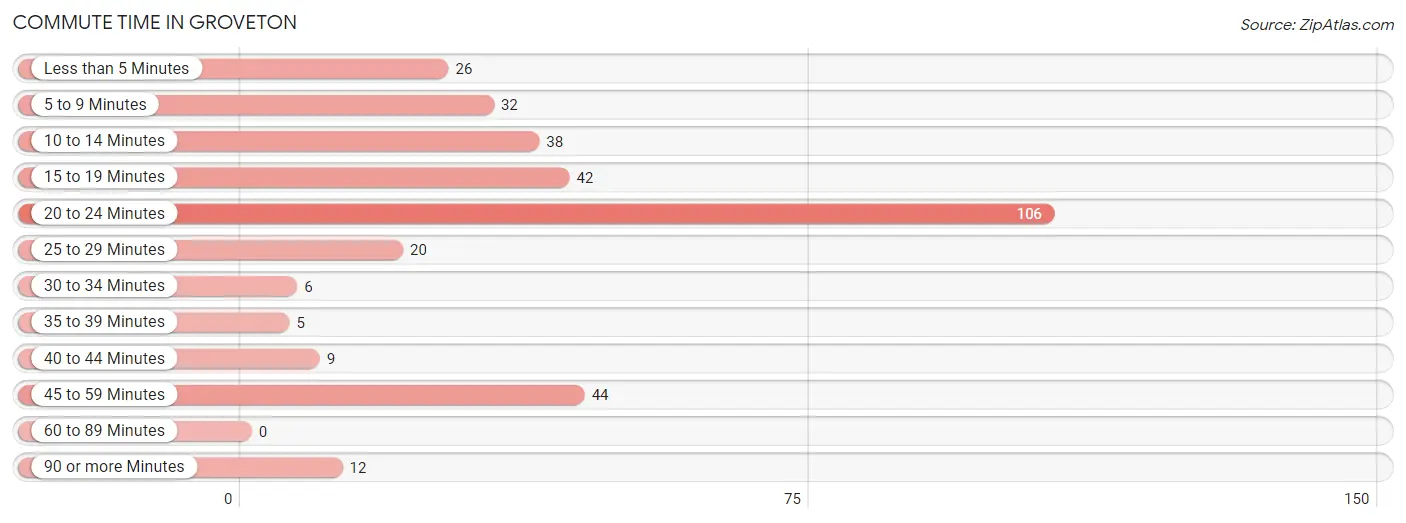
| Commute Time | # Commuters | % Commuters |
| Less than 5 Minutes | 26 | 7.6% |
| 5 to 9 Minutes | 32 | 9.4% |
| 10 to 14 Minutes | 38 | 11.2% |
| 15 to 19 Minutes | 42 | 12.3% |
| 20 to 24 Minutes | 106 | 31.2% |
| 25 to 29 Minutes | 20 | 5.9% |
| 30 to 34 Minutes | 6 | 1.8% |
| 35 to 39 Minutes | 5 | 1.5% |
| 40 to 44 Minutes | 9 | 2.6% |
| 45 to 59 Minutes | 44 | 12.9% |
| 60 to 89 Minutes | 0 | 0.0% |
| 90 or more Minutes | 12 | 3.5% |
Commute Time by Sex in Groveton
The most common commute times in Groveton are 20 to 24 minutes (59 commuters, 33.2%) for males and 20 to 24 minutes (47 commuters, 29.0%) for females.
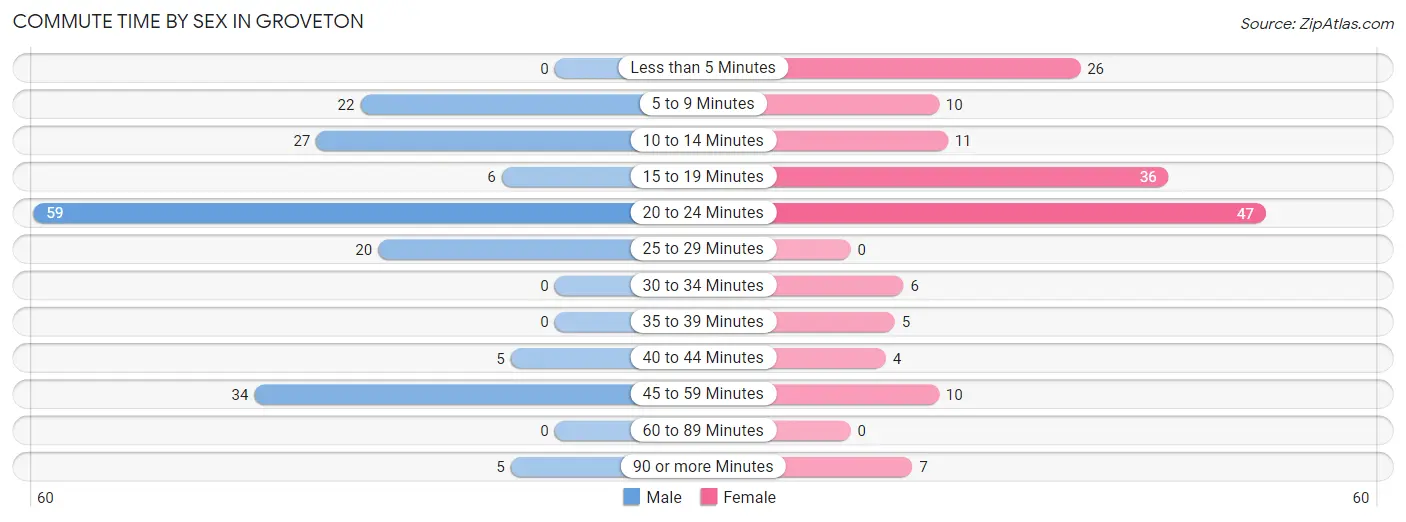
| Commute Time | Male | Female |
| Less than 5 Minutes | 0 (0.0%) | 26 (16.1%) |
| 5 to 9 Minutes | 22 (12.4%) | 10 (6.2%) |
| 10 to 14 Minutes | 27 (15.2%) | 11 (6.8%) |
| 15 to 19 Minutes | 6 (3.4%) | 36 (22.2%) |
| 20 to 24 Minutes | 59 (33.2%) | 47 (29.0%) |
| 25 to 29 Minutes | 20 (11.2%) | 0 (0.0%) |
| 30 to 34 Minutes | 0 (0.0%) | 6 (3.7%) |
| 35 to 39 Minutes | 0 (0.0%) | 5 (3.1%) |
| 40 to 44 Minutes | 5 (2.8%) | 4 (2.5%) |
| 45 to 59 Minutes | 34 (19.1%) | 10 (6.2%) |
| 60 to 89 Minutes | 0 (0.0%) | 0 (0.0%) |
| 90 or more Minutes | 5 (2.8%) | 7 (4.3%) |
Time of Departure to Work by Sex in Groveton
The most frequent times of departure to work in Groveton are 5:30 AM to 5:59 AM (50, 28.1%) for males and 6:30 AM to 6:59 AM (63, 38.9%) for females.
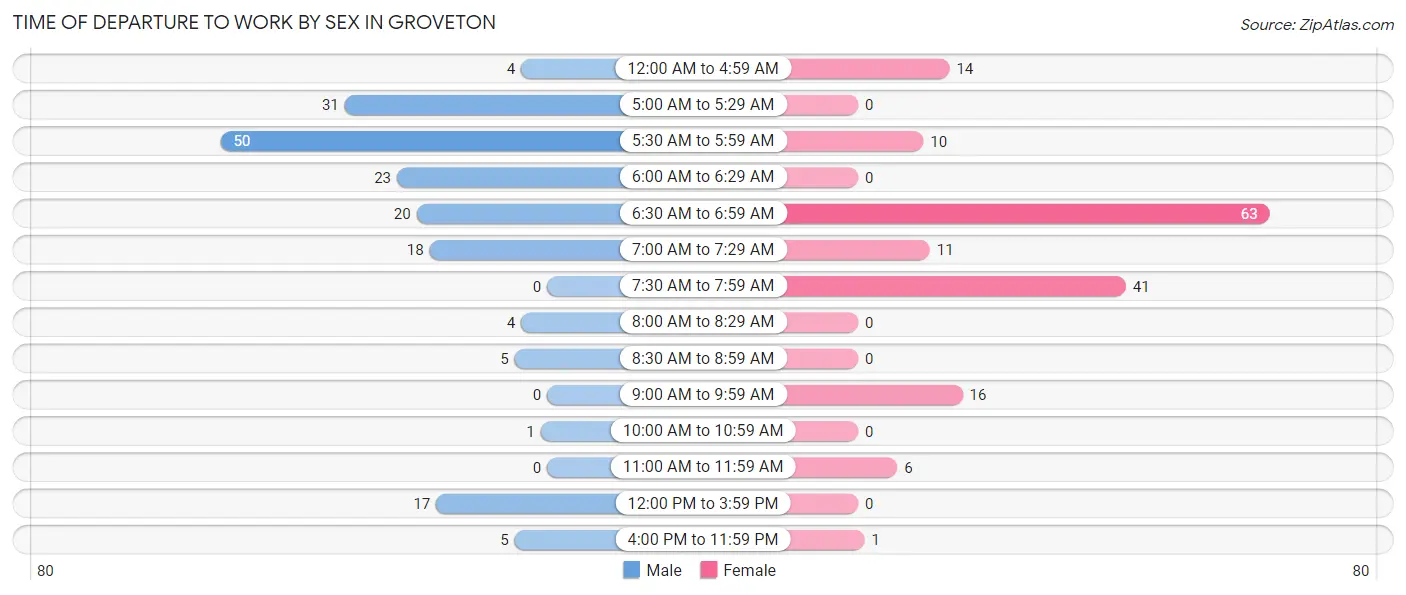
| Time of Departure | Male | Female |
| 12:00 AM to 4:59 AM | 4 (2.2%) | 14 (8.6%) |
| 5:00 AM to 5:29 AM | 31 (17.4%) | 0 (0.0%) |
| 5:30 AM to 5:59 AM | 50 (28.1%) | 10 (6.2%) |
| 6:00 AM to 6:29 AM | 23 (12.9%) | 0 (0.0%) |
| 6:30 AM to 6:59 AM | 20 (11.2%) | 63 (38.9%) |
| 7:00 AM to 7:29 AM | 18 (10.1%) | 11 (6.8%) |
| 7:30 AM to 7:59 AM | 0 (0.0%) | 41 (25.3%) |
| 8:00 AM to 8:29 AM | 4 (2.2%) | 0 (0.0%) |
| 8:30 AM to 8:59 AM | 5 (2.8%) | 0 (0.0%) |
| 9:00 AM to 9:59 AM | 0 (0.0%) | 16 (9.9%) |
| 10:00 AM to 10:59 AM | 1 (0.6%) | 0 (0.0%) |
| 11:00 AM to 11:59 AM | 0 (0.0%) | 6 (3.7%) |
| 12:00 PM to 3:59 PM | 17 (9.6%) | 0 (0.0%) |
| 4:00 PM to 11:59 PM | 5 (2.8%) | 1 (0.6%) |
| Total | 178 (100.0%) | 162 (100.0%) |
Housing Occupancy in Groveton
Occupancy by Ownership in Groveton
Of the total 362 dwellings in Groveton, owner-occupied units account for 202 (55.8%), while renter-occupied units make up 160 (44.2%).
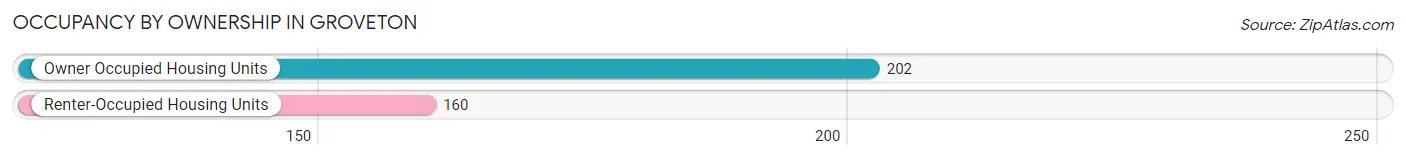
| Occupancy | # Housing Units | % Housing Units |
| Owner Occupied Housing Units | 202 | 55.8% |
| Renter-Occupied Housing Units | 160 | 44.2% |
| Total Occupied Housing Units | 362 | 100.0% |
Occupancy by Household Size in Groveton
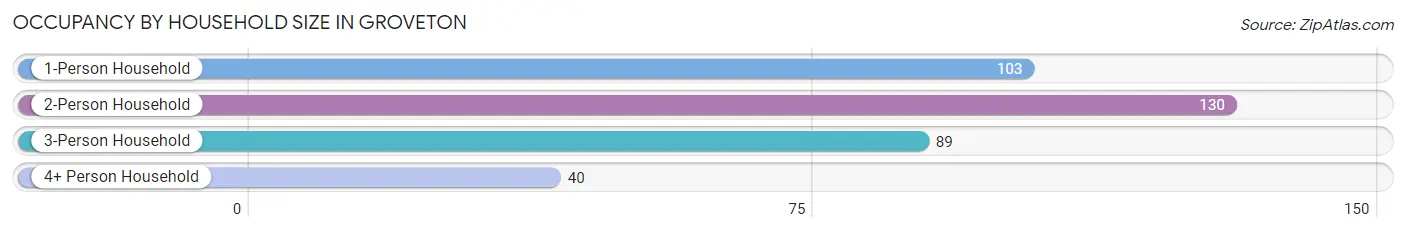
| Household Size | # Housing Units | % Housing Units |
| 1-Person Household | 103 | 28.4% |
| 2-Person Household | 130 | 35.9% |
| 3-Person Household | 89 | 24.6% |
| 4+ Person Household | 40 | 11.1% |
| Total Housing Units | 362 | 100.0% |
Occupancy by Ownership by Household Size in Groveton
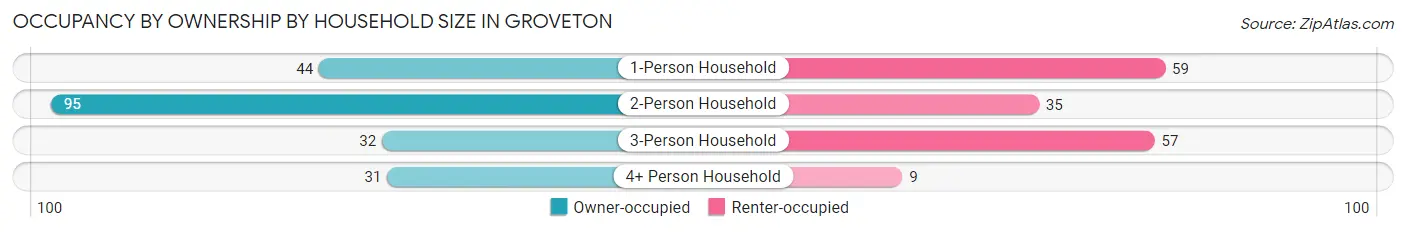
| Household Size | Owner-occupied | Renter-occupied |
| 1-Person Household | 44 (42.7%) | 59 (57.3%) |
| 2-Person Household | 95 (73.1%) | 35 (26.9%) |
| 3-Person Household | 32 (36.0%) | 57 (64.0%) |
| 4+ Person Household | 31 (77.5%) | 9 (22.5%) |
| Total Housing Units | 202 (55.8%) | 160 (44.2%) |
Occupancy by Educational Attainment in Groveton
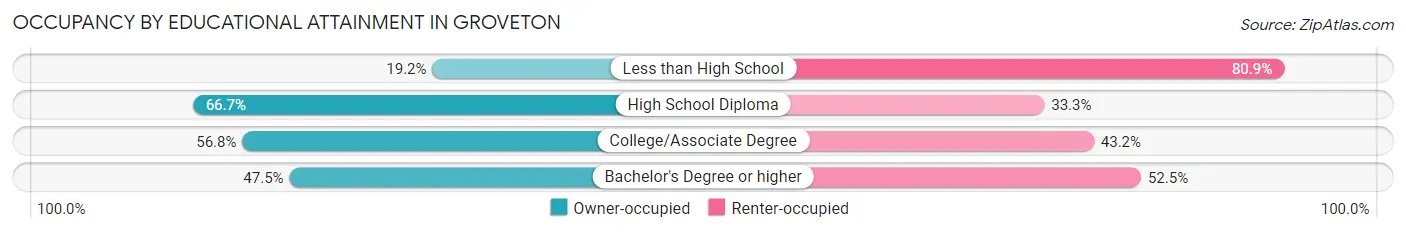
| Household Size | Owner-occupied | Renter-occupied |
| Less than High School | 9 (19.2%) | 38 (80.8%) |
| High School Diploma | 120 (66.7%) | 60 (33.3%) |
| College/Associate Degree | 54 (56.8%) | 41 (43.2%) |
| Bachelor's Degree or higher | 19 (47.5%) | 21 (52.5%) |
Occupancy by Age of Householder in Groveton
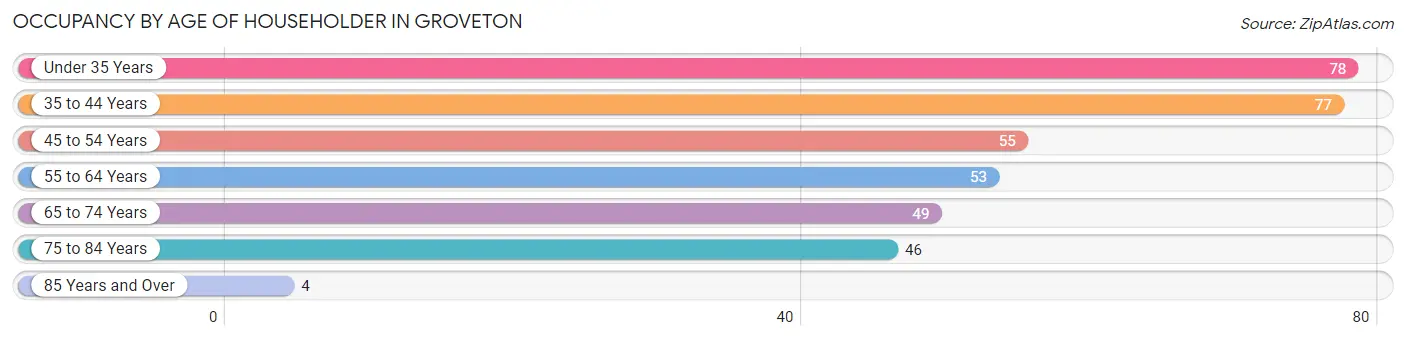
| Age Bracket | # Households | % Households |
| Under 35 Years | 78 | 21.5% |
| 35 to 44 Years | 77 | 21.3% |
| 45 to 54 Years | 55 | 15.2% |
| 55 to 64 Years | 53 | 14.6% |
| 65 to 74 Years | 49 | 13.5% |
| 75 to 84 Years | 46 | 12.7% |
| 85 Years and Over | 4 | 1.1% |
| Total | 362 | 100.0% |
Housing Finances in Groveton
Median Income by Occupancy in Groveton
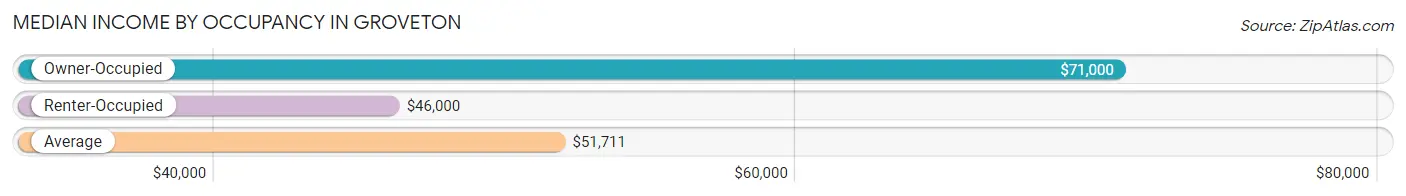
| Occupancy Type | # Households | Median Income |
| Owner-Occupied | 202 (55.8%) | $71,000 |
| Renter-Occupied | 160 (44.2%) | $46,000 |
| Average | 362 (100.0%) | $51,711 |
Occupancy by Householder Income Bracket in Groveton
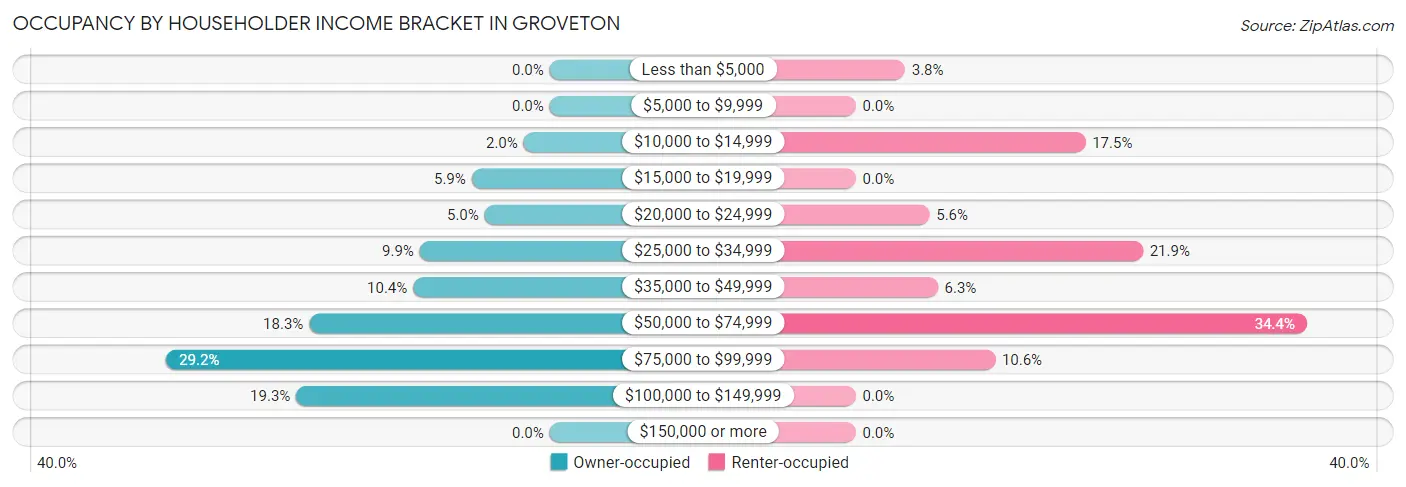
| Income Bracket | Owner-occupied | Renter-occupied |
| Less than $5,000 | 0 (0.0%) | 6 (3.7%) |
| $5,000 to $9,999 | 0 (0.0%) | 0 (0.0%) |
| $10,000 to $14,999 | 4 (2.0%) | 28 (17.5%) |
| $15,000 to $19,999 | 12 (5.9%) | 0 (0.0%) |
| $20,000 to $24,999 | 10 (5.0%) | 9 (5.6%) |
| $25,000 to $34,999 | 20 (9.9%) | 35 (21.9%) |
| $35,000 to $49,999 | 21 (10.4%) | 10 (6.2%) |
| $50,000 to $74,999 | 37 (18.3%) | 55 (34.4%) |
| $75,000 to $99,999 | 59 (29.2%) | 17 (10.6%) |
| $100,000 to $149,999 | 39 (19.3%) | 0 (0.0%) |
| $150,000 or more | 0 (0.0%) | 0 (0.0%) |
| Total | 202 (100.0%) | 160 (100.0%) |
Monthly Housing Cost Tiers in Groveton
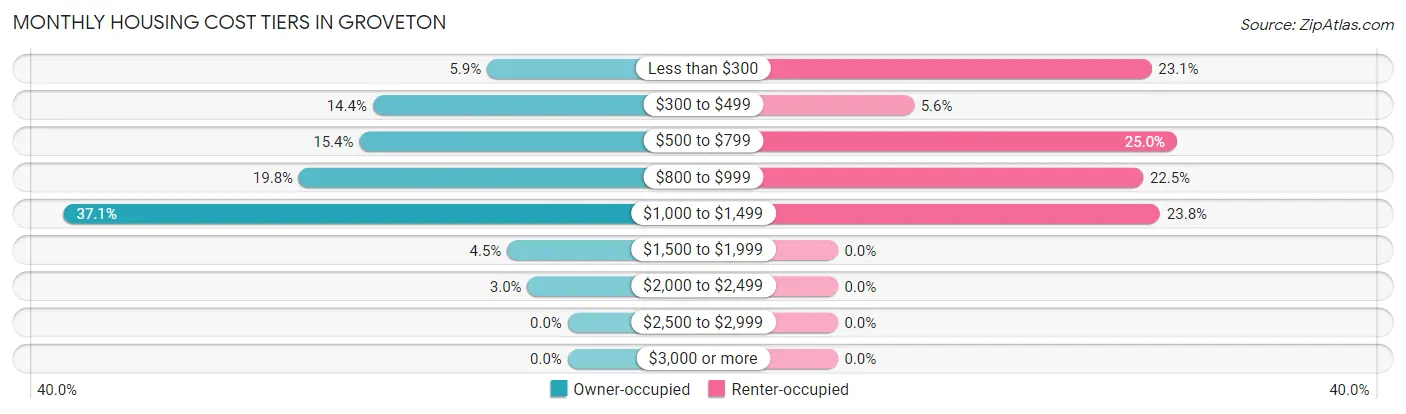
| Monthly Cost | Owner-occupied | Renter-occupied |
| Less than $300 | 12 (5.9%) | 37 (23.1%) |
| $300 to $499 | 29 (14.4%) | 9 (5.6%) |
| $500 to $799 | 31 (15.3%) | 40 (25.0%) |
| $800 to $999 | 40 (19.8%) | 36 (22.5%) |
| $1,000 to $1,499 | 75 (37.1%) | 38 (23.7%) |
| $1,500 to $1,999 | 9 (4.5%) | 0 (0.0%) |
| $2,000 to $2,499 | 6 (3.0%) | 0 (0.0%) |
| $2,500 to $2,999 | 0 (0.0%) | 0 (0.0%) |
| $3,000 or more | 0 (0.0%) | 0 (0.0%) |
| Total | 202 (100.0%) | 160 (100.0%) |
Physical Housing Characteristics in Groveton
Housing Structures in Groveton
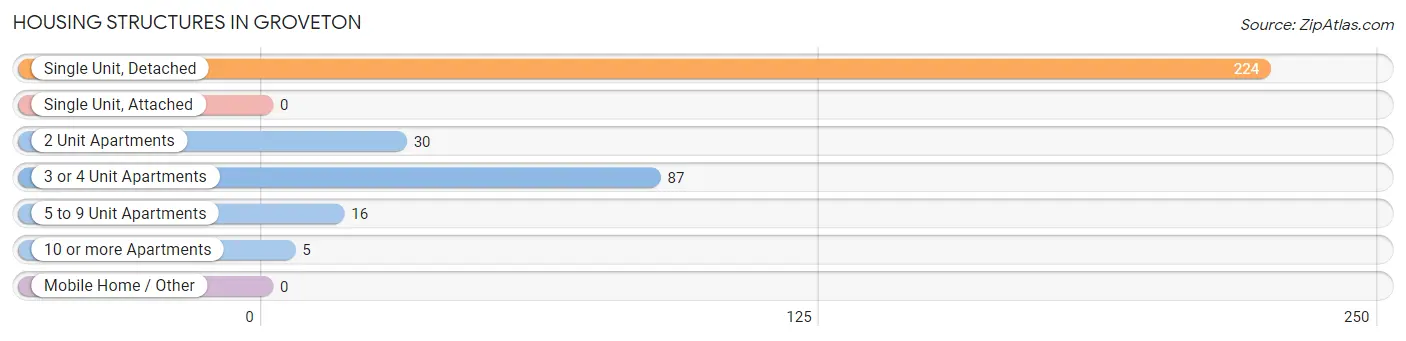
| Structure Type | # Housing Units | % Housing Units |
| Single Unit, Detached | 224 | 61.9% |
| Single Unit, Attached | 0 | 0.0% |
| 2 Unit Apartments | 30 | 8.3% |
| 3 or 4 Unit Apartments | 87 | 24.0% |
| 5 to 9 Unit Apartments | 16 | 4.4% |
| 10 or more Apartments | 5 | 1.4% |
| Mobile Home / Other | 0 | 0.0% |
| Total | 362 | 100.0% |
Housing Structures by Occupancy in Groveton
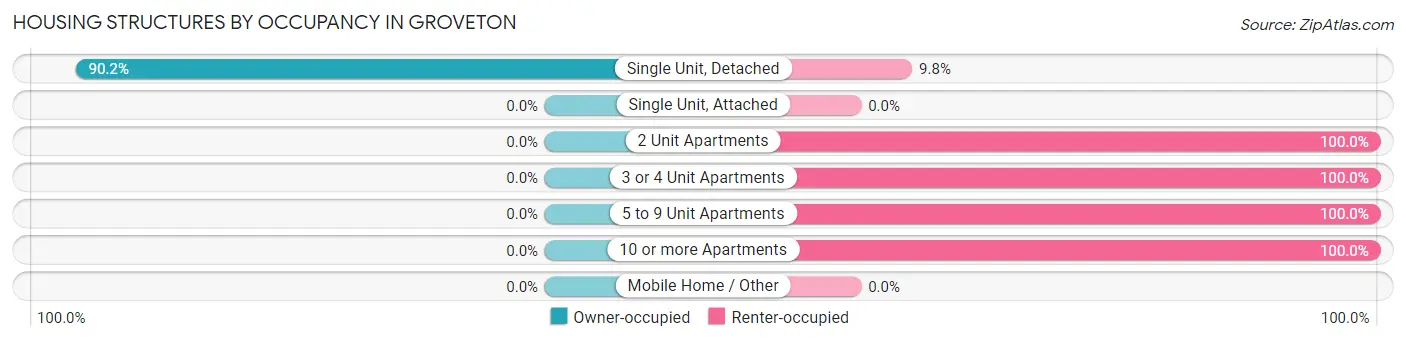
| Structure Type | Owner-occupied | Renter-occupied |
| Single Unit, Detached | 202 (90.2%) | 22 (9.8%) |
| Single Unit, Attached | 0 (0.0%) | 0 (0.0%) |
| 2 Unit Apartments | 0 (0.0%) | 30 (100.0%) |
| 3 or 4 Unit Apartments | 0 (0.0%) | 87 (100.0%) |
| 5 to 9 Unit Apartments | 0 (0.0%) | 16 (100.0%) |
| 10 or more Apartments | 0 (0.0%) | 5 (100.0%) |
| Mobile Home / Other | 0 (0.0%) | 0 (0.0%) |
| Total | 202 (55.8%) | 160 (44.2%) |
Housing Structures by Number of Rooms in Groveton
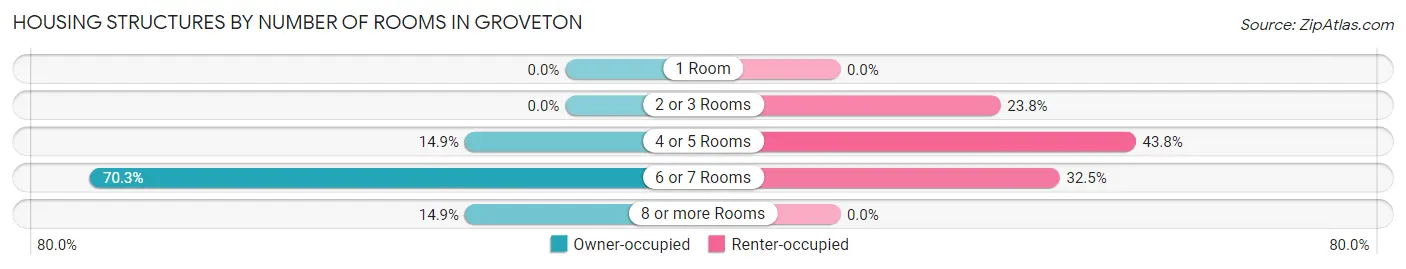
| Number of Rooms | Owner-occupied | Renter-occupied |
| 1 Room | 0 (0.0%) | 0 (0.0%) |
| 2 or 3 Rooms | 0 (0.0%) | 38 (23.7%) |
| 4 or 5 Rooms | 30 (14.8%) | 70 (43.8%) |
| 6 or 7 Rooms | 142 (70.3%) | 52 (32.5%) |
| 8 or more Rooms | 30 (14.8%) | 0 (0.0%) |
| Total | 202 (100.0%) | 160 (100.0%) |
Housing Structure by Heating Type in Groveton
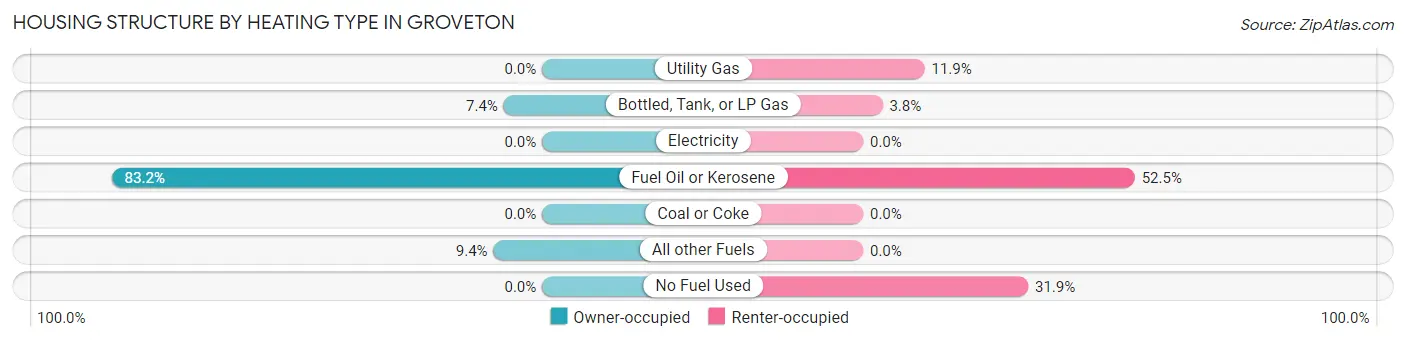
| Heating Type | Owner-occupied | Renter-occupied |
| Utility Gas | 0 (0.0%) | 19 (11.9%) |
| Bottled, Tank, or LP Gas | 15 (7.4%) | 6 (3.7%) |
| Electricity | 0 (0.0%) | 0 (0.0%) |
| Fuel Oil or Kerosene | 168 (83.2%) | 84 (52.5%) |
| Coal or Coke | 0 (0.0%) | 0 (0.0%) |
| All other Fuels | 19 (9.4%) | 0 (0.0%) |
| No Fuel Used | 0 (0.0%) | 51 (31.9%) |
| Total | 202 (100.0%) | 160 (100.0%) |
Household Vehicle Usage in Groveton
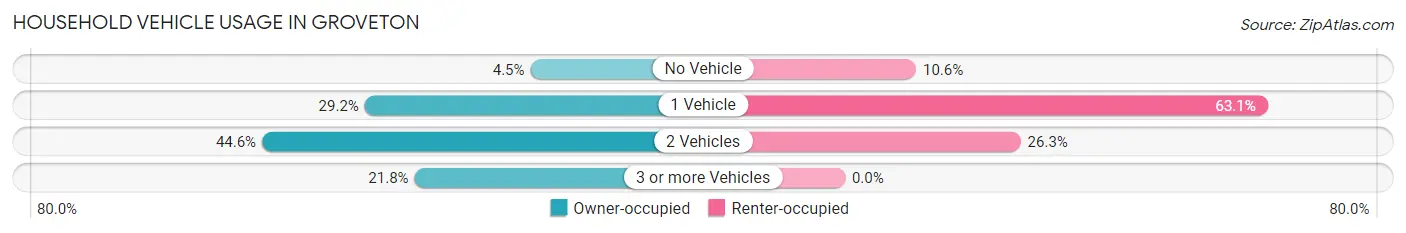
| Vehicles per Household | Owner-occupied | Renter-occupied |
| No Vehicle | 9 (4.5%) | 17 (10.6%) |
| 1 Vehicle | 59 (29.2%) | 101 (63.1%) |
| 2 Vehicles | 90 (44.6%) | 42 (26.3%) |
| 3 or more Vehicles | 44 (21.8%) | 0 (0.0%) |
| Total | 202 (100.0%) | 160 (100.0%) |
Real Estate & Mortgages in Groveton
Real Estate and Mortgage Overview in Groveton
| Characteristic | Without Mortgage | With Mortgage |
| Housing Units | 105 | 97 |
| Median Property Value | $79,800 | $96,100 |
| Median Household Income | $56,750 | $0 |
| Monthly Housing Costs | $577 | $0 |
| Real Estate Taxes | $2,500 | $5 |
Property Value by Mortgage Status in Groveton
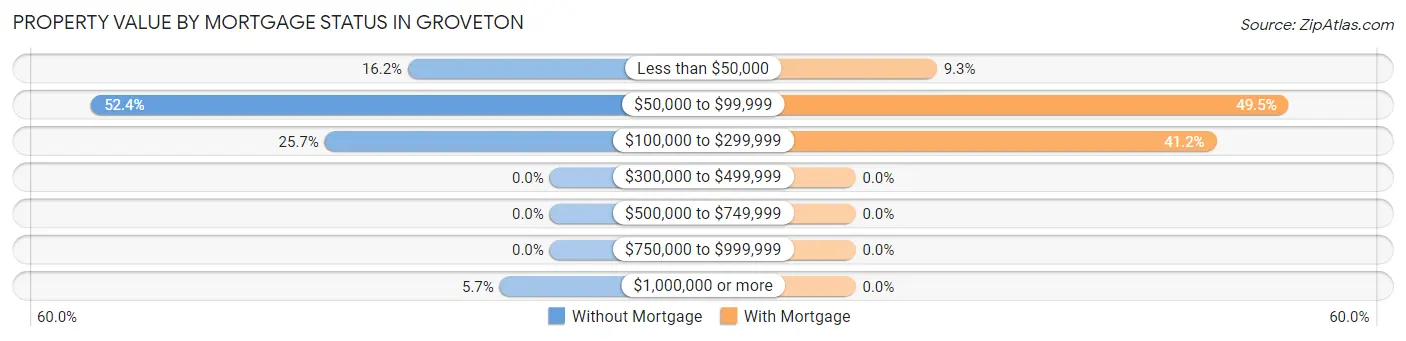
| Property Value | Without Mortgage | With Mortgage |
| Less than $50,000 | 17 (16.2%) | 9 (9.3%) |
| $50,000 to $99,999 | 55 (52.4%) | 48 (49.5%) |
| $100,000 to $299,999 | 27 (25.7%) | 40 (41.2%) |
| $300,000 to $499,999 | 0 (0.0%) | 0 (0.0%) |
| $500,000 to $749,999 | 0 (0.0%) | 0 (0.0%) |
| $750,000 to $999,999 | 0 (0.0%) | 0 (0.0%) |
| $1,000,000 or more | 6 (5.7%) | 0 (0.0%) |
| Total | 105 (100.0%) | 97 (100.0%) |
Household Income by Mortgage Status in Groveton
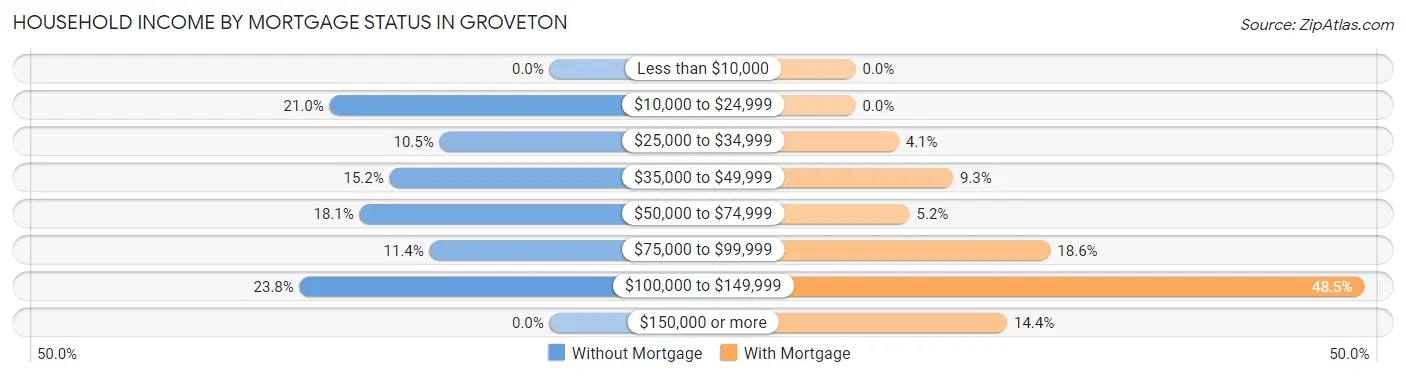
| Household Income | Without Mortgage | With Mortgage |
| Less than $10,000 | 0 (0.0%) | 0 (0.0%) |
| $10,000 to $24,999 | 22 (20.9%) | 0 (0.0%) |
| $25,000 to $34,999 | 11 (10.5%) | 4 (4.1%) |
| $35,000 to $49,999 | 16 (15.2%) | 9 (9.3%) |
| $50,000 to $74,999 | 19 (18.1%) | 5 (5.1%) |
| $75,000 to $99,999 | 12 (11.4%) | 18 (18.6%) |
| $100,000 to $149,999 | 25 (23.8%) | 47 (48.4%) |
| $150,000 or more | 0 (0.0%) | 14 (14.4%) |
| Total | 105 (100.0%) | 97 (100.0%) |
Property Value to Household Income Ratio in Groveton
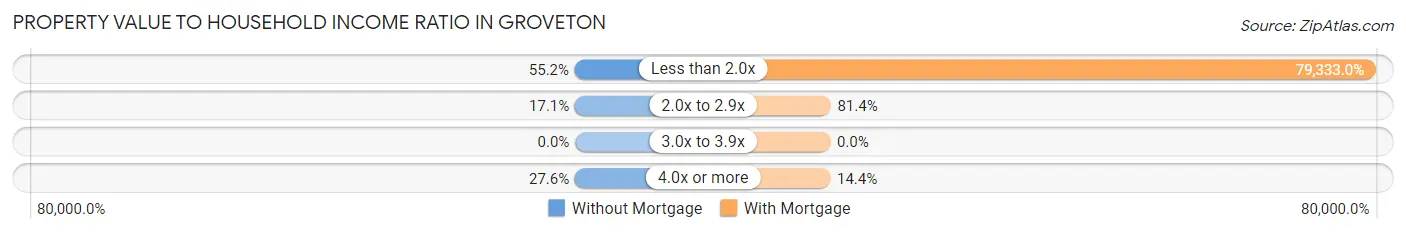
| Value-to-Income Ratio | Without Mortgage | With Mortgage |
| Less than 2.0x | 58 (55.2%) | 76,953 (79,333.0%) |
| 2.0x to 2.9x | 18 (17.1%) | 79 (81.4%) |
| 3.0x to 3.9x | 0 (0.0%) | 0 (0.0%) |
| 4.0x or more | 29 (27.6%) | 14 (14.4%) |
| Total | 105 (100.0%) | 97 (100.0%) |
Real Estate Taxes by Mortgage Status in Groveton
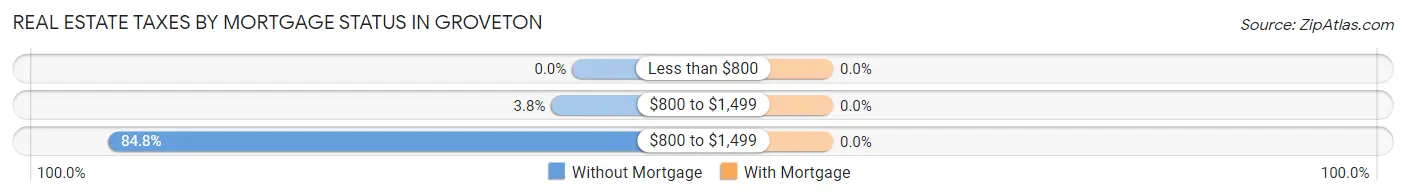
| Property Taxes | Without Mortgage | With Mortgage |
| Less than $800 | 0 (0.0%) | 0 (0.0%) |
| $800 to $1,499 | 4 (3.8%) | 0 (0.0%) |
| $800 to $1,499 | 89 (84.8%) | 0 (0.0%) |
| Total | 105 (100.0%) | 97 (100.0%) |
Health & Disability in Groveton
Health Insurance Coverage by Age in Groveton
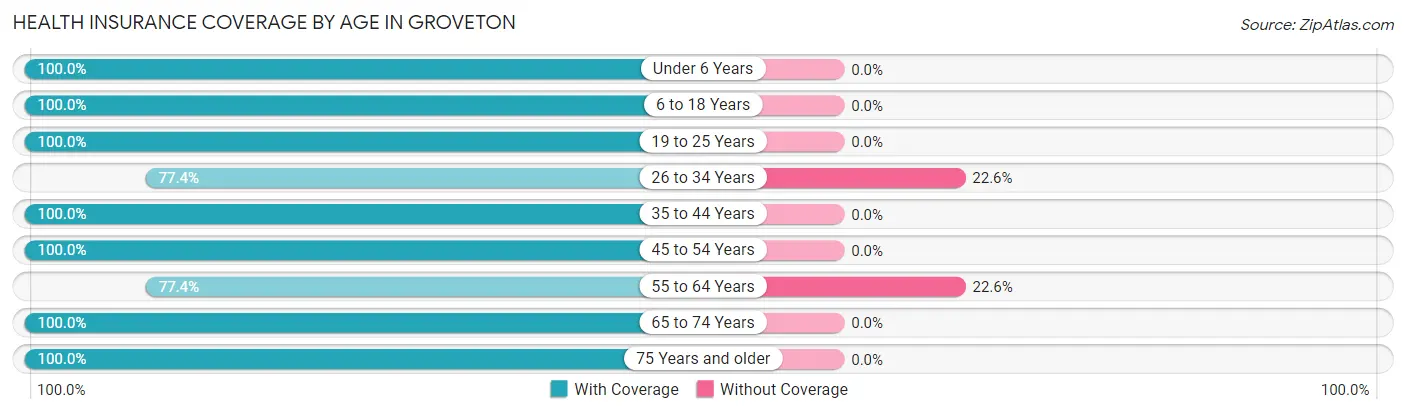
| Age Bracket | With Coverage | Without Coverage |
| Under 6 Years | 83 (100.0%) | 0 (0.0%) |
| 6 to 18 Years | 113 (100.0%) | 0 (0.0%) |
| 19 to 25 Years | 79 (100.0%) | 0 (0.0%) |
| 26 to 34 Years | 72 (77.4%) | 21 (22.6%) |
| 35 to 44 Years | 147 (100.0%) | 0 (0.0%) |
| 45 to 54 Years | 82 (100.0%) | 0 (0.0%) |
| 55 to 64 Years | 89 (77.4%) | 26 (22.6%) |
| 65 to 74 Years | 64 (100.0%) | 0 (0.0%) |
| 75 Years and older | 63 (100.0%) | 0 (0.0%) |
| Total | 792 (94.4%) | 47 (5.6%) |
Health Insurance Coverage by Citizenship Status in Groveton
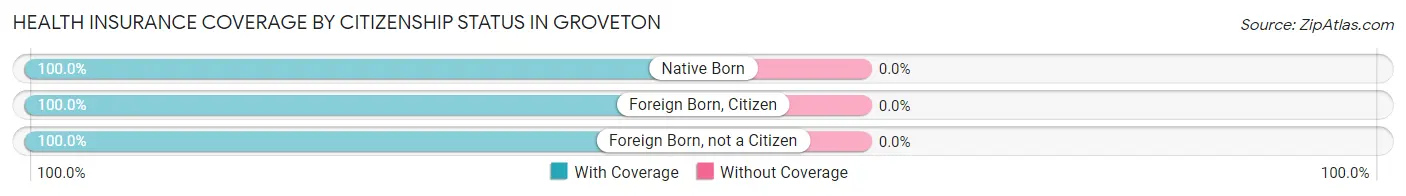
| Citizenship Status | With Coverage | Without Coverage |
| Native Born | 83 (100.0%) | 0 (0.0%) |
| Foreign Born, Citizen | 113 (100.0%) | 0 (0.0%) |
| Foreign Born, not a Citizen | 79 (100.0%) | 0 (0.0%) |
Health Insurance Coverage by Household Income in Groveton
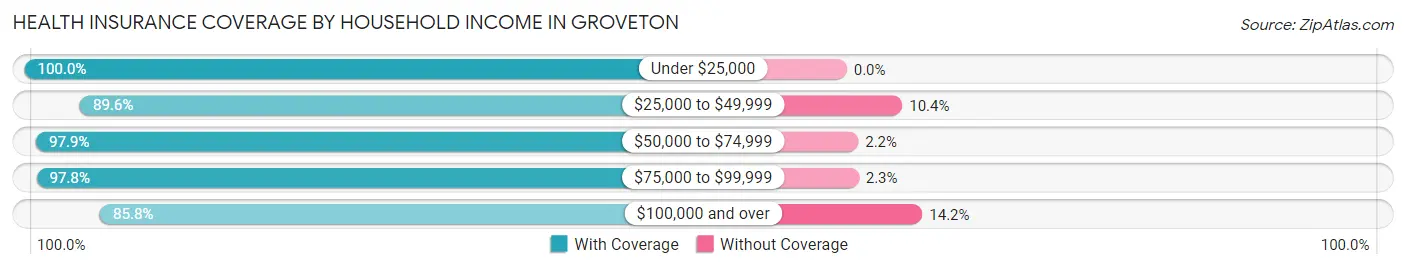
| Household Income | With Coverage | Without Coverage |
| Under $25,000 | 69 (100.0%) | 0 (0.0%) |
| $25,000 to $49,999 | 181 (89.6%) | 21 (10.4%) |
| $50,000 to $74,999 | 228 (97.9%) | 5 (2.1%) |
| $75,000 to $99,999 | 217 (97.8%) | 5 (2.2%) |
| $100,000 and over | 97 (85.8%) | 16 (14.2%) |
Public vs Private Health Insurance Coverage by Age in Groveton
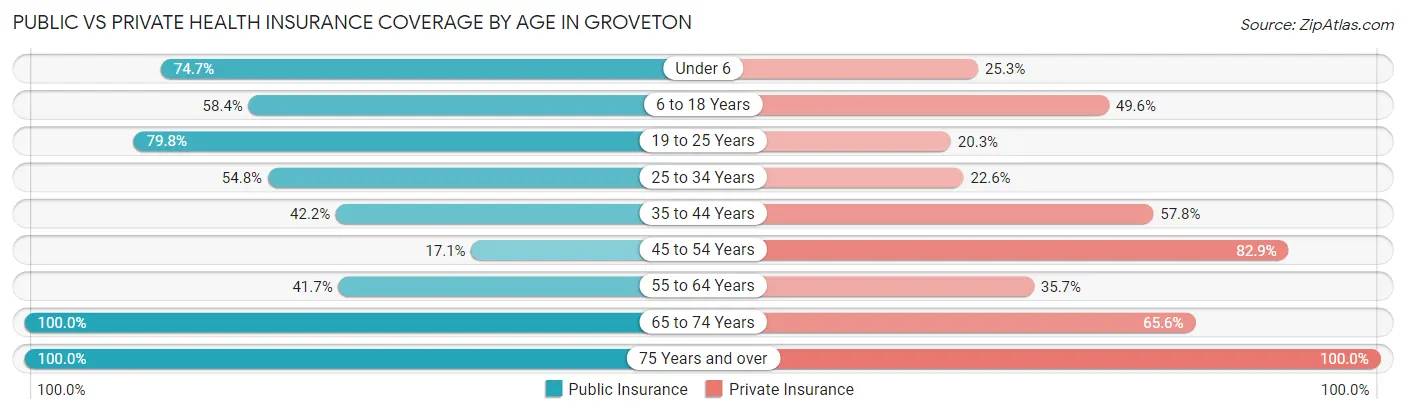
| Age Bracket | Public Insurance | Private Insurance |
| Under 6 | 62 (74.7%) | 21 (25.3%) |
| 6 to 18 Years | 66 (58.4%) | 56 (49.6%) |
| 19 to 25 Years | 63 (79.7%) | 16 (20.3%) |
| 25 to 34 Years | 51 (54.8%) | 21 (22.6%) |
| 35 to 44 Years | 62 (42.2%) | 85 (57.8%) |
| 45 to 54 Years | 14 (17.1%) | 68 (82.9%) |
| 55 to 64 Years | 48 (41.7%) | 41 (35.6%) |
| 65 to 74 Years | 64 (100.0%) | 42 (65.6%) |
| 75 Years and over | 63 (100.0%) | 63 (100.0%) |
| Total | 493 (58.8%) | 413 (49.2%) |
Disability Status by Sex by Age in Groveton
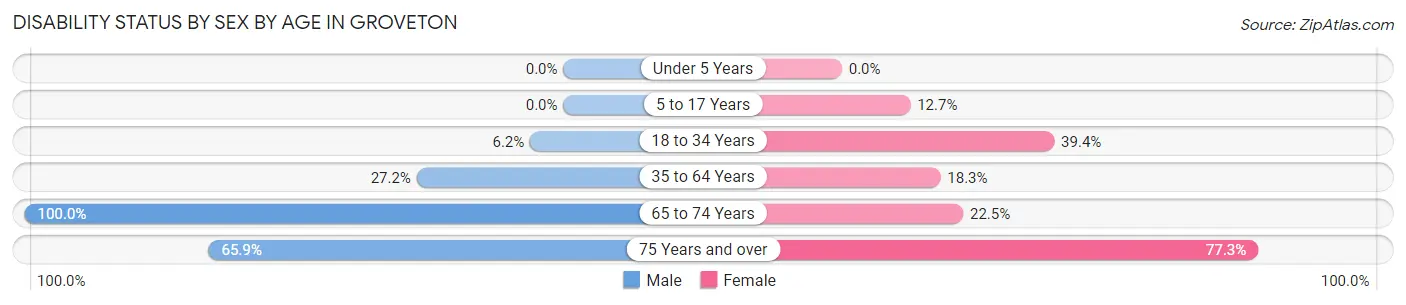
| Age Bracket | Male | Female |
| Under 5 Years | 0 (0.0%) | 0 (0.0%) |
| 5 to 17 Years | 0 (0.0%) | 8 (12.7%) |
| 18 to 34 Years | 5 (6.2%) | 41 (39.4%) |
| 35 to 64 Years | 46 (27.2%) | 32 (18.3%) |
| 65 to 74 Years | 24 (100.0%) | 9 (22.5%) |
| 75 Years and over | 27 (65.8%) | 17 (77.3%) |
Disability Class by Sex by Age in Groveton
Disability Class: Hearing Difficulty
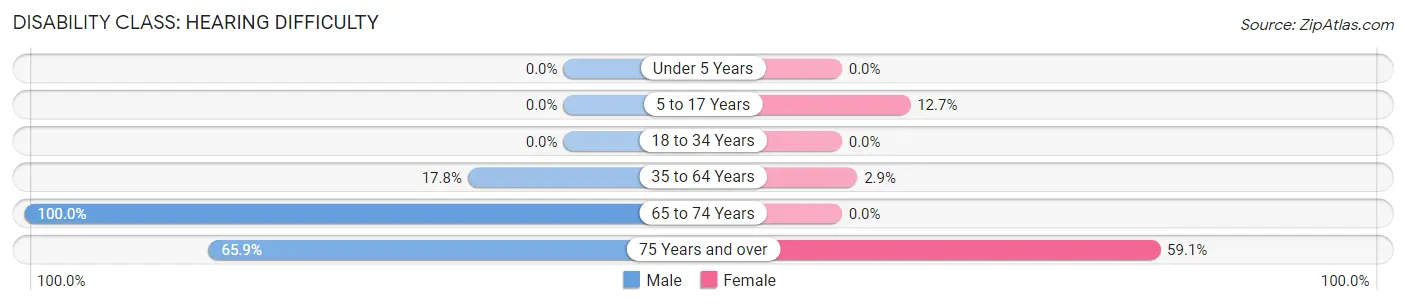
| Age Bracket | Male | Female |
| Under 5 Years | 0 (0.0%) | 0 (0.0%) |
| 5 to 17 Years | 0 (0.0%) | 8 (12.7%) |
| 18 to 34 Years | 0 (0.0%) | 0 (0.0%) |
| 35 to 64 Years | 30 (17.7%) | 5 (2.9%) |
| 65 to 74 Years | 24 (100.0%) | 0 (0.0%) |
| 75 Years and over | 27 (65.8%) | 13 (59.1%) |
Disability Class: Vision Difficulty
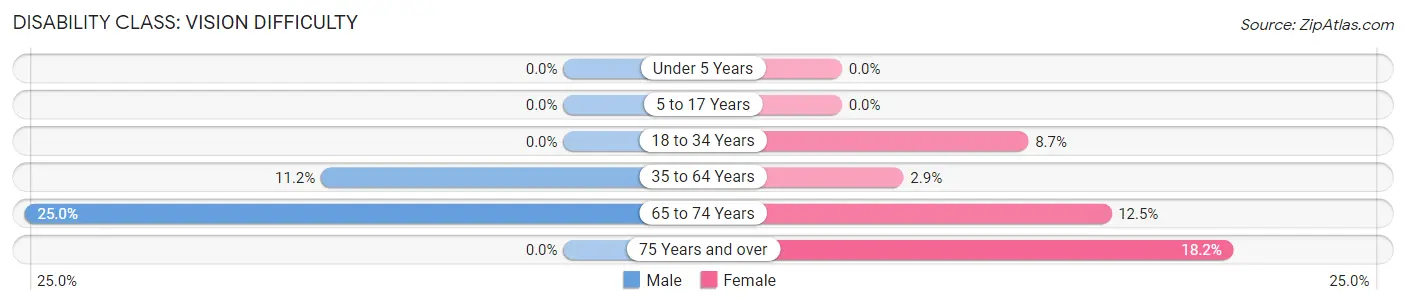
| Age Bracket | Male | Female |
| Under 5 Years | 0 (0.0%) | 0 (0.0%) |
| 5 to 17 Years | 0 (0.0%) | 0 (0.0%) |
| 18 to 34 Years | 0 (0.0%) | 9 (8.6%) |
| 35 to 64 Years | 19 (11.2%) | 5 (2.9%) |
| 65 to 74 Years | 6 (25.0%) | 5 (12.5%) |
| 75 Years and over | 0 (0.0%) | 4 (18.2%) |
Disability Class: Cognitive Difficulty
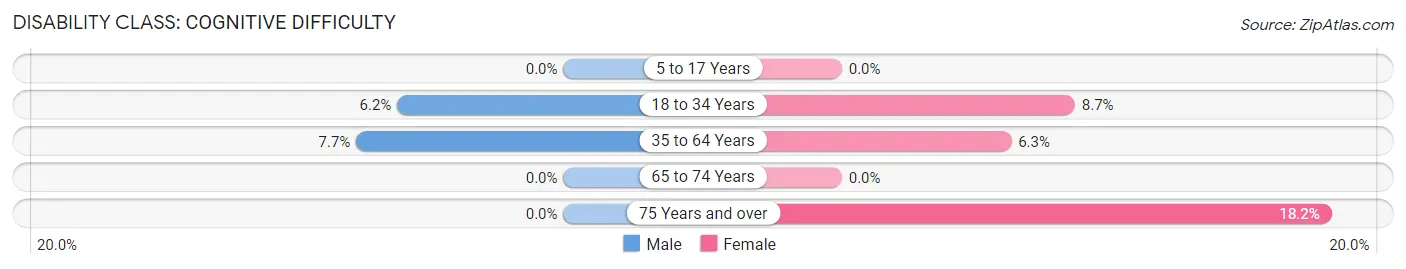
| Age Bracket | Male | Female |
| 5 to 17 Years | 0 (0.0%) | 0 (0.0%) |
| 18 to 34 Years | 5 (6.2%) | 9 (8.6%) |
| 35 to 64 Years | 13 (7.7%) | 11 (6.3%) |
| 65 to 74 Years | 0 (0.0%) | 0 (0.0%) |
| 75 Years and over | 0 (0.0%) | 4 (18.2%) |
Disability Class: Ambulatory Difficulty
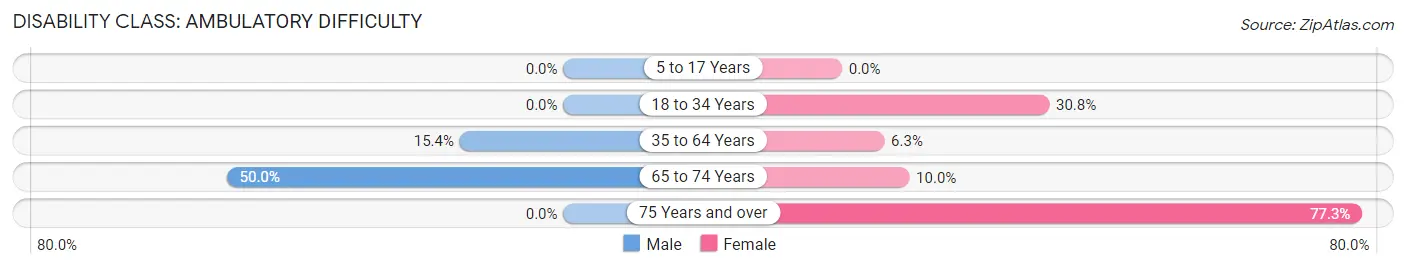
| Age Bracket | Male | Female |
| 5 to 17 Years | 0 (0.0%) | 0 (0.0%) |
| 18 to 34 Years | 0 (0.0%) | 32 (30.8%) |
| 35 to 64 Years | 26 (15.4%) | 11 (6.3%) |
| 65 to 74 Years | 12 (50.0%) | 4 (10.0%) |
| 75 Years and over | 0 (0.0%) | 17 (77.3%) |
Disability Class: Self-Care Difficulty
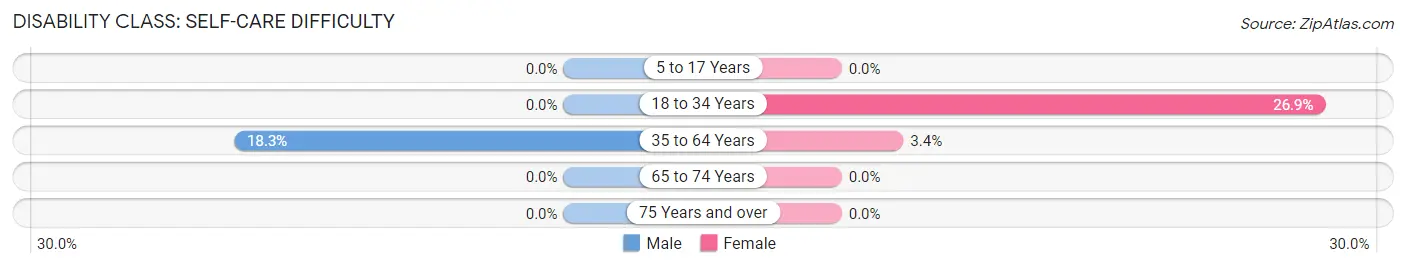
| Age Bracket | Male | Female |
| 5 to 17 Years | 0 (0.0%) | 0 (0.0%) |
| 18 to 34 Years | 0 (0.0%) | 28 (26.9%) |
| 35 to 64 Years | 31 (18.3%) | 6 (3.4%) |
| 65 to 74 Years | 0 (0.0%) | 0 (0.0%) |
| 75 Years and over | 0 (0.0%) | 0 (0.0%) |
Technology Access in Groveton
Computing Device Access in Groveton
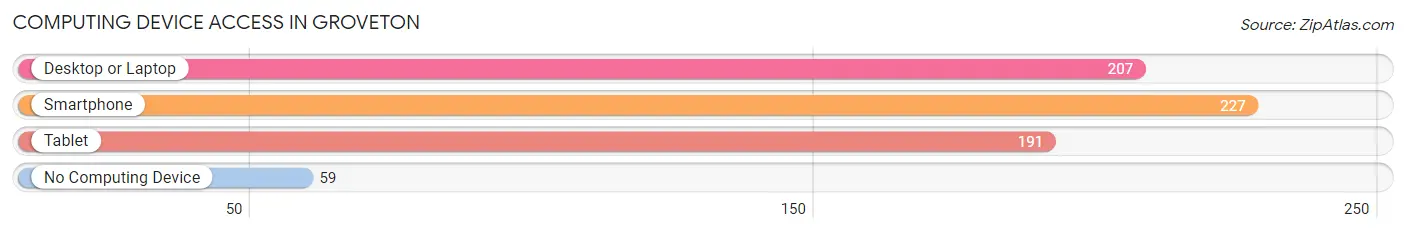
| Device Type | # Households | % Households |
| Desktop or Laptop | 207 | 57.2% |
| Smartphone | 227 | 62.7% |
| Tablet | 191 | 52.8% |
| No Computing Device | 59 | 16.3% |
| Total | 362 | 100.0% |
Internet Access in Groveton
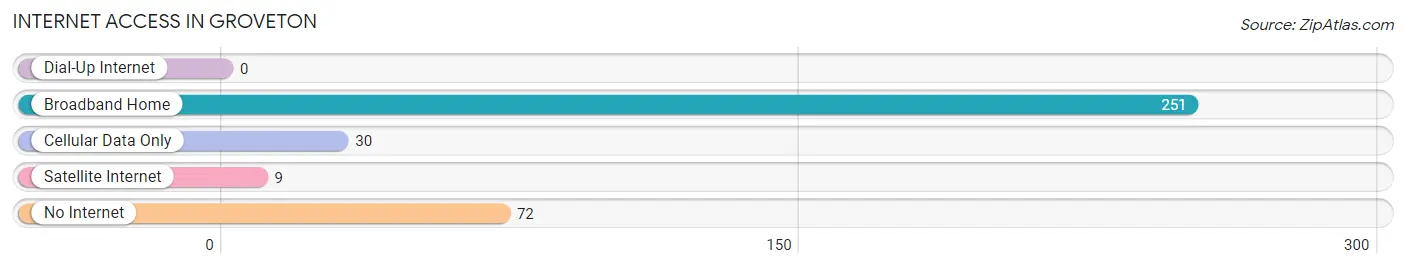
| Internet Type | # Households | % Households |
| Dial-Up Internet | 0 | 0.0% |
| Broadband Home | 251 | 69.3% |
| Cellular Data Only | 30 | 8.3% |
| Satellite Internet | 9 | 2.5% |
| No Internet | 72 | 19.9% |
| Total | 362 | 100.0% |
Groveton Summary
Groveton is a small town located in the northern part of New Hampshire, in the United States. It is situated in Coos County, and is part of the Berlin, NH–VT Micropolitan Statistical Area. The town has a population of 1,717 people, according to the 2010 census.
Geography
Groveton is located in the northern part of New Hampshire, in Coos County. It is situated in the White Mountains region of the state, and is bordered by the towns of Stark, Northumberland, and Stratford. The town is located on the Connecticut River, and is home to the Groveton Covered Bridge, which is listed on the National Register of Historic Places. The town has a total area of 24.2 square miles, of which 24.1 square miles is land and 0.1 square mile is water.
History
The area that is now Groveton was first settled in 1771 by a group of settlers from Massachusetts. The town was originally known as "Grovetown," and was incorporated in 1804. The town was named after the groves of trees that were found in the area.
In the late 19th century, Groveton was a major lumbering center, and the town was home to several sawmills and paper mills. The town was also home to a large granite quarry, which provided stone for many of the buildings in the area.
Economy
The economy of Groveton is largely based on tourism and the service industry. The town is home to several restaurants, hotels, and other businesses that cater to tourists. The town is also home to a number of small manufacturing businesses, including a paper mill and a woodworking shop.
Demographics
According to the 2010 census, the population of Groveton was 1,717 people. The racial makeup of the town was 97.2% White, 0.5% African American, 0.3% Native American, 0.3% Asian, 0.1% Pacific Islander, 0.2% from other races, and 1.4% from two or more races. Hispanic or Latino of any race were 0.9% of the population.
The median income for a household in the town was $37,917, and the median income for a family was $45,000. The per capita income for the town was $19,945. About 11.2% of families and 14.2% of the population were below the poverty line, including 19.2% of those under age 18 and 8.3% of those age 65 or over.
Conclusion
Groveton is a small town located in the northern part of New Hampshire. It is situated in the White Mountains region of the state, and is bordered by the towns of Stark, Northumberland, and Stratford. The town has a population of 1,717 people, according to the 2010 census. The economy of Groveton is largely based on tourism and the service industry, and the town is home to several restaurants, hotels, and other businesses that cater to tourists. The racial makeup of the town is predominantly White, with a small percentage of African American, Native American, Asian, and Pacific Islander residents. The median income for a household in the town was $37,917, and the median income for a family was $45,000.
Common Questions
What is Per Capita Income in Groveton?
Per Capita income in Groveton is $24,806.
What is the Median Family Income in Groveton?
Median Family Income in Groveton is $75,089.
What is the Median Household income in Groveton?
Median Household Income in Groveton is $51,711.
What is Income or Wage Gap in Groveton?
Income or Wage Gap in Groveton is 29.5%.
Women in Groveton earn 70.5 cents for every dollar earned by a man.
What is Inequality or Gini Index in Groveton?
Inequality or Gini Index in Groveton is 0.33.
What is the Total Population of Groveton?
Total Population of Groveton is 839.
What is the Total Male Population of Groveton?
Total Male Population of Groveton is 378.
What is the Total Female Population of Groveton?
Total Female Population of Groveton is 461.
What is the Ratio of Males per 100 Females in Groveton?
There are 82.00 Males per 100 Females in Groveton.
What is the Ratio of Females per 100 Males in Groveton?
There are 121.96 Females per 100 Males in Groveton.
What is the Median Population Age in Groveton?
Median Population Age in Groveton is 37.7 Years.
What is the Average Family Size in Groveton
Average Family Size in Groveton is 2.7 People.
What is the Average Household Size in Groveton
Average Household Size in Groveton is 2.3 People.
How Large is the Labor Force in Groveton?
There are 410 People in the Labor Forcein in Groveton.
What is the Percentage of People in the Labor Force in Groveton?
60.9% of People are in the Labor Force in Groveton.
What is the Unemployment Rate in Groveton?
Unemployment Rate in Groveton is 3.7%.