Center Sandwich, NH Map & Demographics
Center Sandwich Map
Center Sandwich Overview
$60,294
PER CAPITA INCOME
$102,639
AVG FAMILY INCOME
$97,708
AVG HOUSEHOLD INCOME
0.46
INEQUALITY / GINI INDEX
172
TOTAL POPULATION
70
MALE POPULATION
102
FEMALE POPULATION
68.63
MALES / 100 FEMALES
145.71
FEMALES / 100 MALES
51.3
MEDIAN AGE
2.7
AVG FAMILY SIZE
2.3
AVG HOUSEHOLD SIZE
110
LABOR FORCE [ PEOPLE ]
68.8%
PERCENT IN LABOR FORCE
Center Sandwich Zip Codes
Center Sandwich Area Codes
Income in Center Sandwich
Income Overview in Center Sandwich
Per Capita Income in Center Sandwich is $60,294, while median incomes of families and households are $102,639 and $97,708 respectively.
| Characteristic | Number | Measure |
| Per Capita Income | 172 | $60,294 |
| Median Family Income | 51 | $102,639 |
| Mean Family Income | 51 | $106,116 |
| Median Household Income | 75 | $97,708 |
| Mean Household Income | 75 | $131,723 |
| Income Deficit | 51 | $0 |
| Wage / Income Gap (%) | 172 | 0.00% |
| Wage / Income Gap ($) | 172 | 100.00¢ per $1 |
| Gini / Inequality Index | 172 | 0.46 |
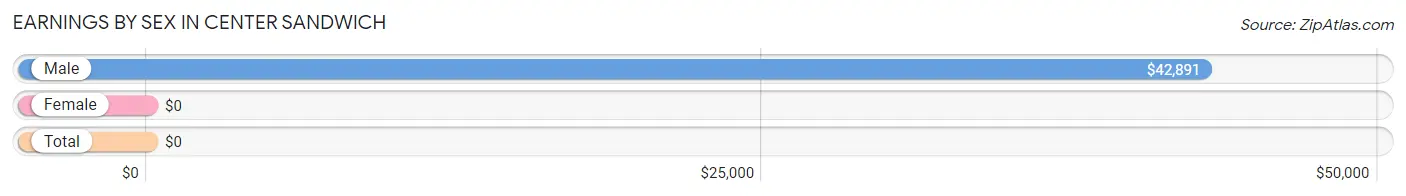
Earnings by Sex in Center Sandwich
| Sex | Number | Average Earnings |
| Male | 61 (50.8%) | $42,891 |
| Female | 59 (49.2%) | $0 |
| Total | 120 (100.0%) | $0 |
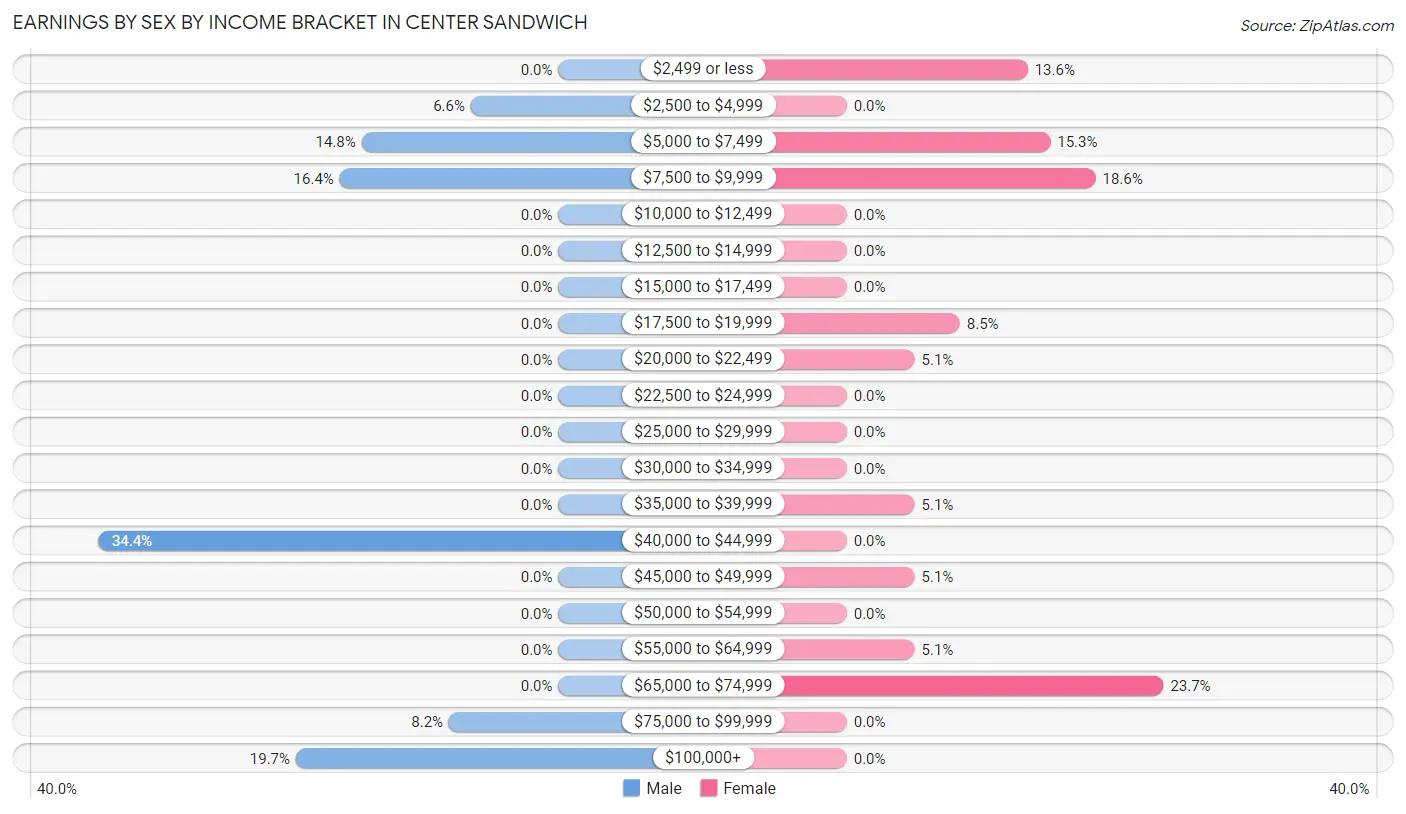
Earnings by Sex by Income Bracket in Center Sandwich
The most common earnings brackets in Center Sandwich are $40,000 to $44,999 for men (21 | 34.4%) and $65,000 to $74,999 for women (14 | 23.7%).
| Income | Male | Female |
| $2,499 or less | 0 (0.0%) | 8 (13.6%) |
| $2,500 to $4,999 | 4 (6.6%) | 0 (0.0%) |
| $5,000 to $7,499 | 9 (14.7%) | 9 (15.2%) |
| $7,500 to $9,999 | 10 (16.4%) | 11 (18.6%) |
| $10,000 to $12,499 | 0 (0.0%) | 0 (0.0%) |
| $12,500 to $14,999 | 0 (0.0%) | 0 (0.0%) |
| $15,000 to $17,499 | 0 (0.0%) | 0 (0.0%) |
| $17,500 to $19,999 | 0 (0.0%) | 5 (8.5%) |
| $20,000 to $22,499 | 0 (0.0%) | 3 (5.1%) |
| $22,500 to $24,999 | 0 (0.0%) | 0 (0.0%) |
| $25,000 to $29,999 | 0 (0.0%) | 0 (0.0%) |
| $30,000 to $34,999 | 0 (0.0%) | 0 (0.0%) |
| $35,000 to $39,999 | 0 (0.0%) | 3 (5.1%) |
| $40,000 to $44,999 | 21 (34.4%) | 0 (0.0%) |
| $45,000 to $49,999 | 0 (0.0%) | 3 (5.1%) |
| $50,000 to $54,999 | 0 (0.0%) | 0 (0.0%) |
| $55,000 to $64,999 | 0 (0.0%) | 3 (5.1%) |
| $65,000 to $74,999 | 0 (0.0%) | 14 (23.7%) |
| $75,000 to $99,999 | 5 (8.2%) | 0 (0.0%) |
| $100,000+ | 12 (19.7%) | 0 (0.0%) |
| Total | 61 (100.0%) | 59 (100.0%) |
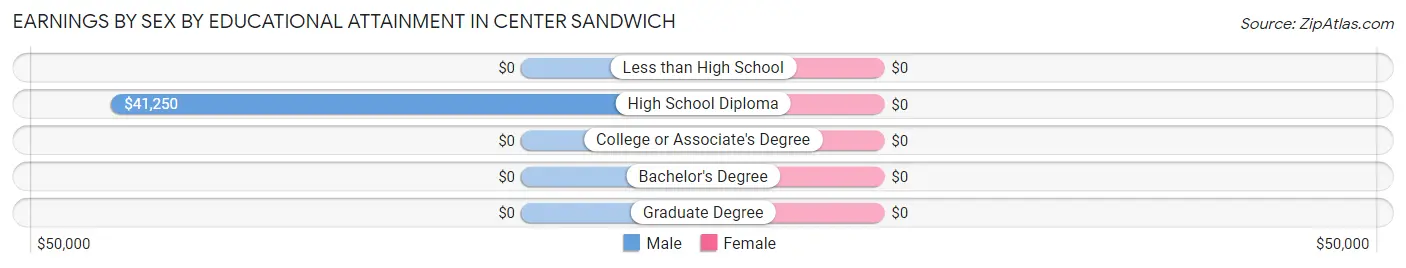
Earnings by Sex by Educational Attainment in Center Sandwich
| Educational Attainment | Male Income | Female Income |
| Less than High School | - | - |
| High School Diploma | $41,250 | $0 |
| College or Associate's Degree | - | - |
| Bachelor's Degree | - | - |
| Graduate Degree | - | - |
| Total | - | - |
Family Income in Center Sandwich
Family Income Brackets in Center Sandwich
According to the Center Sandwich family income data, there are 14 families falling into the $75,000 to $99,999 income range, which is the most common income bracket and makes up 27.5% of all families.
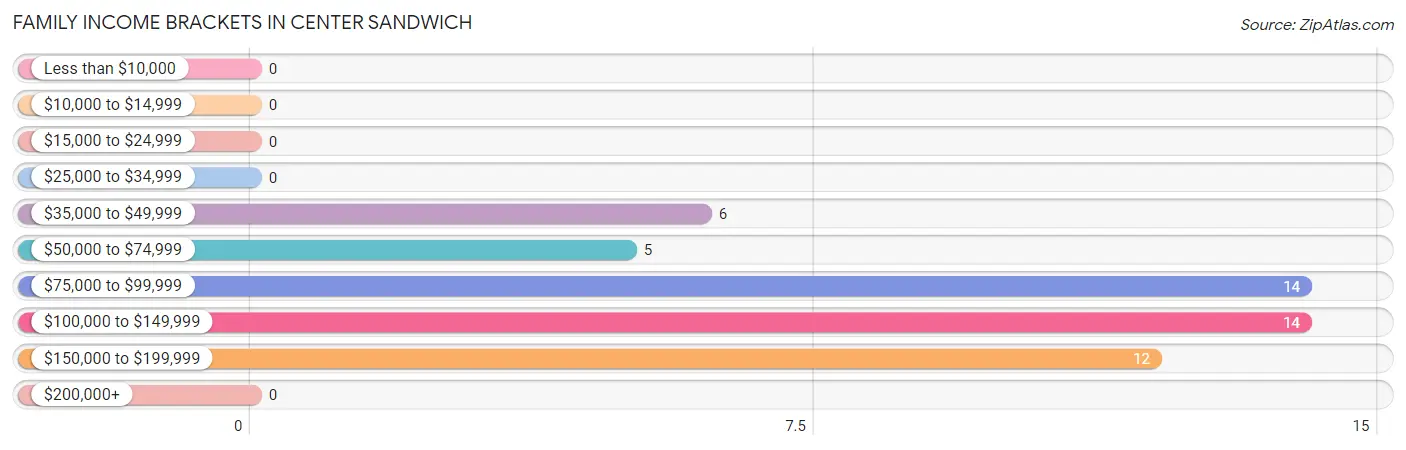
| Income Bracket | # Families | % Families |
| Less than $10,000 | 0 | 0.0% |
| $10,000 to $14,999 | 0 | 0.0% |
| $15,000 to $24,999 | 0 | 0.0% |
| $25,000 to $34,999 | 0 | 0.0% |
| $35,000 to $49,999 | 6 | 11.8% |
| $50,000 to $74,999 | 5 | 9.8% |
| $75,000 to $99,999 | 14 | 27.5% |
| $100,000 to $149,999 | 14 | 27.5% |
| $150,000 to $199,999 | 12 | 23.5% |
| $200,000+ | 0 | 0.0% |
Family Income by Famaliy Size in Center Sandwich
2-person families (42 | 82.4%) account for the highest median family income in Center Sandwich with $97,273 per family, while 2-person families (42 | 82.4%) have the highest median income of $48,636 per family member.
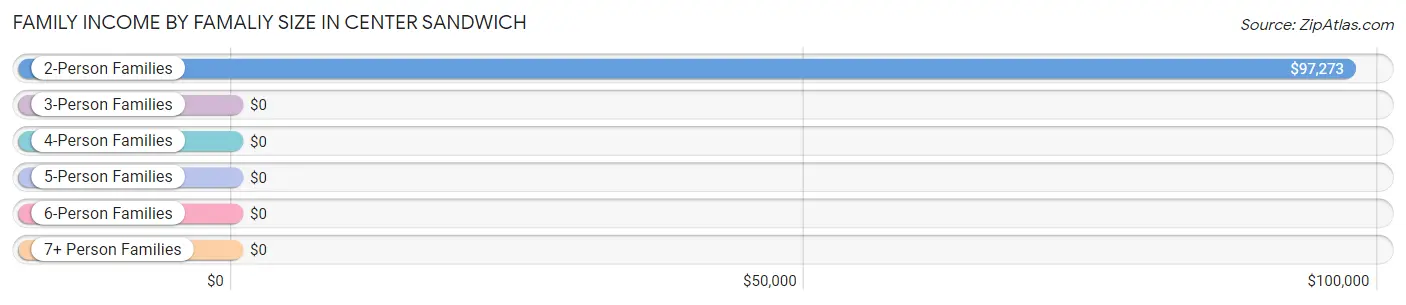
| Income Bracket | # Families | Median Income |
| 2-Person Families | 42 (82.4%) | $97,273 |
| 3-Person Families | 0 (0.0%) | $0 |
| 4-Person Families | 9 (17.6%) | $0 |
| 5-Person Families | 0 (0.0%) | $0 |
| 6-Person Families | 0 (0.0%) | $0 |
| 7+ Person Families | 0 (0.0%) | $0 |
| Total | 51 (100.0%) | $102,639 |
Family Income by Number of Earners in Center Sandwich
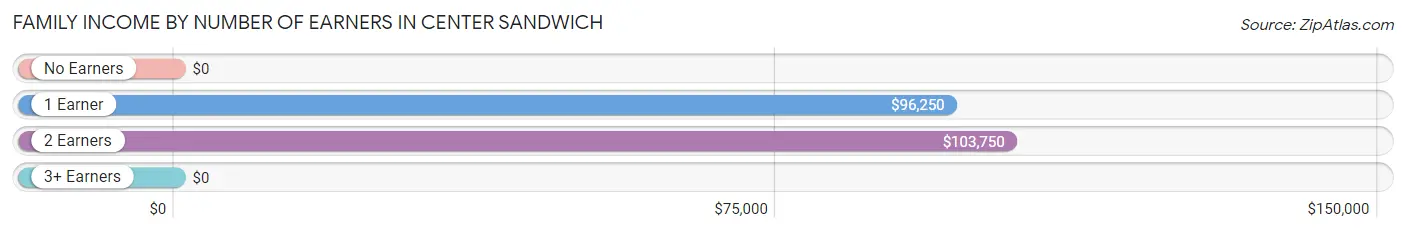
| Number of Earners | # Families | Median Income |
| No Earners | 0 (0.0%) | $0 |
| 1 Earner | 17 (33.3%) | $96,250 |
| 2 Earners | 25 (49.0%) | $103,750 |
| 3+ Earners | 9 (17.6%) | $0 |
| Total | 51 (100.0%) | $102,639 |
Household Income in Center Sandwich
Household Income Brackets in Center Sandwich
With 17 households falling in the category, the $75,000 to $99,999 income range is the most frequent in Center Sandwich, accounting for 22.7% of all households.
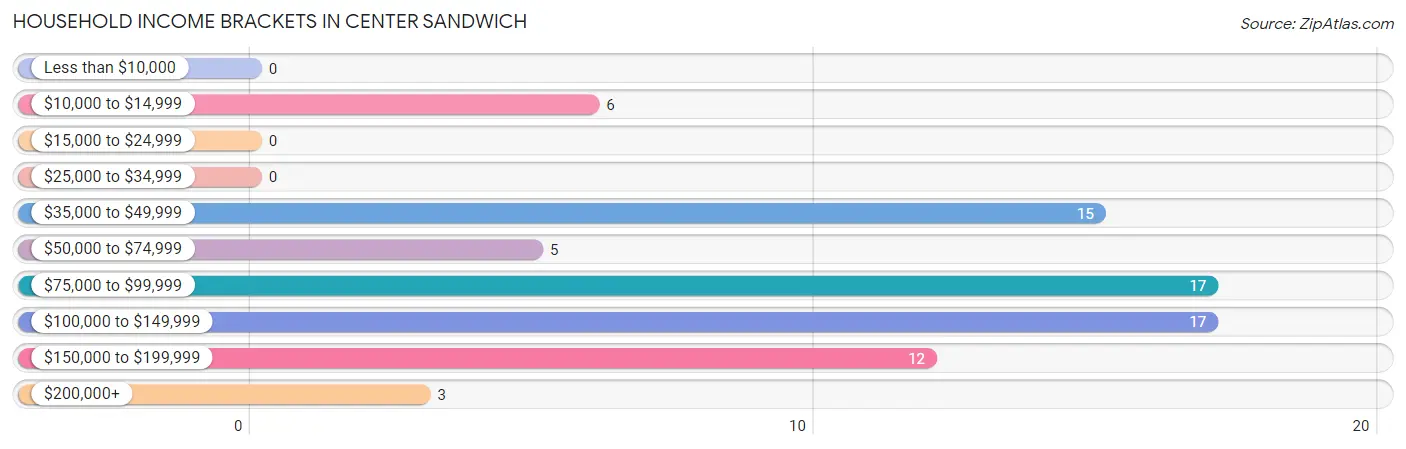
| Income Bracket | # Households | % Households |
| Less than $10,000 | 0 | 0.0% |
| $10,000 to $14,999 | 6 | 8.0% |
| $15,000 to $24,999 | 0 | 0.0% |
| $25,000 to $34,999 | 0 | 0.0% |
| $35,000 to $49,999 | 15 | 20.0% |
| $50,000 to $74,999 | 5 | 6.7% |
| $75,000 to $99,999 | 17 | 22.7% |
| $100,000 to $149,999 | 17 | 22.7% |
| $150,000 to $199,999 | 12 | 16.0% |
| $200,000+ | 3 | 4.0% |
Household Income by Householder Age in Center Sandwich
The median household income in Center Sandwich is $97,708, with the highest median household income of $96,932 found in the 45 to 64 years age bracket for the primary householder. A total of 51 households (68.0%) fall into this category. Meanwhile, the 15 to 24 years age bracket for the primary householder has the lowest median household income of $0, with 9 households (12.0%) in this group.
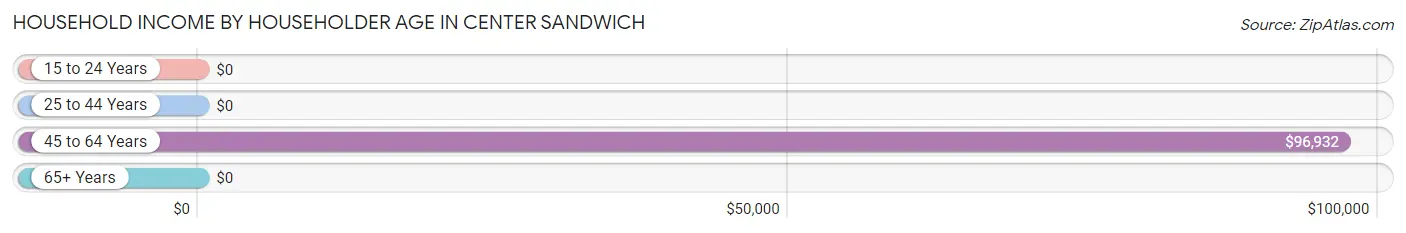
| Income Bracket | # Households | Median Income |
| 15 to 24 Years | 9 (12.0%) | $0 |
| 25 to 44 Years | 0 (0.0%) | $0 |
| 45 to 64 Years | 51 (68.0%) | $96,932 |
| 65+ Years | 15 (20.0%) | $0 |
| Total | 75 (100.0%) | $97,708 |
Poverty in Center Sandwich
Income Below Poverty by Sex and Age in Center Sandwich
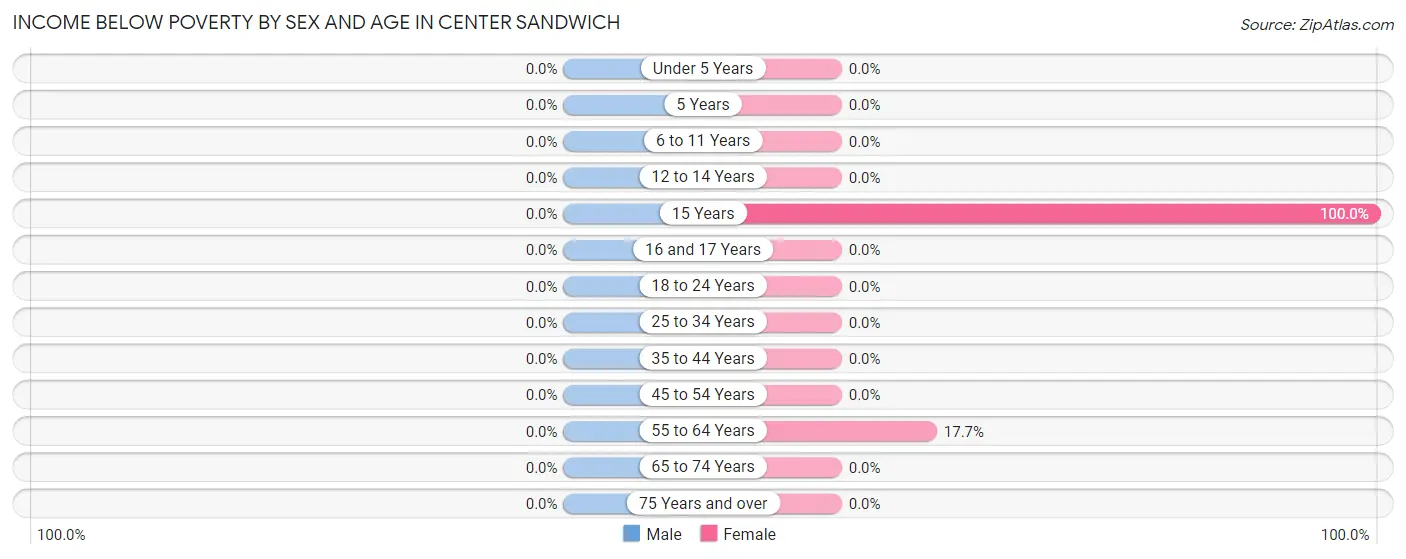
| Age Bracket | Male | Female |
| Under 5 Years | 0 (0.0%) | 0 (0.0%) |
| 5 Years | 0 (0.0%) | 0 (0.0%) |
| 6 to 11 Years | 0 (0.0%) | 0 (0.0%) |
| 12 to 14 Years | 0 (0.0%) | 0 (0.0%) |
| 15 Years | 0 (0.0%) | 3 (100.0%) |
| 16 and 17 Years | 0 (0.0%) | 0 (0.0%) |
| 18 to 24 Years | 0 (0.0%) | 0 (0.0%) |
| 25 to 34 Years | 0 (0.0%) | 0 (0.0%) |
| 35 to 44 Years | 0 (0.0%) | 0 (0.0%) |
| 45 to 54 Years | 0 (0.0%) | 0 (0.0%) |
| 55 to 64 Years | 0 (0.0%) | 6 (17.6%) |
| 65 to 74 Years | 0 (0.0%) | 0 (0.0%) |
| 75 Years and over | 0 (0.0%) | 0 (0.0%) |
| Total | 0 (0.0%) | 9 (8.8%) |
Income Above Poverty by Sex and Age in Center Sandwich
According to the poverty statistics in Center Sandwich, males aged 12 to 14 years and females aged 16 and 17 years are the age groups that are most secure financially, with 100.0% of males and 100.0% of females in these age groups living above the poverty line.
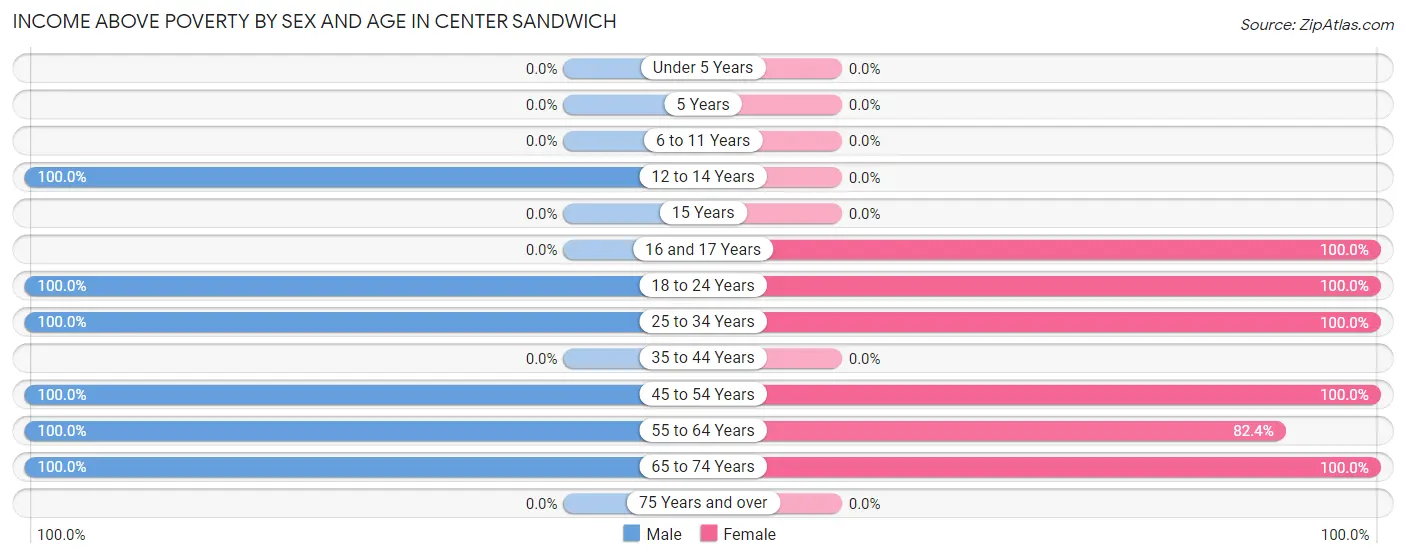
| Age Bracket | Male | Female |
| Under 5 Years | 0 (0.0%) | 0 (0.0%) |
| 5 Years | 0 (0.0%) | 0 (0.0%) |
| 6 to 11 Years | 0 (0.0%) | 0 (0.0%) |
| 12 to 14 Years | 9 (100.0%) | 0 (0.0%) |
| 15 Years | 0 (0.0%) | 0 (0.0%) |
| 16 and 17 Years | 0 (0.0%) | 8 (100.0%) |
| 18 to 24 Years | 15 (100.0%) | 5 (100.0%) |
| 25 to 34 Years | 7 (100.0%) | 20 (100.0%) |
| 35 to 44 Years | 0 (0.0%) | 0 (0.0%) |
| 45 to 54 Years | 10 (100.0%) | 17 (100.0%) |
| 55 to 64 Years | 15 (100.0%) | 28 (82.4%) |
| 65 to 74 Years | 14 (100.0%) | 15 (100.0%) |
| 75 Years and over | 0 (0.0%) | 0 (0.0%) |
| Total | 70 (100.0%) | 93 (91.2%) |
Income Below Poverty Among Married-Couple Families in Center Sandwich
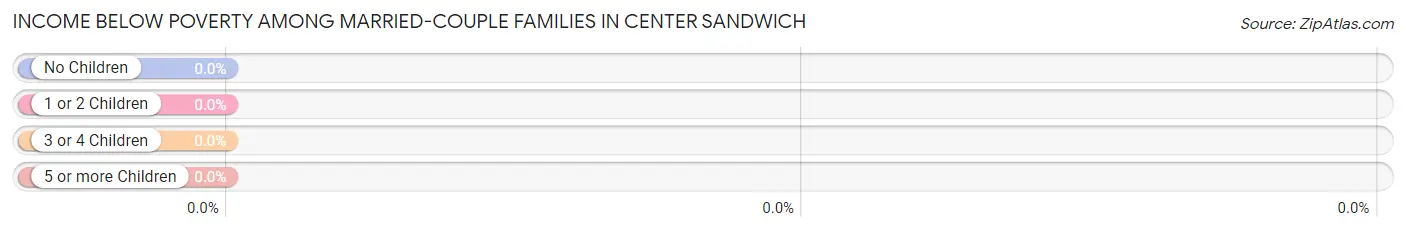
| Children | Above Poverty | Below Poverty |
| No Children | 20 (100.0%) | 0 (0.0%) |
| 1 or 2 Children | 9 (100.0%) | 0 (0.0%) |
| 3 or 4 Children | 0 (0.0%) | 0 (0.0%) |
| 5 or more Children | 0 (0.0%) | 0 (0.0%) |
| Total | 29 (100.0%) | 0 (0.0%) |
Income Below Poverty Among Single-Parent Households in Center Sandwich
| Children | Single Father | Single Mother |
| No Children | 0 (0.0%) | 0 (0.0%) |
| 1 or 2 Children | 0 (0.0%) | 0 (0.0%) |
| 3 or 4 Children | 0 (0.0%) | 0 (0.0%) |
| 5 or more Children | 0 (0.0%) | 0 (0.0%) |
| Total | 0 (0.0%) | 0 (0.0%) |
Income Below Poverty Among Married-Couple vs Single-Parent Households in Center Sandwich
| Children | Married-Couple Families | Single-Parent Households |
| No Children | 0 (0.0%) | 0 (0.0%) |
| 1 or 2 Children | 0 (0.0%) | 0 (0.0%) |
| 3 or 4 Children | 0 (0.0%) | 0 (0.0%) |
| 5 or more Children | 0 (0.0%) | 0 (0.0%) |
| Total | 0 (0.0%) | 0 (0.0%) |
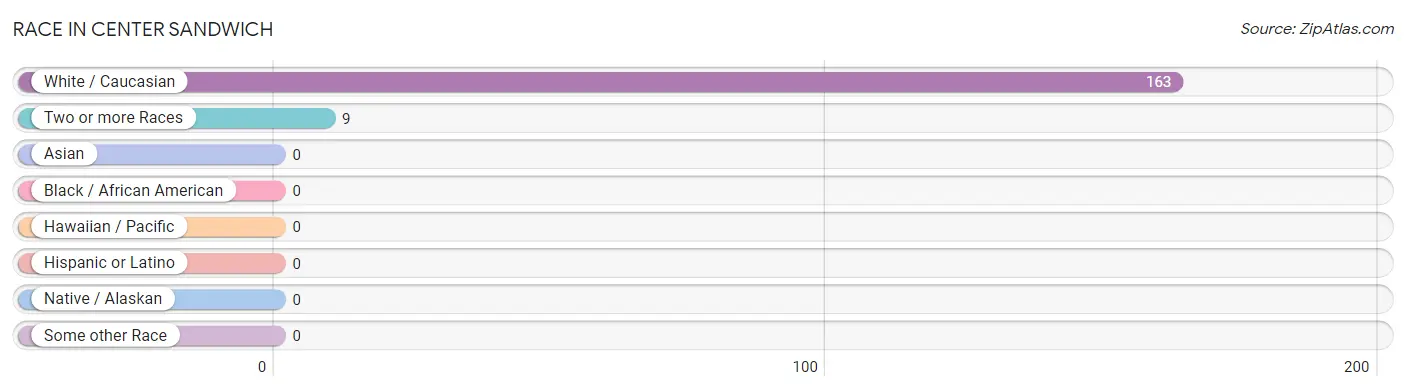
Race in Center Sandwich
The most populous races in Center Sandwich are White / Caucasian (163 | 94.8%), and Two or more Races (9 | 5.2%).
| Race | # Population | % Population |
| Asian | 0 | 0.0% |
| Black / African American | 0 | 0.0% |
| Hawaiian / Pacific | 0 | 0.0% |
| Hispanic or Latino | 0 | 0.0% |
| Native / Alaskan | 0 | 0.0% |
| White / Caucasian | 163 | 94.8% |
| Two or more Races | 9 | 5.2% |
| Some other Race | 0 | 0.0% |
| Total | 172 | 100.0% |
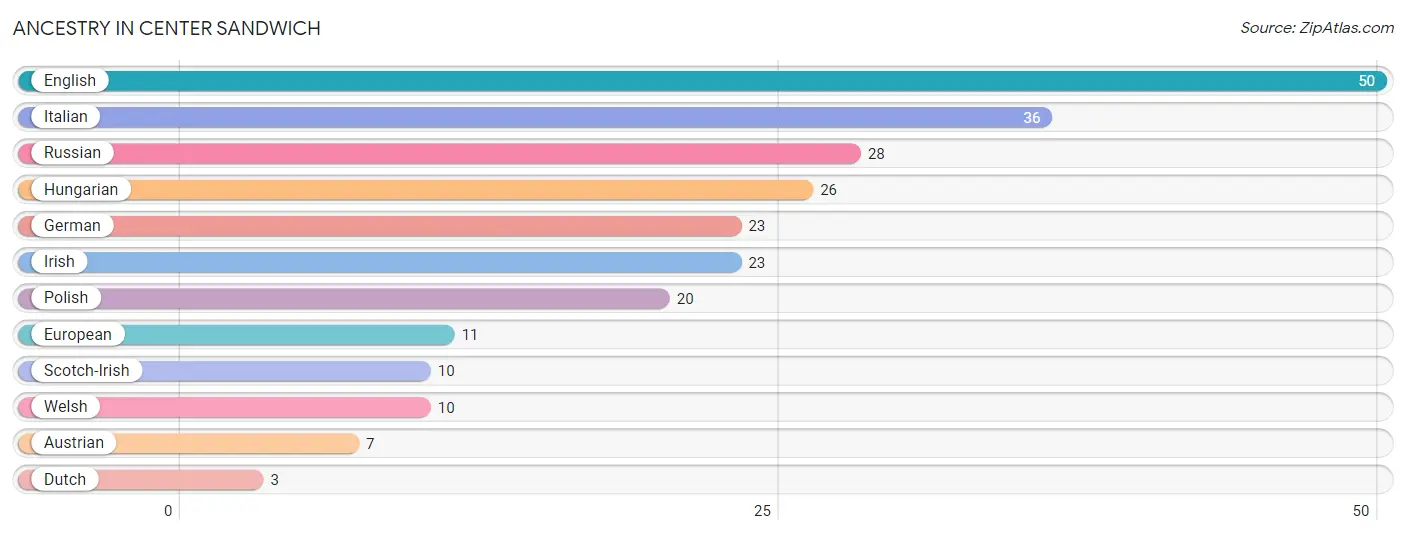
Ancestry in Center Sandwich
The most populous ancestries reported in Center Sandwich are English (50 | 29.1%), Italian (36 | 20.9%), Russian (28 | 16.3%), Hungarian (26 | 15.1%), and German (23 | 13.4%), together accounting for 94.8% of all Center Sandwich residents.
| Ancestry | # Population | % Population |
| Austrian | 7 | 4.1% |
| Dutch | 3 | 1.7% |
| English | 50 | 29.1% |
| European | 11 | 6.4% |
| German | 23 | 13.4% |
| Hungarian | 26 | 15.1% |
| Irish | 23 | 13.4% |
| Italian | 36 | 20.9% |
| Polish | 20 | 11.6% |
| Russian | 28 | 16.3% |
| Scotch-Irish | 10 | 5.8% |
| Welsh | 10 | 5.8% | View All 12 Rows |
Immigrants in Center Sandwich

| Immigration Origin | # Population | % Population | View All 0 Rows |
Sex and Age in Center Sandwich
Sex and Age in Center Sandwich
The most populous age groups in Center Sandwich are 20 to 24 Years (15 | 21.4%) for men and 60 to 64 Years (23 | 22.6%) for women.
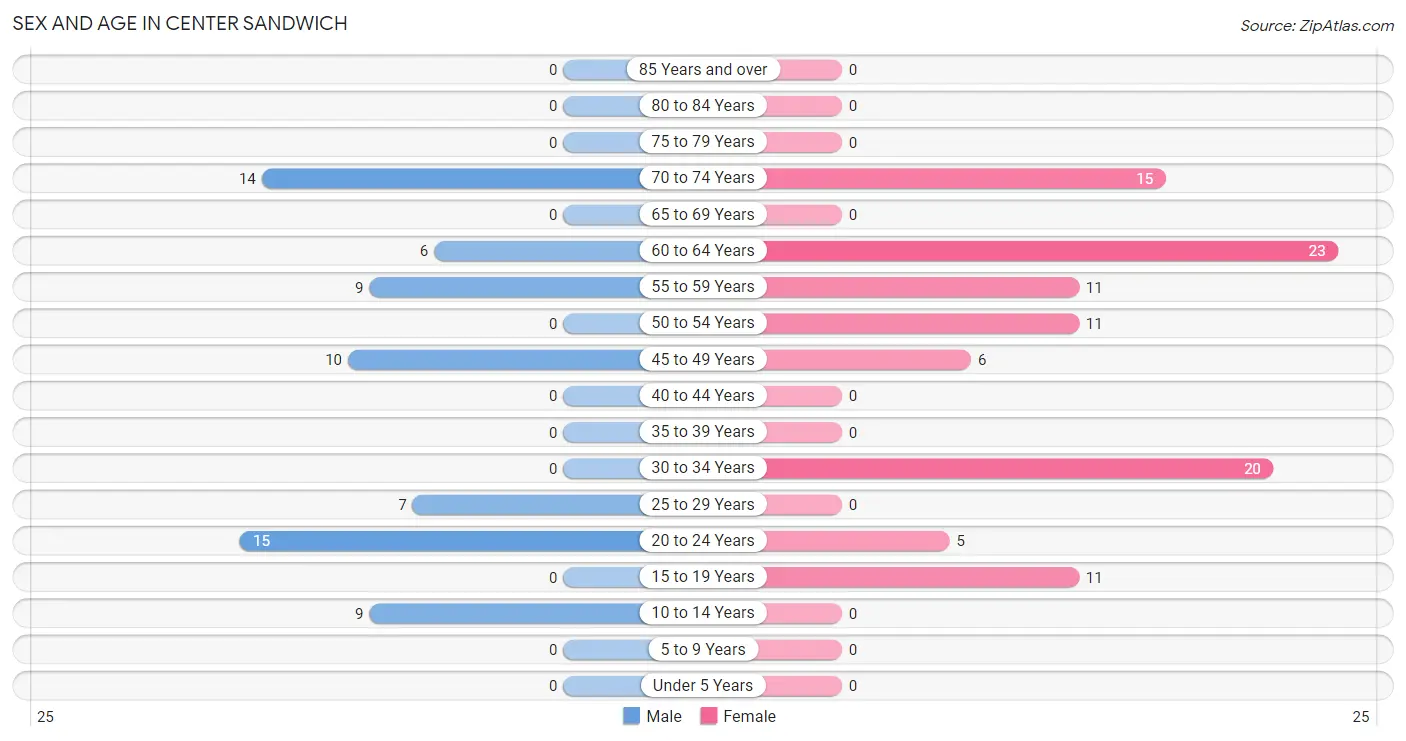
| Age Bracket | Male | Female |
| Under 5 Years | 0 (0.0%) | 0 (0.0%) |
| 5 to 9 Years | 0 (0.0%) | 0 (0.0%) |
| 10 to 14 Years | 9 (12.9%) | 0 (0.0%) |
| 15 to 19 Years | 0 (0.0%) | 11 (10.8%) |
| 20 to 24 Years | 15 (21.4%) | 5 (4.9%) |
| 25 to 29 Years | 7 (10.0%) | 0 (0.0%) |
| 30 to 34 Years | 0 (0.0%) | 20 (19.6%) |
| 35 to 39 Years | 0 (0.0%) | 0 (0.0%) |
| 40 to 44 Years | 0 (0.0%) | 0 (0.0%) |
| 45 to 49 Years | 10 (14.3%) | 6 (5.9%) |
| 50 to 54 Years | 0 (0.0%) | 11 (10.8%) |
| 55 to 59 Years | 9 (12.9%) | 11 (10.8%) |
| 60 to 64 Years | 6 (8.6%) | 23 (22.6%) |
| 65 to 69 Years | 0 (0.0%) | 0 (0.0%) |
| 70 to 74 Years | 14 (20.0%) | 15 (14.7%) |
| 75 to 79 Years | 0 (0.0%) | 0 (0.0%) |
| 80 to 84 Years | 0 (0.0%) | 0 (0.0%) |
| 85 Years and over | 0 (0.0%) | 0 (0.0%) |
| Total | 70 (100.0%) | 102 (100.0%) |
Families and Households in Center Sandwich
Median Family Size in Center Sandwich
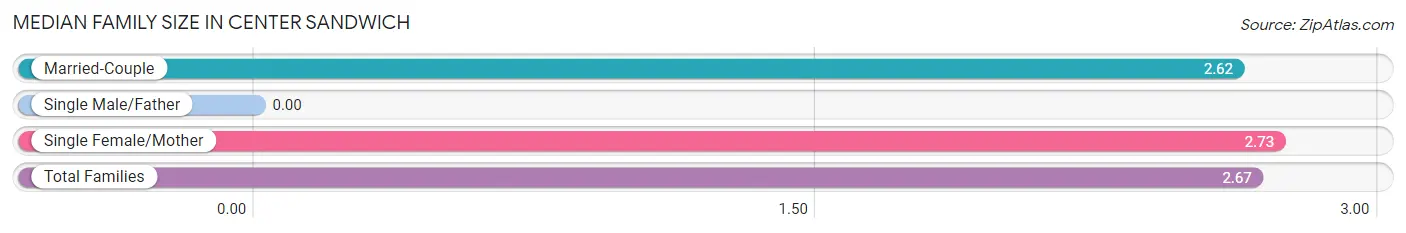
| Family Type | # Families | Family Size |
| Married-Couple | 29 (56.9%) | 2.62 |
| Single Male/Father | 0 (0.0%) | - |
| Single Female/Mother | 22 (43.1%) | 2.73 |
| Total Families | 51 (100.0%) | 2.67 |
Median Household Size in Center Sandwich
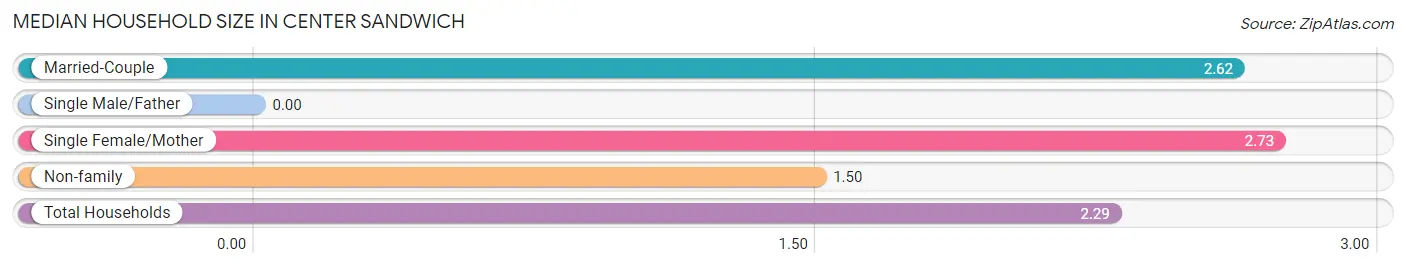
| Household Type | # Households | Household Size |
| Married-Couple | 29 (38.7%) | 2.62 |
| Single Male/Father | 0 (0.0%) | - |
| Single Female/Mother | 22 (29.3%) | 2.73 |
| Non-family | 24 (32.0%) | 1.50 |
| Total Households | 75 (100.0%) | 2.29 |
Household Size by Marriage Status in Center Sandwich
Out of a total of 75 households in Center Sandwich, 51 (68.0%) are family households, while 24 (32.0%) are nonfamily households. The most numerous type of family households are 2-person households, comprising 42, and the most common type of nonfamily households are 1-person households, comprising 18.
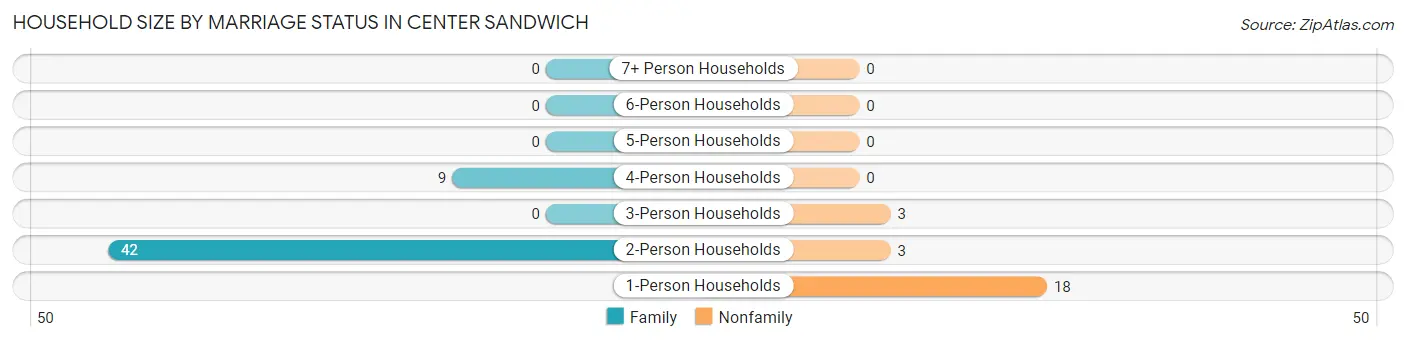
| Household Size | Family Households | Nonfamily Households |
| 1-Person Households | - | 18 (24.0%) |
| 2-Person Households | 42 (56.0%) | 3 (4.0%) |
| 3-Person Households | 0 (0.0%) | 3 (4.0%) |
| 4-Person Households | 9 (12.0%) | 0 (0.0%) |
| 5-Person Households | 0 (0.0%) | 0 (0.0%) |
| 6-Person Households | 0 (0.0%) | 0 (0.0%) |
| 7+ Person Households | 0 (0.0%) | 0 (0.0%) |
| Total | 51 (68.0%) | 24 (32.0%) |
Female Fertility in Center Sandwich
Fertility by Age in Center Sandwich
| Age Bracket | Women with Births | Births / 1,000 Women |
| 15 to 19 years | 0 (0.0%) | 0.0 |
| 20 to 34 years | 0 (0.0%) | 0.0 |
| 35 to 50 years | 0 (0.0%) | 0.0 |
| Total | 0 (0.0%) | 0.0 |
Fertility by Age by Marriage Status in Center Sandwich
| Age Bracket | Married | Unmarried |
| 15 to 19 years | 0 (0.0%) | 0 (0.0%) |
| 20 to 34 years | 0 (0.0%) | 0 (0.0%) |
| 35 to 50 years | 0 (0.0%) | 0 (0.0%) |
| Total | 0 (0.0%) | 0 (0.0%) |
Fertility by Education in Center Sandwich
| Educational Attainment | Women with Births | Births / 1,000 Women |
| Less than High School | 0 (0.0%) | 0.0 |
| High School Diploma | 0 (0.0%) | 0.0 |
| College or Associate's Degree | 0 (0.0%) | 0.0 |
| Bachelor's Degree | 0 (0.0%) | 0.0 |
| Graduate Degree | 0 (0.0%) | 0.0 |
| Total | 0 (0.0%) | 0.0 |
Fertility by Education by Marriage Status in Center Sandwich
| Educational Attainment | Married | Unmarried |
| Less than High School | 0 (0.0%) | 0 (0.0%) |
| High School Diploma | 0 (0.0%) | 0 (0.0%) |
| College or Associate's Degree | 0 (0.0%) | 0 (0.0%) |
| Bachelor's Degree | 0 (0.0%) | 0 (0.0%) |
| Graduate Degree | 0 (0.0%) | 0 (0.0%) |
| Total | 0 (0.0%) | 0 (0.0%) |
Employment Characteristics in Center Sandwich
Employment by Class of Employer in Center Sandwich
Among the 110 employed individuals in Center Sandwich, private company employees (42 | 38.2%), self-employed (not incorporated) (33 | 30.0%), and not-for-profit organizations (23 | 20.9%) make up the most common classes of employment.
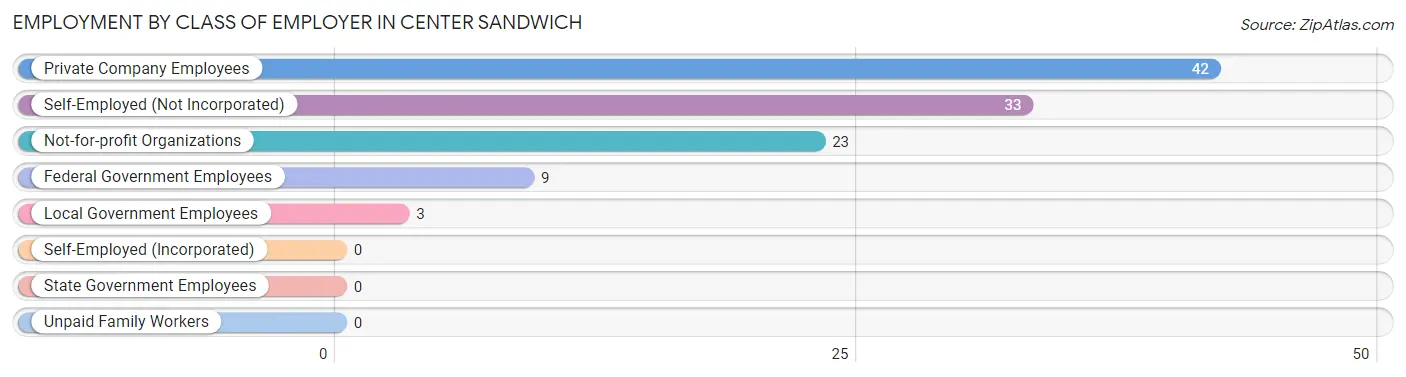
| Employer Class | # Employees | % Employees |
| Private Company Employees | 42 | 38.2% |
| Self-Employed (Incorporated) | 0 | 0.0% |
| Self-Employed (Not Incorporated) | 33 | 30.0% |
| Not-for-profit Organizations | 23 | 20.9% |
| Local Government Employees | 3 | 2.7% |
| State Government Employees | 0 | 0.0% |
| Federal Government Employees | 9 | 8.2% |
| Unpaid Family Workers | 0 | 0.0% |
| Total | 110 | 100.0% |
Employment Status by Age in Center Sandwich
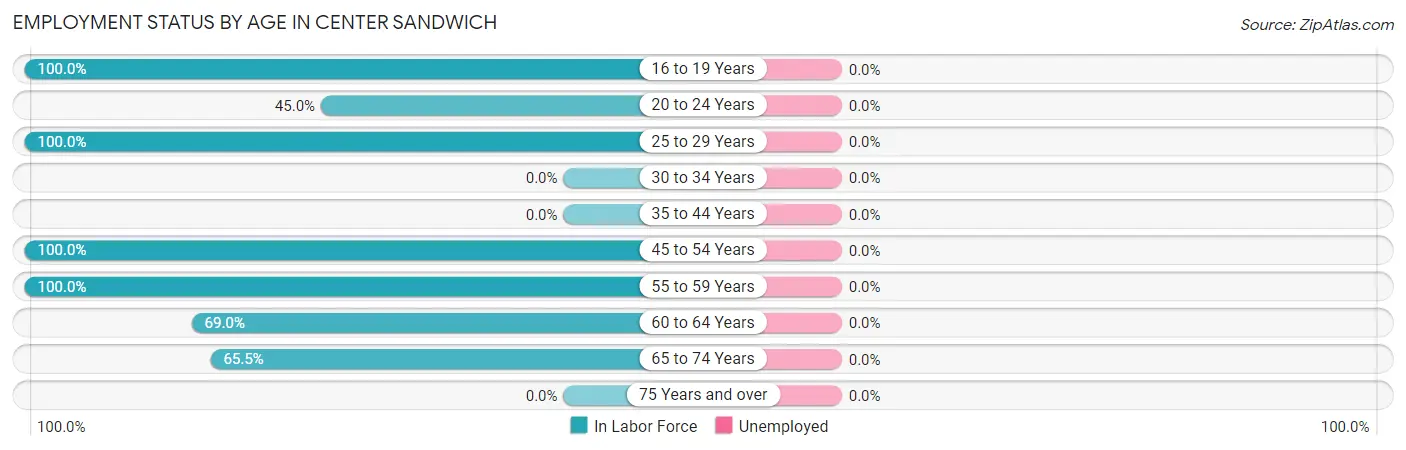
| Age Bracket | In Labor Force | Unemployed |
| 16 to 19 Years | 8 (100.0%) | 0 (0.0%) |
| 20 to 24 Years | 9 (45.0%) | 0 (0.0%) |
| 25 to 29 Years | 7 (100.0%) | 0 (0.0%) |
| 30 to 34 Years | 0 (0.0%) | 0 (0.0%) |
| 35 to 44 Years | 0 (0.0%) | 0 (0.0%) |
| 45 to 54 Years | 27 (100.0%) | 0 (0.0%) |
| 55 to 59 Years | 20 (100.0%) | 0 (0.0%) |
| 60 to 64 Years | 20 (69.0%) | 0 (0.0%) |
| 65 to 74 Years | 19 (65.5%) | 0 (0.0%) |
| 75 Years and over | 0 (0.0%) | 0 (0.0%) |
| Total | 110 (68.8%) | 0 (0.0%) |
Employment Status by Educational Attainment in Center Sandwich
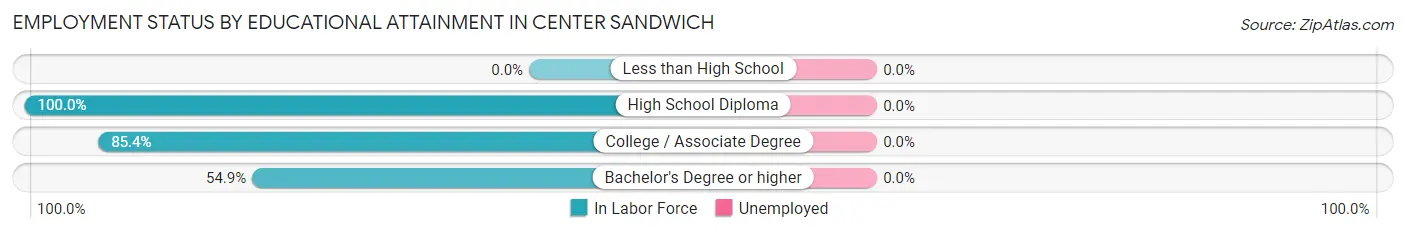
| Educational Attainment | In Labor Force | Unemployed |
| Less than High School | 0 (0.0%) | 0 (0.0%) |
| High School Diploma | 11 (100.0%) | 0 (0.0%) |
| College / Associate Degree | 35 (85.4%) | 0 (0.0%) |
| Bachelor's Degree or higher | 28 (54.9%) | 0 (0.0%) |
| Total | 74 (71.8%) | 0 (0.0%) |
Employment Occupations by Sex in Center Sandwich
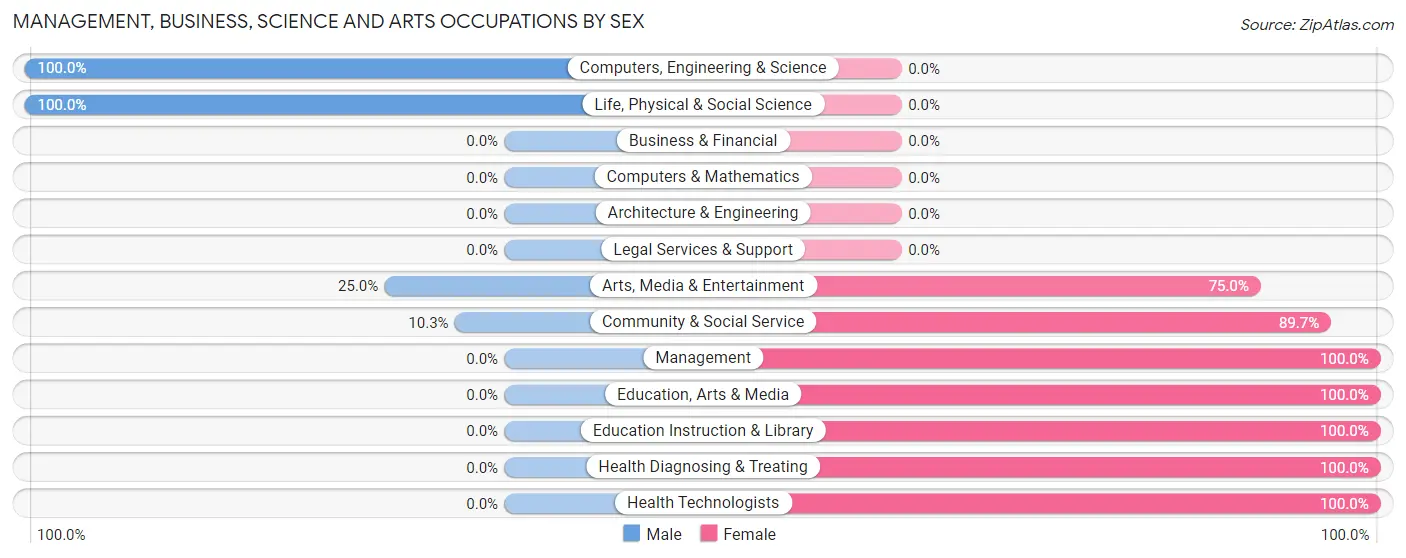
Management, Business, Science and Arts Occupations
The most common Management, Business, Science and Arts occupations in Center Sandwich are Community & Social Service (29 | 26.4%), Education Instruction & Library (14 | 12.7%), Health Diagnosing & Treating (14 | 12.7%), Health Technologists (14 | 12.7%), and Arts, Media & Entertainment (12 | 10.9%).
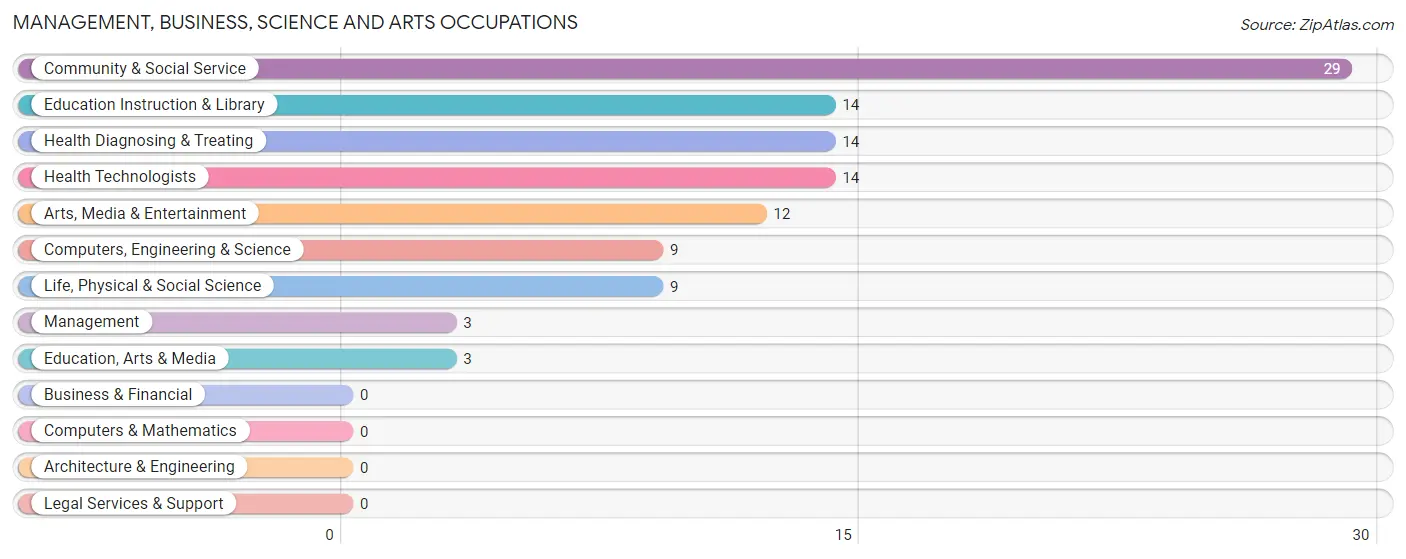
Management, Business, Science and Arts Occupations by Sex
Within the Management, Business, Science and Arts occupations in Center Sandwich, the most male-oriented occupations are Computers, Engineering & Science (100.0%), Life, Physical & Social Science (100.0%), and Arts, Media & Entertainment (25.0%), while the most female-oriented occupations are Management (100.0%), Education, Arts & Media (100.0%), and Education Instruction & Library (100.0%).
| Occupation | Male | Female |
| Management | 0 (0.0%) | 3 (100.0%) |
| Business & Financial | 0 (0.0%) | 0 (0.0%) |
| Computers, Engineering & Science | 9 (100.0%) | 0 (0.0%) |
| Computers & Mathematics | 0 (0.0%) | 0 (0.0%) |
| Architecture & Engineering | 0 (0.0%) | 0 (0.0%) |
| Life, Physical & Social Science | 9 (100.0%) | 0 (0.0%) |
| Community & Social Service | 3 (10.3%) | 26 (89.7%) |
| Education, Arts & Media | 0 (0.0%) | 3 (100.0%) |
| Legal Services & Support | 0 (0.0%) | 0 (0.0%) |
| Education Instruction & Library | 0 (0.0%) | 14 (100.0%) |
| Arts, Media & Entertainment | 3 (25.0%) | 9 (75.0%) |
| Health Diagnosing & Treating | 0 (0.0%) | 14 (100.0%) |
| Health Technologists | 0 (0.0%) | 14 (100.0%) |
| Total (Category) | 12 (21.8%) | 43 (78.2%) |
| Total (Overall) | 51 (46.4%) | 59 (53.6%) |
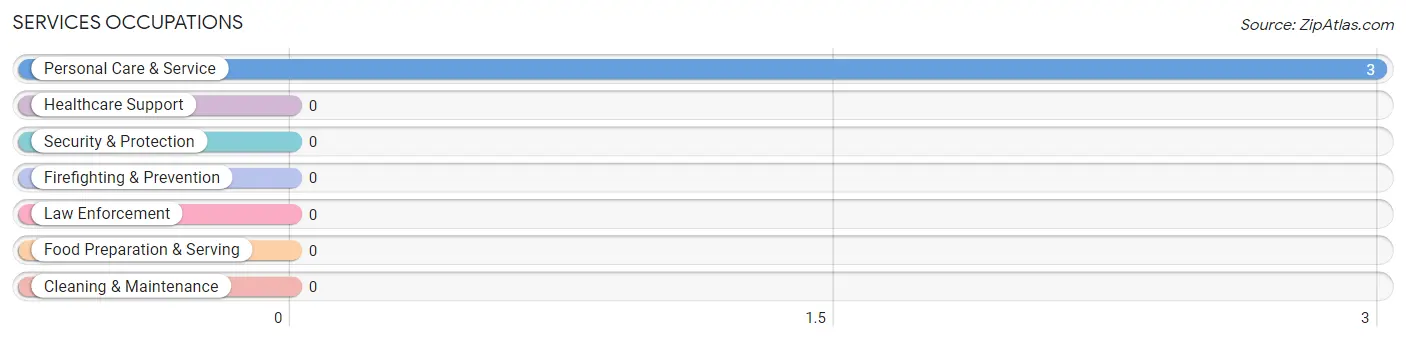
Services Occupations
The most common Services occupations in Center Sandwich are , and Personal Care & Service (3 | 2.7%).
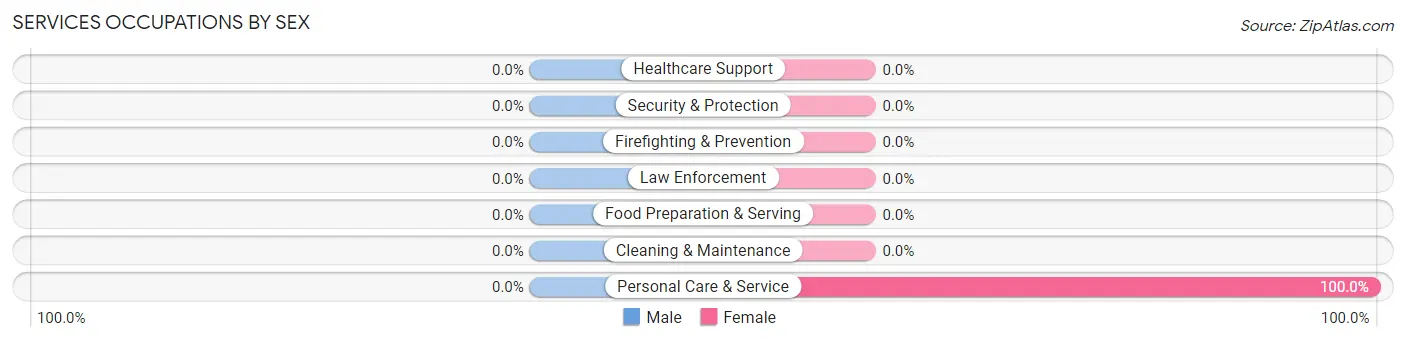
Services Occupations by Sex
| Occupation | Male | Female |
| Healthcare Support | 0 (0.0%) | 0 (0.0%) |
| Security & Protection | 0 (0.0%) | 0 (0.0%) |
| Firefighting & Prevention | 0 (0.0%) | 0 (0.0%) |
| Law Enforcement | 0 (0.0%) | 0 (0.0%) |
| Food Preparation & Serving | 0 (0.0%) | 0 (0.0%) |
| Cleaning & Maintenance | 0 (0.0%) | 0 (0.0%) |
| Personal Care & Service | 0 (0.0%) | 3 (100.0%) |
| Total (Category) | 0 (0.0%) | 3 (100.0%) |
| Total (Overall) | 51 (46.4%) | 59 (53.6%) |
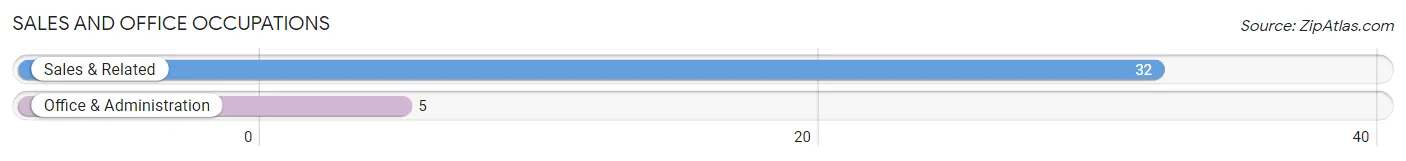
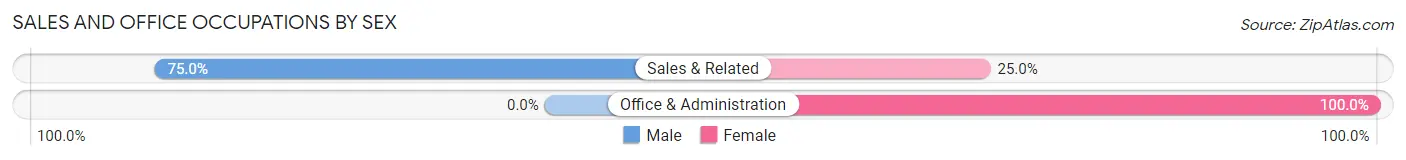
Sales and Office Occupations
The most common Sales and Office occupations in Center Sandwich are Sales & Related (32 | 29.1%), and Office & Administration (5 | 4.5%).
Sales and Office Occupations by Sex
| Occupation | Male | Female |
| Sales & Related | 24 (75.0%) | 8 (25.0%) |
| Office & Administration | 0 (0.0%) | 5 (100.0%) |
| Total (Category) | 24 (64.9%) | 13 (35.1%) |
| Total (Overall) | 51 (46.4%) | 59 (53.6%) |
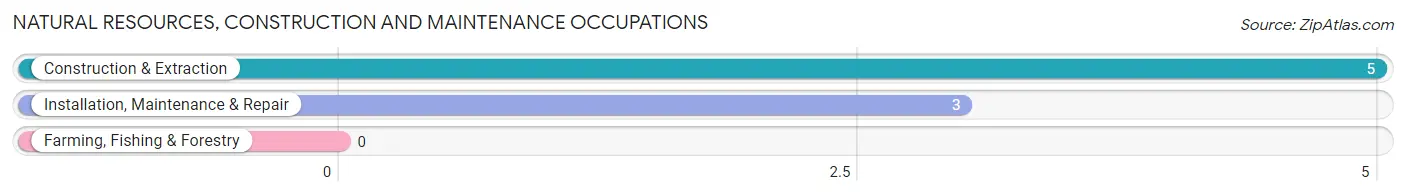
Natural Resources, Construction and Maintenance Occupations
The most common Natural Resources, Construction and Maintenance occupations in Center Sandwich are Construction & Extraction (5 | 4.5%), and Installation, Maintenance & Repair (3 | 2.7%).
Natural Resources, Construction and Maintenance Occupations by Sex
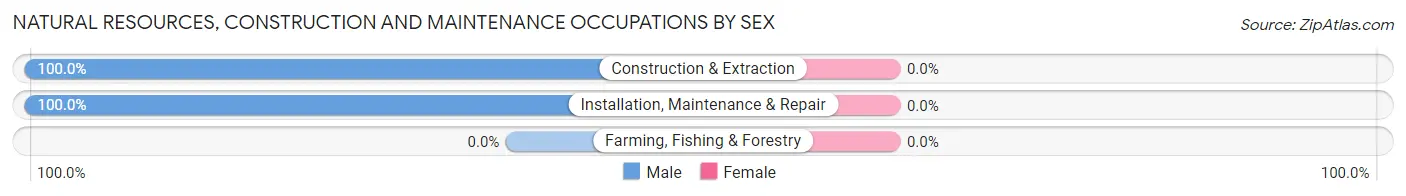
| Occupation | Male | Female |
| Farming, Fishing & Forestry | 0 (0.0%) | 0 (0.0%) |
| Construction & Extraction | 5 (100.0%) | 0 (0.0%) |
| Installation, Maintenance & Repair | 3 (100.0%) | 0 (0.0%) |
| Total (Category) | 8 (100.0%) | 0 (0.0%) |
| Total (Overall) | 51 (46.4%) | 59 (53.6%) |
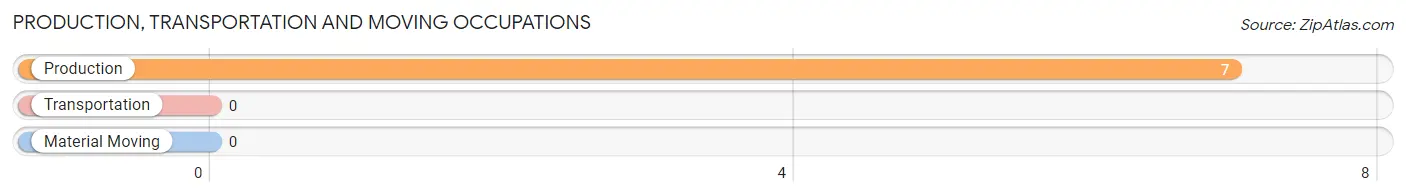
Production, Transportation and Moving Occupations
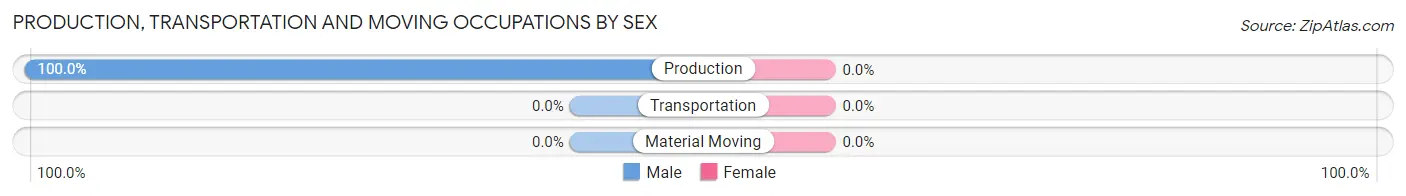
The most common Production, Transportation and Moving occupations in Center Sandwich are , and Production (7 | 6.4%).
Production, Transportation and Moving Occupations by Sex
| Occupation | Male | Female |
| Production | 7 (100.0%) | 0 (0.0%) |
| Transportation | 0 (0.0%) | 0 (0.0%) |
| Material Moving | 0 (0.0%) | 0 (0.0%) |
| Total (Category) | 7 (100.0%) | 0 (0.0%) |
| Total (Overall) | 51 (46.4%) | 59 (53.6%) |
Employment Industries by Sex in Center Sandwich
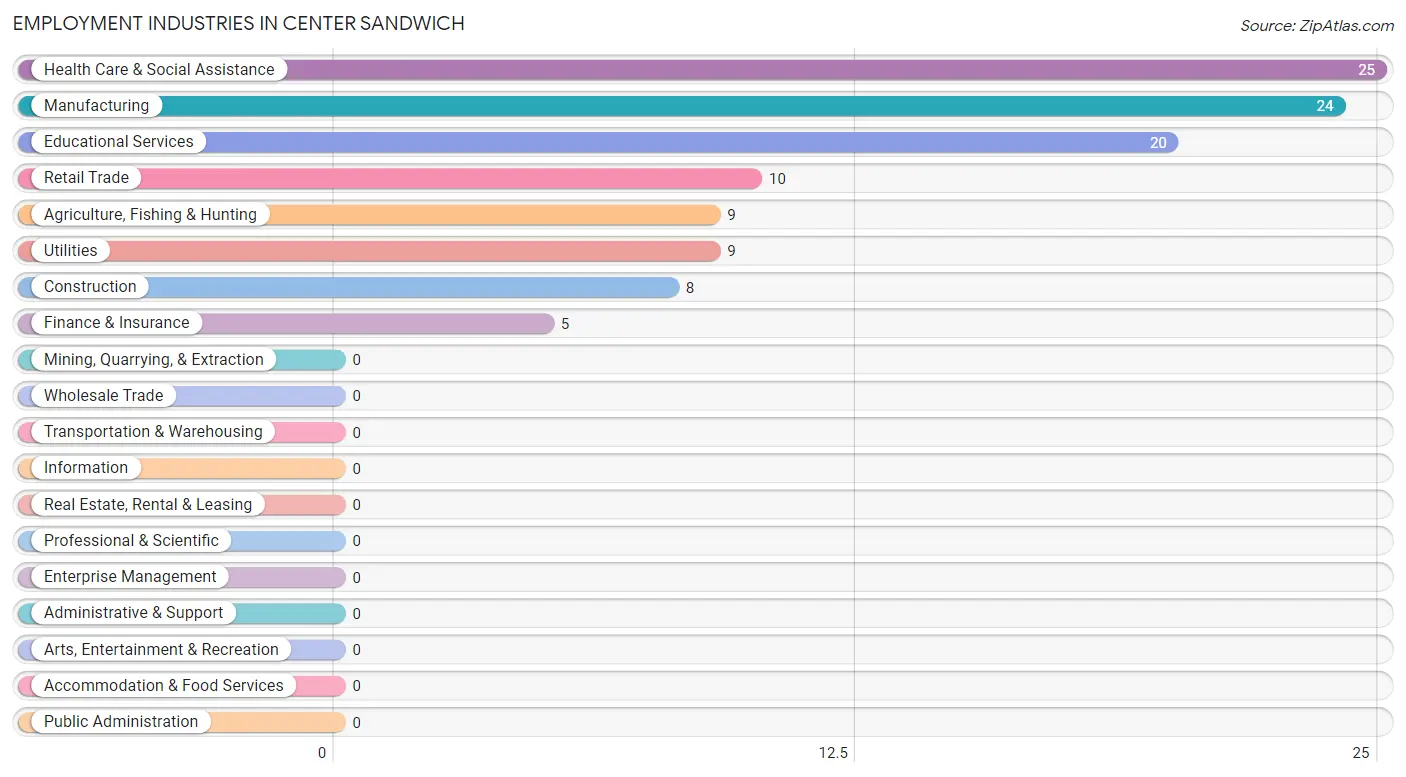
Employment Industries in Center Sandwich
The major employment industries in Center Sandwich include Health Care & Social Assistance (25 | 22.7%), Manufacturing (24 | 21.8%), Educational Services (20 | 18.2%), Retail Trade (10 | 9.1%), and Agriculture, Fishing & Hunting (9 | 8.2%).
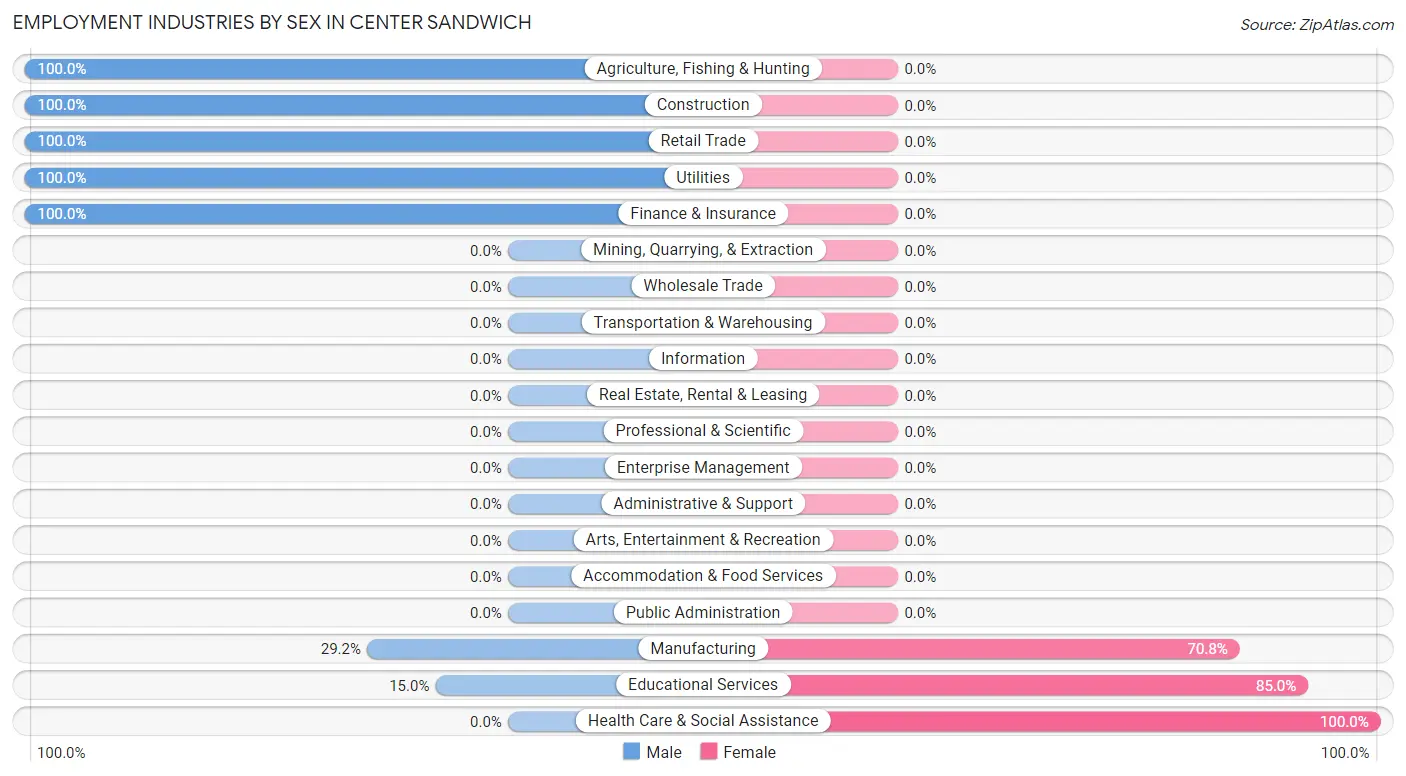
Employment Industries by Sex in Center Sandwich
The Center Sandwich industries that see more men than women are Agriculture, Fishing & Hunting (100.0%), Construction (100.0%), and Retail Trade (100.0%), whereas the industries that tend to have a higher number of women are Health Care & Social Assistance (100.0%), Educational Services (85.0%), and Manufacturing (70.8%).
| Industry | Male | Female |
| Agriculture, Fishing & Hunting | 9 (100.0%) | 0 (0.0%) |
| Mining, Quarrying, & Extraction | 0 (0.0%) | 0 (0.0%) |
| Construction | 8 (100.0%) | 0 (0.0%) |
| Manufacturing | 7 (29.2%) | 17 (70.8%) |
| Wholesale Trade | 0 (0.0%) | 0 (0.0%) |
| Retail Trade | 10 (100.0%) | 0 (0.0%) |
| Transportation & Warehousing | 0 (0.0%) | 0 (0.0%) |
| Utilities | 9 (100.0%) | 0 (0.0%) |
| Information | 0 (0.0%) | 0 (0.0%) |
| Finance & Insurance | 5 (100.0%) | 0 (0.0%) |
| Real Estate, Rental & Leasing | 0 (0.0%) | 0 (0.0%) |
| Professional & Scientific | 0 (0.0%) | 0 (0.0%) |
| Enterprise Management | 0 (0.0%) | 0 (0.0%) |
| Administrative & Support | 0 (0.0%) | 0 (0.0%) |
| Educational Services | 3 (15.0%) | 17 (85.0%) |
| Health Care & Social Assistance | 0 (0.0%) | 25 (100.0%) |
| Arts, Entertainment & Recreation | 0 (0.0%) | 0 (0.0%) |
| Accommodation & Food Services | 0 (0.0%) | 0 (0.0%) |
| Public Administration | 0 (0.0%) | 0 (0.0%) |
| Total | 51 (46.4%) | 59 (53.6%) |
Education in Center Sandwich
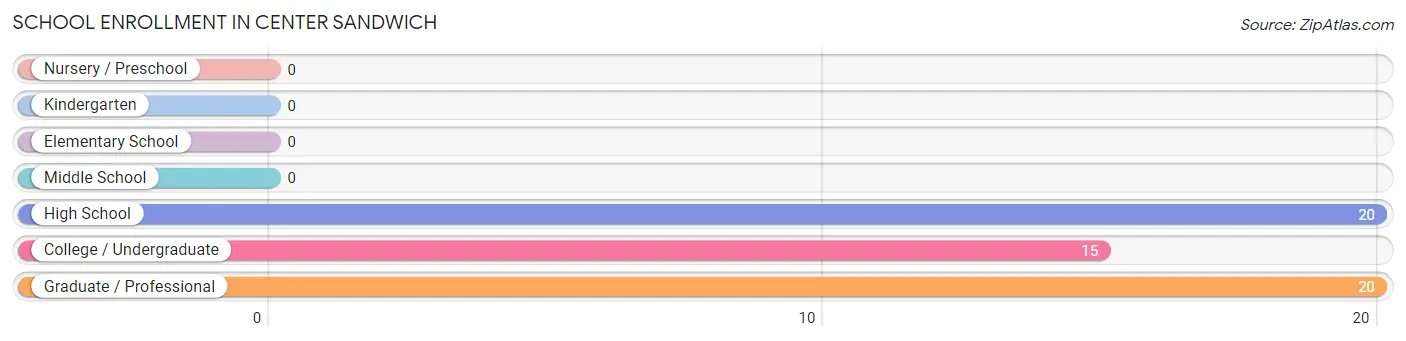
School Enrollment in Center Sandwich
The most common levels of schooling among the 55 students in Center Sandwich are high school (20 | 36.4%), graduate / professional (20 | 36.4%), and college / undergraduate (15 | 27.3%).
| School Level | # Students | % Students |
| Nursery / Preschool | 0 | 0.0% |
| Kindergarten | 0 | 0.0% |
| Elementary School | 0 | 0.0% |
| Middle School | 0 | 0.0% |
| High School | 20 | 36.4% |
| College / Undergraduate | 15 | 27.3% |
| Graduate / Professional | 20 | 36.4% |
| Total | 55 | 100.0% |
School Enrollment by Age by Funding Source in Center Sandwich
Out of a total of 55 students who are enrolled in schools in Center Sandwich, 6 (10.9%) attend a private institution, while the remaining 49 (89.1%) are enrolled in public schools. The age group of 20 to 24 year olds has the highest likelihood of being enrolled in private schools, with 6 (40.0% in the age bracket) enrolled. Conversely, the age group of 10 to 14 year olds has the lowest likelihood of being enrolled in a private school, with 9 (100.0% in the age bracket) attending a public institution.
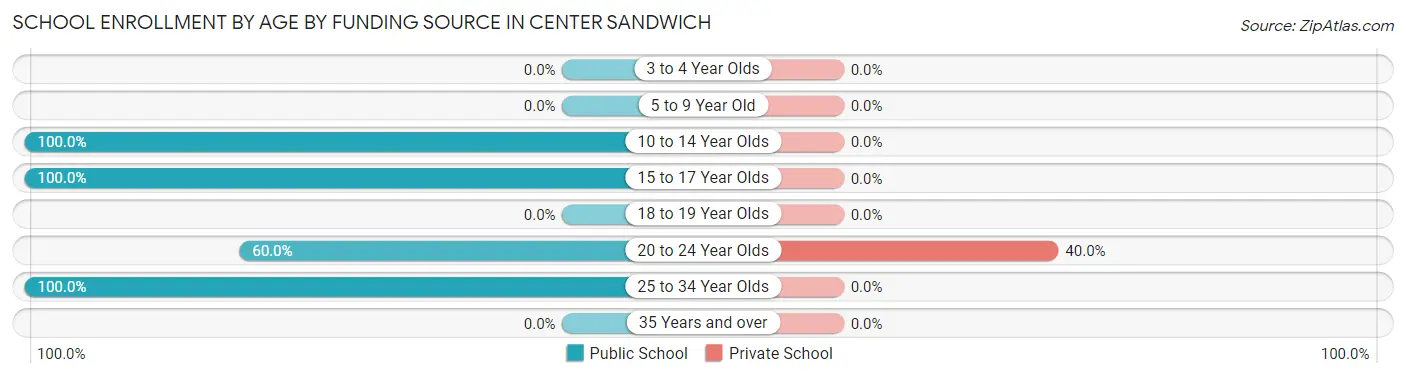
| Age Bracket | Public School | Private School |
| 3 to 4 Year Olds | 0 (0.0%) | 0 (0.0%) |
| 5 to 9 Year Old | 0 (0.0%) | 0 (0.0%) |
| 10 to 14 Year Olds | 9 (100.0%) | 0 (0.0%) |
| 15 to 17 Year Olds | 11 (100.0%) | 0 (0.0%) |
| 18 to 19 Year Olds | 0 (0.0%) | 0 (0.0%) |
| 20 to 24 Year Olds | 9 (60.0%) | 6 (40.0%) |
| 25 to 34 Year Olds | 20 (100.0%) | 0 (0.0%) |
| 35 Years and over | 0 (0.0%) | 0 (0.0%) |
| Total | 49 (89.1%) | 6 (10.9%) |
Educational Attainment by Field of Study in Center Sandwich
Bio, nature & agricultural (20 | 30.8%), education (11 | 16.9%), literature & languages (10 | 15.4%), liberal arts & history (9 | 13.9%), and psychology (6 | 9.2%) are the most common fields of study among 65 individuals in Center Sandwich who have obtained a bachelor's degree or higher.
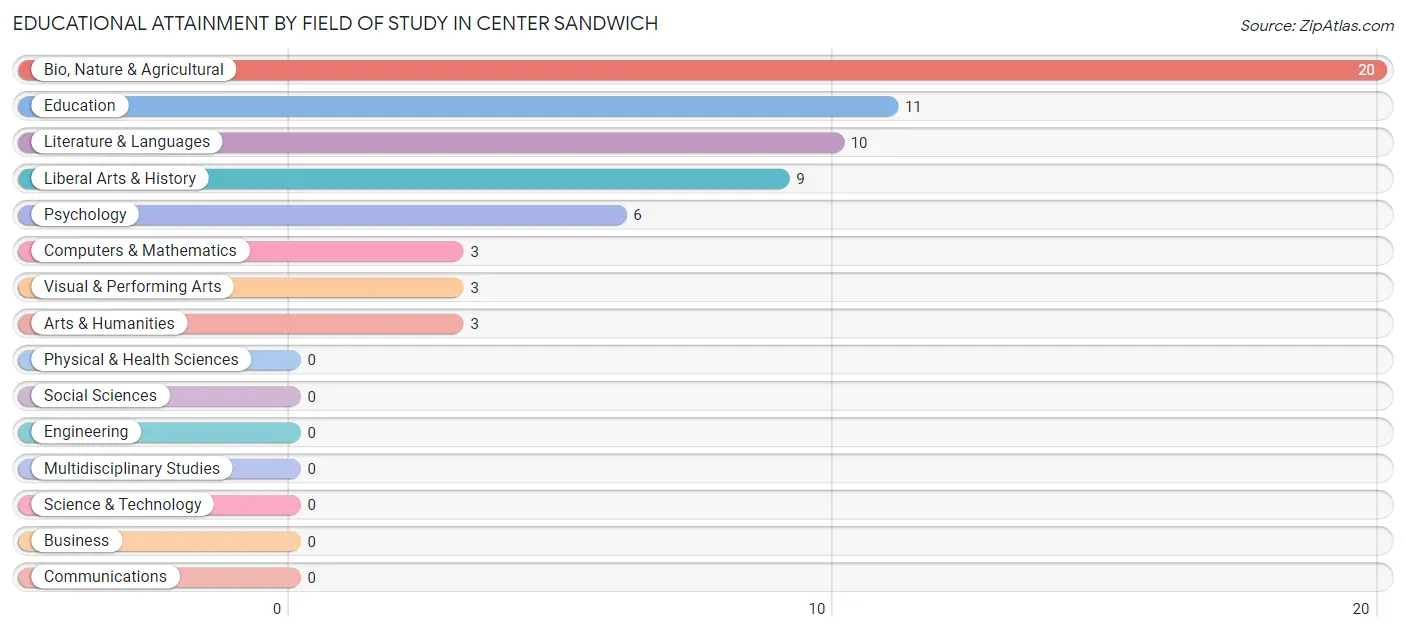
| Field of Study | # Graduates | % Graduates |
| Computers & Mathematics | 3 | 4.6% |
| Bio, Nature & Agricultural | 20 | 30.8% |
| Physical & Health Sciences | 0 | 0.0% |
| Psychology | 6 | 9.2% |
| Social Sciences | 0 | 0.0% |
| Engineering | 0 | 0.0% |
| Multidisciplinary Studies | 0 | 0.0% |
| Science & Technology | 0 | 0.0% |
| Business | 0 | 0.0% |
| Education | 11 | 16.9% |
| Literature & Languages | 10 | 15.4% |
| Liberal Arts & History | 9 | 13.9% |
| Visual & Performing Arts | 3 | 4.6% |
| Communications | 0 | 0.0% |
| Arts & Humanities | 3 | 4.6% |
| Total | 65 | 100.0% |
Transportation & Commute in Center Sandwich
Vehicle Availability by Sex in Center Sandwich
The most prevalent vehicle ownership categories in Center Sandwich are males with 2 vehicles (28, accounting for 54.9%) and females with 2 vehicles (34, making up 47.5%).
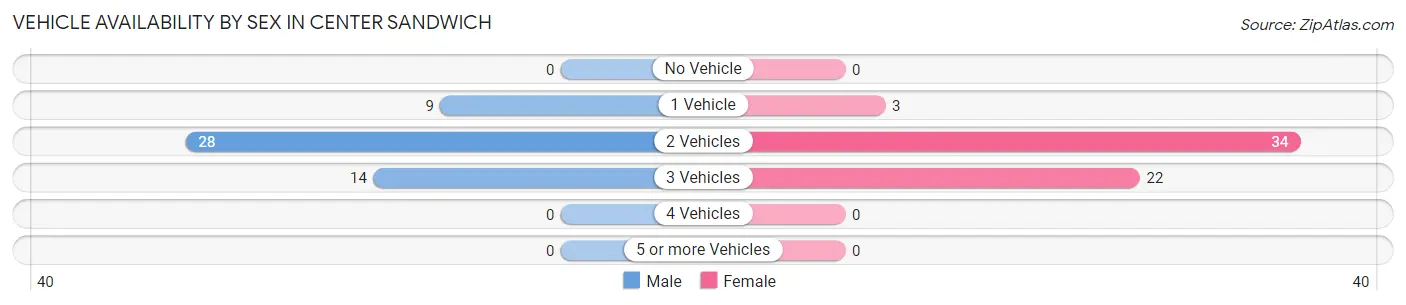
| Vehicles Available | Male | Female |
| No Vehicle | 0 (0.0%) | 0 (0.0%) |
| 1 Vehicle | 9 (17.6%) | 3 (5.1%) |
| 2 Vehicles | 28 (54.9%) | 34 (57.6%) |
| 3 Vehicles | 14 (27.5%) | 22 (37.3%) |
| 4 Vehicles | 0 (0.0%) | 0 (0.0%) |
| 5 or more Vehicles | 0 (0.0%) | 0 (0.0%) |
| Total | 51 (100.0%) | 59 (100.0%) |
Commute Time in Center Sandwich
The most frequently occuring commute durations in Center Sandwich are 30 to 34 minutes (21 commuters, 26.3%), 15 to 19 minutes (14 commuters, 17.5%), and 45 to 59 minutes (14 commuters, 17.5%).
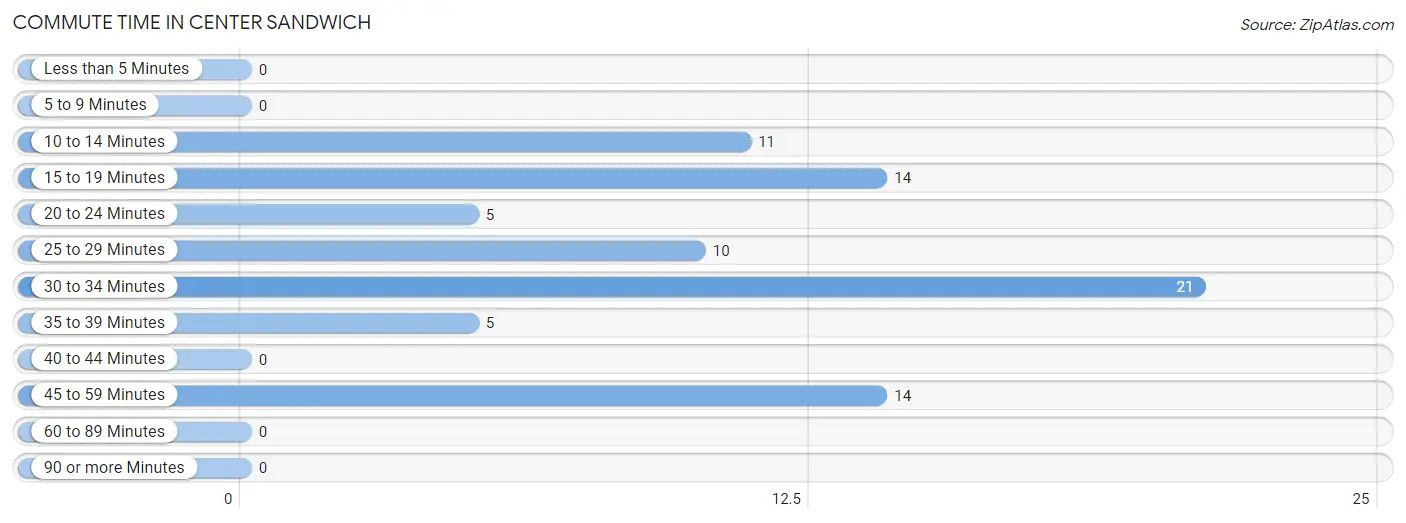
| Commute Time | # Commuters | % Commuters |
| Less than 5 Minutes | 0 | 0.0% |
| 5 to 9 Minutes | 0 | 0.0% |
| 10 to 14 Minutes | 11 | 13.8% |
| 15 to 19 Minutes | 14 | 17.5% |
| 20 to 24 Minutes | 5 | 6.2% |
| 25 to 29 Minutes | 10 | 12.5% |
| 30 to 34 Minutes | 21 | 26.3% |
| 35 to 39 Minutes | 5 | 6.2% |
| 40 to 44 Minutes | 0 | 0.0% |
| 45 to 59 Minutes | 14 | 17.5% |
| 60 to 89 Minutes | 0 | 0.0% |
| 90 or more Minutes | 0 | 0.0% |
Commute Time by Sex in Center Sandwich
The most common commute times in Center Sandwich are 30 to 34 minutes (18 commuters, 54.5%) for males and 15 to 19 minutes (14 commuters, 29.8%) for females.
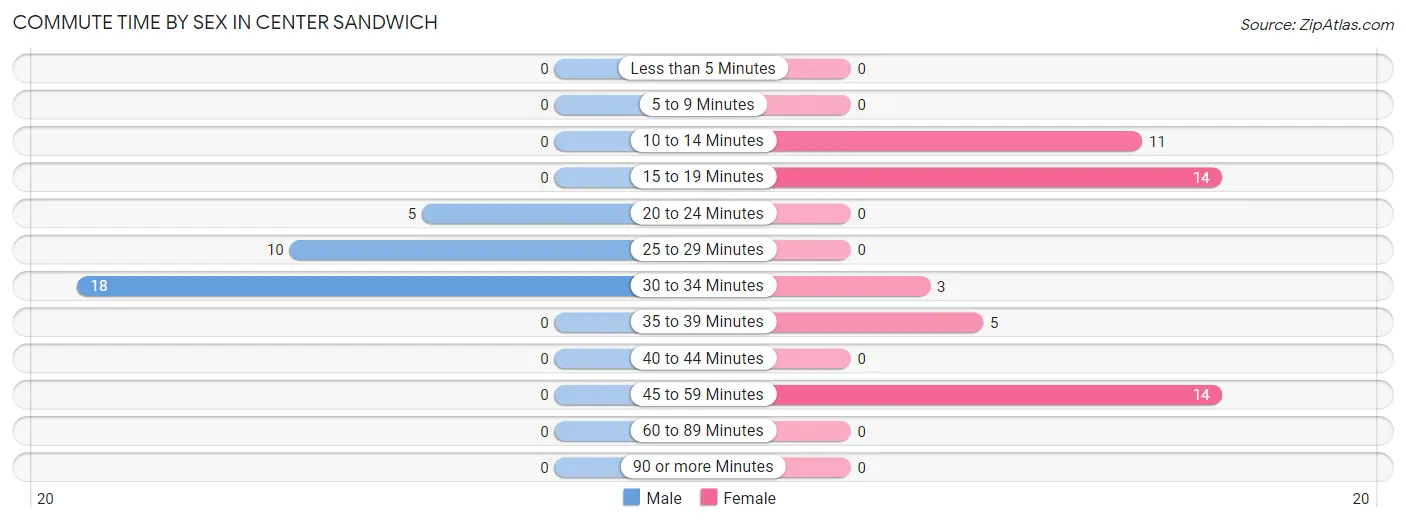
| Commute Time | Male | Female |
| Less than 5 Minutes | 0 (0.0%) | 0 (0.0%) |
| 5 to 9 Minutes | 0 (0.0%) | 0 (0.0%) |
| 10 to 14 Minutes | 0 (0.0%) | 11 (23.4%) |
| 15 to 19 Minutes | 0 (0.0%) | 14 (29.8%) |
| 20 to 24 Minutes | 5 (15.1%) | 0 (0.0%) |
| 25 to 29 Minutes | 10 (30.3%) | 0 (0.0%) |
| 30 to 34 Minutes | 18 (54.5%) | 3 (6.4%) |
| 35 to 39 Minutes | 0 (0.0%) | 5 (10.6%) |
| 40 to 44 Minutes | 0 (0.0%) | 0 (0.0%) |
| 45 to 59 Minutes | 0 (0.0%) | 14 (29.8%) |
| 60 to 89 Minutes | 0 (0.0%) | 0 (0.0%) |
| 90 or more Minutes | 0 (0.0%) | 0 (0.0%) |
Time of Departure to Work by Sex in Center Sandwich
The most frequent times of departure to work in Center Sandwich are 5:30 AM to 5:59 AM (9, 27.3%) for males and 7:00 AM to 7:29 AM (14, 29.8%) for females.
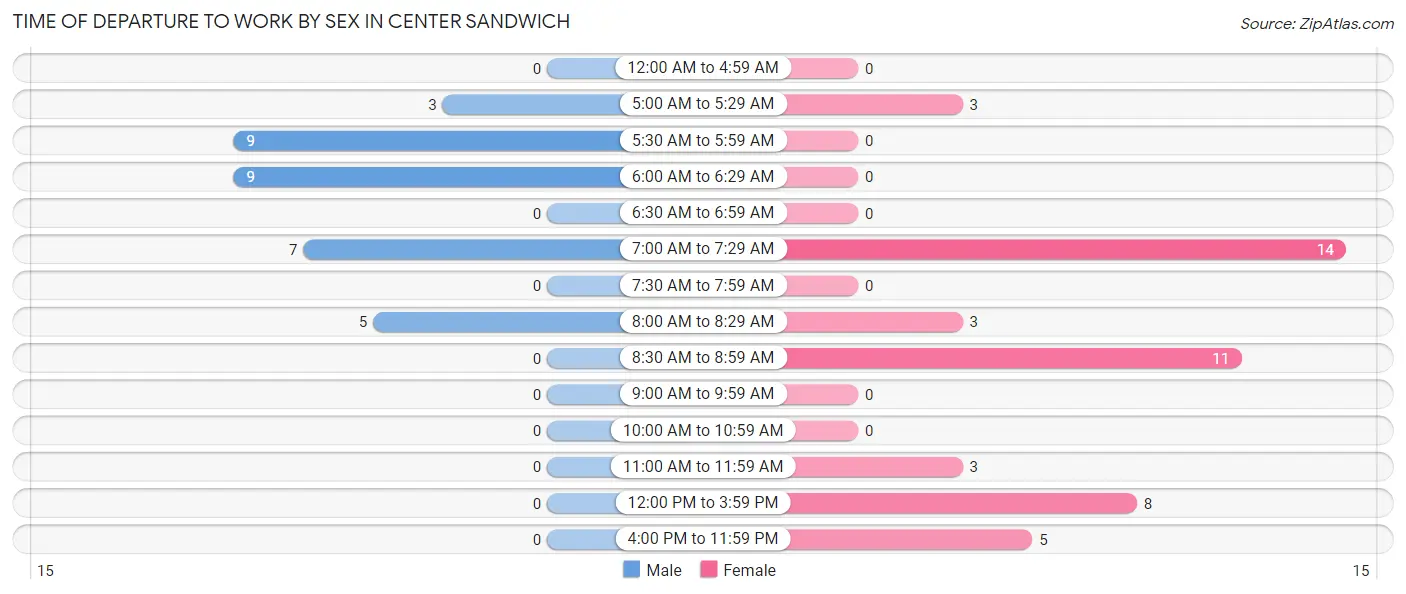
| Time of Departure | Male | Female |
| 12:00 AM to 4:59 AM | 0 (0.0%) | 0 (0.0%) |
| 5:00 AM to 5:29 AM | 3 (9.1%) | 3 (6.4%) |
| 5:30 AM to 5:59 AM | 9 (27.3%) | 0 (0.0%) |
| 6:00 AM to 6:29 AM | 9 (27.3%) | 0 (0.0%) |
| 6:30 AM to 6:59 AM | 0 (0.0%) | 0 (0.0%) |
| 7:00 AM to 7:29 AM | 7 (21.2%) | 14 (29.8%) |
| 7:30 AM to 7:59 AM | 0 (0.0%) | 0 (0.0%) |
| 8:00 AM to 8:29 AM | 5 (15.1%) | 3 (6.4%) |
| 8:30 AM to 8:59 AM | 0 (0.0%) | 11 (23.4%) |
| 9:00 AM to 9:59 AM | 0 (0.0%) | 0 (0.0%) |
| 10:00 AM to 10:59 AM | 0 (0.0%) | 0 (0.0%) |
| 11:00 AM to 11:59 AM | 0 (0.0%) | 3 (6.4%) |
| 12:00 PM to 3:59 PM | 0 (0.0%) | 8 (17.0%) |
| 4:00 PM to 11:59 PM | 0 (0.0%) | 5 (10.6%) |
| Total | 33 (100.0%) | 47 (100.0%) |
Housing Occupancy in Center Sandwich
Occupancy by Ownership in Center Sandwich
Of the total 75 dwellings in Center Sandwich, owner-occupied units account for 44 (58.7%), while renter-occupied units make up 31 (41.3%).
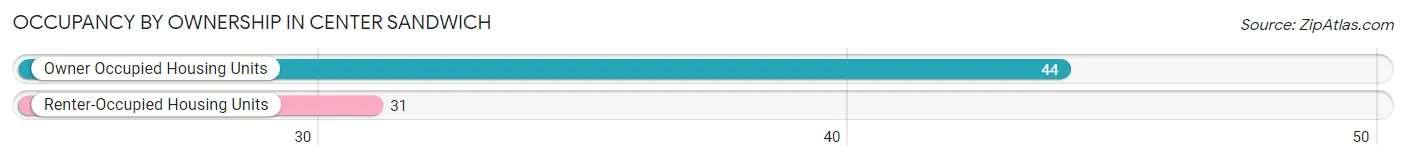
| Occupancy | # Housing Units | % Housing Units |
| Owner Occupied Housing Units | 44 | 58.7% |
| Renter-Occupied Housing Units | 31 | 41.3% |
| Total Occupied Housing Units | 75 | 100.0% |
Occupancy by Household Size in Center Sandwich
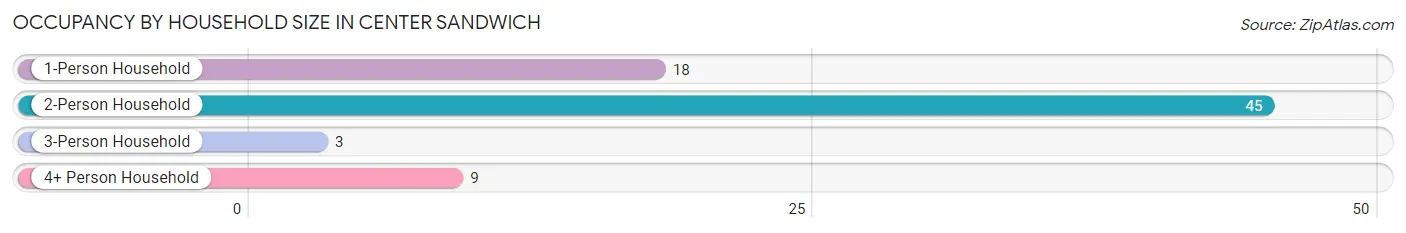
| Household Size | # Housing Units | % Housing Units |
| 1-Person Household | 18 | 24.0% |
| 2-Person Household | 45 | 60.0% |
| 3-Person Household | 3 | 4.0% |
| 4+ Person Household | 9 | 12.0% |
| Total Housing Units | 75 | 100.0% |
Occupancy by Ownership by Household Size in Center Sandwich
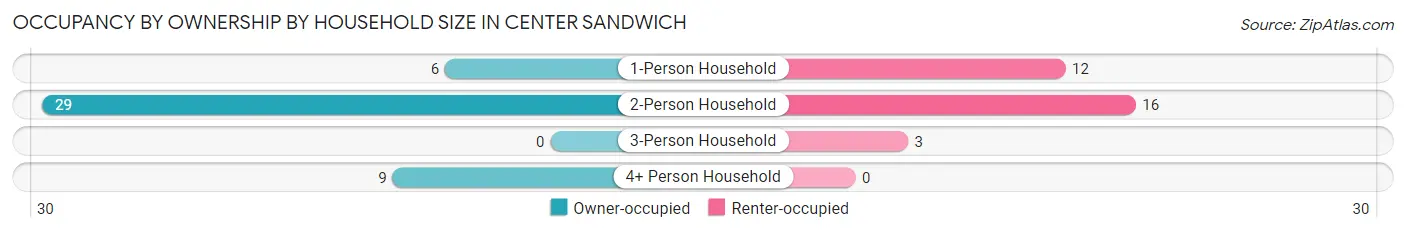
| Household Size | Owner-occupied | Renter-occupied |
| 1-Person Household | 6 (33.3%) | 12 (66.7%) |
| 2-Person Household | 29 (64.4%) | 16 (35.6%) |
| 3-Person Household | 0 (0.0%) | 3 (100.0%) |
| 4+ Person Household | 9 (100.0%) | 0 (0.0%) |
| Total Housing Units | 44 (58.7%) | 31 (41.3%) |
Occupancy by Educational Attainment in Center Sandwich
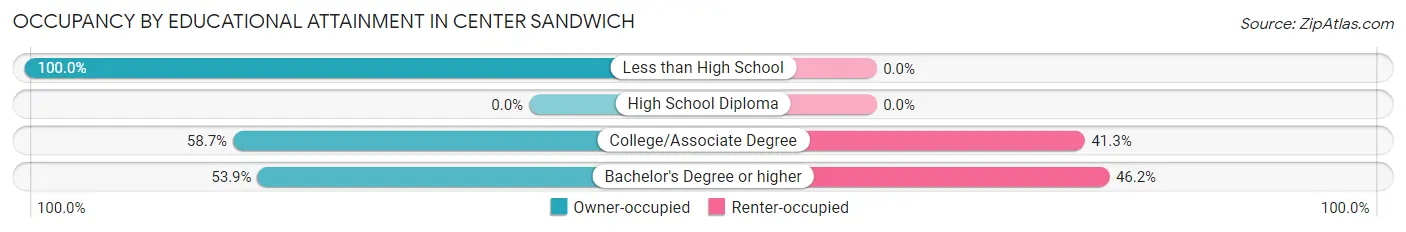
| Household Size | Owner-occupied | Renter-occupied |
| Less than High School | 3 (100.0%) | 0 (0.0%) |
| High School Diploma | 0 (0.0%) | 0 (0.0%) |
| College/Associate Degree | 27 (58.7%) | 19 (41.3%) |
| Bachelor's Degree or higher | 14 (53.8%) | 12 (46.2%) |
Occupancy by Age of Householder in Center Sandwich
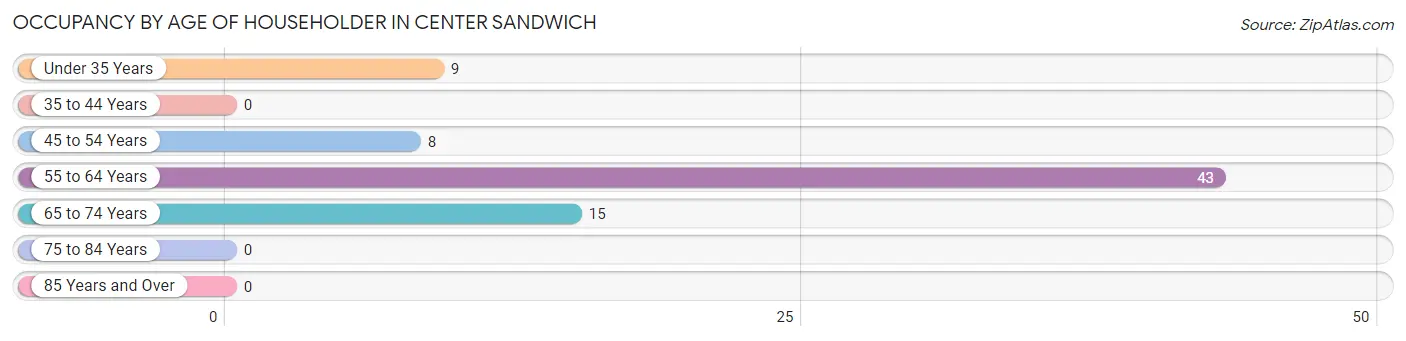
| Age Bracket | # Households | % Households |
| Under 35 Years | 9 | 12.0% |
| 35 to 44 Years | 0 | 0.0% |
| 45 to 54 Years | 8 | 10.7% |
| 55 to 64 Years | 43 | 57.3% |
| 65 to 74 Years | 15 | 20.0% |
| 75 to 84 Years | 0 | 0.0% |
| 85 Years and Over | 0 | 0.0% |
| Total | 75 | 100.0% |
Housing Finances in Center Sandwich
Median Income by Occupancy in Center Sandwich
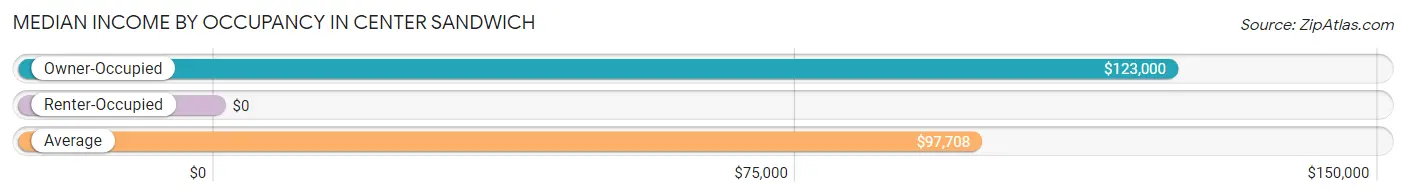
| Occupancy Type | # Households | Median Income |
| Owner-Occupied | 44 (58.7%) | $123,000 |
| Renter-Occupied | 31 (41.3%) | $0 |
| Average | 75 (100.0%) | $97,708 |
Occupancy by Householder Income Bracket in Center Sandwich
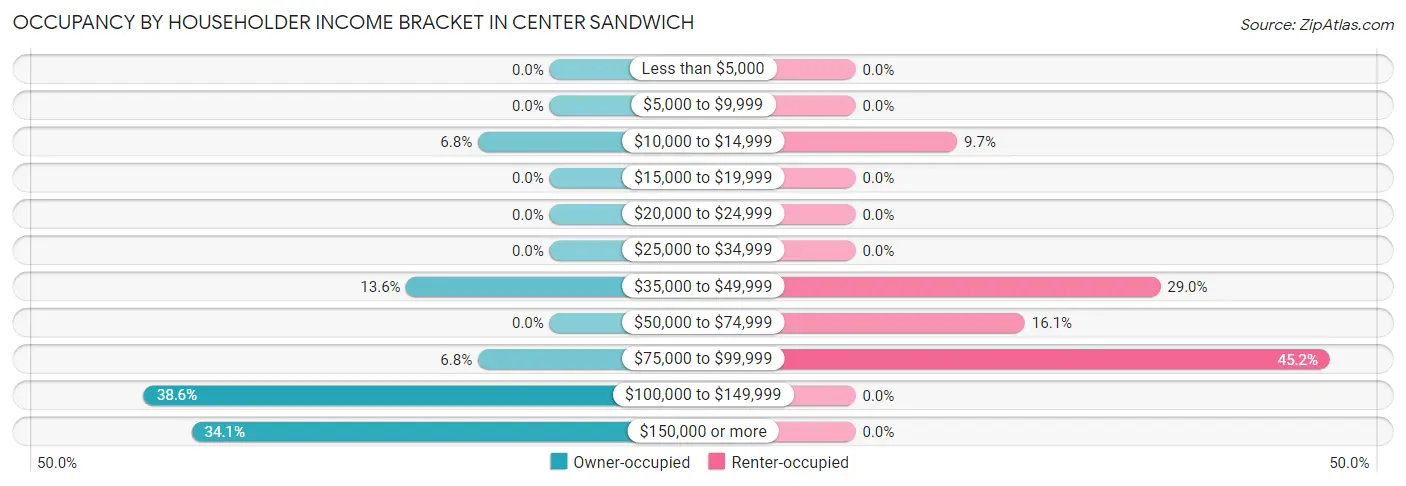
| Income Bracket | Owner-occupied | Renter-occupied |
| Less than $5,000 | 0 (0.0%) | 0 (0.0%) |
| $5,000 to $9,999 | 0 (0.0%) | 0 (0.0%) |
| $10,000 to $14,999 | 3 (6.8%) | 3 (9.7%) |
| $15,000 to $19,999 | 0 (0.0%) | 0 (0.0%) |
| $20,000 to $24,999 | 0 (0.0%) | 0 (0.0%) |
| $25,000 to $34,999 | 0 (0.0%) | 0 (0.0%) |
| $35,000 to $49,999 | 6 (13.6%) | 9 (29.0%) |
| $50,000 to $74,999 | 0 (0.0%) | 5 (16.1%) |
| $75,000 to $99,999 | 3 (6.8%) | 14 (45.2%) |
| $100,000 to $149,999 | 17 (38.6%) | 0 (0.0%) |
| $150,000 or more | 15 (34.1%) | 0 (0.0%) |
| Total | 44 (100.0%) | 31 (100.0%) |
Monthly Housing Cost Tiers in Center Sandwich
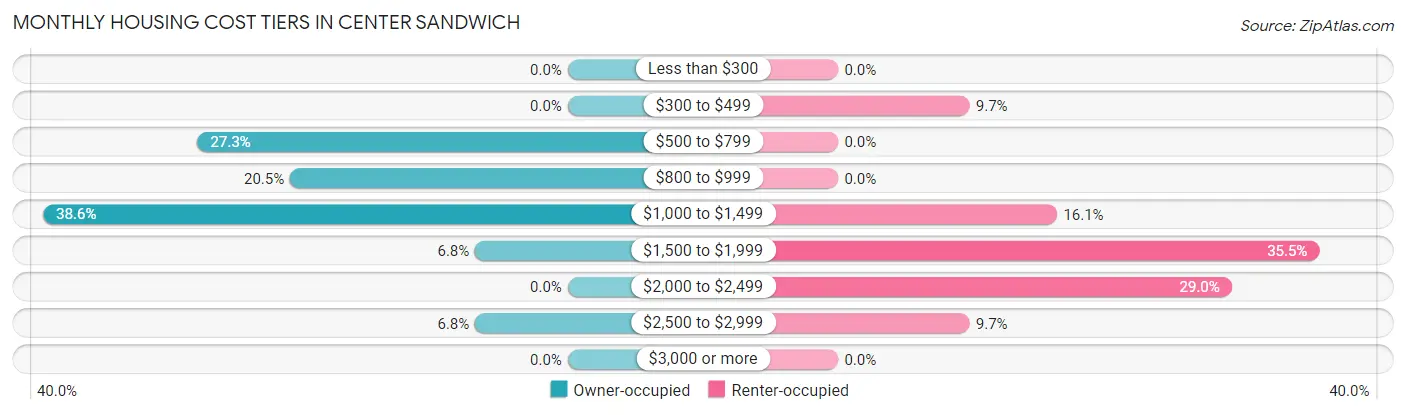
| Monthly Cost | Owner-occupied | Renter-occupied |
| Less than $300 | 0 (0.0%) | 0 (0.0%) |
| $300 to $499 | 0 (0.0%) | 3 (9.7%) |
| $500 to $799 | 12 (27.3%) | 0 (0.0%) |
| $800 to $999 | 9 (20.4%) | 0 (0.0%) |
| $1,000 to $1,499 | 17 (38.6%) | 5 (16.1%) |
| $1,500 to $1,999 | 3 (6.8%) | 11 (35.5%) |
| $2,000 to $2,499 | 0 (0.0%) | 9 (29.0%) |
| $2,500 to $2,999 | 3 (6.8%) | 3 (9.7%) |
| $3,000 or more | 0 (0.0%) | 0 (0.0%) |
| Total | 44 (100.0%) | 31 (100.0%) |
Physical Housing Characteristics in Center Sandwich
Housing Structures in Center Sandwich
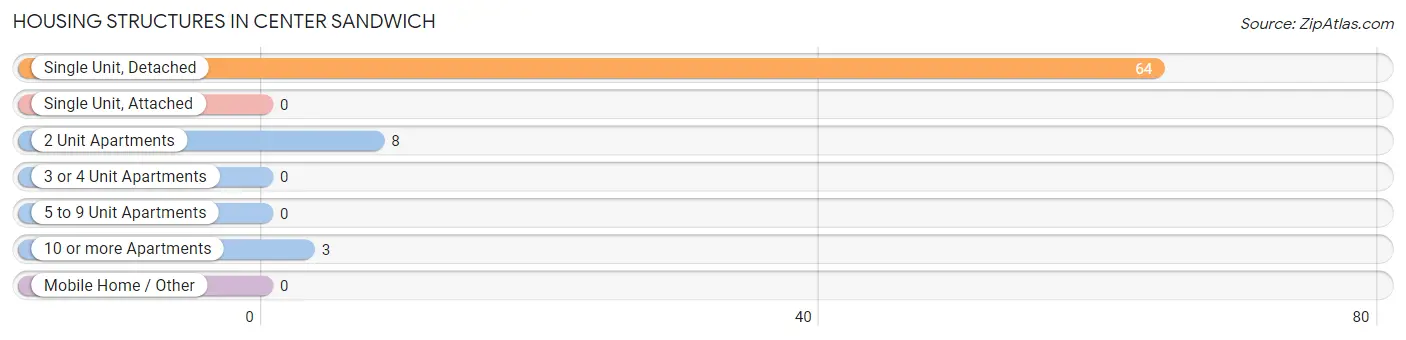
| Structure Type | # Housing Units | % Housing Units |
| Single Unit, Detached | 64 | 85.3% |
| Single Unit, Attached | 0 | 0.0% |
| 2 Unit Apartments | 8 | 10.7% |
| 3 or 4 Unit Apartments | 0 | 0.0% |
| 5 to 9 Unit Apartments | 0 | 0.0% |
| 10 or more Apartments | 3 | 4.0% |
| Mobile Home / Other | 0 | 0.0% |
| Total | 75 | 100.0% |
Housing Structures by Occupancy in Center Sandwich
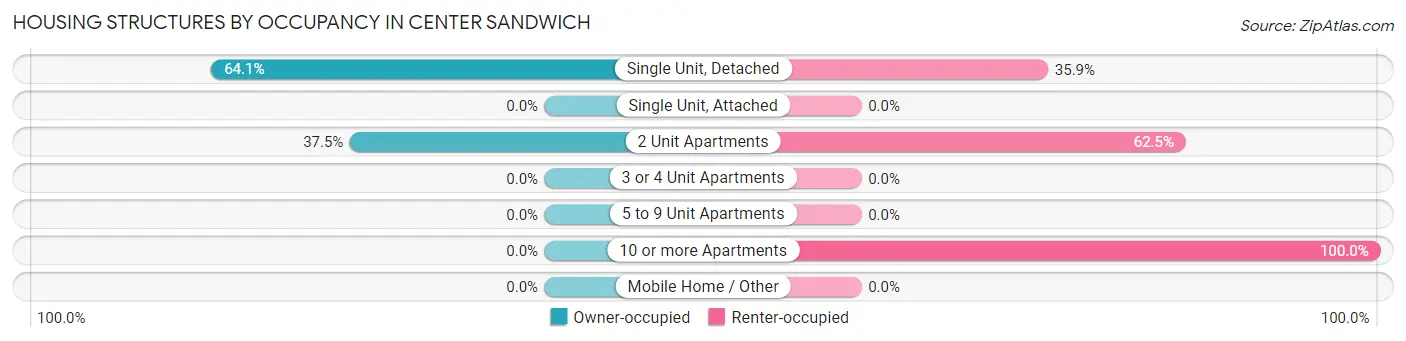
| Structure Type | Owner-occupied | Renter-occupied |
| Single Unit, Detached | 41 (64.1%) | 23 (35.9%) |
| Single Unit, Attached | 0 (0.0%) | 0 (0.0%) |
| 2 Unit Apartments | 3 (37.5%) | 5 (62.5%) |
| 3 or 4 Unit Apartments | 0 (0.0%) | 0 (0.0%) |
| 5 to 9 Unit Apartments | 0 (0.0%) | 0 (0.0%) |
| 10 or more Apartments | 0 (0.0%) | 3 (100.0%) |
| Mobile Home / Other | 0 (0.0%) | 0 (0.0%) |
| Total | 44 (58.7%) | 31 (41.3%) |
Housing Structures by Number of Rooms in Center Sandwich
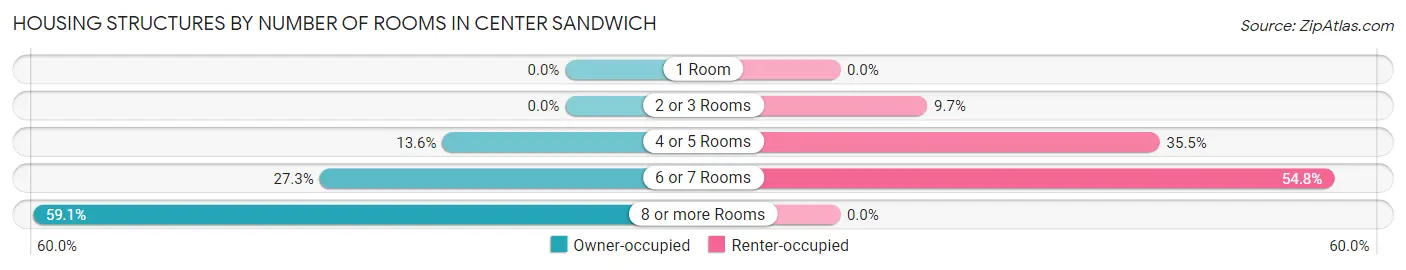
| Number of Rooms | Owner-occupied | Renter-occupied |
| 1 Room | 0 (0.0%) | 0 (0.0%) |
| 2 or 3 Rooms | 0 (0.0%) | 3 (9.7%) |
| 4 or 5 Rooms | 6 (13.6%) | 11 (35.5%) |
| 6 or 7 Rooms | 12 (27.3%) | 17 (54.8%) |
| 8 or more Rooms | 26 (59.1%) | 0 (0.0%) |
| Total | 44 (100.0%) | 31 (100.0%) |
Housing Structure by Heating Type in Center Sandwich
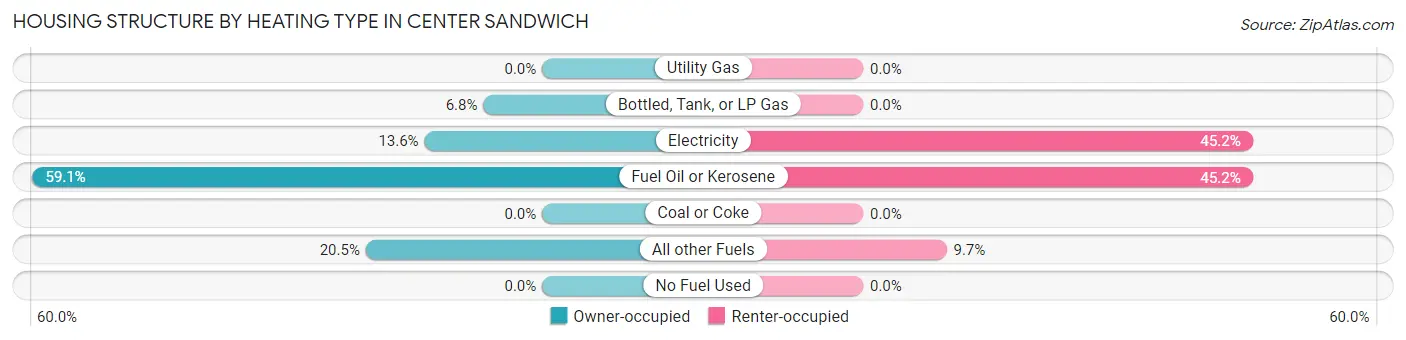
| Heating Type | Owner-occupied | Renter-occupied |
| Utility Gas | 0 (0.0%) | 0 (0.0%) |
| Bottled, Tank, or LP Gas | 3 (6.8%) | 0 (0.0%) |
| Electricity | 6 (13.6%) | 14 (45.2%) |
| Fuel Oil or Kerosene | 26 (59.1%) | 14 (45.2%) |
| Coal or Coke | 0 (0.0%) | 0 (0.0%) |
| All other Fuels | 9 (20.4%) | 3 (9.7%) |
| No Fuel Used | 0 (0.0%) | 0 (0.0%) |
| Total | 44 (100.0%) | 31 (100.0%) |
Household Vehicle Usage in Center Sandwich
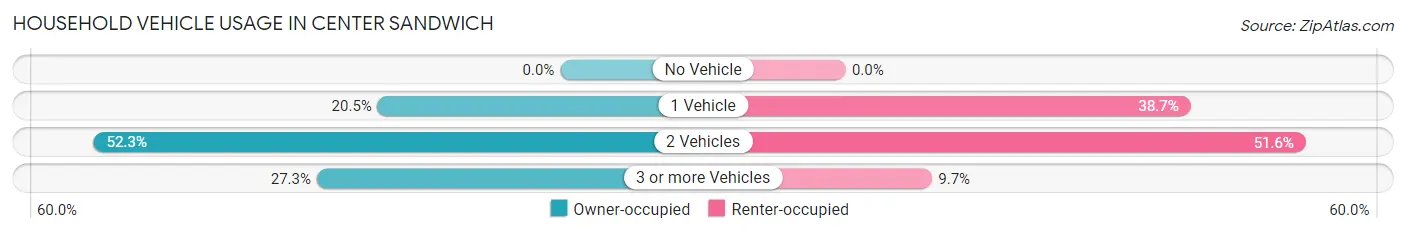
| Vehicles per Household | Owner-occupied | Renter-occupied |
| No Vehicle | 0 (0.0%) | 0 (0.0%) |
| 1 Vehicle | 9 (20.4%) | 12 (38.7%) |
| 2 Vehicles | 23 (52.3%) | 16 (51.6%) |
| 3 or more Vehicles | 12 (27.3%) | 3 (9.7%) |
| Total | 44 (100.0%) | 31 (100.0%) |
Real Estate & Mortgages in Center Sandwich
Real Estate and Mortgage Overview in Center Sandwich
| Characteristic | Without Mortgage | With Mortgage |
| Housing Units | 27 | 17 |
| Median Property Value | $350,000 | $370,800 |
| Median Household Income | $103,750 | $9 |
| Monthly Housing Costs | $825 | $0 |
| Real Estate Taxes | $3,500 | $0 |
Property Value by Mortgage Status in Center Sandwich
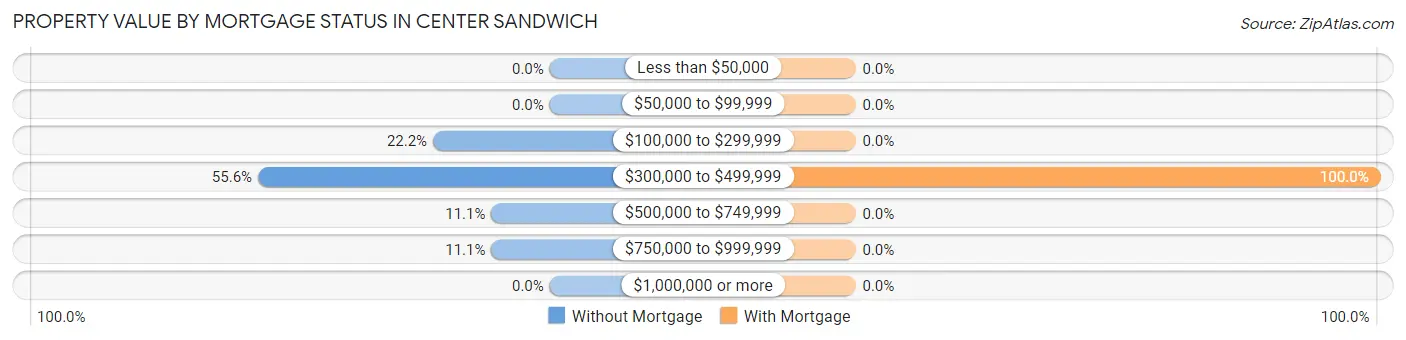
| Property Value | Without Mortgage | With Mortgage |
| Less than $50,000 | 0 (0.0%) | 0 (0.0%) |
| $50,000 to $99,999 | 0 (0.0%) | 0 (0.0%) |
| $100,000 to $299,999 | 6 (22.2%) | 0 (0.0%) |
| $300,000 to $499,999 | 15 (55.6%) | 17 (100.0%) |
| $500,000 to $749,999 | 3 (11.1%) | 0 (0.0%) |
| $750,000 to $999,999 | 3 (11.1%) | 0 (0.0%) |
| $1,000,000 or more | 0 (0.0%) | 0 (0.0%) |
| Total | 27 (100.0%) | 17 (100.0%) |
Household Income by Mortgage Status in Center Sandwich
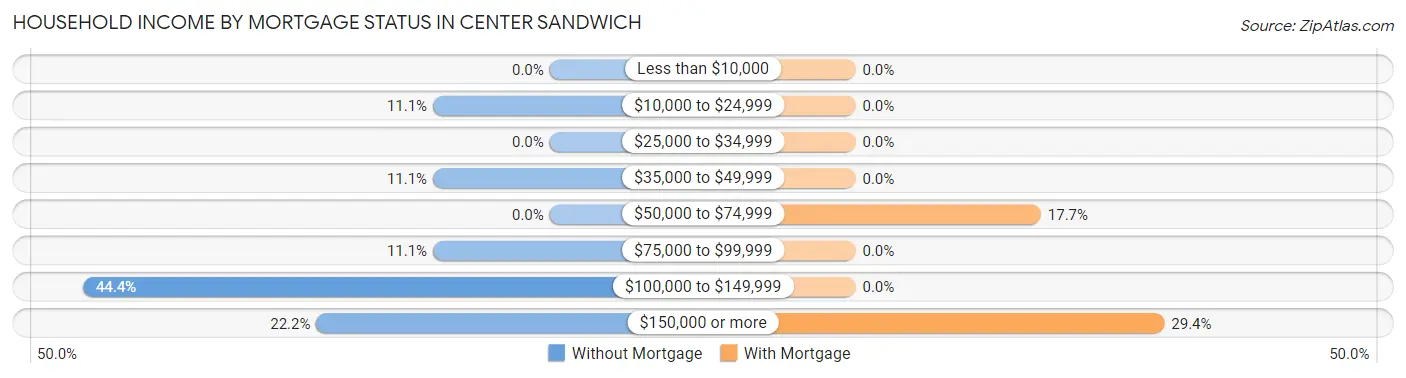
| Household Income | Without Mortgage | With Mortgage |
| Less than $10,000 | 0 (0.0%) | 0 (0.0%) |
| $10,000 to $24,999 | 3 (11.1%) | 0 (0.0%) |
| $25,000 to $34,999 | 0 (0.0%) | 0 (0.0%) |
| $35,000 to $49,999 | 3 (11.1%) | 0 (0.0%) |
| $50,000 to $74,999 | 0 (0.0%) | 3 (17.6%) |
| $75,000 to $99,999 | 3 (11.1%) | 0 (0.0%) |
| $100,000 to $149,999 | 12 (44.4%) | 0 (0.0%) |
| $150,000 or more | 6 (22.2%) | 5 (29.4%) |
| Total | 27 (100.0%) | 17 (100.0%) |
Property Value to Household Income Ratio in Center Sandwich
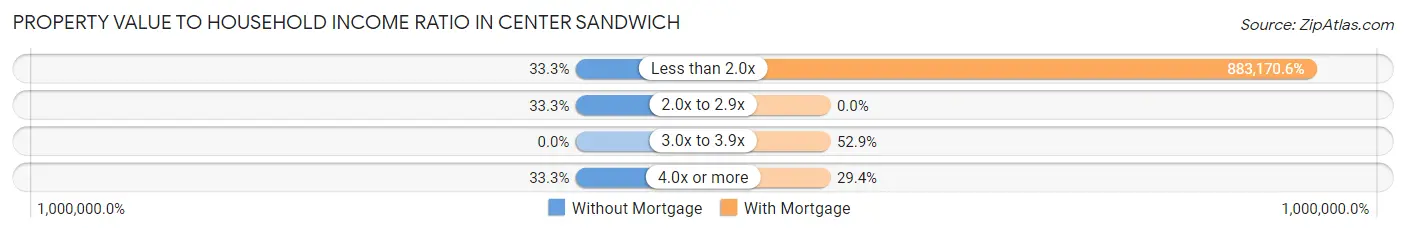
| Value-to-Income Ratio | Without Mortgage | With Mortgage |
| Less than 2.0x | 9 (33.3%) | 150,139 (883,170.6%) |
| 2.0x to 2.9x | 9 (33.3%) | 0 (0.0%) |
| 3.0x to 3.9x | 0 (0.0%) | 9 (52.9%) |
| 4.0x or more | 9 (33.3%) | 5 (29.4%) |
| Total | 27 (100.0%) | 17 (100.0%) |
Real Estate Taxes by Mortgage Status in Center Sandwich
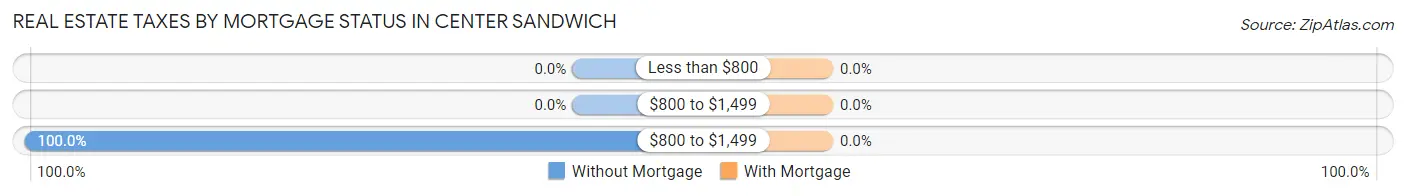
| Property Taxes | Without Mortgage | With Mortgage |
| Less than $800 | 0 (0.0%) | 0 (0.0%) |
| $800 to $1,499 | 0 (0.0%) | 0 (0.0%) |
| $800 to $1,499 | 27 (100.0%) | 0 (0.0%) |
| Total | 27 (100.0%) | 17 (100.0%) |
Health & Disability in Center Sandwich
Health Insurance Coverage by Age in Center Sandwich
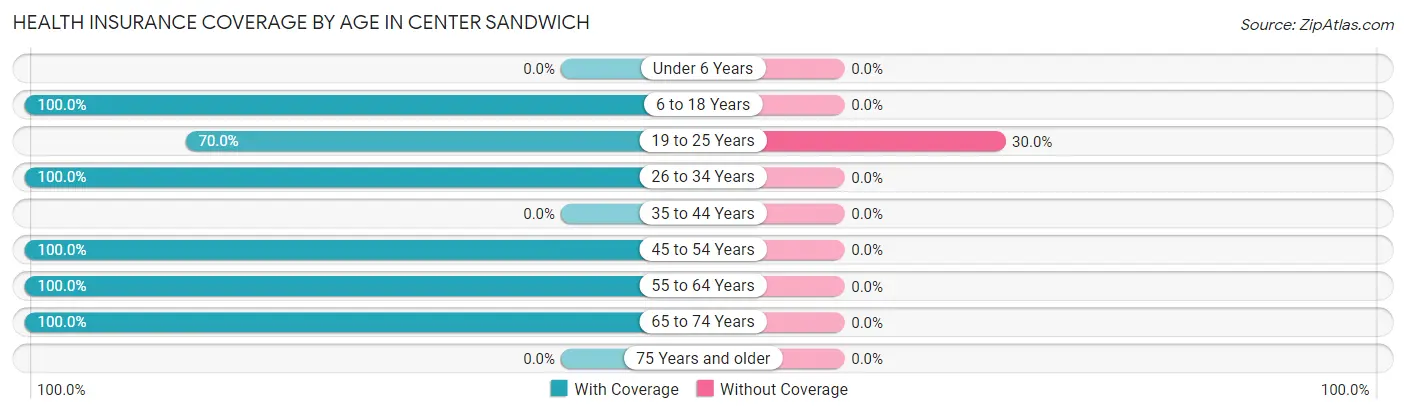
| Age Bracket | With Coverage | Without Coverage |
| Under 6 Years | 0 (0.0%) | 0 (0.0%) |
| 6 to 18 Years | 20 (100.0%) | 0 (0.0%) |
| 19 to 25 Years | 14 (70.0%) | 6 (30.0%) |
| 26 to 34 Years | 27 (100.0%) | 0 (0.0%) |
| 35 to 44 Years | 0 (0.0%) | 0 (0.0%) |
| 45 to 54 Years | 27 (100.0%) | 0 (0.0%) |
| 55 to 64 Years | 49 (100.0%) | 0 (0.0%) |
| 65 to 74 Years | 29 (100.0%) | 0 (0.0%) |
| 75 Years and older | 0 (0.0%) | 0 (0.0%) |
| Total | 166 (96.5%) | 6 (3.5%) |
Health Insurance Coverage by Citizenship Status in Center Sandwich

| Citizenship Status | With Coverage | Without Coverage |
| Native Born | 0 (0.0%) | 0 (0.0%) |
| Foreign Born, Citizen | 20 (100.0%) | 0 (0.0%) |
| Foreign Born, not a Citizen | 14 (70.0%) | 6 (30.0%) |
Health Insurance Coverage by Household Income in Center Sandwich
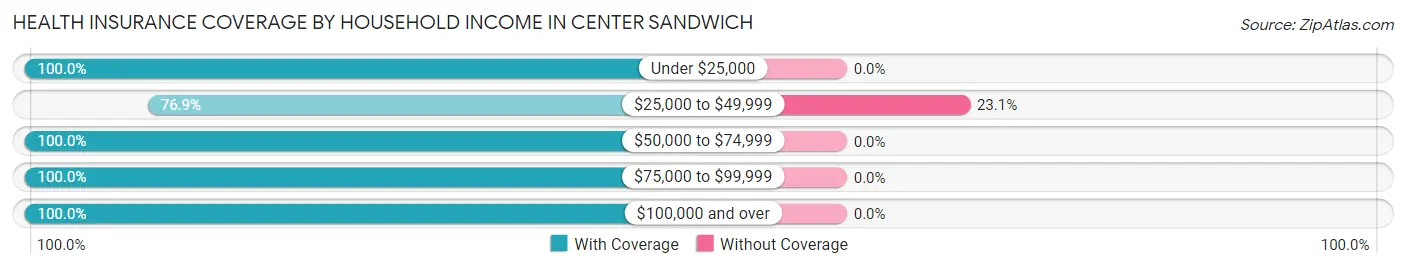
| Household Income | With Coverage | Without Coverage |
| Under $25,000 | 6 (100.0%) | 0 (0.0%) |
| $25,000 to $49,999 | 20 (76.9%) | 6 (23.1%) |
| $50,000 to $74,999 | 12 (100.0%) | 0 (0.0%) |
| $75,000 to $99,999 | 48 (100.0%) | 0 (0.0%) |
| $100,000 and over | 80 (100.0%) | 0 (0.0%) |
Public vs Private Health Insurance Coverage by Age in Center Sandwich
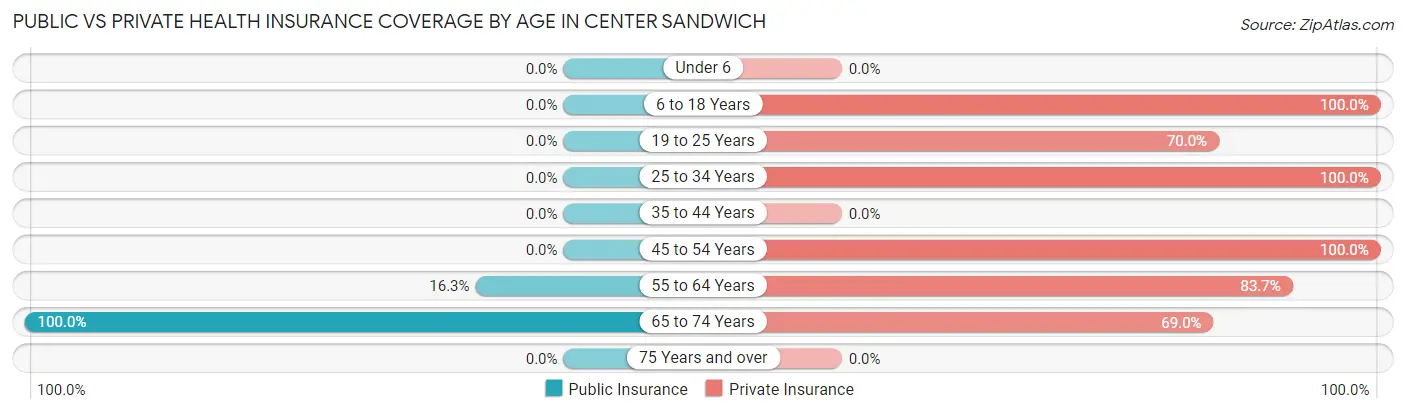
| Age Bracket | Public Insurance | Private Insurance |
| Under 6 | 0 (0.0%) | 0 (0.0%) |
| 6 to 18 Years | 0 (0.0%) | 20 (100.0%) |
| 19 to 25 Years | 0 (0.0%) | 14 (70.0%) |
| 25 to 34 Years | 0 (0.0%) | 27 (100.0%) |
| 35 to 44 Years | 0 (0.0%) | 0 (0.0%) |
| 45 to 54 Years | 0 (0.0%) | 27 (100.0%) |
| 55 to 64 Years | 8 (16.3%) | 41 (83.7%) |
| 65 to 74 Years | 29 (100.0%) | 20 (69.0%) |
| 75 Years and over | 0 (0.0%) | 0 (0.0%) |
| Total | 37 (21.5%) | 149 (86.6%) |
Disability Status by Sex by Age in Center Sandwich
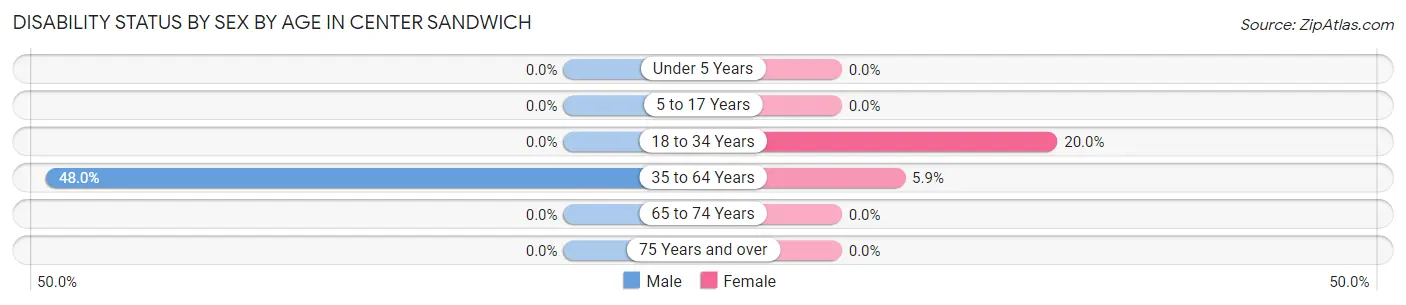
| Age Bracket | Male | Female |
| Under 5 Years | 0 (0.0%) | 0 (0.0%) |
| 5 to 17 Years | 0 (0.0%) | 0 (0.0%) |
| 18 to 34 Years | 0 (0.0%) | 5 (20.0%) |
| 35 to 64 Years | 12 (48.0%) | 3 (5.9%) |
| 65 to 74 Years | 0 (0.0%) | 0 (0.0%) |
| 75 Years and over | 0 (0.0%) | 0 (0.0%) |
Disability Class by Sex by Age in Center Sandwich
Disability Class: Hearing Difficulty
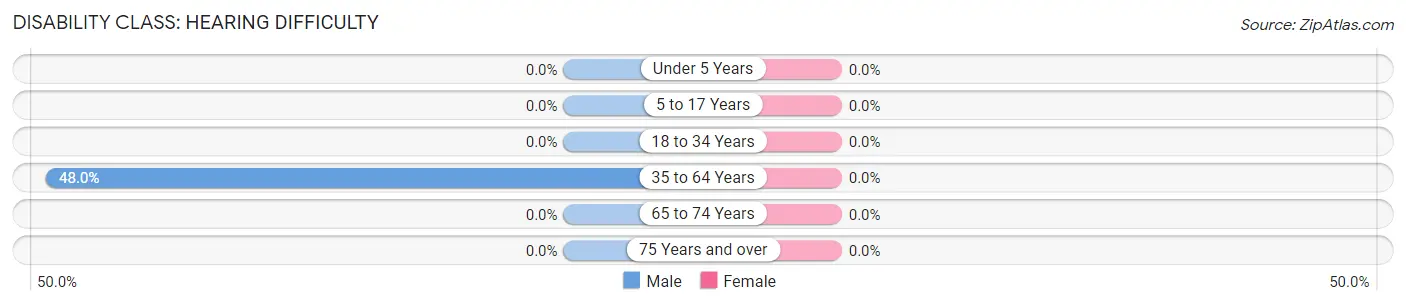
| Age Bracket | Male | Female |
| Under 5 Years | 0 (0.0%) | 0 (0.0%) |
| 5 to 17 Years | 0 (0.0%) | 0 (0.0%) |
| 18 to 34 Years | 0 (0.0%) | 0 (0.0%) |
| 35 to 64 Years | 12 (48.0%) | 0 (0.0%) |
| 65 to 74 Years | 0 (0.0%) | 0 (0.0%) |
| 75 Years and over | 0 (0.0%) | 0 (0.0%) |
Disability Class: Vision Difficulty
| Age Bracket | Male | Female |
| Under 5 Years | 0 (0.0%) | 0 (0.0%) |
| 5 to 17 Years | 0 (0.0%) | 0 (0.0%) |
| 18 to 34 Years | 0 (0.0%) | 0 (0.0%) |
| 35 to 64 Years | 0 (0.0%) | 0 (0.0%) |
| 65 to 74 Years | 0 (0.0%) | 0 (0.0%) |
| 75 Years and over | 0 (0.0%) | 0 (0.0%) |
Disability Class: Cognitive Difficulty
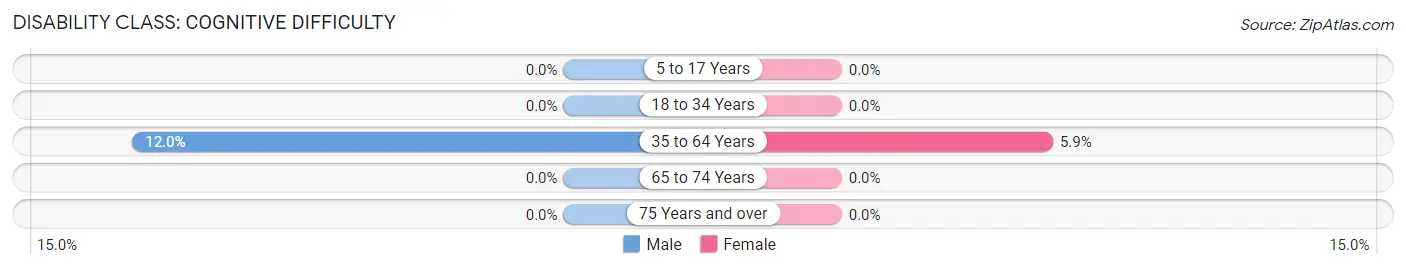
| Age Bracket | Male | Female |
| 5 to 17 Years | 0 (0.0%) | 0 (0.0%) |
| 18 to 34 Years | 0 (0.0%) | 0 (0.0%) |
| 35 to 64 Years | 3 (12.0%) | 3 (5.9%) |
| 65 to 74 Years | 0 (0.0%) | 0 (0.0%) |
| 75 Years and over | 0 (0.0%) | 0 (0.0%) |
Disability Class: Ambulatory Difficulty
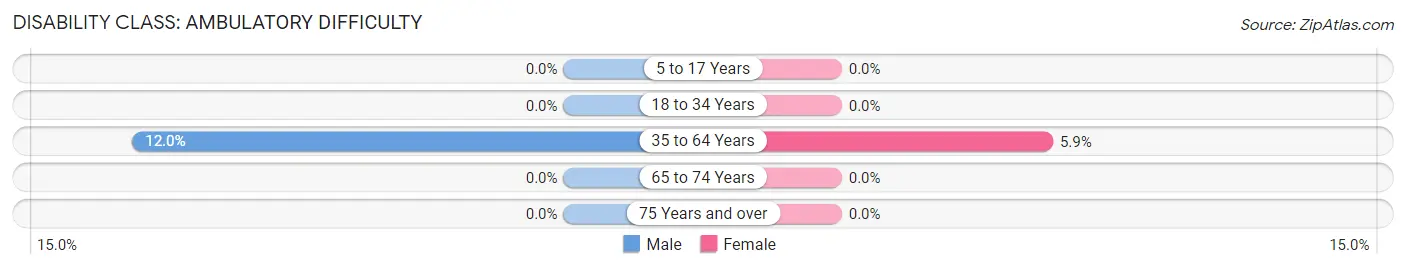
| Age Bracket | Male | Female |
| 5 to 17 Years | 0 (0.0%) | 0 (0.0%) |
| 18 to 34 Years | 0 (0.0%) | 0 (0.0%) |
| 35 to 64 Years | 3 (12.0%) | 3 (5.9%) |
| 65 to 74 Years | 0 (0.0%) | 0 (0.0%) |
| 75 Years and over | 0 (0.0%) | 0 (0.0%) |
Disability Class: Self-Care Difficulty
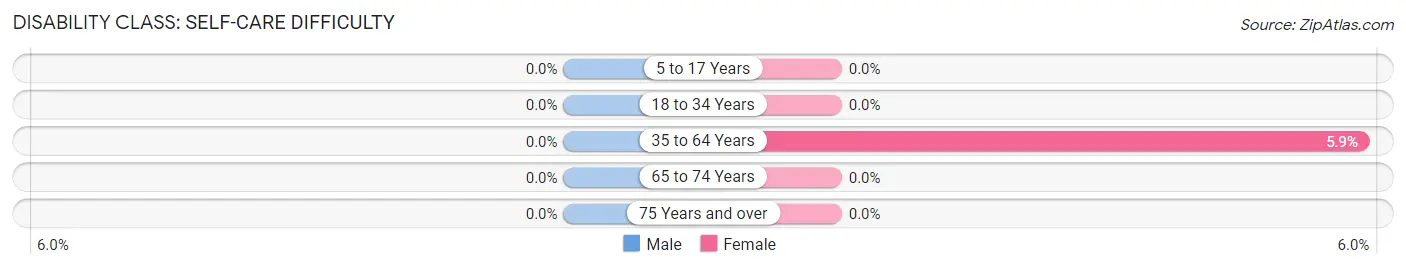
| Age Bracket | Male | Female |
| 5 to 17 Years | 0 (0.0%) | 0 (0.0%) |
| 18 to 34 Years | 0 (0.0%) | 0 (0.0%) |
| 35 to 64 Years | 0 (0.0%) | 3 (5.9%) |
| 65 to 74 Years | 0 (0.0%) | 0 (0.0%) |
| 75 Years and over | 0 (0.0%) | 0 (0.0%) |
Technology Access in Center Sandwich
Computing Device Access in Center Sandwich
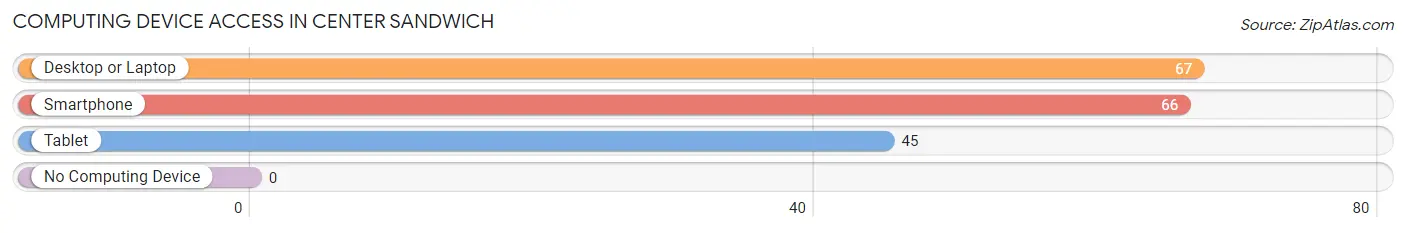
| Device Type | # Households | % Households |
| Desktop or Laptop | 67 | 89.3% |
| Smartphone | 66 | 88.0% |
| Tablet | 45 | 60.0% |
| No Computing Device | 0 | 0.0% |
| Total | 75 | 100.0% |
Internet Access in Center Sandwich
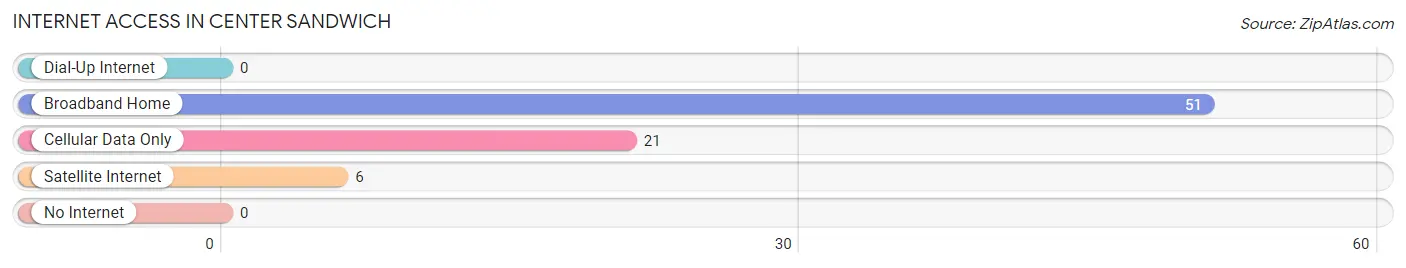
| Internet Type | # Households | % Households |
| Dial-Up Internet | 0 | 0.0% |
| Broadband Home | 51 | 68.0% |
| Cellular Data Only | 21 | 28.0% |
| Satellite Internet | 6 | 8.0% |
| No Internet | 0 | 0.0% |
| Total | 75 | 100.0% |
Center Sandwich Summary
History
The town of Center Sandwich, New Hampshire is located in the heart of the White Mountains region of the state. It was first settled in 1763 by a group of settlers from Massachusetts, led by Captain John Smith. The town was originally known as Smith's Purchase, but was later renamed Center Sandwich in 1820.
The town was an important stop on the stagecoach route between Boston and Montreal, and was also a popular destination for tourists in the late 19th and early 20th centuries. The town was home to several inns and hotels, as well as a number of summer camps.
The town was also home to a number of small industries, including a sawmill, a gristmill, a tannery, and a woolen mill. The town was also home to a number of farms, which produced a variety of crops, including potatoes, apples, and hay.
Geography
Center Sandwich is located in the White Mountains region of New Hampshire, in the eastern part of the state. The town is bordered by the towns of Tamworth to the north, Moultonborough to the east, Sandwich to the south, and Holderness to the west.
The town is located in the White Mountain National Forest, and is home to a number of hiking trails, including the Sandwich Range Trail and the Sandwich Notch Trail. The town is also home to a number of lakes, including Squam Lake, which is the second largest lake in the state.
The town is located at an elevation of 1,400 feet, and has a total area of 24.2 square miles. The town is located in the Saco River watershed, and is home to a number of streams, including the Cold River, the Bearcamp River, and the Swift River.
Economy
The economy of Center Sandwich is largely based on tourism and recreation. The town is home to a number of inns and hotels, as well as a number of summer camps. The town is also home to a number of small businesses, including restaurants, shops, and galleries.
The town is also home to a number of farms, which produce a variety of crops, including potatoes, apples, and hay. The town is also home to a number of small industries, including a sawmill, a gristmill, a tannery, and a woolen mill.
Demographics
As of the 2010 census, the town of Center Sandwich had a population of 1,717. The population was spread out with 48.3% male and 51.7% female. The median age was 44.7 years.
The racial makeup of the town was 97.2% White, 0.5% African American, 0.2% Native American, 0.4% Asian, 0.1% Pacific Islander, 0.3% from other races, and 1.3% from two or more races. Hispanic or Latino of any race were 1.2% of the population.
The median household income was $50,938, and the median family income was $60,000. The per capita income was $27,945. About 5.3% of families and 8.2% of the population were below the poverty line.
Common Questions
What is Per Capita Income in Center Sandwich?
Per Capita income in Center Sandwich is $60,294.
What is the Median Family Income in Center Sandwich?
Median Family Income in Center Sandwich is $102,639.
What is the Median Household income in Center Sandwich?
Median Household Income in Center Sandwich is $97,708.
What is Inequality or Gini Index in Center Sandwich?
Inequality or Gini Index in Center Sandwich is 0.46.
What is the Total Population of Center Sandwich?
Total Population of Center Sandwich is 172.
What is the Total Male Population of Center Sandwich?
Total Male Population of Center Sandwich is 70.
What is the Total Female Population of Center Sandwich?
Total Female Population of Center Sandwich is 102.
What is the Ratio of Males per 100 Females in Center Sandwich?
There are 68.63 Males per 100 Females in Center Sandwich.
What is the Ratio of Females per 100 Males in Center Sandwich?
There are 145.71 Females per 100 Males in Center Sandwich.
What is the Median Population Age in Center Sandwich?
Median Population Age in Center Sandwich is 51.3 Years.
What is the Average Family Size in Center Sandwich
Average Family Size in Center Sandwich is 2.7 People.
What is the Average Household Size in Center Sandwich
Average Household Size in Center Sandwich is 2.3 People.
How Large is the Labor Force in Center Sandwich?
There are 110 People in the Labor Forcein in Center Sandwich.
What is the Percentage of People in the Labor Force in Center Sandwich?
68.8% of People are in the Labor Force in Center Sandwich.