North Walpole, NH Map & Demographics
North Walpole Map
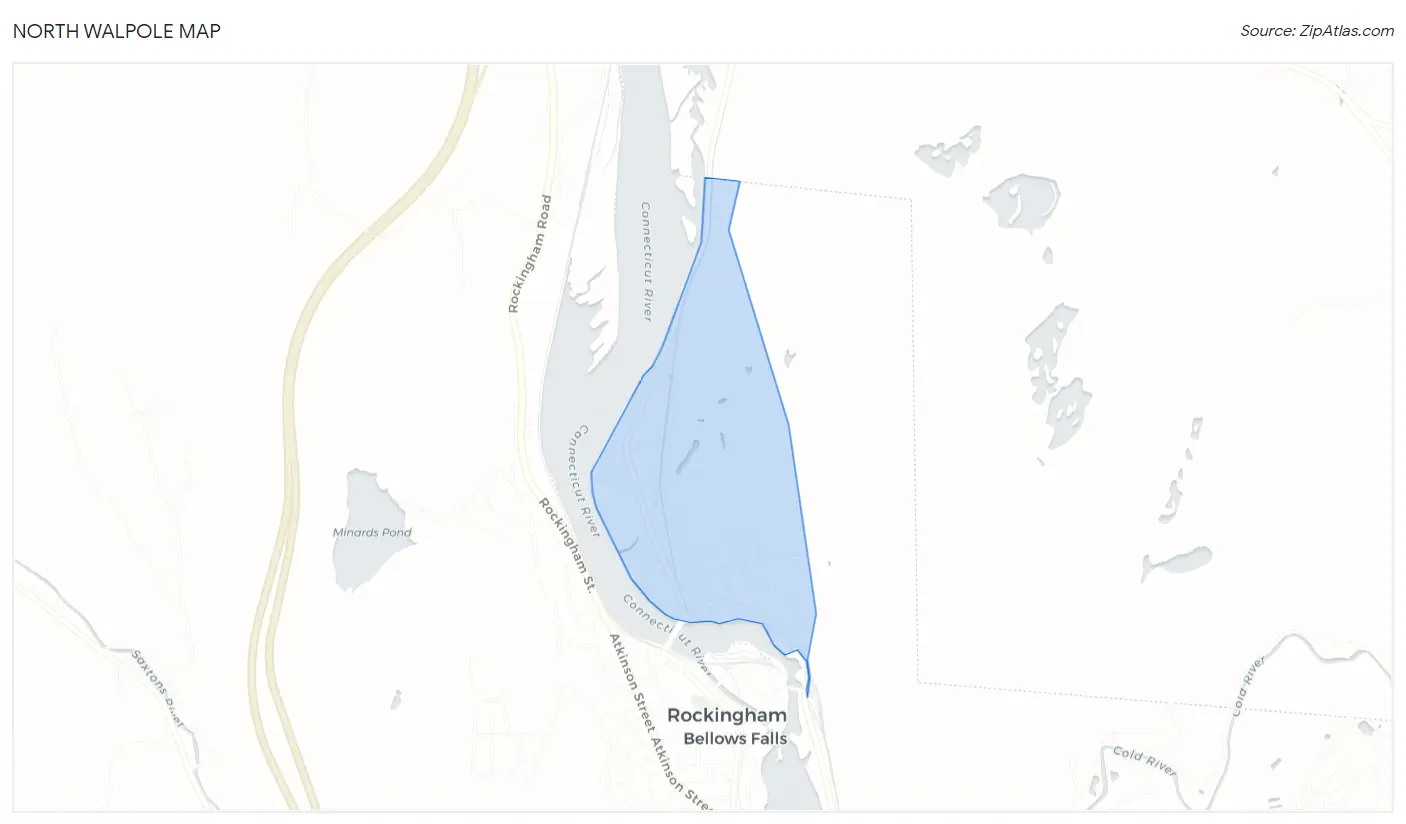
North Walpole Overview
$40,086
PER CAPITA INCOME
$109,931
AVG FAMILY INCOME
$79,318
AVG HOUSEHOLD INCOME
17.8%
WAGE / INCOME GAP [ % ]
82.2¢/ $1
WAGE / INCOME GAP [ $ ]
0.37
INEQUALITY / GINI INDEX
558
TOTAL POPULATION
290
MALE POPULATION
268
FEMALE POPULATION
108.21
MALES / 100 FEMALES
92.41
FEMALES / 100 MALES
37.4
MEDIAN AGE
3.0
AVG FAMILY SIZE
2.4
AVG HOUSEHOLD SIZE
312
LABOR FORCE [ PEOPLE ]
59.3%
PERCENT IN LABOR FORCE
2.6%
UNEMPLOYMENT RATE
North Walpole Zip Codes
North Walpole Area Codes
Income in North Walpole
Income Overview in North Walpole
Per Capita Income in North Walpole is $40,086, while median incomes of families and households are $109,931 and $79,318 respectively.
| Characteristic | Number | Measure |
| Per Capita Income | 558 | $40,086 |
| Median Family Income | 137 | $109,931 |
| Mean Family Income | 137 | $115,994 |
| Median Household Income | 236 | $79,318 |
| Mean Household Income | 236 | $91,118 |
| Income Deficit | 137 | $0 |
| Wage / Income Gap (%) | 558 | 17.77% |
| Wage / Income Gap ($) | 558 | 82.23¢ per $1 |
| Gini / Inequality Index | 558 | 0.37 |
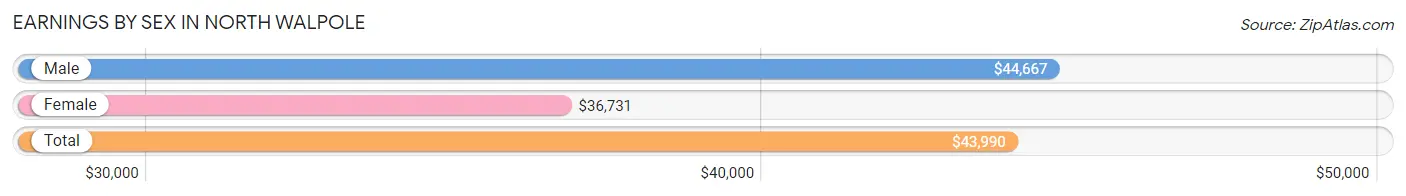
Earnings by Sex in North Walpole
Average Earnings in North Walpole are $43,990, $44,667 for men and $36,731 for women, a difference of 17.8%.
| Sex | Number | Average Earnings |
| Male | 150 (47.2%) | $44,667 |
| Female | 168 (52.8%) | $36,731 |
| Total | 318 (100.0%) | $43,990 |
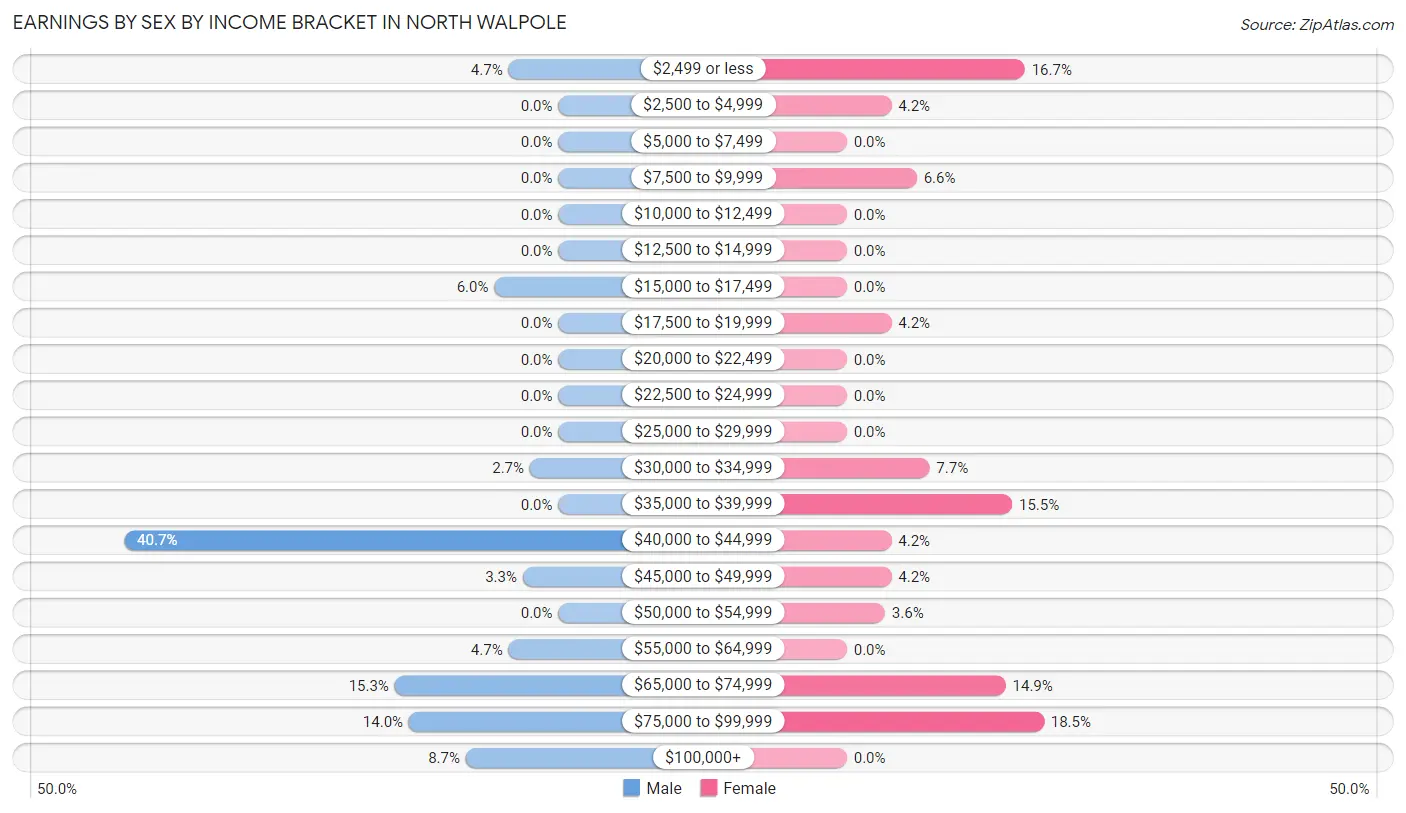
Earnings by Sex by Income Bracket in North Walpole
The most common earnings brackets in North Walpole are $40,000 to $44,999 for men (61 | 40.7%) and $75,000 to $99,999 for women (31 | 18.4%).
| Income | Male | Female |
| $2,499 or less | 7 (4.7%) | 28 (16.7%) |
| $2,500 to $4,999 | 0 (0.0%) | 7 (4.2%) |
| $5,000 to $7,499 | 0 (0.0%) | 0 (0.0%) |
| $7,500 to $9,999 | 0 (0.0%) | 11 (6.6%) |
| $10,000 to $12,499 | 0 (0.0%) | 0 (0.0%) |
| $12,500 to $14,999 | 0 (0.0%) | 0 (0.0%) |
| $15,000 to $17,499 | 9 (6.0%) | 0 (0.0%) |
| $17,500 to $19,999 | 0 (0.0%) | 7 (4.2%) |
| $20,000 to $22,499 | 0 (0.0%) | 0 (0.0%) |
| $22,500 to $24,999 | 0 (0.0%) | 0 (0.0%) |
| $25,000 to $29,999 | 0 (0.0%) | 0 (0.0%) |
| $30,000 to $34,999 | 4 (2.7%) | 13 (7.7%) |
| $35,000 to $39,999 | 0 (0.0%) | 26 (15.5%) |
| $40,000 to $44,999 | 61 (40.7%) | 7 (4.2%) |
| $45,000 to $49,999 | 5 (3.3%) | 7 (4.2%) |
| $50,000 to $54,999 | 0 (0.0%) | 6 (3.6%) |
| $55,000 to $64,999 | 7 (4.7%) | 0 (0.0%) |
| $65,000 to $74,999 | 23 (15.3%) | 25 (14.9%) |
| $75,000 to $99,999 | 21 (14.0%) | 31 (18.4%) |
| $100,000+ | 13 (8.7%) | 0 (0.0%) |
| Total | 150 (100.0%) | 168 (100.0%) |
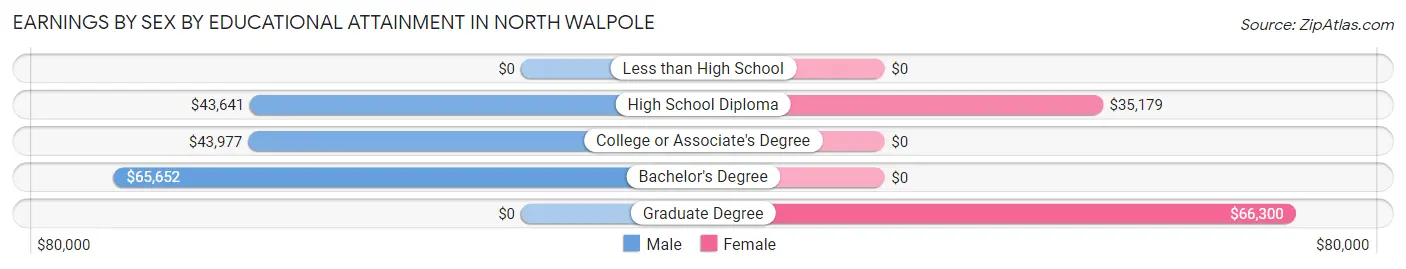
Earnings by Sex by Educational Attainment in North Walpole
Average earnings in North Walpole are $44,778 for men and $44,286 for women, a difference of 1.1%. Men with an educational attainment of bachelor's degree enjoy the highest average annual earnings of $65,652, while those with high school diploma education earn the least with $43,641. Women with an educational attainment of graduate degree earn the most with the average annual earnings of $66,300, while those with high school diploma education have the smallest earnings of $35,179.
| Educational Attainment | Male Income | Female Income |
| Less than High School | - | - |
| High School Diploma | $43,641 | $35,179 |
| College or Associate's Degree | $43,977 | $0 |
| Bachelor's Degree | $65,652 | $0 |
| Graduate Degree | - | - |
| Total | $44,778 | $44,286 |
Family Income in North Walpole
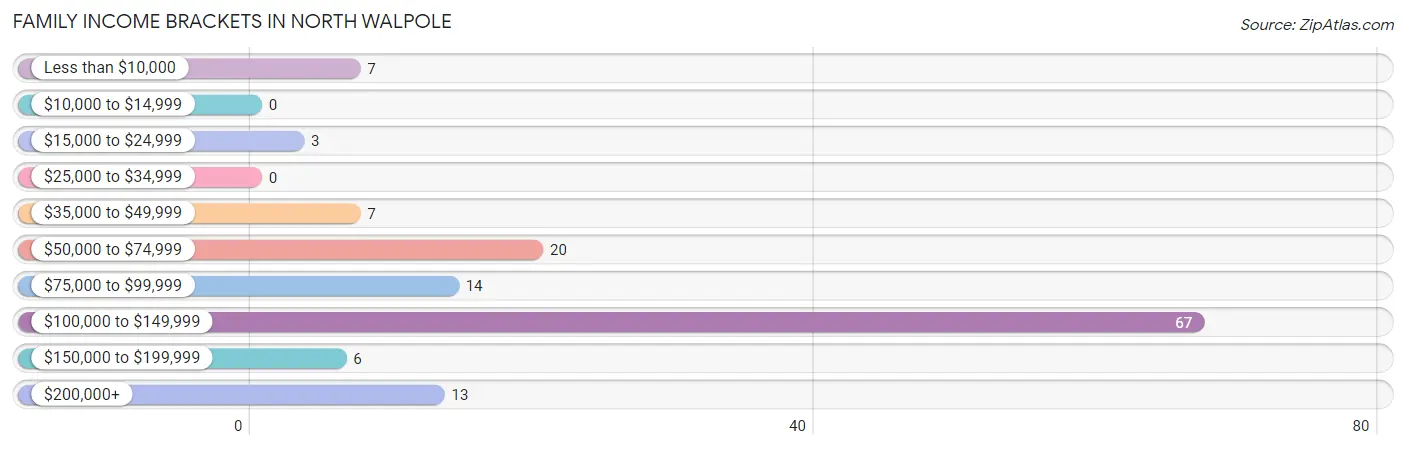
Family Income Brackets in North Walpole
According to the North Walpole family income data, there are 67 families falling into the $100,000 to $149,999 income range, which is the most common income bracket and makes up 48.9% of all families.
| Income Bracket | # Families | % Families |
| Less than $10,000 | 7 | 5.1% |
| $10,000 to $14,999 | 0 | 0.0% |
| $15,000 to $24,999 | 3 | 2.2% |
| $25,000 to $34,999 | 0 | 0.0% |
| $35,000 to $49,999 | 7 | 5.1% |
| $50,000 to $74,999 | 20 | 14.6% |
| $75,000 to $99,999 | 14 | 10.2% |
| $100,000 to $149,999 | 67 | 48.9% |
| $150,000 to $199,999 | 6 | 4.4% |
| $200,000+ | 13 | 9.5% |
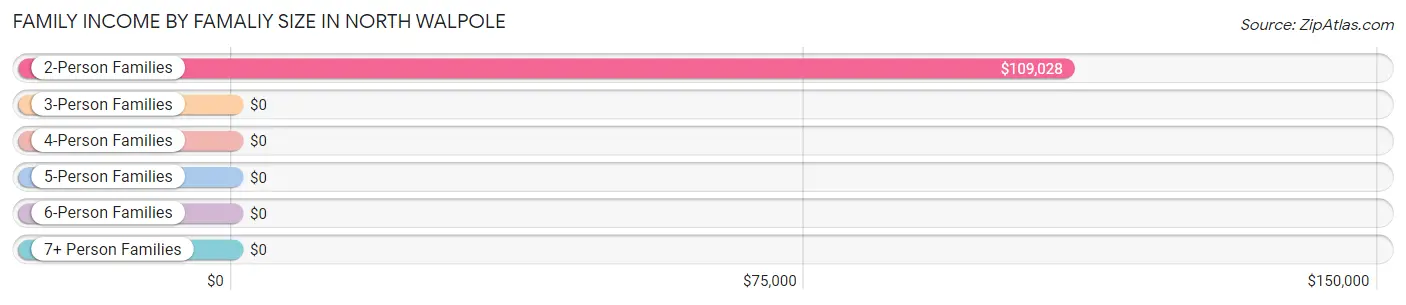
Family Income by Famaliy Size in North Walpole
2-person families (90 | 65.7%) account for the highest median family income in North Walpole with $109,028 per family, while 2-person families (90 | 65.7%) have the highest median income of $54,514 per family member.
| Income Bracket | # Families | Median Income |
| 2-Person Families | 90 (65.7%) | $109,028 |
| 3-Person Families | 16 (11.7%) | $0 |
| 4-Person Families | 7 (5.1%) | $0 |
| 5-Person Families | 24 (17.5%) | $0 |
| 6-Person Families | 0 (0.0%) | $0 |
| 7+ Person Families | 0 (0.0%) | $0 |
| Total | 137 (100.0%) | $109,931 |
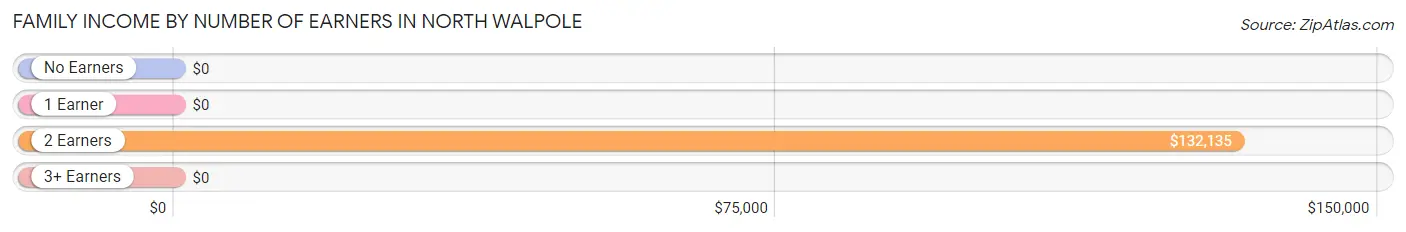
Family Income by Number of Earners in North Walpole
| Number of Earners | # Families | Median Income |
| No Earners | 31 (22.6%) | $0 |
| 1 Earner | 30 (21.9%) | $0 |
| 2 Earners | 69 (50.4%) | $132,135 |
| 3+ Earners | 7 (5.1%) | $0 |
| Total | 137 (100.0%) | $109,931 |
Household Income in North Walpole
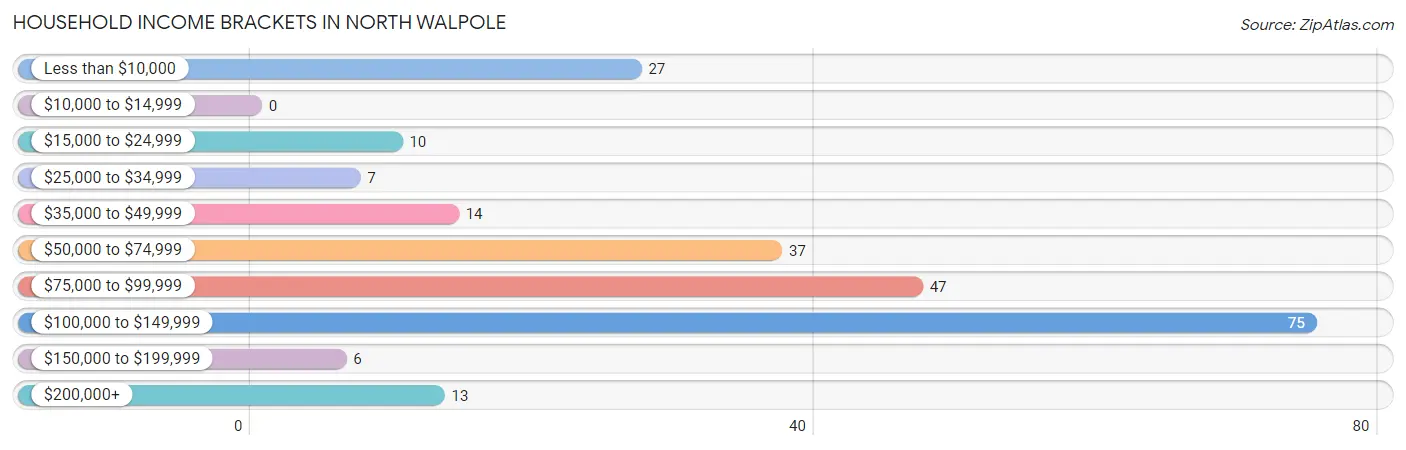
Household Income Brackets in North Walpole
With 75 households falling in the category, the $100,000 to $149,999 income range is the most frequent in North Walpole, accounting for 31.8% of all households.
| Income Bracket | # Households | % Households |
| Less than $10,000 | 27 | 11.4% |
| $10,000 to $14,999 | 0 | 0.0% |
| $15,000 to $24,999 | 10 | 4.2% |
| $25,000 to $34,999 | 7 | 3.0% |
| $35,000 to $49,999 | 14 | 5.9% |
| $50,000 to $74,999 | 37 | 15.7% |
| $75,000 to $99,999 | 47 | 19.9% |
| $100,000 to $149,999 | 75 | 31.8% |
| $150,000 to $199,999 | 6 | 2.5% |
| $200,000+ | 13 | 5.5% |
Household Income by Householder Age in North Walpole
The median household income in North Walpole is $79,318, with the highest median household income of $88,500 found in the 25 to 44 years age bracket for the primary householder. A total of 84 households (35.6%) fall into this category. Meanwhile, the 15 to 24 years age bracket for the primary householder has the lowest median household income of $0, with 5 households (2.1%) in this group.
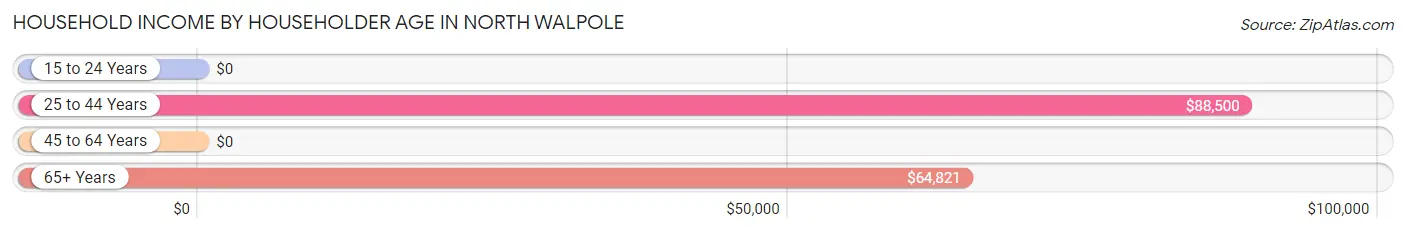
| Income Bracket | # Households | Median Income |
| 15 to 24 Years | 5 (2.1%) | $0 |
| 25 to 44 Years | 84 (35.6%) | $88,500 |
| 45 to 64 Years | 84 (35.6%) | $0 |
| 65+ Years | 63 (26.7%) | $64,821 |
| Total | 236 (100.0%) | $79,318 |
Poverty in North Walpole
Income Below Poverty by Sex and Age in North Walpole
With 9.7% poverty level for males and 16.4% for females among the residents of North Walpole, 55 to 64 year old males and 55 to 64 year old females are the most vulnerable to poverty, with 20 males (58.8%) and 20 females (76.9%) in their respective age groups living below the poverty level.
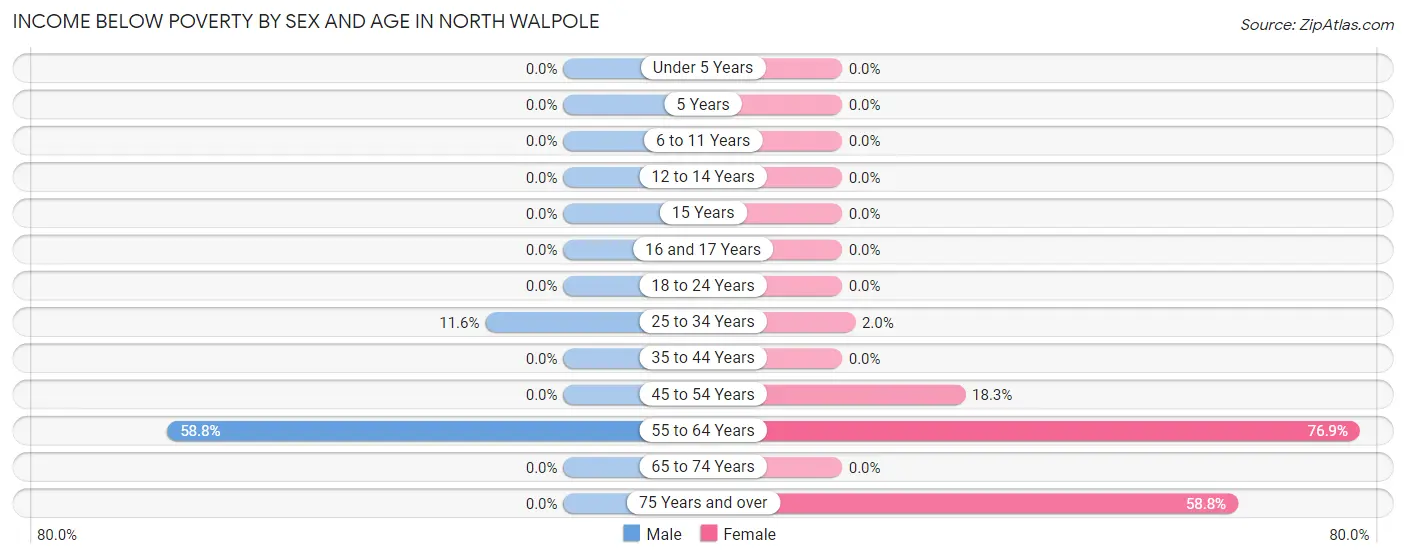
| Age Bracket | Male | Female |
| Under 5 Years | 0 (0.0%) | 0 (0.0%) |
| 5 Years | 0 (0.0%) | 0 (0.0%) |
| 6 to 11 Years | 0 (0.0%) | 0 (0.0%) |
| 12 to 14 Years | 0 (0.0%) | 0 (0.0%) |
| 15 Years | 0 (0.0%) | 0 (0.0%) |
| 16 and 17 Years | 0 (0.0%) | 0 (0.0%) |
| 18 to 24 Years | 0 (0.0%) | 0 (0.0%) |
| 25 to 34 Years | 8 (11.6%) | 1 (2.0%) |
| 35 to 44 Years | 0 (0.0%) | 0 (0.0%) |
| 45 to 54 Years | 0 (0.0%) | 13 (18.3%) |
| 55 to 64 Years | 20 (58.8%) | 20 (76.9%) |
| 65 to 74 Years | 0 (0.0%) | 0 (0.0%) |
| 75 Years and over | 0 (0.0%) | 10 (58.8%) |
| Total | 28 (9.7%) | 44 (16.4%) |
Income Above Poverty by Sex and Age in North Walpole
According to the poverty statistics in North Walpole, males aged 6 to 11 years and females aged under 5 years are the age groups that are most secure financially, with 100.0% of males and 100.0% of females in these age groups living above the poverty line.
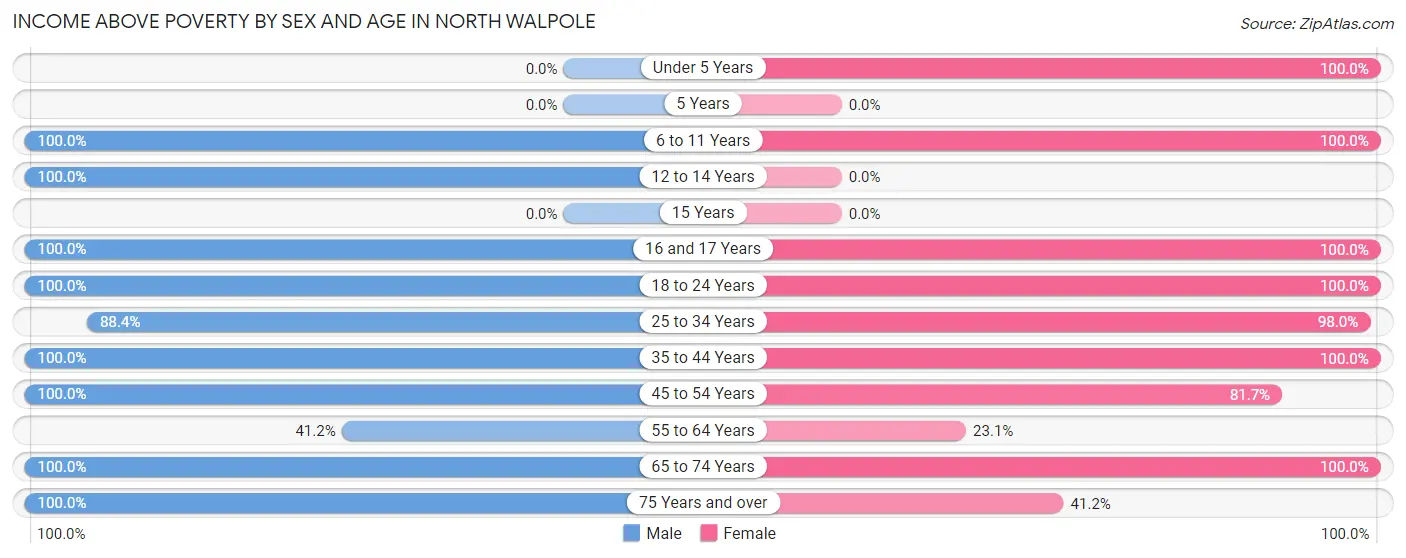
| Age Bracket | Male | Female |
| Under 5 Years | 0 (0.0%) | 8 (100.0%) |
| 5 Years | 0 (0.0%) | 0 (0.0%) |
| 6 to 11 Years | 11 (100.0%) | 7 (100.0%) |
| 12 to 14 Years | 6 (100.0%) | 0 (0.0%) |
| 15 Years | 0 (0.0%) | 0 (0.0%) |
| 16 and 17 Years | 70 (100.0%) | 32 (100.0%) |
| 18 to 24 Years | 5 (100.0%) | 18 (100.0%) |
| 25 to 34 Years | 61 (88.4%) | 50 (98.0%) |
| 35 to 44 Years | 16 (100.0%) | 7 (100.0%) |
| 45 to 54 Years | 23 (100.0%) | 58 (81.7%) |
| 55 to 64 Years | 14 (41.2%) | 6 (23.1%) |
| 65 to 74 Years | 50 (100.0%) | 31 (100.0%) |
| 75 Years and over | 6 (100.0%) | 7 (41.2%) |
| Total | 262 (90.3%) | 224 (83.6%) |
Income Below Poverty Among Married-Couple Families in North Walpole
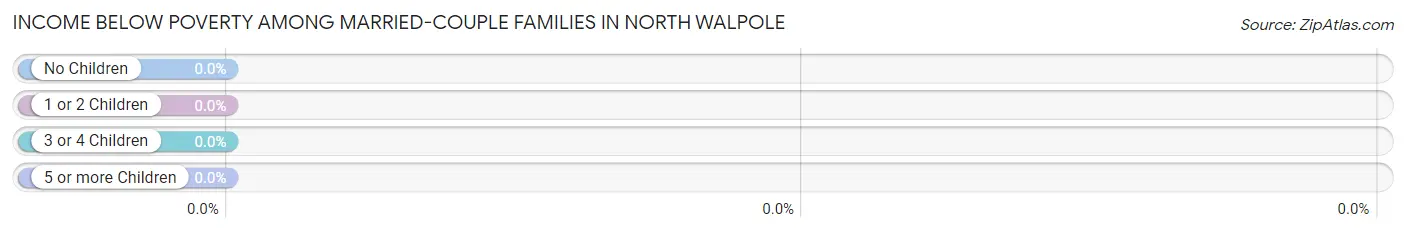
| Children | Above Poverty | Below Poverty |
| No Children | 62 (100.0%) | 0 (0.0%) |
| 1 or 2 Children | 0 (0.0%) | 0 (0.0%) |
| 3 or 4 Children | 24 (100.0%) | 0 (0.0%) |
| 5 or more Children | 0 (0.0%) | 0 (0.0%) |
| Total | 86 (100.0%) | 0 (0.0%) |
Income Below Poverty Among Single-Parent Households in North Walpole
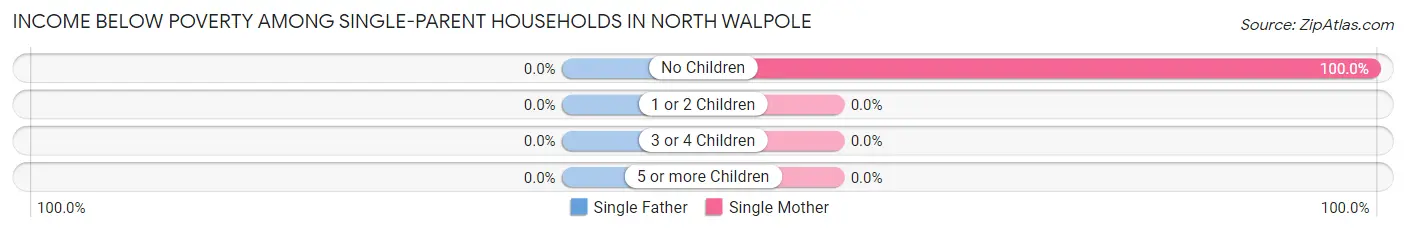
| Children | Single Father | Single Mother |
| No Children | 0 (0.0%) | 10 (100.0%) |
| 1 or 2 Children | 0 (0.0%) | 0 (0.0%) |
| 3 or 4 Children | 0 (0.0%) | 0 (0.0%) |
| 5 or more Children | 0 (0.0%) | 0 (0.0%) |
| Total | 0 (0.0%) | 10 (27.0%) |
Income Below Poverty Among Married-Couple vs Single-Parent Households in North Walpole
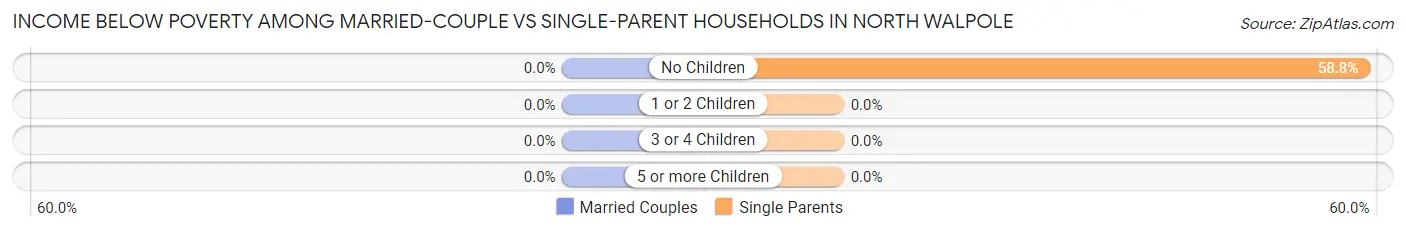
| Children | Married-Couple Families | Single-Parent Households |
| No Children | 0 (0.0%) | 10 (58.8%) |
| 1 or 2 Children | 0 (0.0%) | 0 (0.0%) |
| 3 or 4 Children | 0 (0.0%) | 0 (0.0%) |
| 5 or more Children | 0 (0.0%) | 0 (0.0%) |
| Total | 0 (0.0%) | 10 (19.6%) |
Race in North Walpole
The most populous races in North Walpole are White / Caucasian (508 | 91.0%), Two or more Races (37 | 6.6%), and Some other Race (13 | 2.3%).
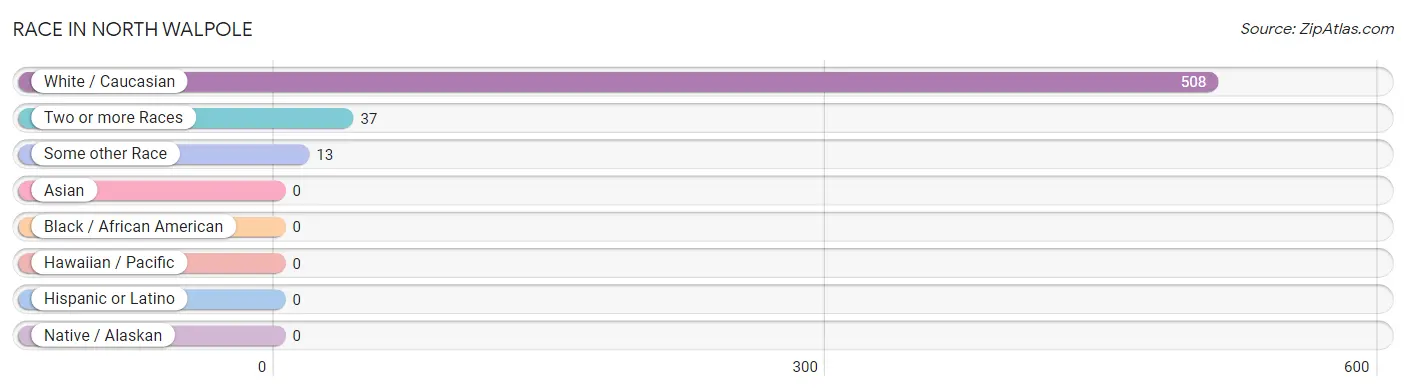
| Race | # Population | % Population |
| Asian | 0 | 0.0% |
| Black / African American | 0 | 0.0% |
| Hawaiian / Pacific | 0 | 0.0% |
| Hispanic or Latino | 0 | 0.0% |
| Native / Alaskan | 0 | 0.0% |
| White / Caucasian | 508 | 91.0% |
| Two or more Races | 37 | 6.6% |
| Some other Race | 13 | 2.3% |
| Total | 558 | 100.0% |
Ancestry in North Walpole
The most populous ancestries reported in North Walpole are Polish (138 | 24.7%), French (122 | 21.9%), English (74 | 13.3%), French Canadian (62 | 11.1%), and Irish (57 | 10.2%), together accounting for 81.2% of all North Walpole residents.
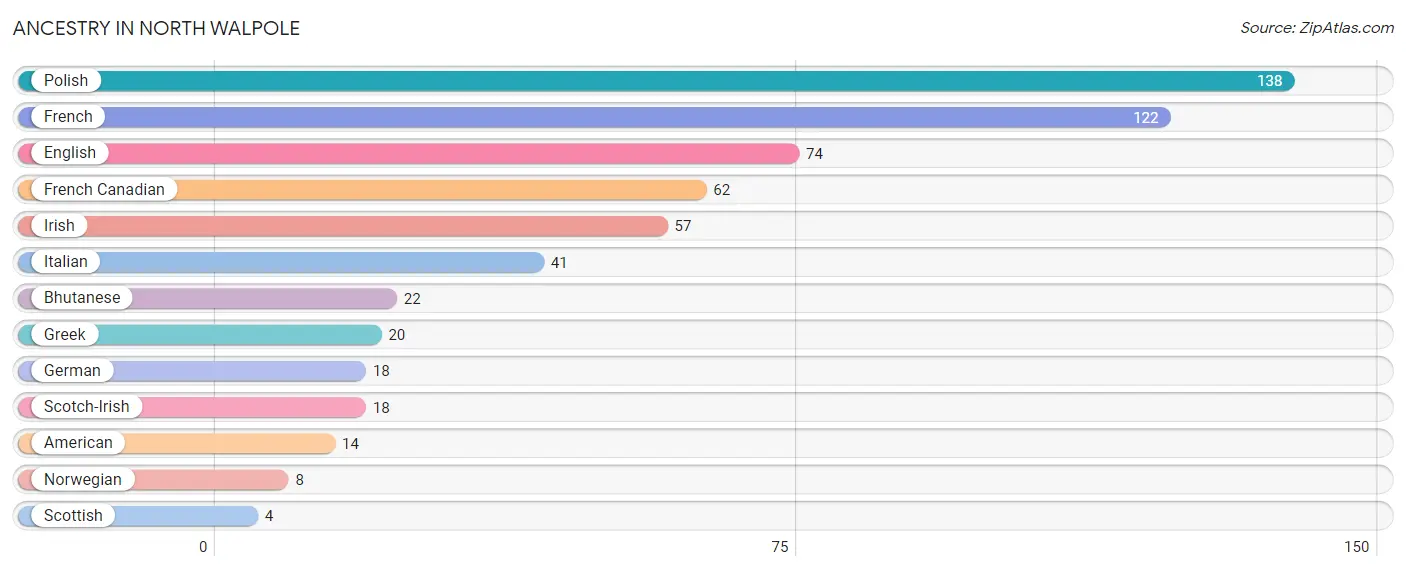
| Ancestry | # Population | % Population |
| American | 14 | 2.5% |
| Bhutanese | 22 | 3.9% |
| English | 74 | 13.3% |
| French | 122 | 21.9% |
| French Canadian | 62 | 11.1% |
| German | 18 | 3.2% |
| Greek | 20 | 3.6% |
| Irish | 57 | 10.2% |
| Italian | 41 | 7.3% |
| Norwegian | 8 | 1.4% |
| Polish | 138 | 24.7% |
| Scotch-Irish | 18 | 3.2% |
| Scottish | 4 | 0.7% | View All 13 Rows |
Immigrants in North Walpole
The most numerous immigrant groups reported in North Walpole came from Central America (20 | 3.6%), Latin America (20 | 3.6%), and Mexico (20 | 3.6%), together accounting for 10.7% of all North Walpole residents.
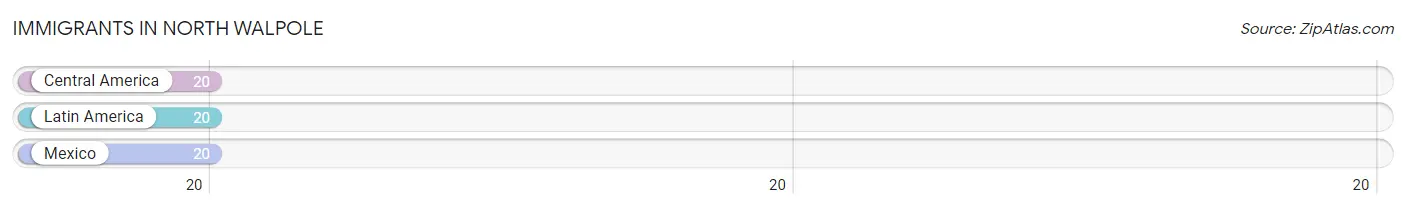
| Immigration Origin | # Population | % Population |
| Central America | 20 | 3.6% |
| Latin America | 20 | 3.6% |
| Mexico | 20 | 3.6% | View All 3 Rows |
Sex and Age in North Walpole
Sex and Age in North Walpole
The most populous age groups in North Walpole are 15 to 19 Years (75 | 25.9%) for men and 50 to 54 Years (57 | 21.3%) for women.
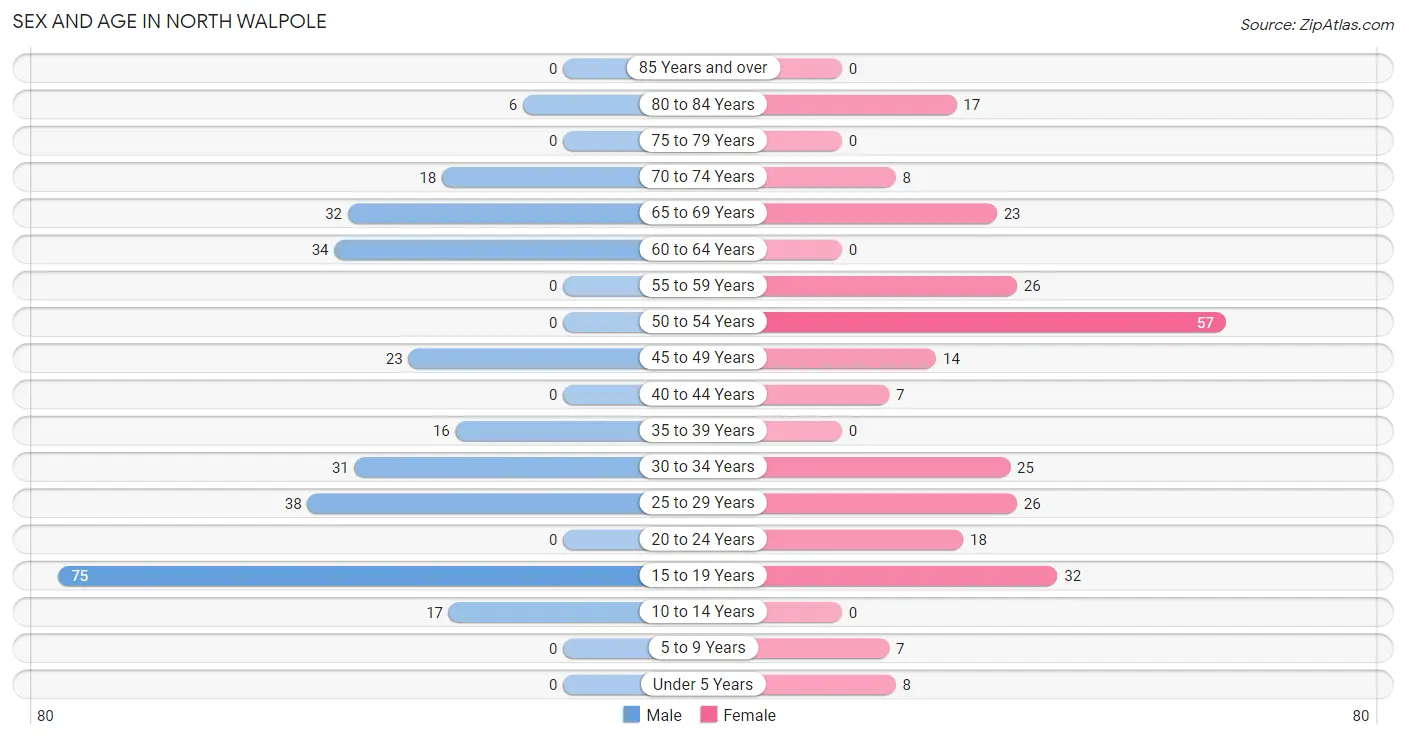
| Age Bracket | Male | Female |
| Under 5 Years | 0 (0.0%) | 8 (3.0%) |
| 5 to 9 Years | 0 (0.0%) | 7 (2.6%) |
| 10 to 14 Years | 17 (5.9%) | 0 (0.0%) |
| 15 to 19 Years | 75 (25.9%) | 32 (11.9%) |
| 20 to 24 Years | 0 (0.0%) | 18 (6.7%) |
| 25 to 29 Years | 38 (13.1%) | 26 (9.7%) |
| 30 to 34 Years | 31 (10.7%) | 25 (9.3%) |
| 35 to 39 Years | 16 (5.5%) | 0 (0.0%) |
| 40 to 44 Years | 0 (0.0%) | 7 (2.6%) |
| 45 to 49 Years | 23 (7.9%) | 14 (5.2%) |
| 50 to 54 Years | 0 (0.0%) | 57 (21.3%) |
| 55 to 59 Years | 0 (0.0%) | 26 (9.7%) |
| 60 to 64 Years | 34 (11.7%) | 0 (0.0%) |
| 65 to 69 Years | 32 (11.0%) | 23 (8.6%) |
| 70 to 74 Years | 18 (6.2%) | 8 (3.0%) |
| 75 to 79 Years | 0 (0.0%) | 0 (0.0%) |
| 80 to 84 Years | 6 (2.1%) | 17 (6.3%) |
| 85 Years and over | 0 (0.0%) | 0 (0.0%) |
| Total | 290 (100.0%) | 268 (100.0%) |
Families and Households in North Walpole
Median Family Size in North Walpole
The median family size in North Walpole is 3.04 persons per family, with single female/mother families (37 | 27.0%) accounting for the largest median family size of 3.43 persons per family. On the other hand, single male/father families (14 | 10.2%) represent the smallest median family size with 2.64 persons per family.
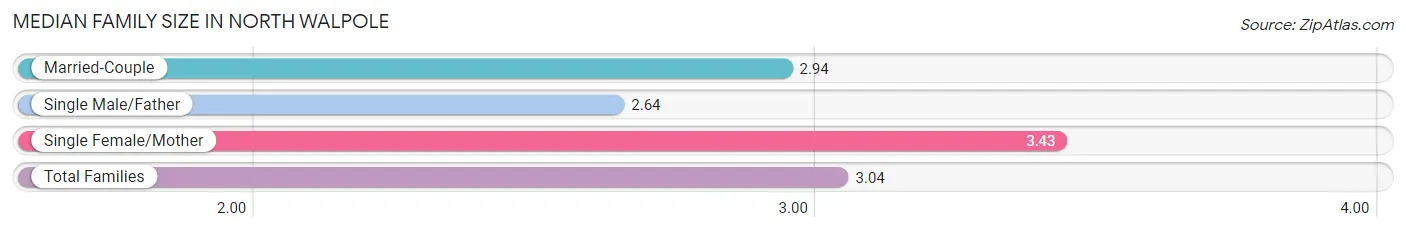
| Family Type | # Families | Family Size |
| Married-Couple | 86 (62.8%) | 2.94 |
| Single Male/Father | 14 (10.2%) | 2.64 |
| Single Female/Mother | 37 (27.0%) | 3.43 |
| Total Families | 137 (100.0%) | 3.04 |
Median Household Size in North Walpole
The median household size in North Walpole is 2.36 persons per household, with single female/mother households (37 | 15.7%) accounting for the largest median household size of 3.65 persons per household. non-family households (99 | 41.9%) represent the smallest median household size with 1.34 persons per household.
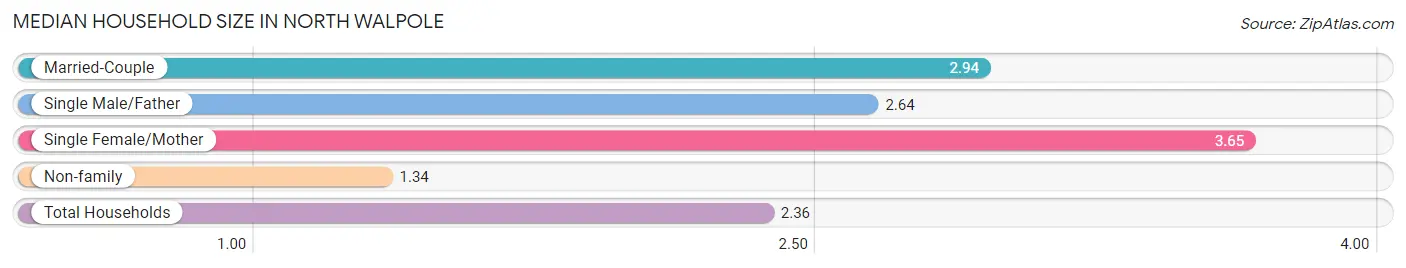
| Household Type | # Households | Household Size |
| Married-Couple | 86 (36.4%) | 2.94 |
| Single Male/Father | 14 (5.9%) | 2.64 |
| Single Female/Mother | 37 (15.7%) | 3.65 |
| Non-family | 99 (41.9%) | 1.34 |
| Total Households | 236 (100.0%) | 2.36 |
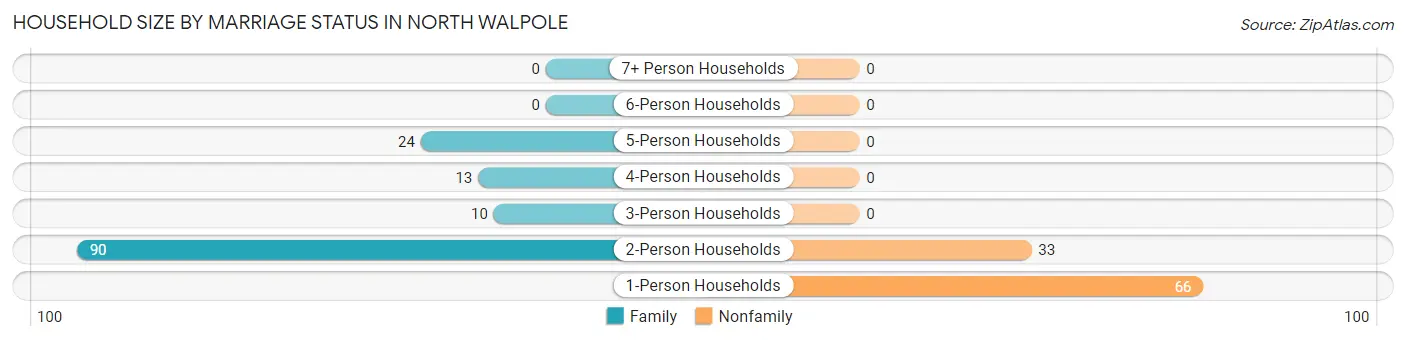
Household Size by Marriage Status in North Walpole
Out of a total of 236 households in North Walpole, 137 (58.1%) are family households, while 99 (41.9%) are nonfamily households. The most numerous type of family households are 2-person households, comprising 90, and the most common type of nonfamily households are 1-person households, comprising 66.
| Household Size | Family Households | Nonfamily Households |
| 1-Person Households | - | 66 (28.0%) |
| 2-Person Households | 90 (38.1%) | 33 (14.0%) |
| 3-Person Households | 10 (4.2%) | 0 (0.0%) |
| 4-Person Households | 13 (5.5%) | 0 (0.0%) |
| 5-Person Households | 24 (10.2%) | 0 (0.0%) |
| 6-Person Households | 0 (0.0%) | 0 (0.0%) |
| 7+ Person Households | 0 (0.0%) | 0 (0.0%) |
| Total | 137 (58.1%) | 99 (41.9%) |
Female Fertility in North Walpole
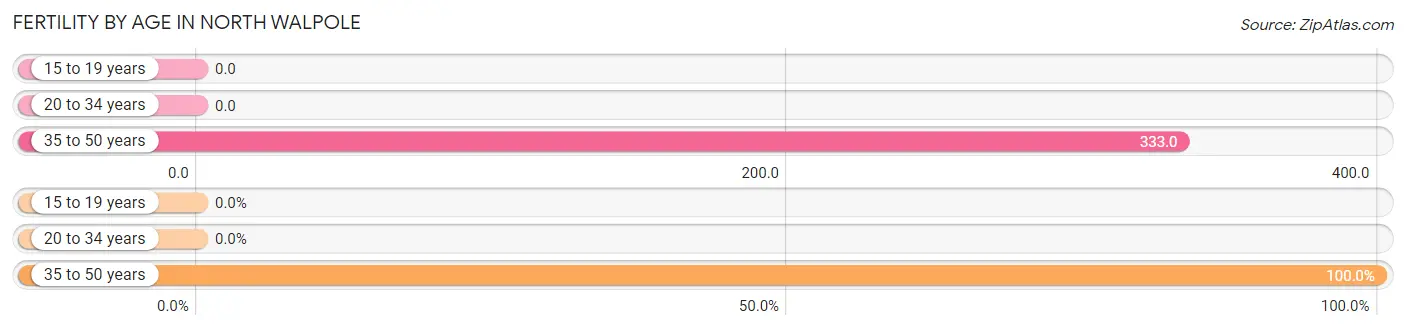
Fertility by Age in North Walpole
Average fertility rate in North Walpole is 57.0 births per 1,000 women. Women in the age bracket of 35 to 50 years have the highest fertility rate with 333.0 births per 1,000 women. Women in the age bracket of 35 to 50 years acount for 100.0% of all women with births.
| Age Bracket | Women with Births | Births / 1,000 Women |
| 15 to 19 years | 0 (0.0%) | 0.0 |
| 20 to 34 years | 0 (0.0%) | 0.0 |
| 35 to 50 years | 7 (100.0%) | 333.0 |
| Total | 7 (100.0%) | 57.0 |
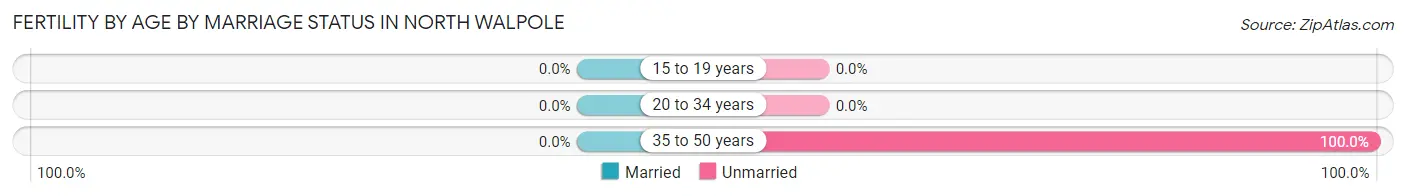
Fertility by Age by Marriage Status in North Walpole
| Age Bracket | Married | Unmarried |
| 15 to 19 years | 0 (0.0%) | 0 (0.0%) |
| 20 to 34 years | 0 (0.0%) | 0 (0.0%) |
| 35 to 50 years | 0 (0.0%) | 7 (100.0%) |
| Total | 0 (0.0%) | 7 (100.0%) |
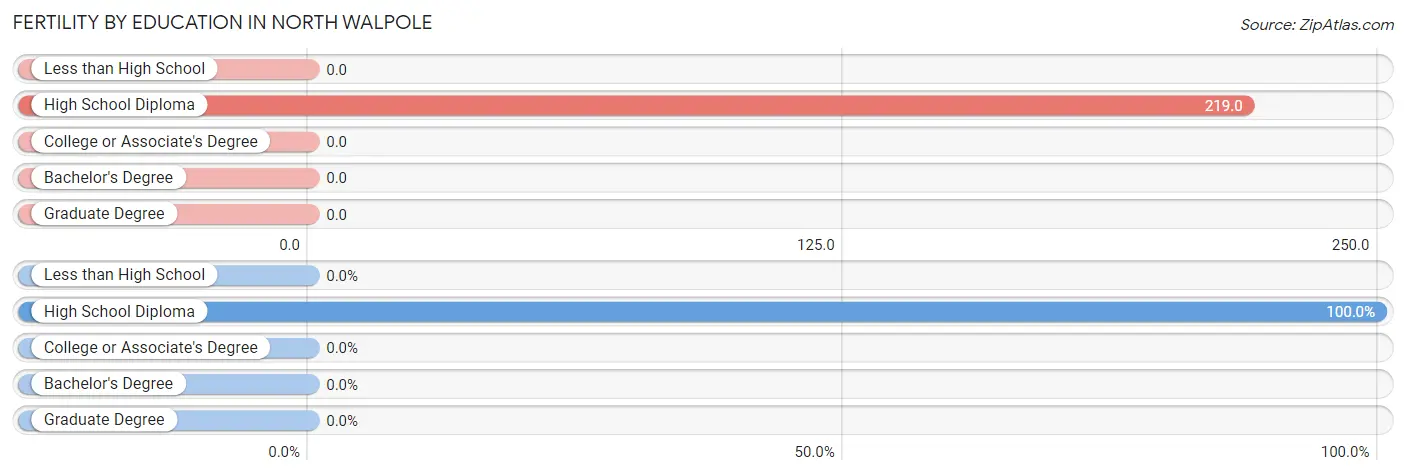
Fertility by Education in North Walpole
| Educational Attainment | Women with Births | Births / 1,000 Women |
| Less than High School | 0 (0.0%) | 0.0 |
| High School Diploma | 7 (100.0%) | 219.0 |
| College or Associate's Degree | 0 (0.0%) | 0.0 |
| Bachelor's Degree | 0 (0.0%) | 0.0 |
| Graduate Degree | 0 (0.0%) | 0.0 |
| Total | 7 (100.0%) | 57.0 |
Fertility by Education by Marriage Status in North Walpole
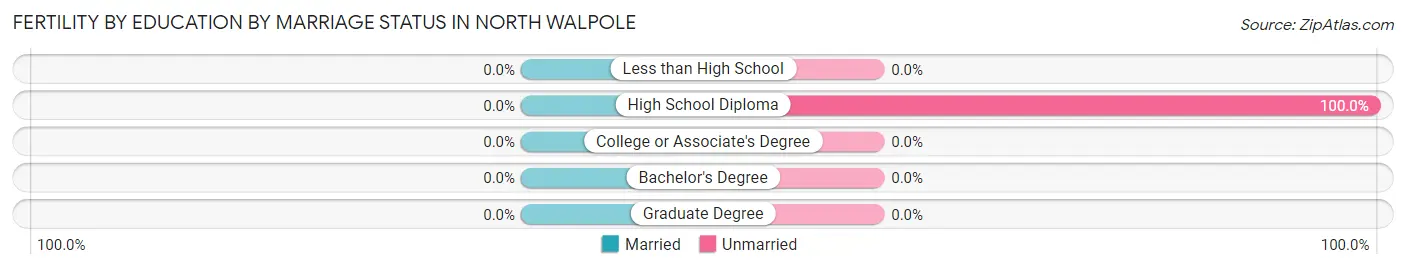
| Educational Attainment | Married | Unmarried |
| Less than High School | 0 (0.0%) | 0 (0.0%) |
| High School Diploma | 0 (0.0%) | 7 (100.0%) |
| College or Associate's Degree | 0 (0.0%) | 0 (0.0%) |
| Bachelor's Degree | 0 (0.0%) | 0 (0.0%) |
| Graduate Degree | 0 (0.0%) | 0 (0.0%) |
| Total | 0 (0.0%) | 7 (100.0%) |
Employment Characteristics in North Walpole
Employment by Class of Employer in North Walpole
Among the 304 employed individuals in North Walpole, private company employees (216 | 71.1%), not-for-profit organizations (35 | 11.5%), and self-employed (not incorporated) (32 | 10.5%) make up the most common classes of employment.
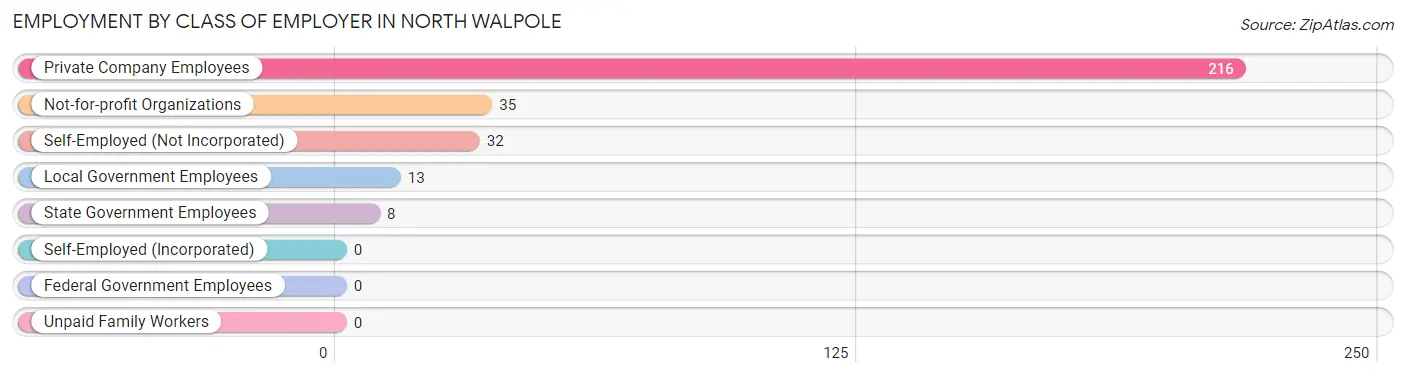
| Employer Class | # Employees | % Employees |
| Private Company Employees | 216 | 71.1% |
| Self-Employed (Incorporated) | 0 | 0.0% |
| Self-Employed (Not Incorporated) | 32 | 10.5% |
| Not-for-profit Organizations | 35 | 11.5% |
| Local Government Employees | 13 | 4.3% |
| State Government Employees | 8 | 2.6% |
| Federal Government Employees | 0 | 0.0% |
| Unpaid Family Workers | 0 | 0.0% |
| Total | 304 | 100.0% |
Employment Status by Age in North Walpole
According to the labor force statistics for North Walpole, out of the total population over 16 years of age (526), 59.3% or 312 individuals are in the labor force, with 2.6% or 8 of them unemployed. The age group with the highest labor force participation rate is 20 to 24 years, with 100.0% or 18 individuals in the labor force. Within the labor force, the 30 to 34 years age range has the highest percentage of unemployed individuals, with 14.3% or 8 of them being unemployed.
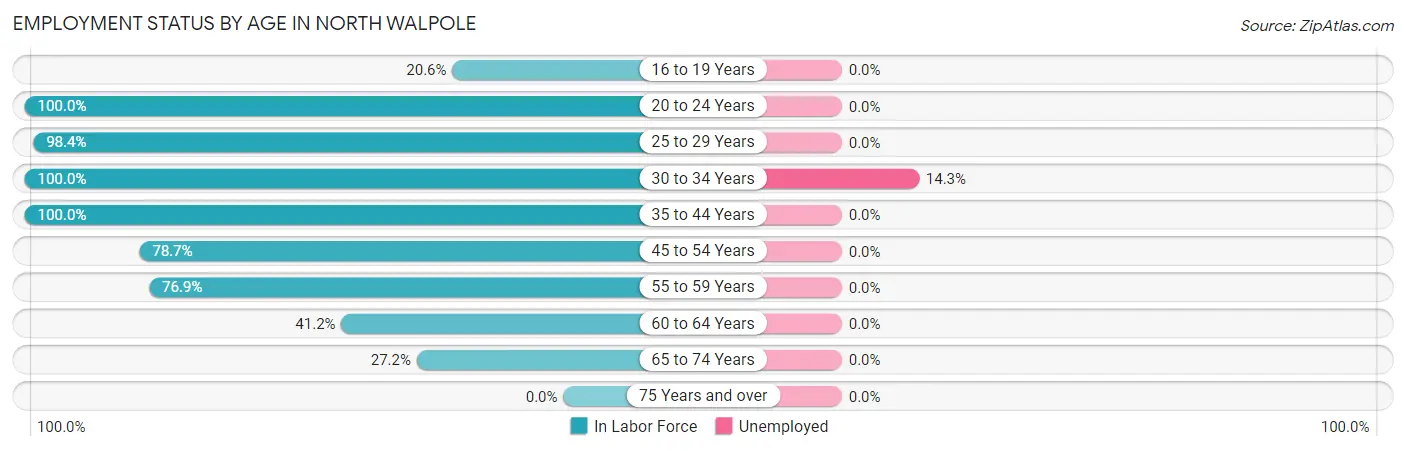
| Age Bracket | In Labor Force | Unemployed |
| 16 to 19 Years | 22 (20.6%) | 0 (0.0%) |
| 20 to 24 Years | 18 (100.0%) | 0 (0.0%) |
| 25 to 29 Years | 63 (98.4%) | 0 (0.0%) |
| 30 to 34 Years | 56 (100.0%) | 8 (14.3%) |
| 35 to 44 Years | 23 (100.0%) | 0 (0.0%) |
| 45 to 54 Years | 74 (78.7%) | 0 (0.0%) |
| 55 to 59 Years | 20 (76.9%) | 0 (0.0%) |
| 60 to 64 Years | 14 (41.2%) | 0 (0.0%) |
| 65 to 74 Years | 22 (27.2%) | 0 (0.0%) |
| 75 Years and over | 0 (0.0%) | 0 (0.0%) |
| Total | 312 (59.3%) | 8 (2.6%) |
Employment Status by Educational Attainment in North Walpole
According to labor force statistics for North Walpole, 84.2% of individuals (250) out of the total population between 25 and 64 years of age (297) are in the labor force, with 3.2% or 8 of them being unemployed. The group with the highest labor force participation rate are those with the educational attainment of high school diploma, with 100.0% or 48 individuals in the labor force. Within the labor force, individuals with less than high school education have the highest percentage of unemployment, with 47.1% or 8 of them being unemployed.
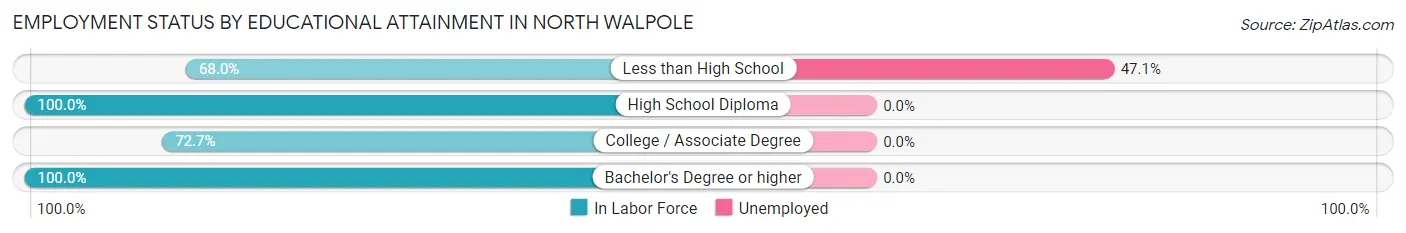
| Educational Attainment | In Labor Force | Unemployed |
| Less than High School | 17 (68.0%) | 12 (47.1%) |
| High School Diploma | 48 (100.0%) | 0 (0.0%) |
| College / Associate Degree | 104 (72.7%) | 0 (0.0%) |
| Bachelor's Degree or higher | 81 (100.0%) | 0 (0.0%) |
| Total | 250 (84.2%) | 10 (3.2%) |
Employment Occupations by Sex in North Walpole
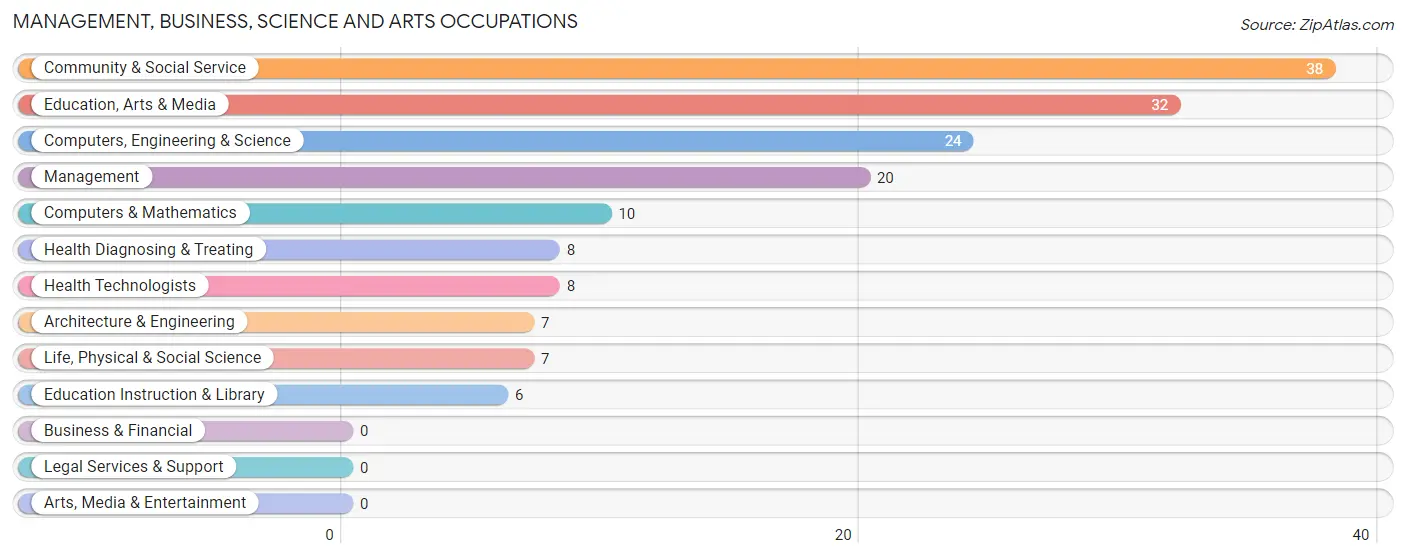
Management, Business, Science and Arts Occupations
The most common Management, Business, Science and Arts occupations in North Walpole are Community & Social Service (38 | 12.5%), Education, Arts & Media (32 | 10.5%), Computers, Engineering & Science (24 | 7.9%), Management (20 | 6.6%), and Computers & Mathematics (10 | 3.3%).
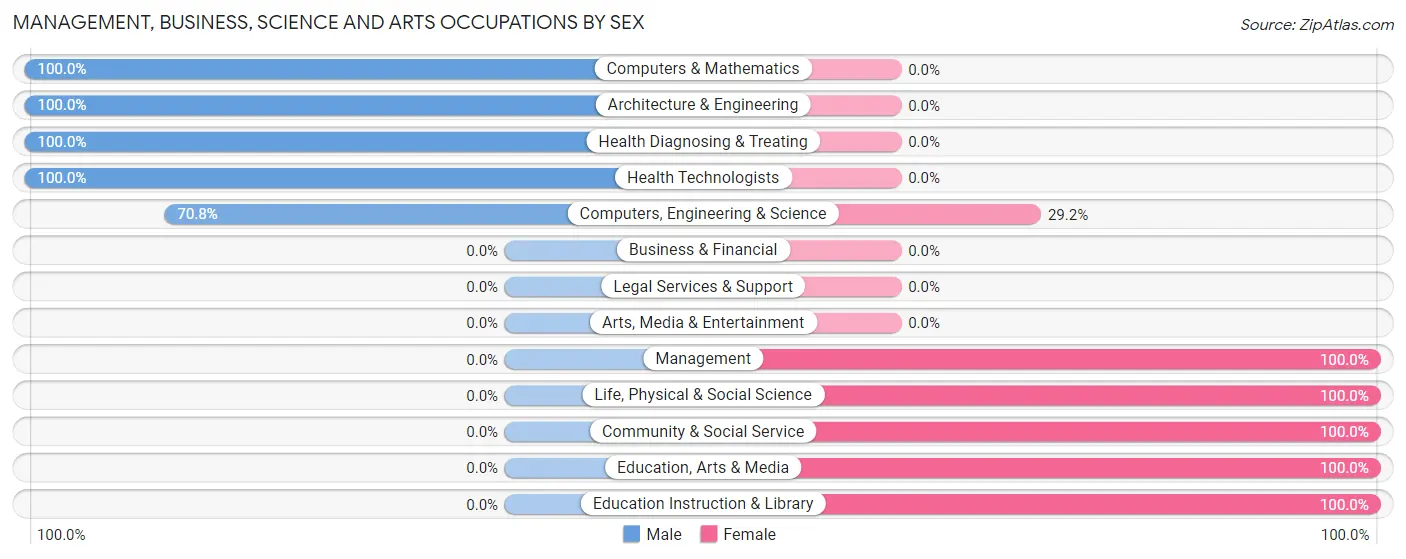
Management, Business, Science and Arts Occupations by Sex
Within the Management, Business, Science and Arts occupations in North Walpole, the most male-oriented occupations are Computers & Mathematics (100.0%), Architecture & Engineering (100.0%), and Health Diagnosing & Treating (100.0%), while the most female-oriented occupations are Management (100.0%), Life, Physical & Social Science (100.0%), and Community & Social Service (100.0%).
| Occupation | Male | Female |
| Management | 0 (0.0%) | 20 (100.0%) |
| Business & Financial | 0 (0.0%) | 0 (0.0%) |
| Computers, Engineering & Science | 17 (70.8%) | 7 (29.2%) |
| Computers & Mathematics | 10 (100.0%) | 0 (0.0%) |
| Architecture & Engineering | 7 (100.0%) | 0 (0.0%) |
| Life, Physical & Social Science | 0 (0.0%) | 7 (100.0%) |
| Community & Social Service | 0 (0.0%) | 38 (100.0%) |
| Education, Arts & Media | 0 (0.0%) | 32 (100.0%) |
| Legal Services & Support | 0 (0.0%) | 0 (0.0%) |
| Education Instruction & Library | 0 (0.0%) | 6 (100.0%) |
| Arts, Media & Entertainment | 0 (0.0%) | 0 (0.0%) |
| Health Diagnosing & Treating | 8 (100.0%) | 0 (0.0%) |
| Health Technologists | 8 (100.0%) | 0 (0.0%) |
| Total (Category) | 25 (27.8%) | 65 (72.2%) |
| Total (Overall) | 143 (47.0%) | 161 (53.0%) |
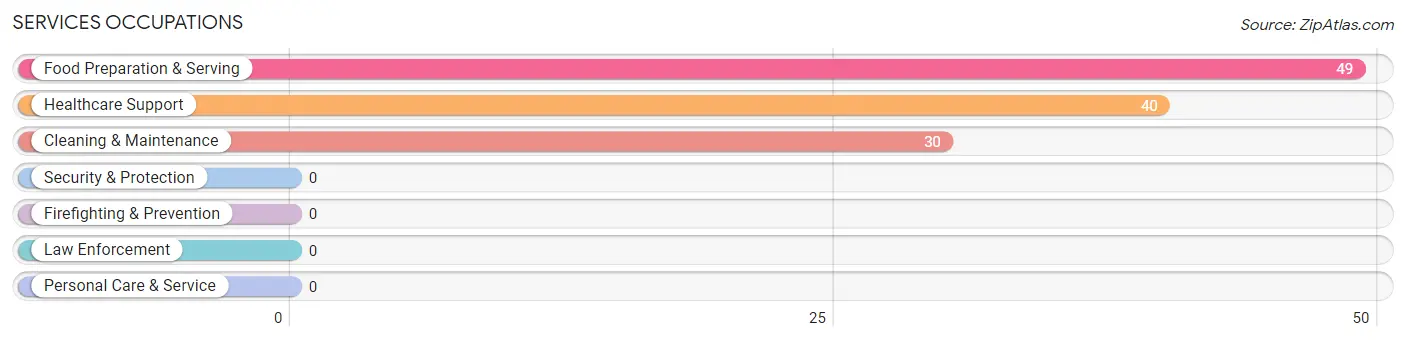
Services Occupations
The most common Services occupations in North Walpole are Food Preparation & Serving (49 | 16.1%), Healthcare Support (40 | 13.2%), and Cleaning & Maintenance (30 | 9.9%).
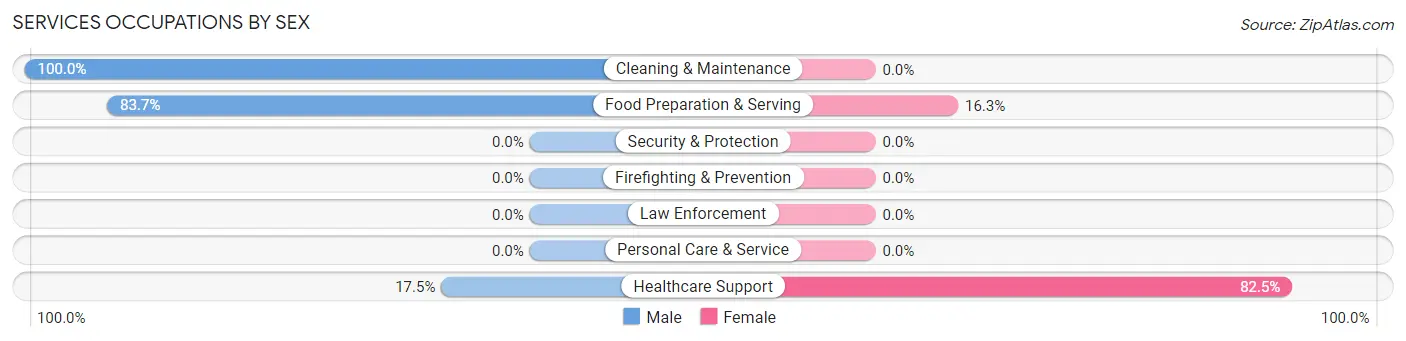
Services Occupations by Sex
Within the Services occupations in North Walpole, the most male-oriented occupations are Cleaning & Maintenance (100.0%), Food Preparation & Serving (83.7%), and Healthcare Support (17.5%), while the most female-oriented occupations are Healthcare Support (82.5%), and Food Preparation & Serving (16.3%).
| Occupation | Male | Female |
| Healthcare Support | 7 (17.5%) | 33 (82.5%) |
| Security & Protection | 0 (0.0%) | 0 (0.0%) |
| Firefighting & Prevention | 0 (0.0%) | 0 (0.0%) |
| Law Enforcement | 0 (0.0%) | 0 (0.0%) |
| Food Preparation & Serving | 41 (83.7%) | 8 (16.3%) |
| Cleaning & Maintenance | 30 (100.0%) | 0 (0.0%) |
| Personal Care & Service | 0 (0.0%) | 0 (0.0%) |
| Total (Category) | 78 (65.5%) | 41 (34.4%) |
| Total (Overall) | 143 (47.0%) | 161 (53.0%) |
Sales and Office Occupations
The most common Sales and Office occupations in North Walpole are , and Office & Administration (48 | 15.8%).
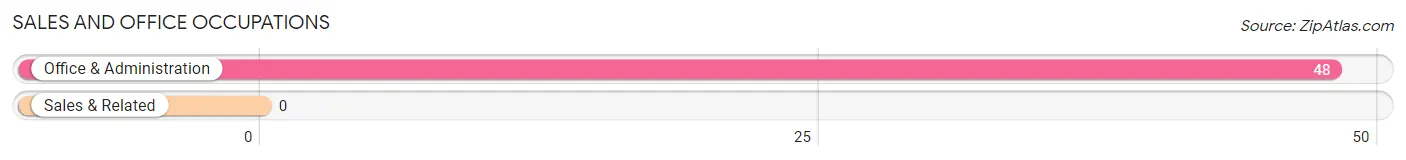
Sales and Office Occupations by Sex

| Occupation | Male | Female |
| Sales & Related | 0 (0.0%) | 0 (0.0%) |
| Office & Administration | 0 (0.0%) | 48 (100.0%) |
| Total (Category) | 0 (0.0%) | 48 (100.0%) |
| Total (Overall) | 143 (47.0%) | 161 (53.0%) |
Natural Resources, Construction and Maintenance Occupations
The most common Natural Resources, Construction and Maintenance occupations in North Walpole are , and Construction & Extraction (8 | 2.6%).
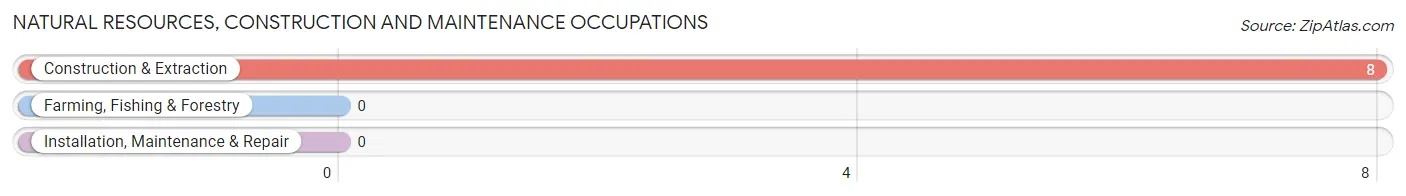
Natural Resources, Construction and Maintenance Occupations by Sex

| Occupation | Male | Female |
| Farming, Fishing & Forestry | 0 (0.0%) | 0 (0.0%) |
| Construction & Extraction | 8 (100.0%) | 0 (0.0%) |
| Installation, Maintenance & Repair | 0 (0.0%) | 0 (0.0%) |
| Total (Category) | 8 (100.0%) | 0 (0.0%) |
| Total (Overall) | 143 (47.0%) | 161 (53.0%) |
Production, Transportation and Moving Occupations
The most common Production, Transportation and Moving occupations in North Walpole are Production (35 | 11.5%), and Material Moving (4 | 1.3%).
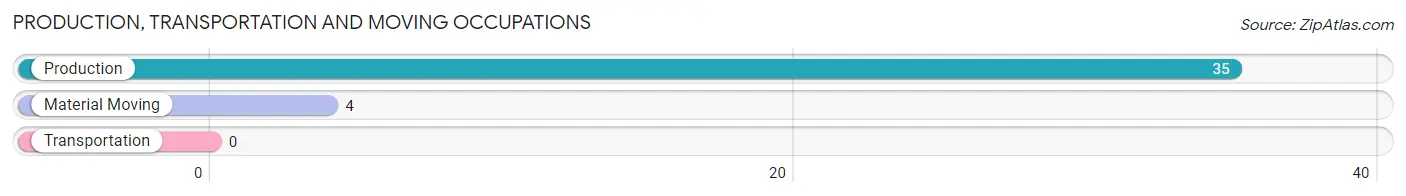
Production, Transportation and Moving Occupations by Sex
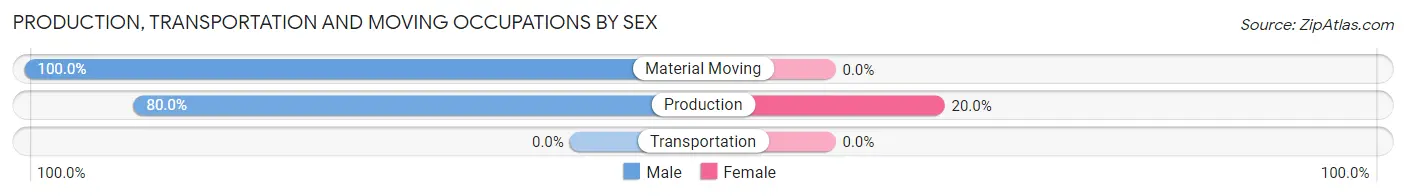
| Occupation | Male | Female |
| Production | 28 (80.0%) | 7 (20.0%) |
| Transportation | 0 (0.0%) | 0 (0.0%) |
| Material Moving | 4 (100.0%) | 0 (0.0%) |
| Total (Category) | 32 (82.1%) | 7 (17.9%) |
| Total (Overall) | 143 (47.0%) | 161 (53.0%) |
Employment Industries by Sex in North Walpole
Employment Industries in North Walpole
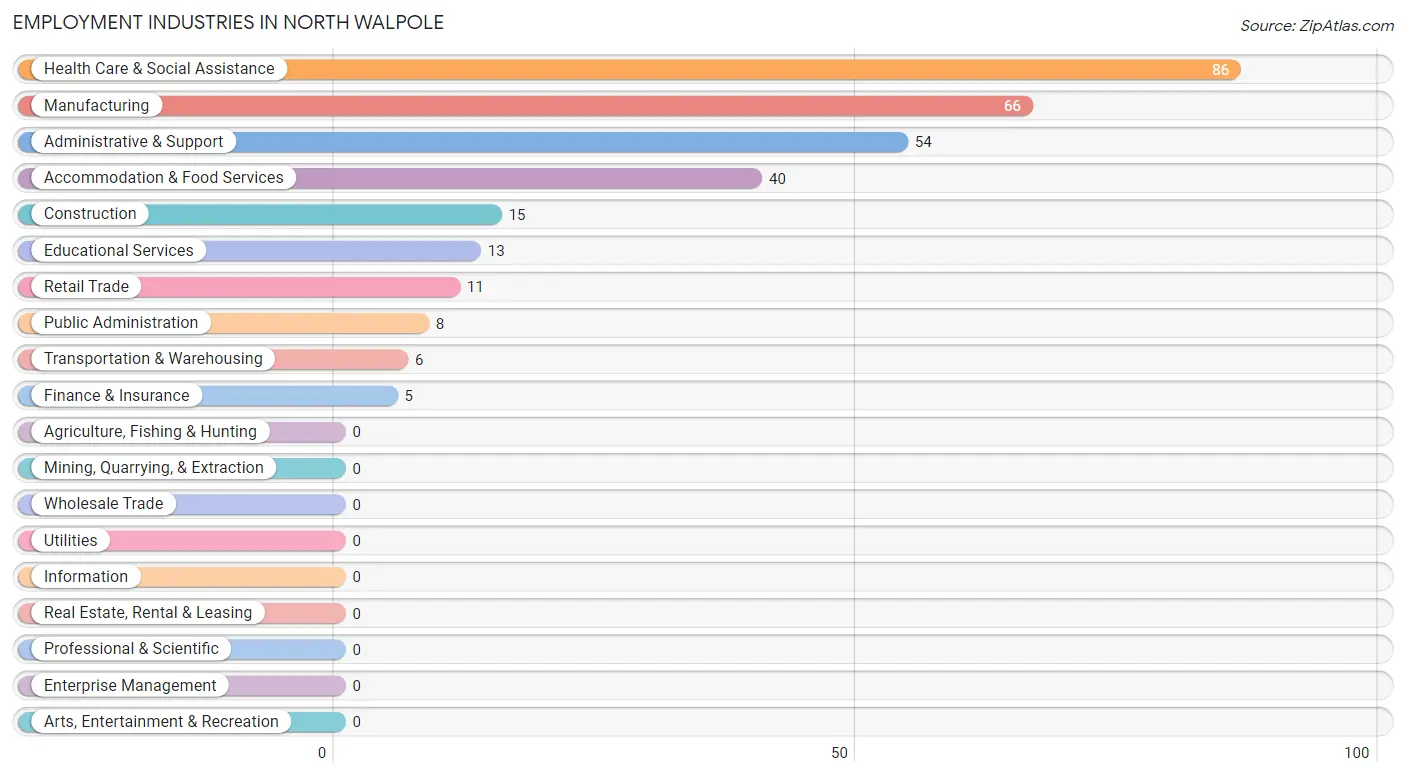
The major employment industries in North Walpole include Health Care & Social Assistance (86 | 28.3%), Manufacturing (66 | 21.7%), Administrative & Support (54 | 17.8%), Accommodation & Food Services (40 | 13.2%), and Construction (15 | 4.9%).
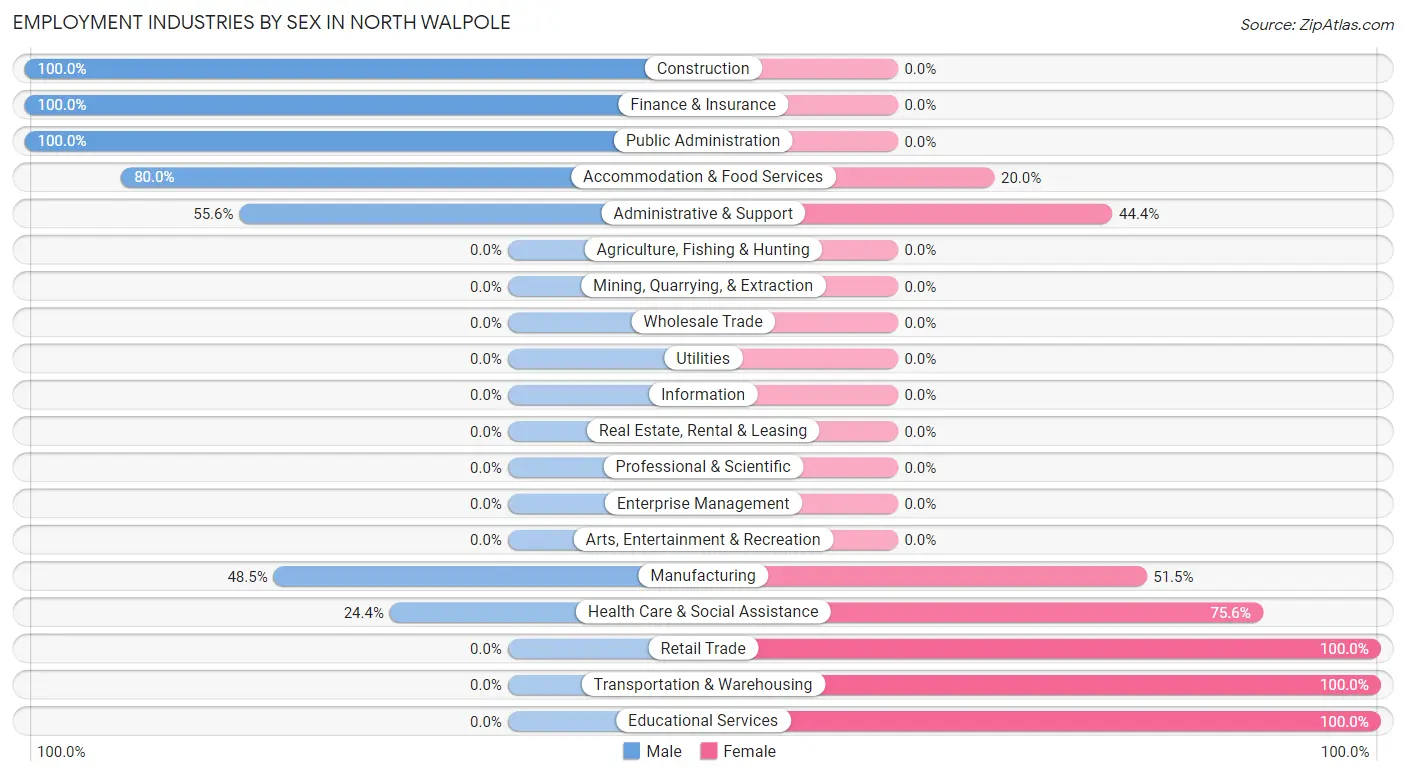
Employment Industries by Sex in North Walpole
The North Walpole industries that see more men than women are Construction (100.0%), Finance & Insurance (100.0%), and Public Administration (100.0%), whereas the industries that tend to have a higher number of women are Retail Trade (100.0%), Transportation & Warehousing (100.0%), and Educational Services (100.0%).
| Industry | Male | Female |
| Agriculture, Fishing & Hunting | 0 (0.0%) | 0 (0.0%) |
| Mining, Quarrying, & Extraction | 0 (0.0%) | 0 (0.0%) |
| Construction | 15 (100.0%) | 0 (0.0%) |
| Manufacturing | 32 (48.5%) | 34 (51.5%) |
| Wholesale Trade | 0 (0.0%) | 0 (0.0%) |
| Retail Trade | 0 (0.0%) | 11 (100.0%) |
| Transportation & Warehousing | 0 (0.0%) | 6 (100.0%) |
| Utilities | 0 (0.0%) | 0 (0.0%) |
| Information | 0 (0.0%) | 0 (0.0%) |
| Finance & Insurance | 5 (100.0%) | 0 (0.0%) |
| Real Estate, Rental & Leasing | 0 (0.0%) | 0 (0.0%) |
| Professional & Scientific | 0 (0.0%) | 0 (0.0%) |
| Enterprise Management | 0 (0.0%) | 0 (0.0%) |
| Administrative & Support | 30 (55.6%) | 24 (44.4%) |
| Educational Services | 0 (0.0%) | 13 (100.0%) |
| Health Care & Social Assistance | 21 (24.4%) | 65 (75.6%) |
| Arts, Entertainment & Recreation | 0 (0.0%) | 0 (0.0%) |
| Accommodation & Food Services | 32 (80.0%) | 8 (20.0%) |
| Public Administration | 8 (100.0%) | 0 (0.0%) |
| Total | 143 (47.0%) | 161 (53.0%) |
Education in North Walpole
School Enrollment in North Walpole
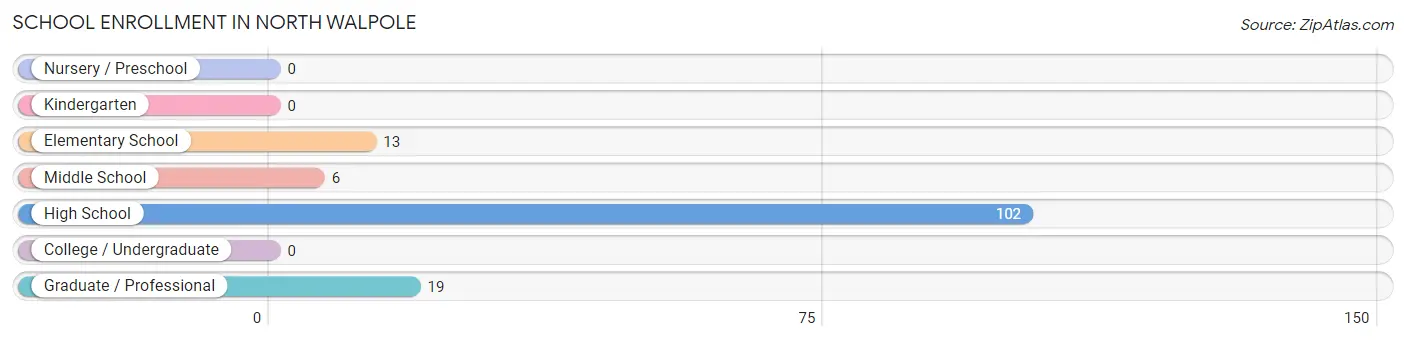
The most common levels of schooling among the 140 students in North Walpole are high school (102 | 72.9%), graduate / professional (19 | 13.6%), and elementary school (13 | 9.3%).
| School Level | # Students | % Students |
| Nursery / Preschool | 0 | 0.0% |
| Kindergarten | 0 | 0.0% |
| Elementary School | 13 | 9.3% |
| Middle School | 6 | 4.3% |
| High School | 102 | 72.9% |
| College / Undergraduate | 0 | 0.0% |
| Graduate / Professional | 19 | 13.6% |
| Total | 140 | 100.0% |
School Enrollment by Age by Funding Source in North Walpole
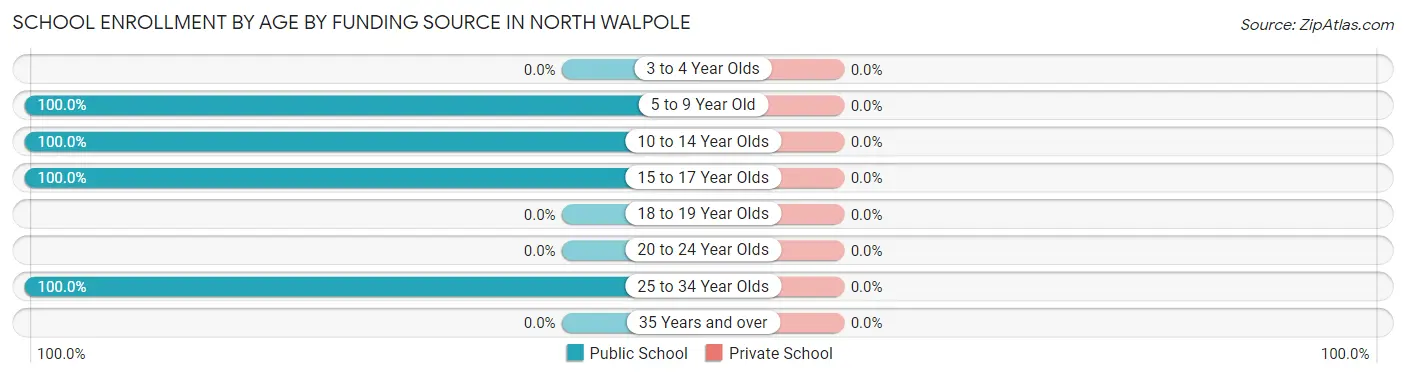
| Age Bracket | Public School | Private School |
| 3 to 4 Year Olds | 0 (0.0%) | 0 (0.0%) |
| 5 to 9 Year Old | 7 (100.0%) | 0 (0.0%) |
| 10 to 14 Year Olds | 12 (100.0%) | 0 (0.0%) |
| 15 to 17 Year Olds | 102 (100.0%) | 0 (0.0%) |
| 18 to 19 Year Olds | 0 (0.0%) | 0 (0.0%) |
| 20 to 24 Year Olds | 0 (0.0%) | 0 (0.0%) |
| 25 to 34 Year Olds | 19 (100.0%) | 0 (0.0%) |
| 35 Years and over | 0 (0.0%) | 0 (0.0%) |
| Total | 140 (100.0%) | 0 (0.0%) |
Educational Attainment by Field of Study in North Walpole
Psychology (32 | 23.9%), business (24 | 17.9%), liberal arts & history (23 | 17.2%), science & technology (16 | 11.9%), and visual & performing arts (14 | 10.4%) are the most common fields of study among 134 individuals in North Walpole who have obtained a bachelor's degree or higher.
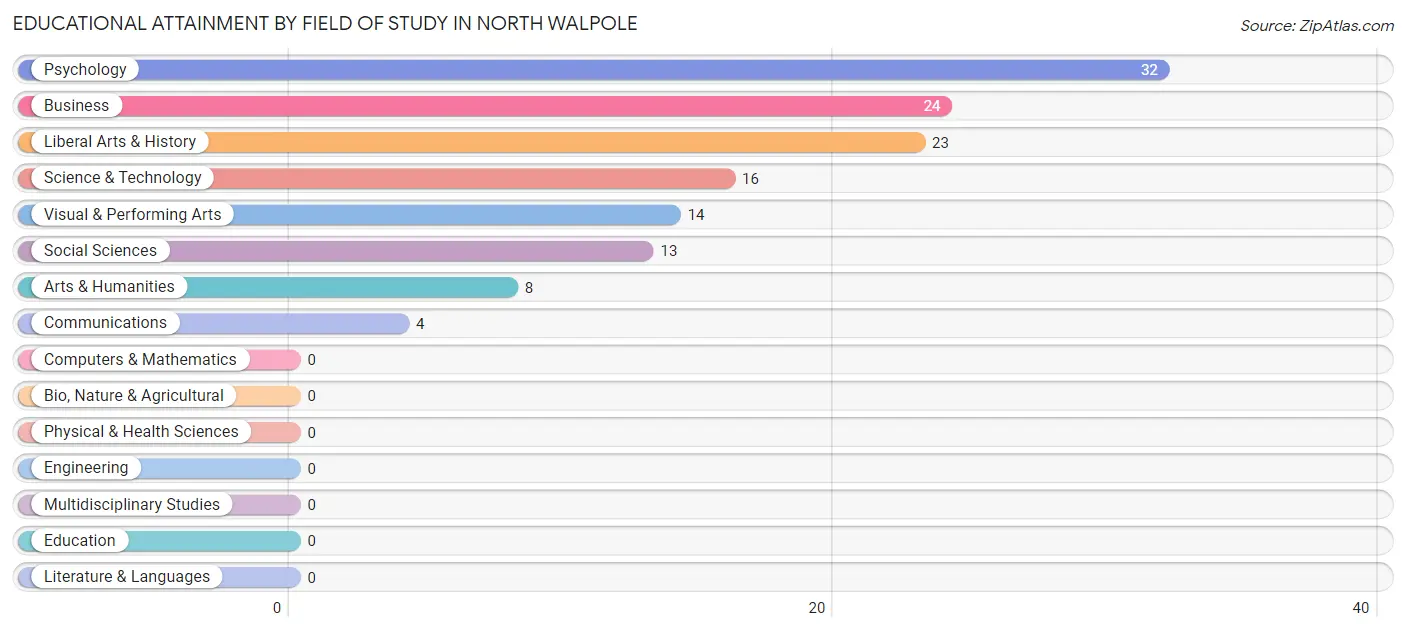
| Field of Study | # Graduates | % Graduates |
| Computers & Mathematics | 0 | 0.0% |
| Bio, Nature & Agricultural | 0 | 0.0% |
| Physical & Health Sciences | 0 | 0.0% |
| Psychology | 32 | 23.9% |
| Social Sciences | 13 | 9.7% |
| Engineering | 0 | 0.0% |
| Multidisciplinary Studies | 0 | 0.0% |
| Science & Technology | 16 | 11.9% |
| Business | 24 | 17.9% |
| Education | 0 | 0.0% |
| Literature & Languages | 0 | 0.0% |
| Liberal Arts & History | 23 | 17.2% |
| Visual & Performing Arts | 14 | 10.4% |
| Communications | 4 | 3.0% |
| Arts & Humanities | 8 | 6.0% |
| Total | 134 | 100.0% |
Transportation & Commute in North Walpole
Vehicle Availability by Sex in North Walpole
The most prevalent vehicle ownership categories in North Walpole are males with 2 vehicles (72, accounting for 50.3%) and females with 2 vehicles (97, making up 44.7%).
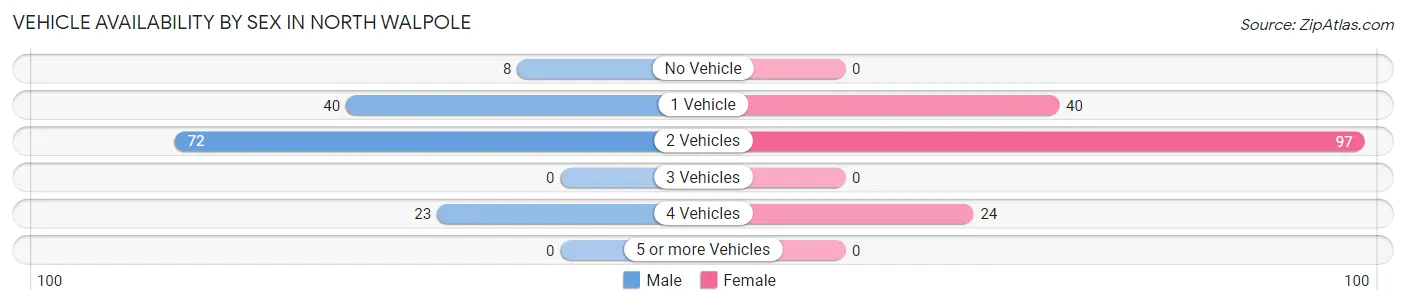
| Vehicles Available | Male | Female |
| No Vehicle | 8 (5.6%) | 0 (0.0%) |
| 1 Vehicle | 40 (28.0%) | 40 (24.8%) |
| 2 Vehicles | 72 (50.3%) | 97 (60.3%) |
| 3 Vehicles | 0 (0.0%) | 0 (0.0%) |
| 4 Vehicles | 23 (16.1%) | 24 (14.9%) |
| 5 or more Vehicles | 0 (0.0%) | 0 (0.0%) |
| Total | 143 (100.0%) | 161 (100.0%) |
Commute Time in North Walpole
The most frequently occuring commute durations in North Walpole are 30 to 34 minutes (69 commuters, 27.4%), 35 to 39 minutes (37 commuters, 14.7%), and 10 to 14 minutes (33 commuters, 13.1%).
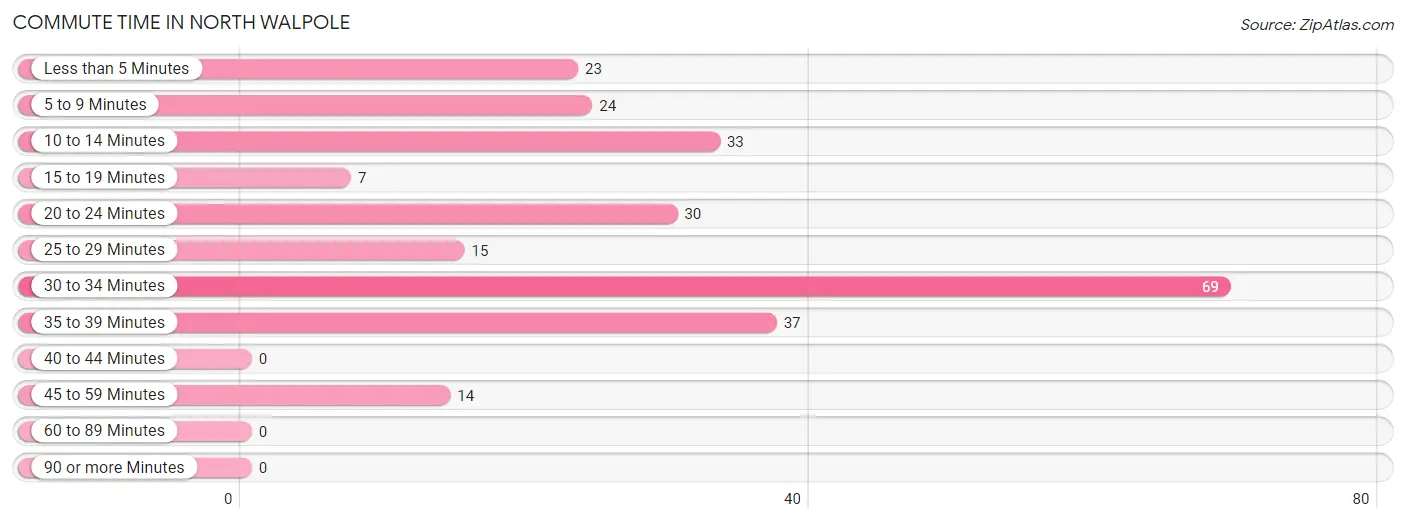
| Commute Time | # Commuters | % Commuters |
| Less than 5 Minutes | 23 | 9.1% |
| 5 to 9 Minutes | 24 | 9.5% |
| 10 to 14 Minutes | 33 | 13.1% |
| 15 to 19 Minutes | 7 | 2.8% |
| 20 to 24 Minutes | 30 | 11.9% |
| 25 to 29 Minutes | 15 | 5.9% |
| 30 to 34 Minutes | 69 | 27.4% |
| 35 to 39 Minutes | 37 | 14.7% |
| 40 to 44 Minutes | 0 | 0.0% |
| 45 to 59 Minutes | 14 | 5.6% |
| 60 to 89 Minutes | 0 | 0.0% |
| 90 or more Minutes | 0 | 0.0% |
Commute Time by Sex in North Walpole
The most common commute times in North Walpole are 30 to 34 minutes (36 commuters, 29.5%) for males and 30 to 34 minutes (33 commuters, 25.4%) for females.
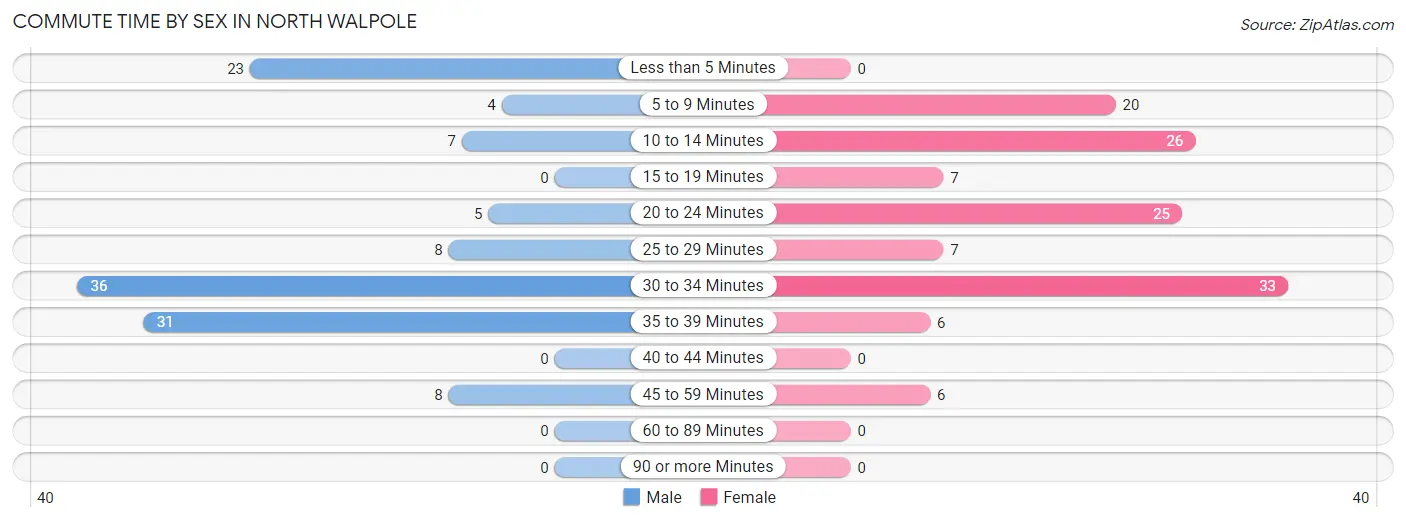
| Commute Time | Male | Female |
| Less than 5 Minutes | 23 (18.9%) | 0 (0.0%) |
| 5 to 9 Minutes | 4 (3.3%) | 20 (15.4%) |
| 10 to 14 Minutes | 7 (5.7%) | 26 (20.0%) |
| 15 to 19 Minutes | 0 (0.0%) | 7 (5.4%) |
| 20 to 24 Minutes | 5 (4.1%) | 25 (19.2%) |
| 25 to 29 Minutes | 8 (6.6%) | 7 (5.4%) |
| 30 to 34 Minutes | 36 (29.5%) | 33 (25.4%) |
| 35 to 39 Minutes | 31 (25.4%) | 6 (4.6%) |
| 40 to 44 Minutes | 0 (0.0%) | 0 (0.0%) |
| 45 to 59 Minutes | 8 (6.6%) | 6 (4.6%) |
| 60 to 89 Minutes | 0 (0.0%) | 0 (0.0%) |
| 90 or more Minutes | 0 (0.0%) | 0 (0.0%) |
Time of Departure to Work by Sex in North Walpole
The most frequent times of departure to work in North Walpole are 7:30 AM to 7:59 AM (50, 41.0%) for males and 7:30 AM to 7:59 AM (39, 30.0%) for females.
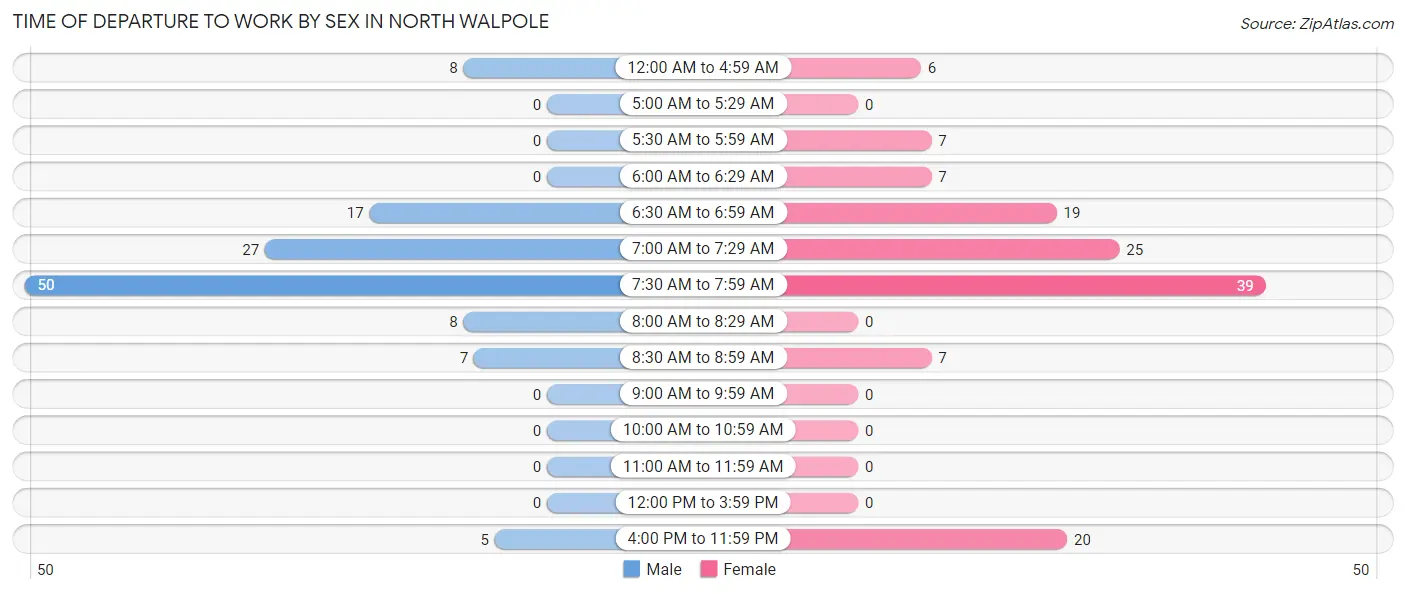
| Time of Departure | Male | Female |
| 12:00 AM to 4:59 AM | 8 (6.6%) | 6 (4.6%) |
| 5:00 AM to 5:29 AM | 0 (0.0%) | 0 (0.0%) |
| 5:30 AM to 5:59 AM | 0 (0.0%) | 7 (5.4%) |
| 6:00 AM to 6:29 AM | 0 (0.0%) | 7 (5.4%) |
| 6:30 AM to 6:59 AM | 17 (13.9%) | 19 (14.6%) |
| 7:00 AM to 7:29 AM | 27 (22.1%) | 25 (19.2%) |
| 7:30 AM to 7:59 AM | 50 (41.0%) | 39 (30.0%) |
| 8:00 AM to 8:29 AM | 8 (6.6%) | 0 (0.0%) |
| 8:30 AM to 8:59 AM | 7 (5.7%) | 7 (5.4%) |
| 9:00 AM to 9:59 AM | 0 (0.0%) | 0 (0.0%) |
| 10:00 AM to 10:59 AM | 0 (0.0%) | 0 (0.0%) |
| 11:00 AM to 11:59 AM | 0 (0.0%) | 0 (0.0%) |
| 12:00 PM to 3:59 PM | 0 (0.0%) | 0 (0.0%) |
| 4:00 PM to 11:59 PM | 5 (4.1%) | 20 (15.4%) |
| Total | 122 (100.0%) | 130 (100.0%) |
Housing Occupancy in North Walpole
Occupancy by Ownership in North Walpole
Of the total 236 dwellings in North Walpole, owner-occupied units account for 158 (66.9%), while renter-occupied units make up 78 (33.1%).
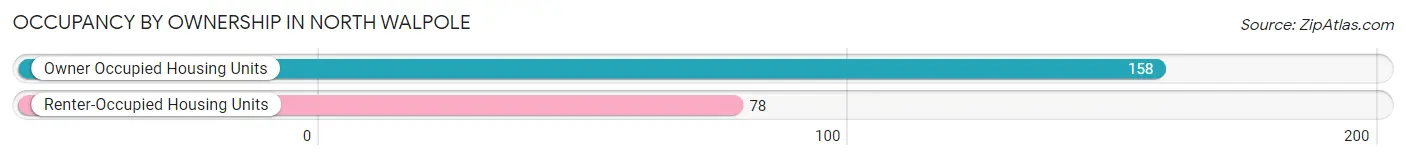
| Occupancy | # Housing Units | % Housing Units |
| Owner Occupied Housing Units | 158 | 66.9% |
| Renter-Occupied Housing Units | 78 | 33.1% |
| Total Occupied Housing Units | 236 | 100.0% |
Occupancy by Household Size in North Walpole
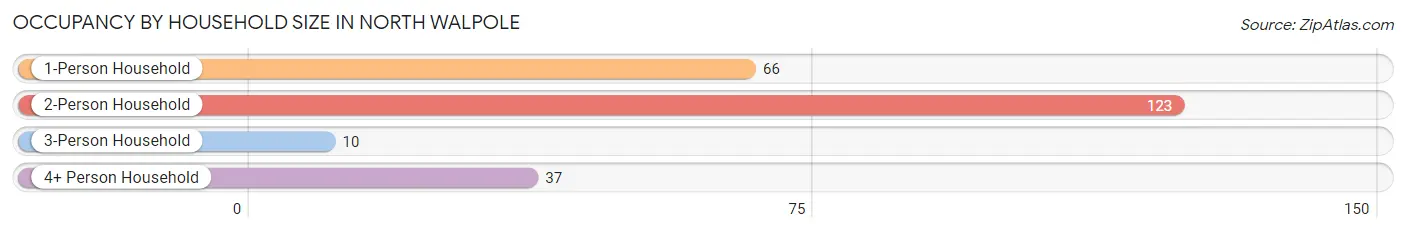
| Household Size | # Housing Units | % Housing Units |
| 1-Person Household | 66 | 28.0% |
| 2-Person Household | 123 | 52.1% |
| 3-Person Household | 10 | 4.2% |
| 4+ Person Household | 37 | 15.7% |
| Total Housing Units | 236 | 100.0% |
Occupancy by Ownership by Household Size in North Walpole
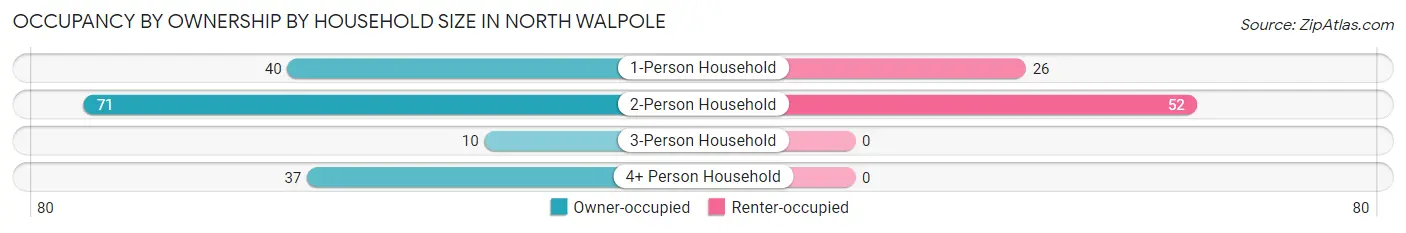
| Household Size | Owner-occupied | Renter-occupied |
| 1-Person Household | 40 (60.6%) | 26 (39.4%) |
| 2-Person Household | 71 (57.7%) | 52 (42.3%) |
| 3-Person Household | 10 (100.0%) | 0 (0.0%) |
| 4+ Person Household | 37 (100.0%) | 0 (0.0%) |
| Total Housing Units | 158 (66.9%) | 78 (33.1%) |
Occupancy by Educational Attainment in North Walpole
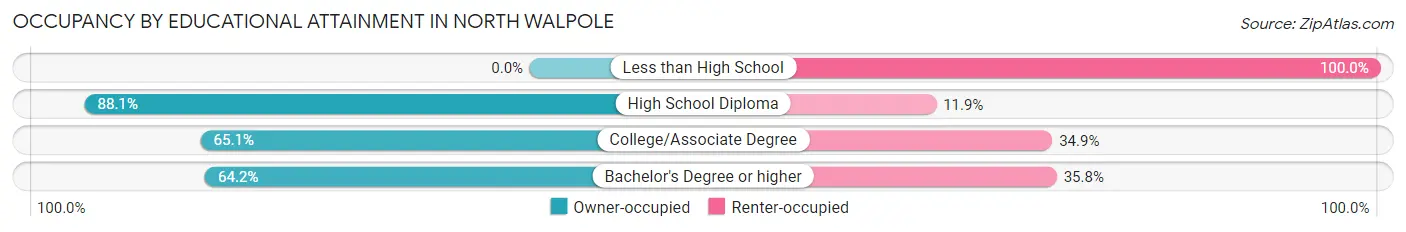
| Household Size | Owner-occupied | Renter-occupied |
| Less than High School | 0 (0.0%) | 7 (100.0%) |
| High School Diploma | 37 (88.1%) | 5 (11.9%) |
| College/Associate Degree | 69 (65.1%) | 37 (34.9%) |
| Bachelor's Degree or higher | 52 (64.2%) | 29 (35.8%) |
Occupancy by Age of Householder in North Walpole
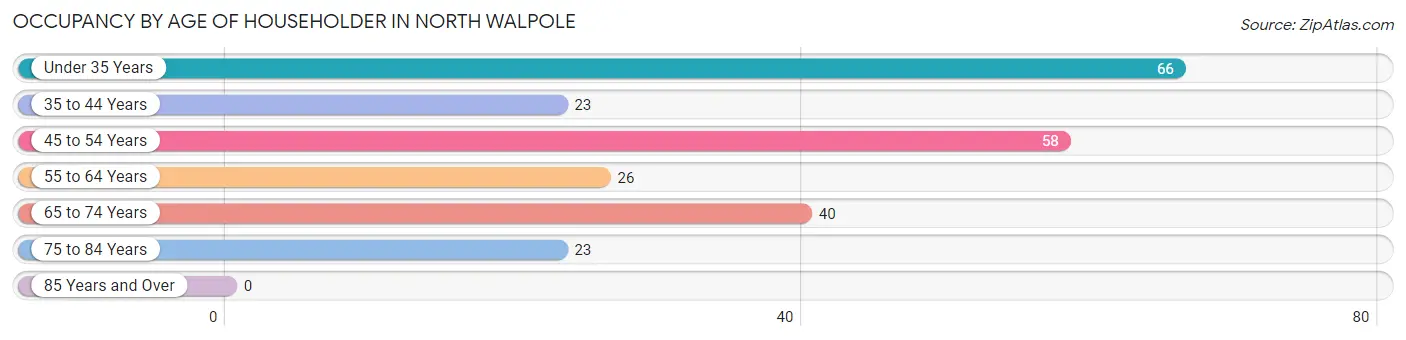
| Age Bracket | # Households | % Households |
| Under 35 Years | 66 | 28.0% |
| 35 to 44 Years | 23 | 9.8% |
| 45 to 54 Years | 58 | 24.6% |
| 55 to 64 Years | 26 | 11.0% |
| 65 to 74 Years | 40 | 17.0% |
| 75 to 84 Years | 23 | 9.8% |
| 85 Years and Over | 0 | 0.0% |
| Total | 236 | 100.0% |
Housing Finances in North Walpole
Median Income by Occupancy in North Walpole
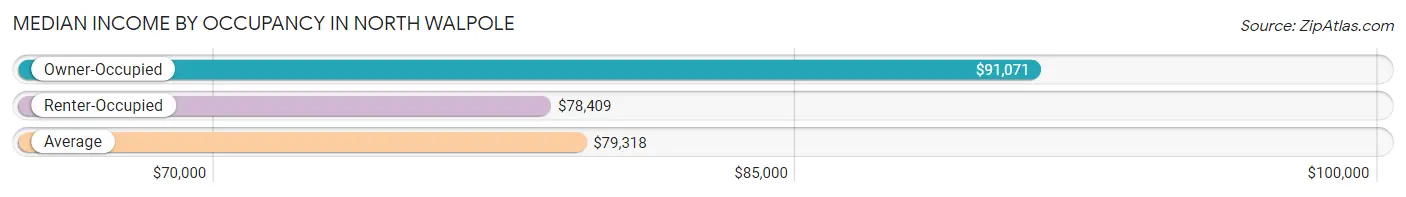
| Occupancy Type | # Households | Median Income |
| Owner-Occupied | 158 (66.9%) | $91,071 |
| Renter-Occupied | 78 (33.1%) | $78,409 |
| Average | 236 (100.0%) | $79,318 |
Occupancy by Householder Income Bracket in North Walpole
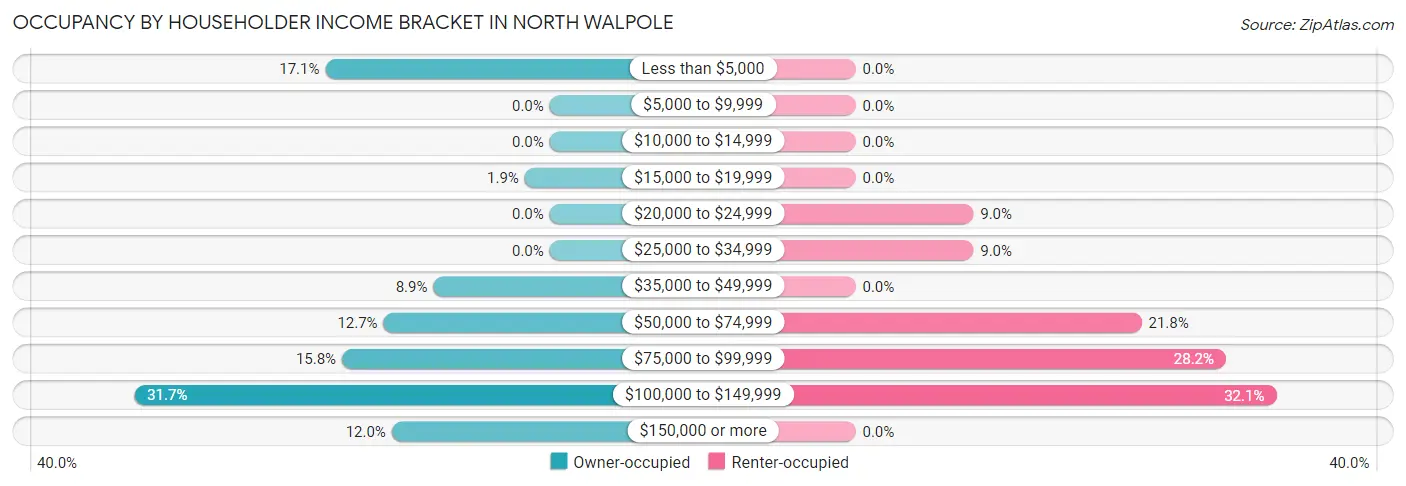
| Income Bracket | Owner-occupied | Renter-occupied |
| Less than $5,000 | 27 (17.1%) | 0 (0.0%) |
| $5,000 to $9,999 | 0 (0.0%) | 0 (0.0%) |
| $10,000 to $14,999 | 0 (0.0%) | 0 (0.0%) |
| $15,000 to $19,999 | 3 (1.9%) | 0 (0.0%) |
| $20,000 to $24,999 | 0 (0.0%) | 7 (9.0%) |
| $25,000 to $34,999 | 0 (0.0%) | 7 (9.0%) |
| $35,000 to $49,999 | 14 (8.9%) | 0 (0.0%) |
| $50,000 to $74,999 | 20 (12.7%) | 17 (21.8%) |
| $75,000 to $99,999 | 25 (15.8%) | 22 (28.2%) |
| $100,000 to $149,999 | 50 (31.7%) | 25 (32.1%) |
| $150,000 or more | 19 (12.0%) | 0 (0.0%) |
| Total | 158 (100.0%) | 78 (100.0%) |
Monthly Housing Cost Tiers in North Walpole
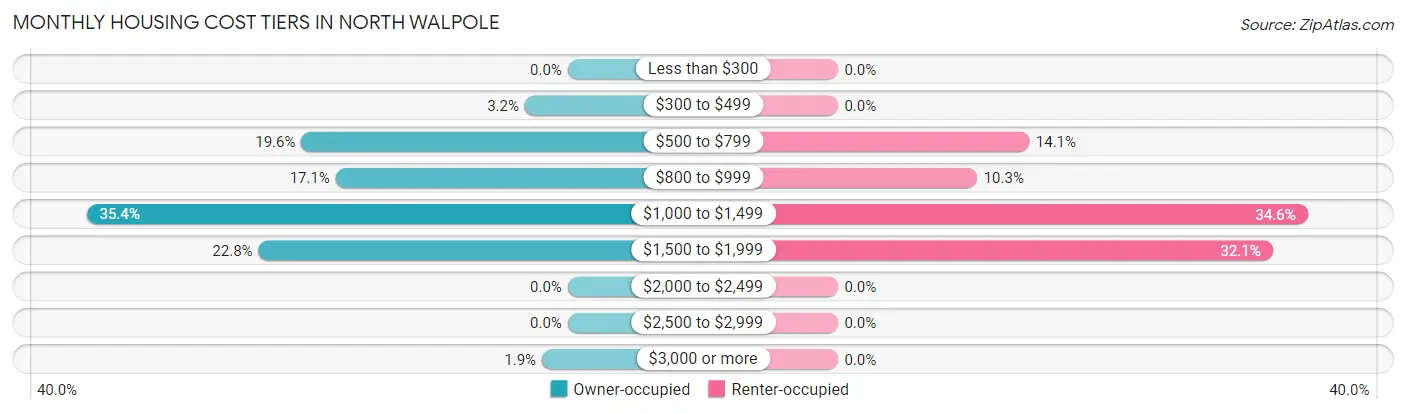
| Monthly Cost | Owner-occupied | Renter-occupied |
| Less than $300 | 0 (0.0%) | 0 (0.0%) |
| $300 to $499 | 5 (3.2%) | 0 (0.0%) |
| $500 to $799 | 31 (19.6%) | 11 (14.1%) |
| $800 to $999 | 27 (17.1%) | 8 (10.3%) |
| $1,000 to $1,499 | 56 (35.4%) | 27 (34.6%) |
| $1,500 to $1,999 | 36 (22.8%) | 25 (32.1%) |
| $2,000 to $2,499 | 0 (0.0%) | 0 (0.0%) |
| $2,500 to $2,999 | 0 (0.0%) | 0 (0.0%) |
| $3,000 or more | 3 (1.9%) | 0 (0.0%) |
| Total | 158 (100.0%) | 78 (100.0%) |
Physical Housing Characteristics in North Walpole
Housing Structures in North Walpole
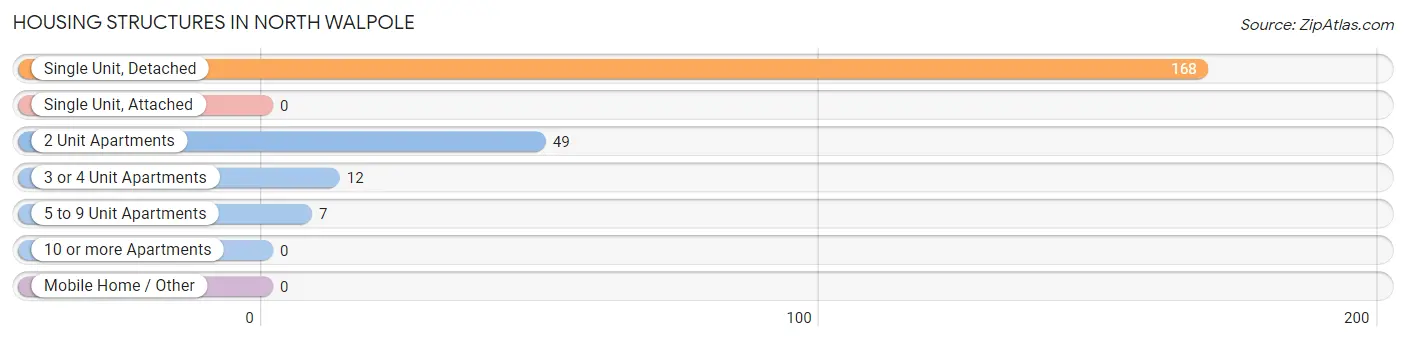
| Structure Type | # Housing Units | % Housing Units |
| Single Unit, Detached | 168 | 71.2% |
| Single Unit, Attached | 0 | 0.0% |
| 2 Unit Apartments | 49 | 20.8% |
| 3 or 4 Unit Apartments | 12 | 5.1% |
| 5 to 9 Unit Apartments | 7 | 3.0% |
| 10 or more Apartments | 0 | 0.0% |
| Mobile Home / Other | 0 | 0.0% |
| Total | 236 | 100.0% |
Housing Structures by Occupancy in North Walpole
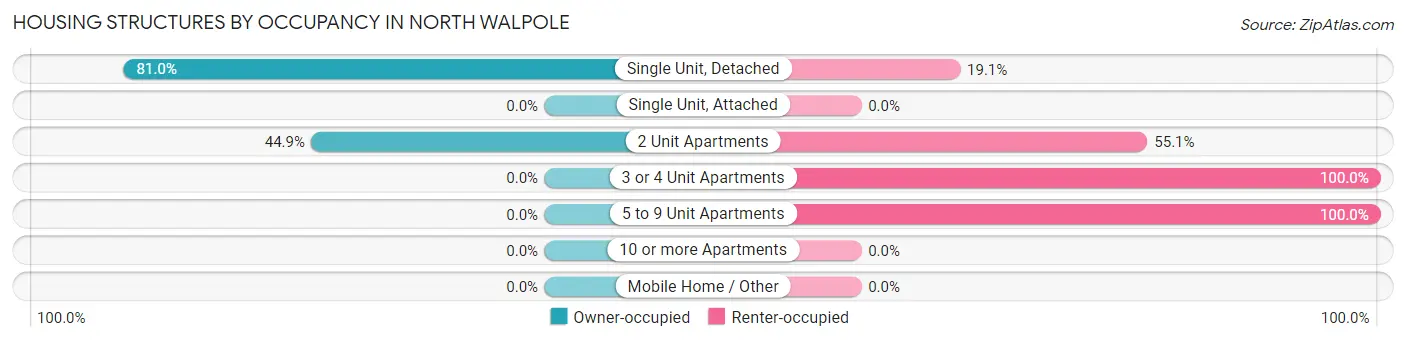
| Structure Type | Owner-occupied | Renter-occupied |
| Single Unit, Detached | 136 (80.9%) | 32 (19.1%) |
| Single Unit, Attached | 0 (0.0%) | 0 (0.0%) |
| 2 Unit Apartments | 22 (44.9%) | 27 (55.1%) |
| 3 or 4 Unit Apartments | 0 (0.0%) | 12 (100.0%) |
| 5 to 9 Unit Apartments | 0 (0.0%) | 7 (100.0%) |
| 10 or more Apartments | 0 (0.0%) | 0 (0.0%) |
| Mobile Home / Other | 0 (0.0%) | 0 (0.0%) |
| Total | 158 (66.9%) | 78 (33.1%) |
Housing Structures by Number of Rooms in North Walpole
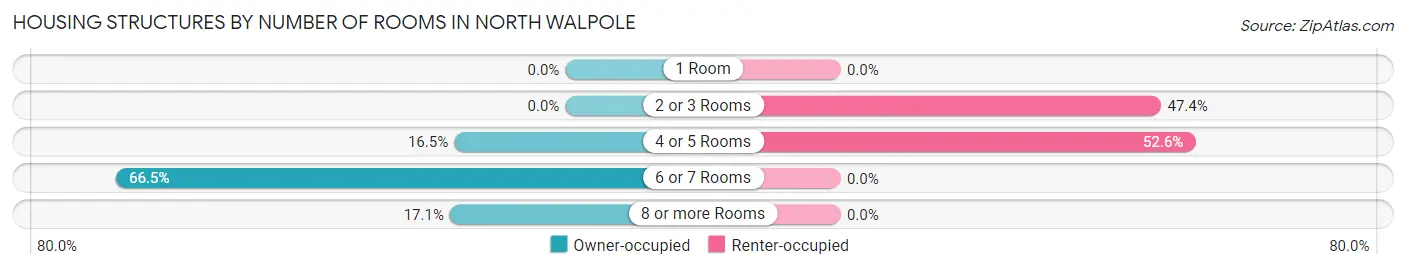
| Number of Rooms | Owner-occupied | Renter-occupied |
| 1 Room | 0 (0.0%) | 0 (0.0%) |
| 2 or 3 Rooms | 0 (0.0%) | 37 (47.4%) |
| 4 or 5 Rooms | 26 (16.5%) | 41 (52.6%) |
| 6 or 7 Rooms | 105 (66.5%) | 0 (0.0%) |
| 8 or more Rooms | 27 (17.1%) | 0 (0.0%) |
| Total | 158 (100.0%) | 78 (100.0%) |
Housing Structure by Heating Type in North Walpole
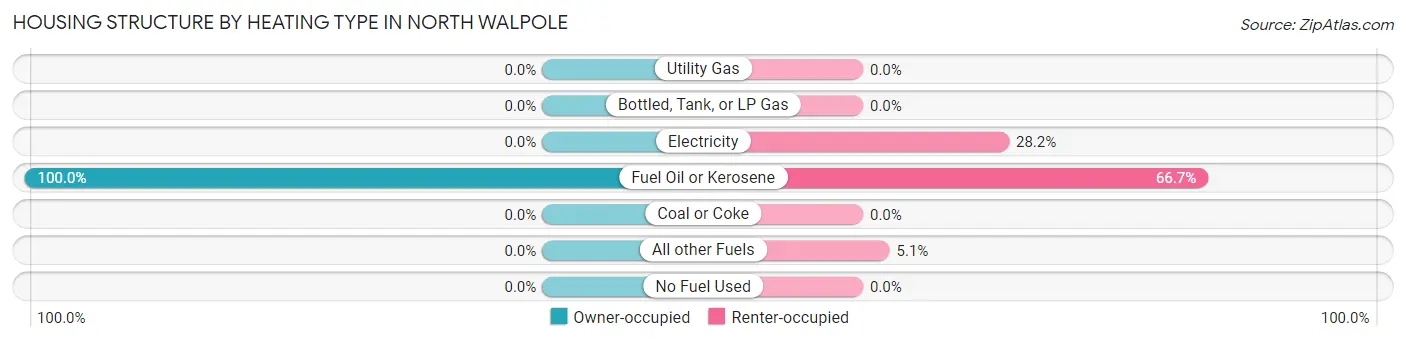
| Heating Type | Owner-occupied | Renter-occupied |
| Utility Gas | 0 (0.0%) | 0 (0.0%) |
| Bottled, Tank, or LP Gas | 0 (0.0%) | 0 (0.0%) |
| Electricity | 0 (0.0%) | 22 (28.2%) |
| Fuel Oil or Kerosene | 158 (100.0%) | 52 (66.7%) |
| Coal or Coke | 0 (0.0%) | 0 (0.0%) |
| All other Fuels | 0 (0.0%) | 4 (5.1%) |
| No Fuel Used | 0 (0.0%) | 0 (0.0%) |
| Total | 158 (100.0%) | 78 (100.0%) |
Household Vehicle Usage in North Walpole
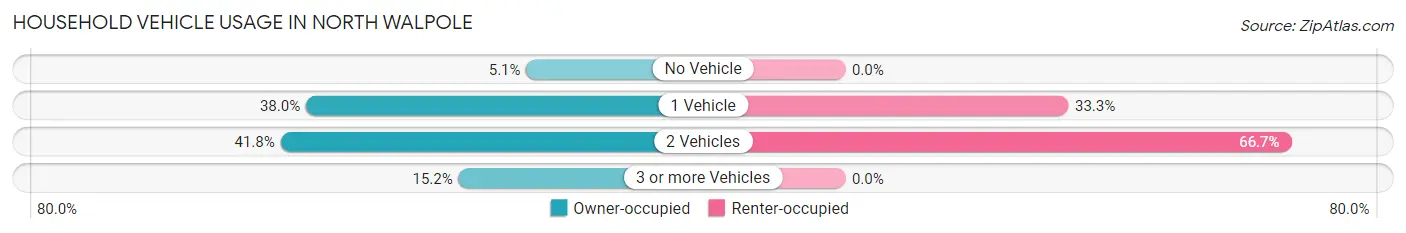
| Vehicles per Household | Owner-occupied | Renter-occupied |
| No Vehicle | 8 (5.1%) | 0 (0.0%) |
| 1 Vehicle | 60 (38.0%) | 26 (33.3%) |
| 2 Vehicles | 66 (41.8%) | 52 (66.7%) |
| 3 or more Vehicles | 24 (15.2%) | 0 (0.0%) |
| Total | 158 (100.0%) | 78 (100.0%) |
Real Estate & Mortgages in North Walpole
Real Estate and Mortgage Overview in North Walpole
| Characteristic | Without Mortgage | With Mortgage |
| Housing Units | 63 | 95 |
| Median Property Value | $253,800 | $167,300 |
| Median Household Income | - | - |
| Monthly Housing Costs | $781 | $3 |
| Real Estate Taxes | $4,540 | $6 |
Property Value by Mortgage Status in North Walpole
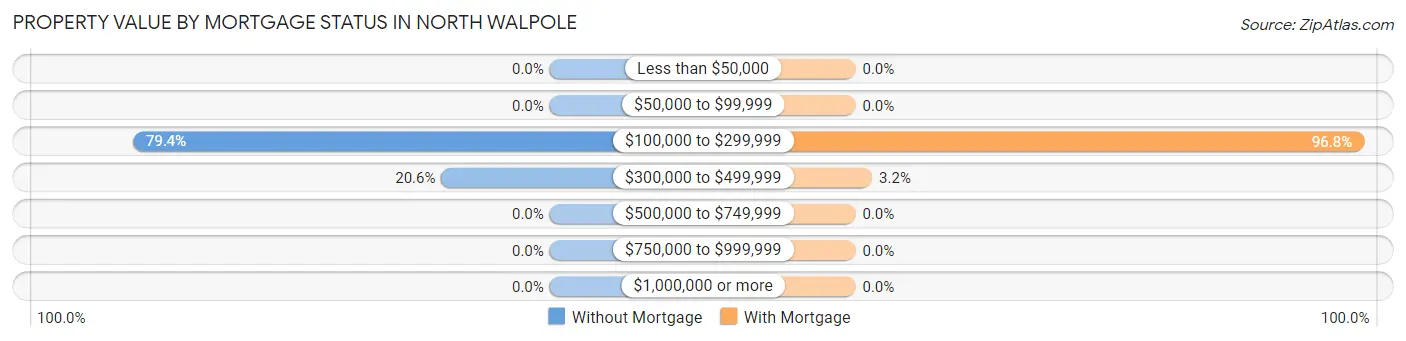
| Property Value | Without Mortgage | With Mortgage |
| Less than $50,000 | 0 (0.0%) | 0 (0.0%) |
| $50,000 to $99,999 | 0 (0.0%) | 0 (0.0%) |
| $100,000 to $299,999 | 50 (79.4%) | 92 (96.8%) |
| $300,000 to $499,999 | 13 (20.6%) | 3 (3.2%) |
| $500,000 to $749,999 | 0 (0.0%) | 0 (0.0%) |
| $750,000 to $999,999 | 0 (0.0%) | 0 (0.0%) |
| $1,000,000 or more | 0 (0.0%) | 0 (0.0%) |
| Total | 63 (100.0%) | 95 (100.0%) |
Household Income by Mortgage Status in North Walpole
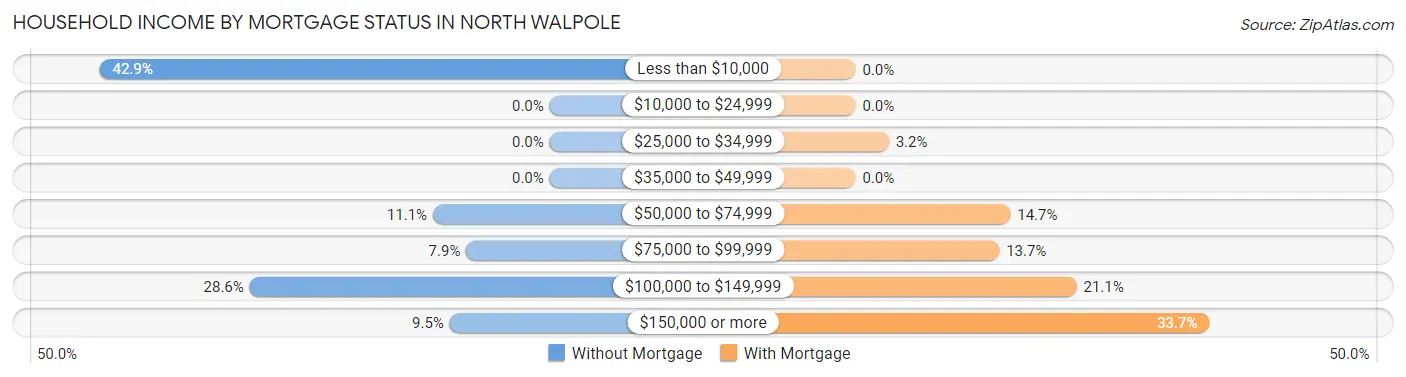
| Household Income | Without Mortgage | With Mortgage |
| Less than $10,000 | 27 (42.9%) | 0 (0.0%) |
| $10,000 to $24,999 | 0 (0.0%) | 0 (0.0%) |
| $25,000 to $34,999 | 0 (0.0%) | 3 (3.2%) |
| $35,000 to $49,999 | 0 (0.0%) | 0 (0.0%) |
| $50,000 to $74,999 | 7 (11.1%) | 14 (14.7%) |
| $75,000 to $99,999 | 5 (7.9%) | 13 (13.7%) |
| $100,000 to $149,999 | 18 (28.6%) | 20 (21.0%) |
| $150,000 or more | 6 (9.5%) | 32 (33.7%) |
| Total | 63 (100.0%) | 95 (100.0%) |
Property Value to Household Income Ratio in North Walpole
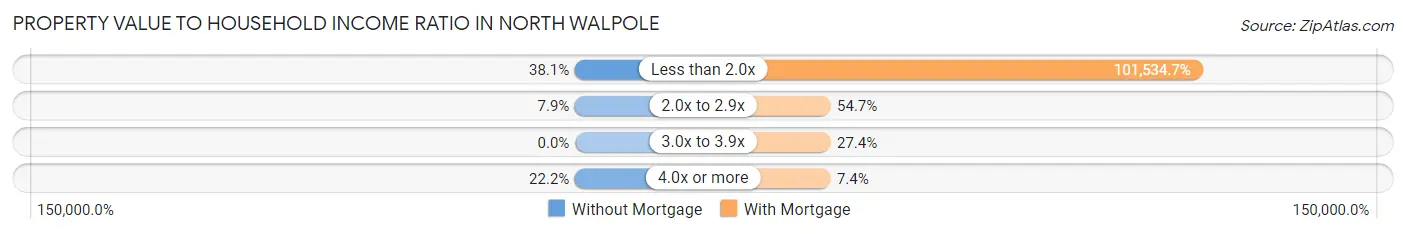
| Value-to-Income Ratio | Without Mortgage | With Mortgage |
| Less than 2.0x | 24 (38.1%) | 96,458 (101,534.7%) |
| 2.0x to 2.9x | 5 (7.9%) | 52 (54.7%) |
| 3.0x to 3.9x | 0 (0.0%) | 26 (27.4%) |
| 4.0x or more | 14 (22.2%) | 7 (7.4%) |
| Total | 63 (100.0%) | 95 (100.0%) |
Real Estate Taxes by Mortgage Status in North Walpole
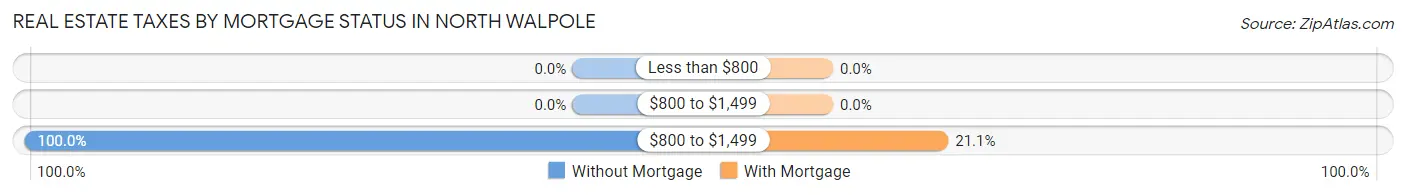
| Property Taxes | Without Mortgage | With Mortgage |
| Less than $800 | 0 (0.0%) | 0 (0.0%) |
| $800 to $1,499 | 0 (0.0%) | 0 (0.0%) |
| $800 to $1,499 | 63 (100.0%) | 20 (21.0%) |
| Total | 63 (100.0%) | 95 (100.0%) |
Health & Disability in North Walpole
Health Insurance Coverage by Age in North Walpole
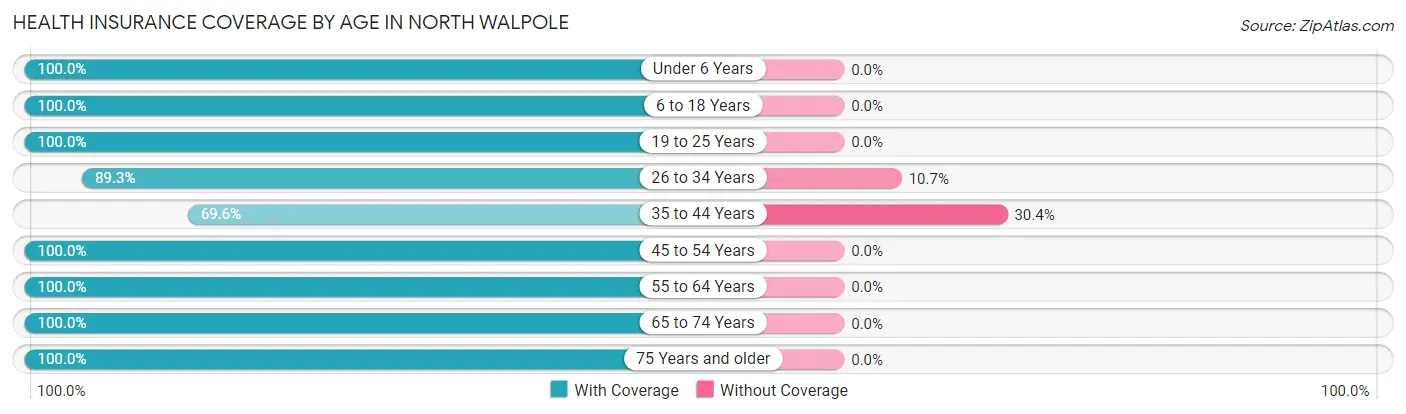
| Age Bracket | With Coverage | Without Coverage |
| Under 6 Years | 8 (100.0%) | 0 (0.0%) |
| 6 to 18 Years | 126 (100.0%) | 0 (0.0%) |
| 19 to 25 Years | 59 (100.0%) | 0 (0.0%) |
| 26 to 34 Years | 75 (89.3%) | 9 (10.7%) |
| 35 to 44 Years | 16 (69.6%) | 7 (30.4%) |
| 45 to 54 Years | 94 (100.0%) | 0 (0.0%) |
| 55 to 64 Years | 60 (100.0%) | 0 (0.0%) |
| 65 to 74 Years | 81 (100.0%) | 0 (0.0%) |
| 75 Years and older | 23 (100.0%) | 0 (0.0%) |
| Total | 542 (97.1%) | 16 (2.9%) |
Health Insurance Coverage by Citizenship Status in North Walpole

| Citizenship Status | With Coverage | Without Coverage |
| Native Born | 8 (100.0%) | 0 (0.0%) |
| Foreign Born, Citizen | 126 (100.0%) | 0 (0.0%) |
| Foreign Born, not a Citizen | 59 (100.0%) | 0 (0.0%) |
Health Insurance Coverage by Household Income in North Walpole
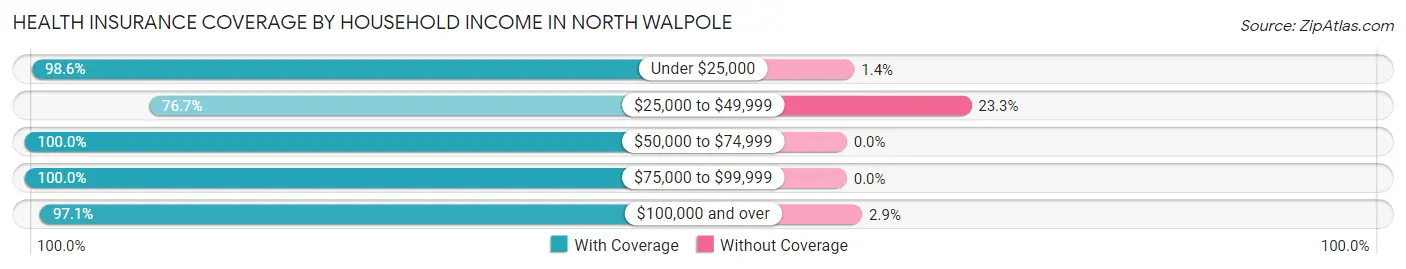
| Household Income | With Coverage | Without Coverage |
| Under $25,000 | 70 (98.6%) | 1 (1.4%) |
| $25,000 to $49,999 | 23 (76.7%) | 7 (23.3%) |
| $50,000 to $74,999 | 86 (100.0%) | 0 (0.0%) |
| $75,000 to $99,999 | 93 (100.0%) | 0 (0.0%) |
| $100,000 and over | 270 (97.1%) | 8 (2.9%) |
Public vs Private Health Insurance Coverage by Age in North Walpole
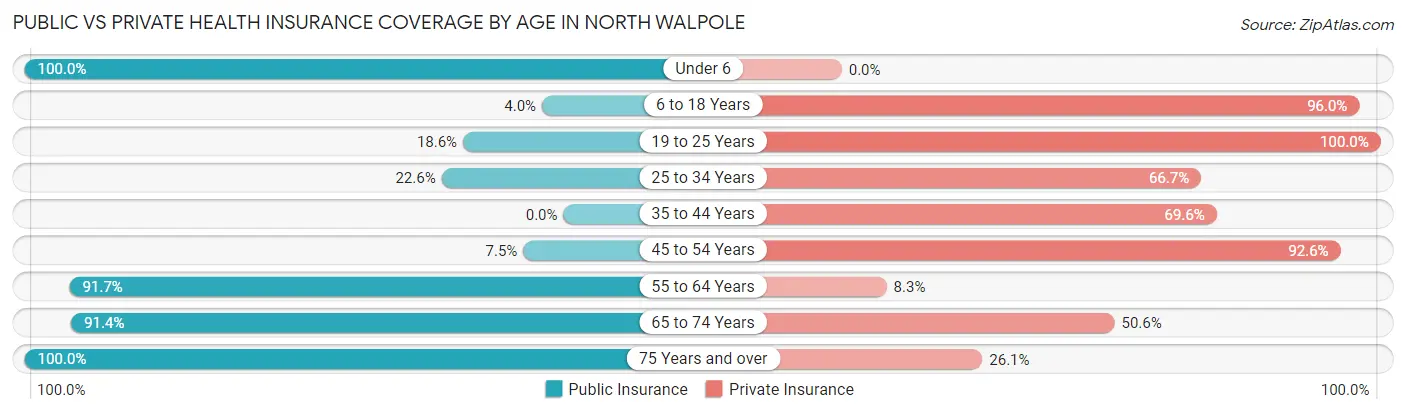
| Age Bracket | Public Insurance | Private Insurance |
| Under 6 | 8 (100.0%) | 0 (0.0%) |
| 6 to 18 Years | 5 (4.0%) | 121 (96.0%) |
| 19 to 25 Years | 11 (18.6%) | 59 (100.0%) |
| 25 to 34 Years | 19 (22.6%) | 56 (66.7%) |
| 35 to 44 Years | 0 (0.0%) | 16 (69.6%) |
| 45 to 54 Years | 7 (7.4%) | 87 (92.5%) |
| 55 to 64 Years | 55 (91.7%) | 5 (8.3%) |
| 65 to 74 Years | 74 (91.4%) | 41 (50.6%) |
| 75 Years and over | 23 (100.0%) | 6 (26.1%) |
| Total | 202 (36.2%) | 391 (70.1%) |
Disability Status by Sex by Age in North Walpole
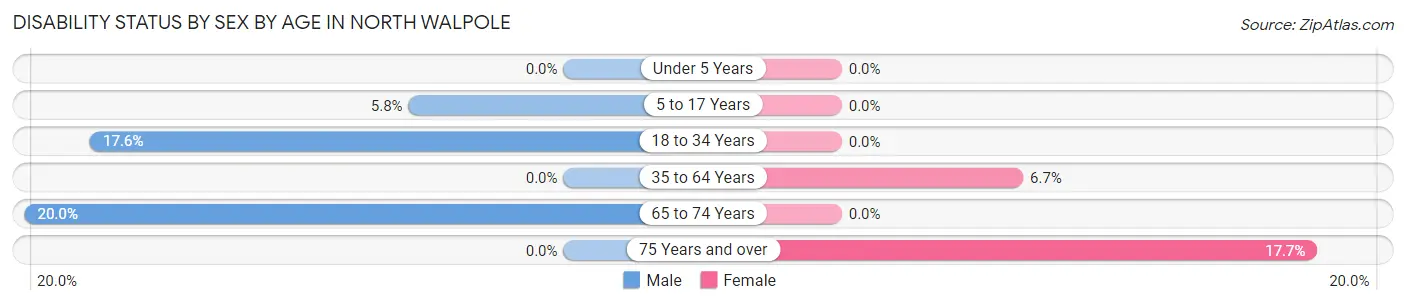
| Age Bracket | Male | Female |
| Under 5 Years | 0 (0.0%) | 0 (0.0%) |
| 5 to 17 Years | 5 (5.8%) | 0 (0.0%) |
| 18 to 34 Years | 13 (17.6%) | 0 (0.0%) |
| 35 to 64 Years | 0 (0.0%) | 7 (6.7%) |
| 65 to 74 Years | 10 (20.0%) | 0 (0.0%) |
| 75 Years and over | 0 (0.0%) | 3 (17.6%) |
Disability Class by Sex by Age in North Walpole
Disability Class: Hearing Difficulty
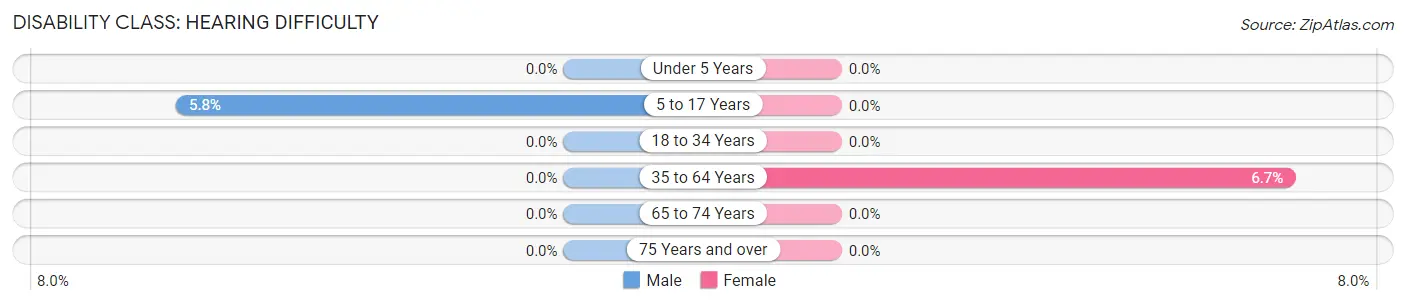
| Age Bracket | Male | Female |
| Under 5 Years | 0 (0.0%) | 0 (0.0%) |
| 5 to 17 Years | 5 (5.8%) | 0 (0.0%) |
| 18 to 34 Years | 0 (0.0%) | 0 (0.0%) |
| 35 to 64 Years | 0 (0.0%) | 7 (6.7%) |
| 65 to 74 Years | 0 (0.0%) | 0 (0.0%) |
| 75 Years and over | 0 (0.0%) | 0 (0.0%) |
Disability Class: Vision Difficulty
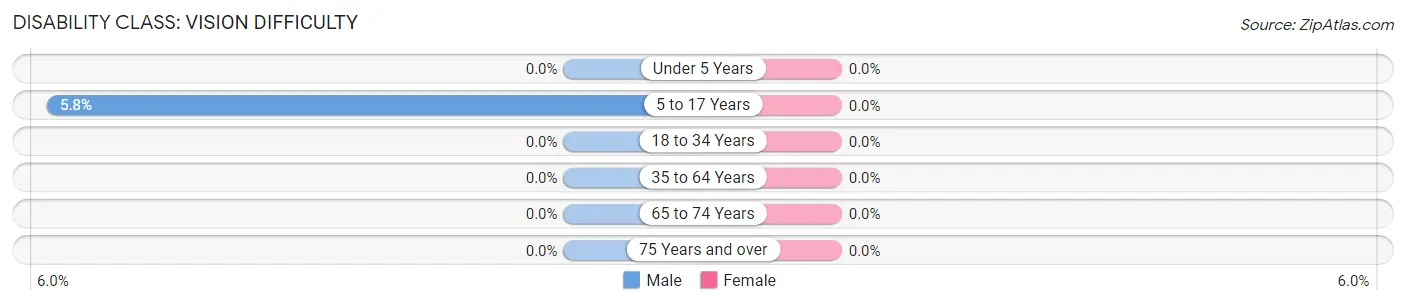
| Age Bracket | Male | Female |
| Under 5 Years | 0 (0.0%) | 0 (0.0%) |
| 5 to 17 Years | 5 (5.8%) | 0 (0.0%) |
| 18 to 34 Years | 0 (0.0%) | 0 (0.0%) |
| 35 to 64 Years | 0 (0.0%) | 0 (0.0%) |
| 65 to 74 Years | 0 (0.0%) | 0 (0.0%) |
| 75 Years and over | 0 (0.0%) | 0 (0.0%) |
Disability Class: Cognitive Difficulty
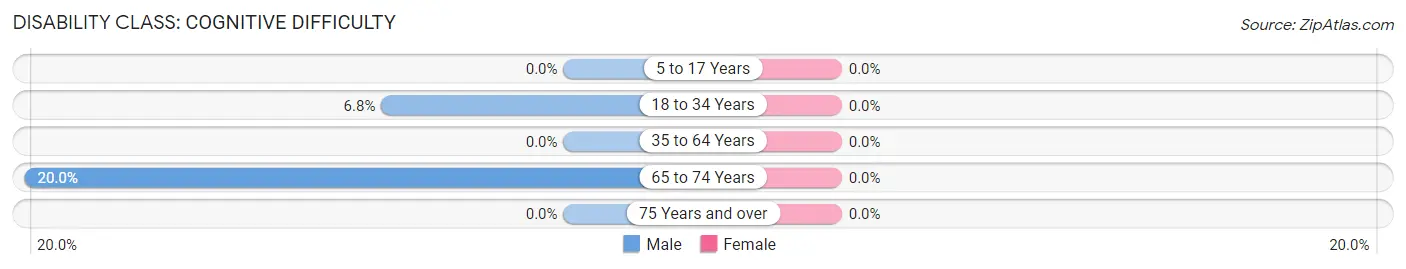
| Age Bracket | Male | Female |
| 5 to 17 Years | 0 (0.0%) | 0 (0.0%) |
| 18 to 34 Years | 5 (6.8%) | 0 (0.0%) |
| 35 to 64 Years | 0 (0.0%) | 0 (0.0%) |
| 65 to 74 Years | 10 (20.0%) | 0 (0.0%) |
| 75 Years and over | 0 (0.0%) | 0 (0.0%) |
Disability Class: Ambulatory Difficulty
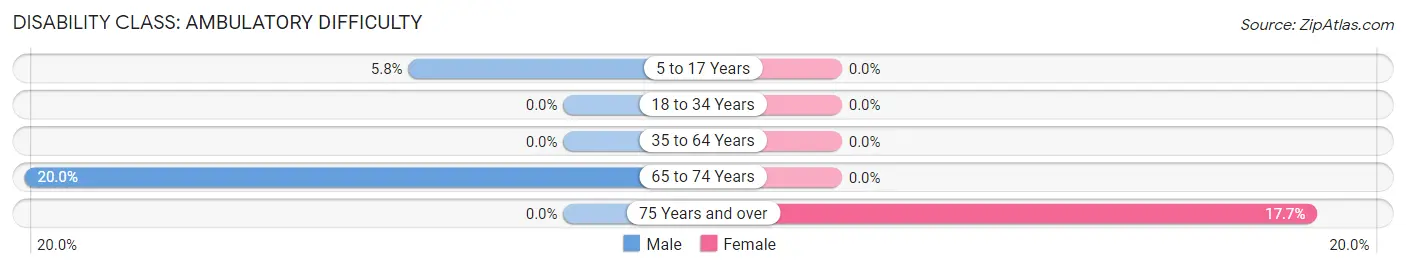
| Age Bracket | Male | Female |
| 5 to 17 Years | 5 (5.8%) | 0 (0.0%) |
| 18 to 34 Years | 0 (0.0%) | 0 (0.0%) |
| 35 to 64 Years | 0 (0.0%) | 0 (0.0%) |
| 65 to 74 Years | 10 (20.0%) | 0 (0.0%) |
| 75 Years and over | 0 (0.0%) | 3 (17.6%) |
Disability Class: Self-Care Difficulty
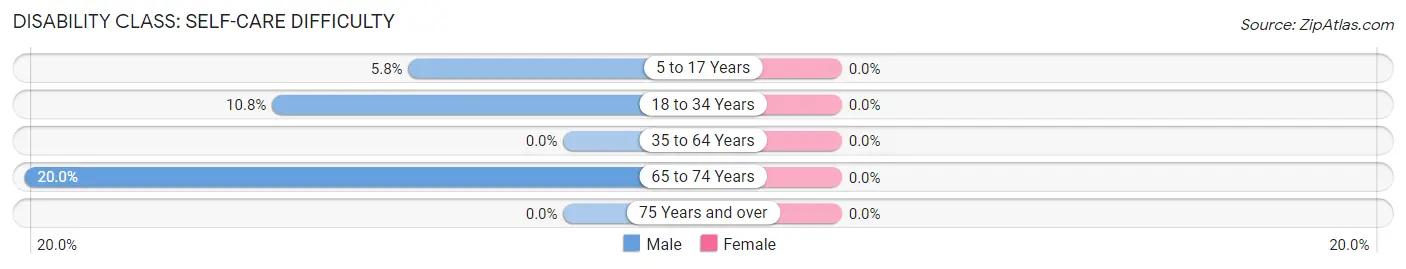
| Age Bracket | Male | Female |
| 5 to 17 Years | 5 (5.8%) | 0 (0.0%) |
| 18 to 34 Years | 8 (10.8%) | 0 (0.0%) |
| 35 to 64 Years | 0 (0.0%) | 0 (0.0%) |
| 65 to 74 Years | 10 (20.0%) | 0 (0.0%) |
| 75 Years and over | 0 (0.0%) | 0 (0.0%) |
Technology Access in North Walpole
Computing Device Access in North Walpole
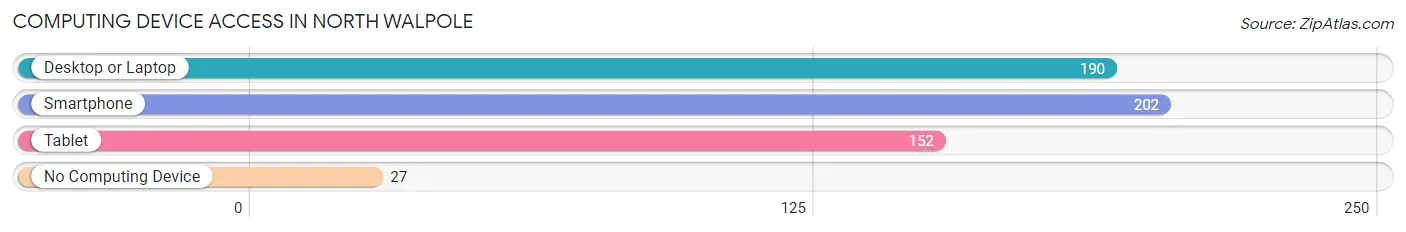
| Device Type | # Households | % Households |
| Desktop or Laptop | 190 | 80.5% |
| Smartphone | 202 | 85.6% |
| Tablet | 152 | 64.4% |
| No Computing Device | 27 | 11.4% |
| Total | 236 | 100.0% |
Internet Access in North Walpole
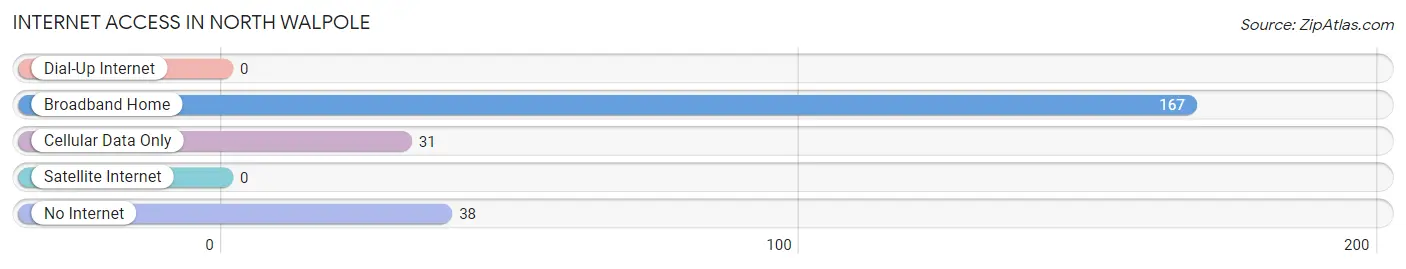
| Internet Type | # Households | % Households |
| Dial-Up Internet | 0 | 0.0% |
| Broadband Home | 167 | 70.8% |
| Cellular Data Only | 31 | 13.1% |
| Satellite Internet | 0 | 0.0% |
| No Internet | 38 | 16.1% |
| Total | 236 | 100.0% |
North Walpole Summary
Walpole, New Hampshire is a small town located in the southwestern corner of the state, near the Vermont border. It is part of the larger town of North Walpole, which also includes the villages of Alstead and Langdon. The town has a population of approximately 2,000 people, and is located in Cheshire County.
History
Walpole was first settled in 1763 by a group of settlers from Massachusetts. The town was originally part of the town of Alstead, but was incorporated as its own town in 1781. The town was named after Sir Robert Walpole, the first Prime Minister of Great Britain.
The town was an important center of industry in the 19th century, with several mills and factories located in the area. The most important of these was the Walpole Manufacturing Company, which was founded in 1845 and produced a variety of products, including woolen goods, paper, and leather. The company was the largest employer in the town for many years, and its products were shipped all over the world.
The town was also home to several other industries, including a sawmill, a gristmill, and a tannery. The town also had a thriving agricultural industry, with dairy farms, apple orchards, and other crops.
Geography
Walpole is located in the southwestern corner of New Hampshire, near the Vermont border. The town is situated in the Connecticut River Valley, and is surrounded by hills and mountains. The town is located in the Connecticut River watershed, and is drained by the North Branch of the Ashuelot River.
The town has a total area of 24.2 square miles, of which 24.1 square miles is land and 0.1 square miles is water. The highest point in the town is the summit of Mount Prospect, which has an elevation of 1,890 feet.
Economy
The economy of Walpole is largely based on agriculture and tourism. The town is home to several dairy farms, apple orchards, and other agricultural operations. The town is also home to several small businesses, including a few restaurants, a general store, and a few other retail establishments.
The town is also a popular tourist destination, with several attractions, including the Walpole Historical Society Museum, the Walpole Grist Mill, and the Walpole Manufacturing Company. The town also hosts several annual events, including the Walpole Fair and the Walpole Apple Festival.
Demographics
As of the 2010 census, the population of Walpole was 2,037. The racial makeup of the town was 97.3% White, 0.4% African American, 0.2% Native American, 0.4% Asian, 0.1% Pacific Islander, 0.3% from other races, and 1.3% from two or more races. Hispanic or Latino of any race were 1.2% of the population.
The median household income in the town was $50,938, and the median family income was $60,938. The per capita income in the town was $25,938. About 8.3% of families and 10.2% of the population were below the poverty line, including 14.2% of those under age 18 and 5.2% of those age 65 or over.
Common Questions
What is Per Capita Income in North Walpole?
Per Capita income in North Walpole is $40,086.
What is the Median Family Income in North Walpole?
Median Family Income in North Walpole is $109,931.
What is the Median Household income in North Walpole?
Median Household Income in North Walpole is $79,318.
What is Income or Wage Gap in North Walpole?
Income or Wage Gap in North Walpole is 17.8%.
Women in North Walpole earn 82.2 cents for every dollar earned by a man.
What is Inequality or Gini Index in North Walpole?
Inequality or Gini Index in North Walpole is 0.37.
What is the Total Population of North Walpole?
Total Population of North Walpole is 558.
What is the Total Male Population of North Walpole?
Total Male Population of North Walpole is 290.
What is the Total Female Population of North Walpole?
Total Female Population of North Walpole is 268.
What is the Ratio of Males per 100 Females in North Walpole?
There are 108.21 Males per 100 Females in North Walpole.
What is the Ratio of Females per 100 Males in North Walpole?
There are 92.41 Females per 100 Males in North Walpole.
What is the Median Population Age in North Walpole?
Median Population Age in North Walpole is 37.4 Years.
What is the Average Family Size in North Walpole
Average Family Size in North Walpole is 3.0 People.
What is the Average Household Size in North Walpole
Average Household Size in North Walpole is 2.4 People.
How Large is the Labor Force in North Walpole?
There are 312 People in the Labor Forcein in North Walpole.
What is the Percentage of People in the Labor Force in North Walpole?
59.3% of People are in the Labor Force in North Walpole.
What is the Unemployment Rate in North Walpole?
Unemployment Rate in North Walpole is 2.6%.