Marlborough, NH Map & Demographics
Marlborough Map
Marlborough Overview
$54,235
PER CAPITA INCOME
$84,000
AVG FAMILY INCOME
$62,950
AVG HOUSEHOLD INCOME
37.7%
WAGE / INCOME GAP [ % ]
62.3¢/ $1
WAGE / INCOME GAP [ $ ]
0.59
INEQUALITY / GINI INDEX
991
TOTAL POPULATION
488
MALE POPULATION
503
FEMALE POPULATION
97.02
MALES / 100 FEMALES
103.07
FEMALES / 100 MALES
50.4
MEDIAN AGE
2.8
AVG FAMILY SIZE
2.0
AVG HOUSEHOLD SIZE
538
LABOR FORCE [ PEOPLE ]
59.4%
PERCENT IN LABOR FORCE
0.7%
UNEMPLOYMENT RATE
Marlborough Zip Codes
Marlborough Area Codes
Income in Marlborough
Income Overview in Marlborough
Per Capita Income in Marlborough is $54,235, while median incomes of families and households are $84,000 and $62,950 respectively.
| Characteristic | Number | Measure |
| Per Capita Income | 991 | $54,235 |
| Median Family Income | 228 | $84,000 |
| Mean Family Income | 228 | $99,684 |
| Median Household Income | 483 | $62,950 |
| Mean Household Income | 483 | $110,362 |
| Income Deficit | 228 | $0 |
| Wage / Income Gap (%) | 991 | 37.65% |
| Wage / Income Gap ($) | 991 | 62.35¢ per $1 |
| Gini / Inequality Index | 991 | 0.59 |
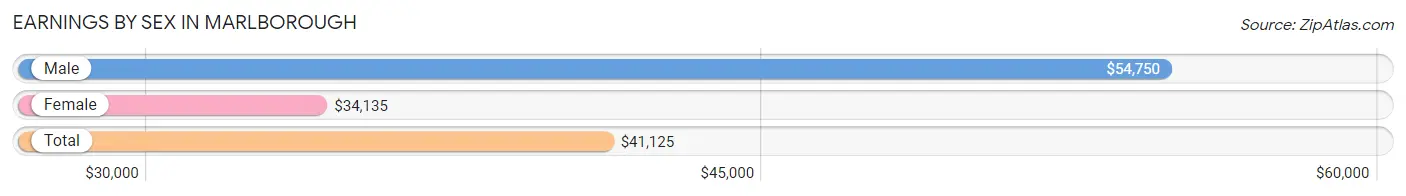
Earnings by Sex in Marlborough
Average Earnings in Marlborough are $41,125, $54,750 for men and $34,135 for women, a difference of 37.7%.
| Sex | Number | Average Earnings |
| Male | 319 (50.5%) | $54,750 |
| Female | 313 (49.5%) | $34,135 |
| Total | 632 (100.0%) | $41,125 |
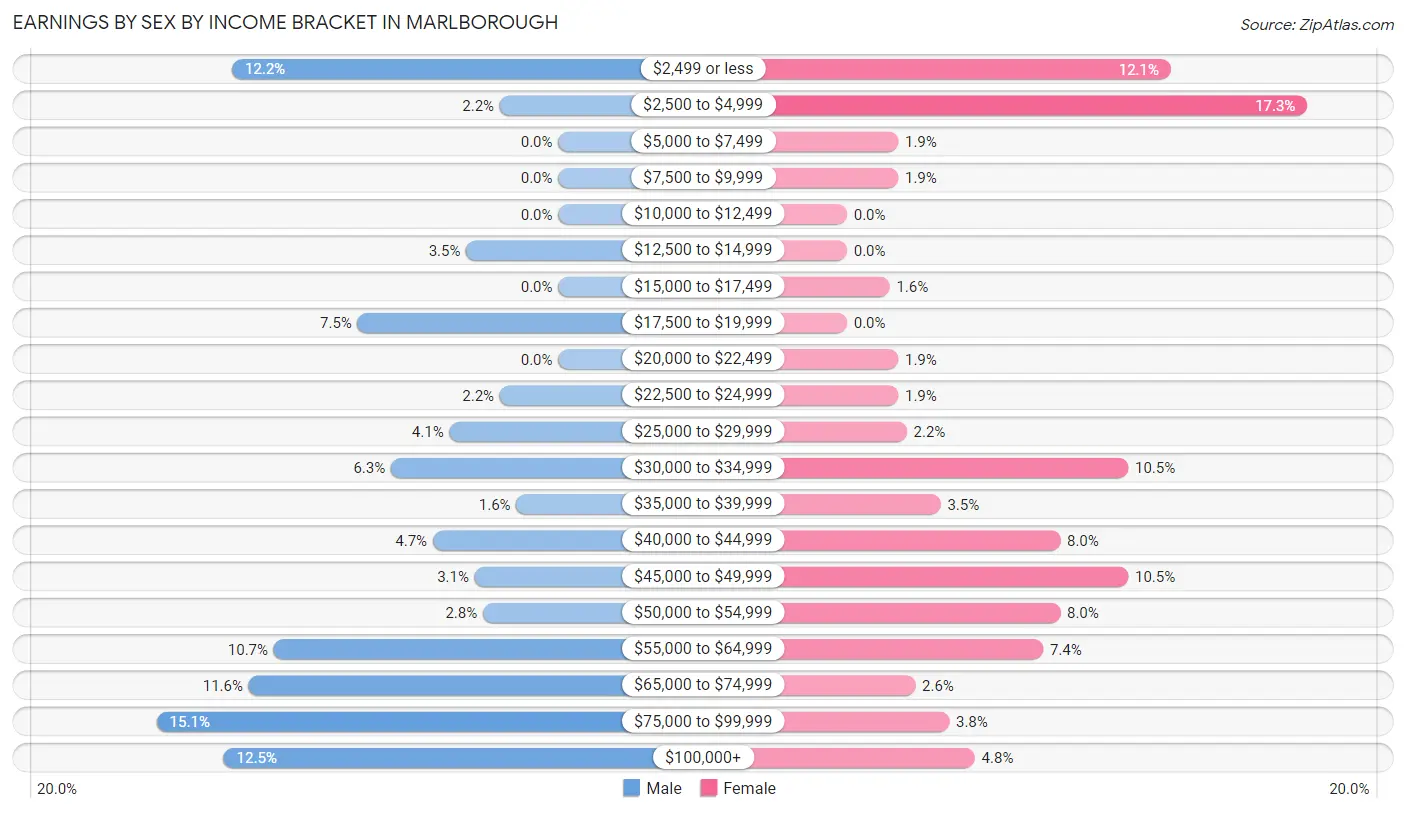
Earnings by Sex by Income Bracket in Marlborough
The most common earnings brackets in Marlborough are $75,000 to $99,999 for men (48 | 15.0%) and $2,500 to $4,999 for women (54 | 17.2%).
| Income | Male | Female |
| $2,499 or less | 39 (12.2%) | 38 (12.1%) |
| $2,500 to $4,999 | 7 (2.2%) | 54 (17.2%) |
| $5,000 to $7,499 | 0 (0.0%) | 6 (1.9%) |
| $7,500 to $9,999 | 0 (0.0%) | 6 (1.9%) |
| $10,000 to $12,499 | 0 (0.0%) | 0 (0.0%) |
| $12,500 to $14,999 | 11 (3.5%) | 0 (0.0%) |
| $15,000 to $17,499 | 0 (0.0%) | 5 (1.6%) |
| $17,500 to $19,999 | 24 (7.5%) | 0 (0.0%) |
| $20,000 to $22,499 | 0 (0.0%) | 6 (1.9%) |
| $22,500 to $24,999 | 7 (2.2%) | 6 (1.9%) |
| $25,000 to $29,999 | 13 (4.1%) | 7 (2.2%) |
| $30,000 to $34,999 | 20 (6.3%) | 33 (10.5%) |
| $35,000 to $39,999 | 5 (1.6%) | 11 (3.5%) |
| $40,000 to $44,999 | 15 (4.7%) | 25 (8.0%) |
| $45,000 to $49,999 | 10 (3.1%) | 33 (10.5%) |
| $50,000 to $54,999 | 9 (2.8%) | 25 (8.0%) |
| $55,000 to $64,999 | 34 (10.7%) | 23 (7.3%) |
| $65,000 to $74,999 | 37 (11.6%) | 8 (2.6%) |
| $75,000 to $99,999 | 48 (15.0%) | 12 (3.8%) |
| $100,000+ | 40 (12.5%) | 15 (4.8%) |
| Total | 319 (100.0%) | 313 (100.0%) |
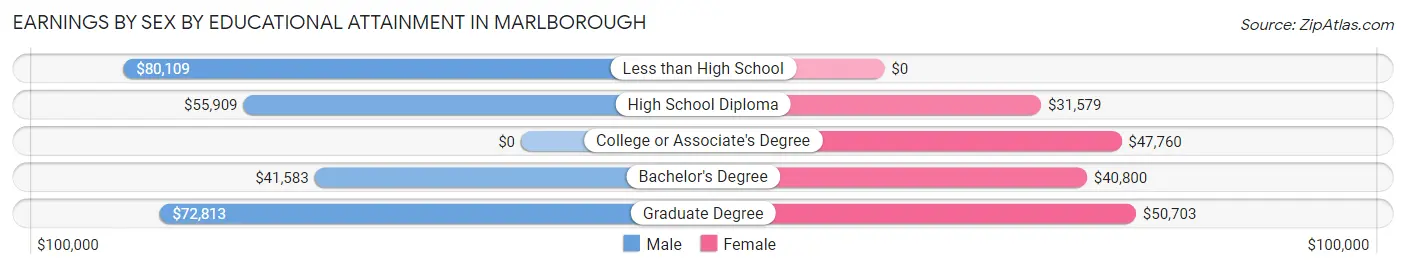
Earnings by Sex by Educational Attainment in Marlborough
Average earnings in Marlborough are $57,396 for men and $41,300 for women, a difference of 28.0%. Men with an educational attainment of less than high school enjoy the highest average annual earnings of $80,109, while those with bachelor's degree education earn the least with $41,583. Women with an educational attainment of graduate degree earn the most with the average annual earnings of $50,703, while those with high school diploma education have the smallest earnings of $31,579.
| Educational Attainment | Male Income | Female Income |
| Less than High School | $80,109 | $0 |
| High School Diploma | $55,909 | $31,579 |
| College or Associate's Degree | - | - |
| Bachelor's Degree | $41,583 | $40,800 |
| Graduate Degree | $72,813 | $50,703 |
| Total | $57,396 | $41,300 |
Family Income in Marlborough
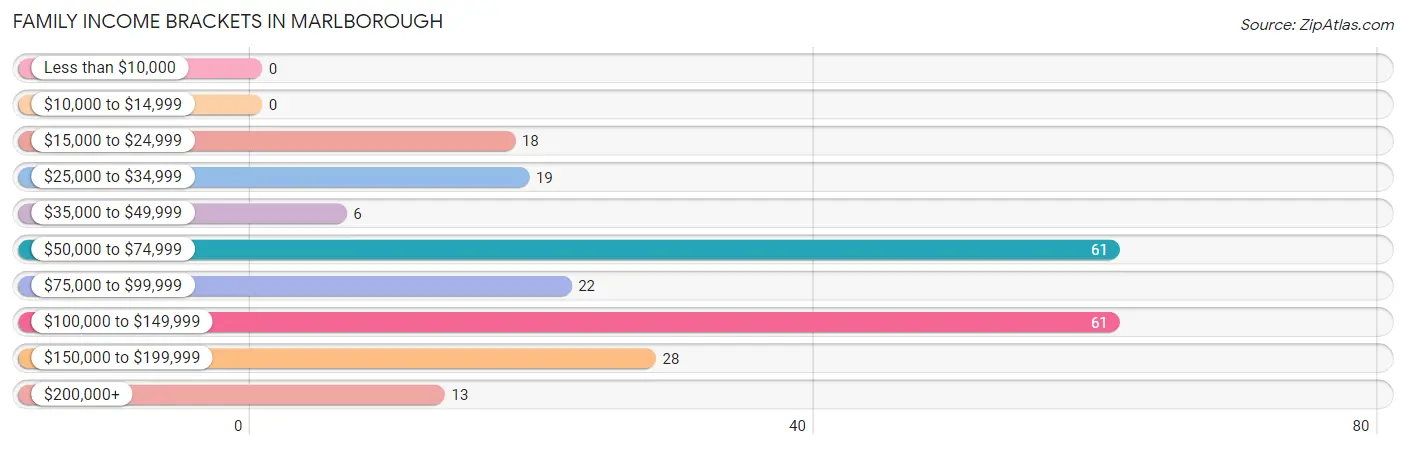
Family Income Brackets in Marlborough
According to the Marlborough family income data, there are 61 families falling into the $50,000 to $74,999 income range, which is the most common income bracket and makes up 26.8% of all families.
| Income Bracket | # Families | % Families |
| Less than $10,000 | 0 | 0.0% |
| $10,000 to $14,999 | 0 | 0.0% |
| $15,000 to $24,999 | 18 | 7.9% |
| $25,000 to $34,999 | 19 | 8.3% |
| $35,000 to $49,999 | 6 | 2.6% |
| $50,000 to $74,999 | 61 | 26.8% |
| $75,000 to $99,999 | 22 | 9.6% |
| $100,000 to $149,999 | 61 | 26.8% |
| $150,000 to $199,999 | 28 | 12.3% |
| $200,000+ | 13 | 5.7% |
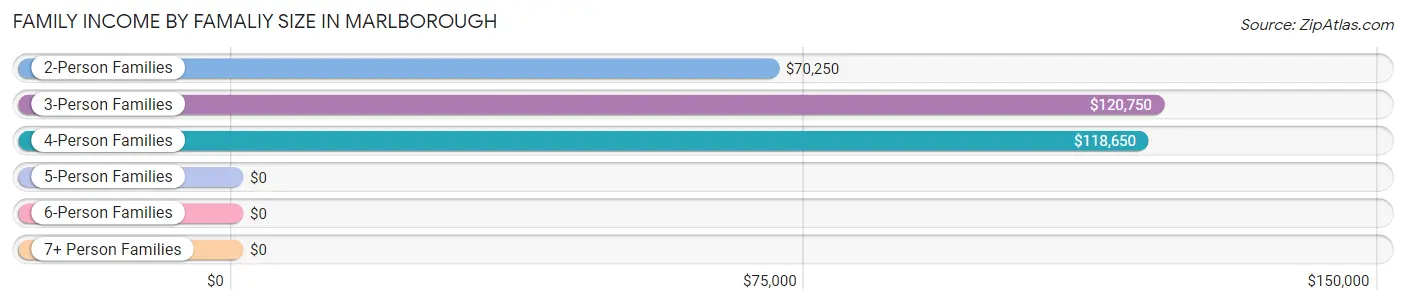
Family Income by Famaliy Size in Marlborough
3-person families (71 | 31.1%) account for the highest median family income in Marlborough with $120,750 per family, while 3-person families (71 | 31.1%) have the highest median income of $40,250 per family member.
| Income Bracket | # Families | Median Income |
| 2-Person Families | 108 (47.4%) | $70,250 |
| 3-Person Families | 71 (31.1%) | $120,750 |
| 4-Person Families | 37 (16.2%) | $118,650 |
| 5-Person Families | 12 (5.3%) | $0 |
| 6-Person Families | 0 (0.0%) | $0 |
| 7+ Person Families | 0 (0.0%) | $0 |
| Total | 228 (100.0%) | $84,000 |
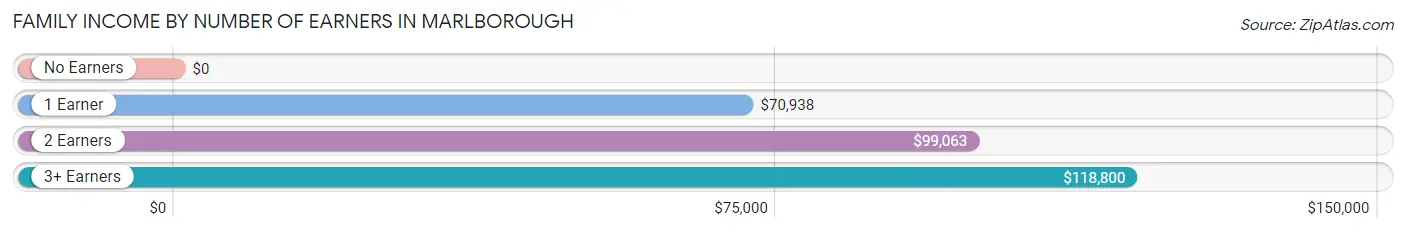
Family Income by Number of Earners in Marlborough
| Number of Earners | # Families | Median Income |
| No Earners | 30 (13.2%) | $0 |
| 1 Earner | 53 (23.3%) | $70,938 |
| 2 Earners | 75 (32.9%) | $99,063 |
| 3+ Earners | 70 (30.7%) | $118,800 |
| Total | 228 (100.0%) | $84,000 |
Household Income in Marlborough
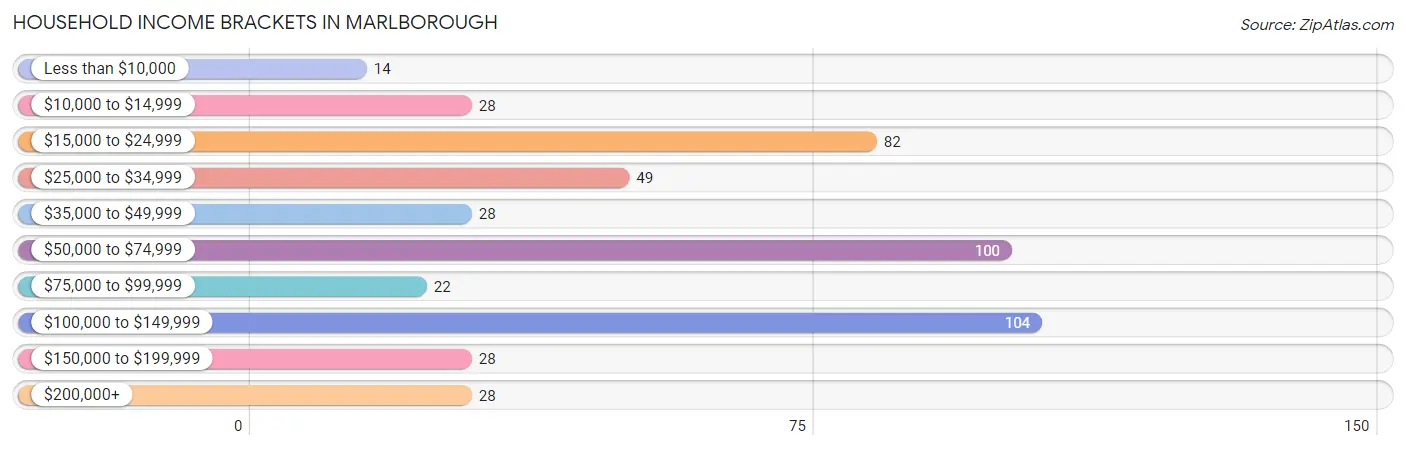
Household Income Brackets in Marlborough
With 104 households falling in the category, the $100,000 to $149,999 income range is the most frequent in Marlborough, accounting for 21.5% of all households. In contrast, only 14 households (2.9%) fall into the less than $10,000 income bracket, making it the least populous group.
| Income Bracket | # Households | % Households |
| Less than $10,000 | 14 | 2.9% |
| $10,000 to $14,999 | 28 | 5.8% |
| $15,000 to $24,999 | 82 | 17.0% |
| $25,000 to $34,999 | 49 | 10.1% |
| $35,000 to $49,999 | 28 | 5.8% |
| $50,000 to $74,999 | 100 | 20.7% |
| $75,000 to $99,999 | 22 | 4.6% |
| $100,000 to $149,999 | 104 | 21.5% |
| $150,000 to $199,999 | 28 | 5.8% |
| $200,000+ | 28 | 5.8% |
Household Income by Householder Age in Marlborough
The median household income in Marlborough is $62,950, with the highest median household income of $75,714 found in the 45 to 64 years age bracket for the primary householder. A total of 160 households (33.1%) fall into this category.
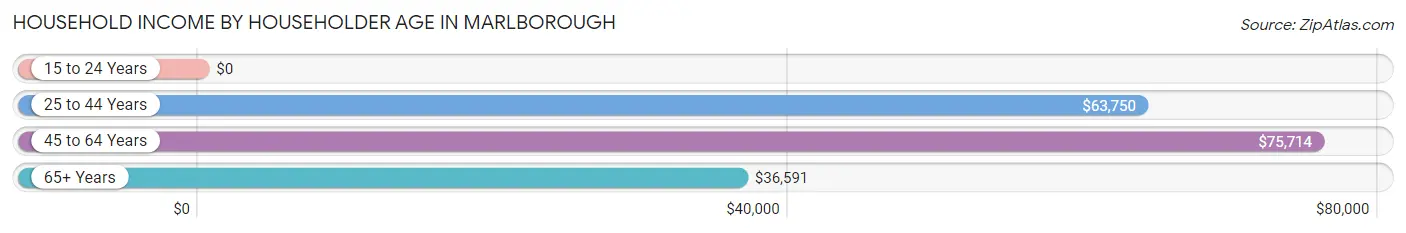
| Income Bracket | # Households | Median Income |
| 15 to 24 Years | 0 (0.0%) | $0 |
| 25 to 44 Years | 181 (37.5%) | $63,750 |
| 45 to 64 Years | 160 (33.1%) | $75,714 |
| 65+ Years | 142 (29.4%) | $36,591 |
| Total | 483 (100.0%) | $62,950 |
Poverty in Marlborough
Income Below Poverty by Sex and Age in Marlborough
With 8.8% poverty level for males and 10.7% for females among the residents of Marlborough, 18 to 24 year old males and 55 to 64 year old females are the most vulnerable to poverty, with 31 males (53.4%) and 36 females (31.3%) in their respective age groups living below the poverty level.
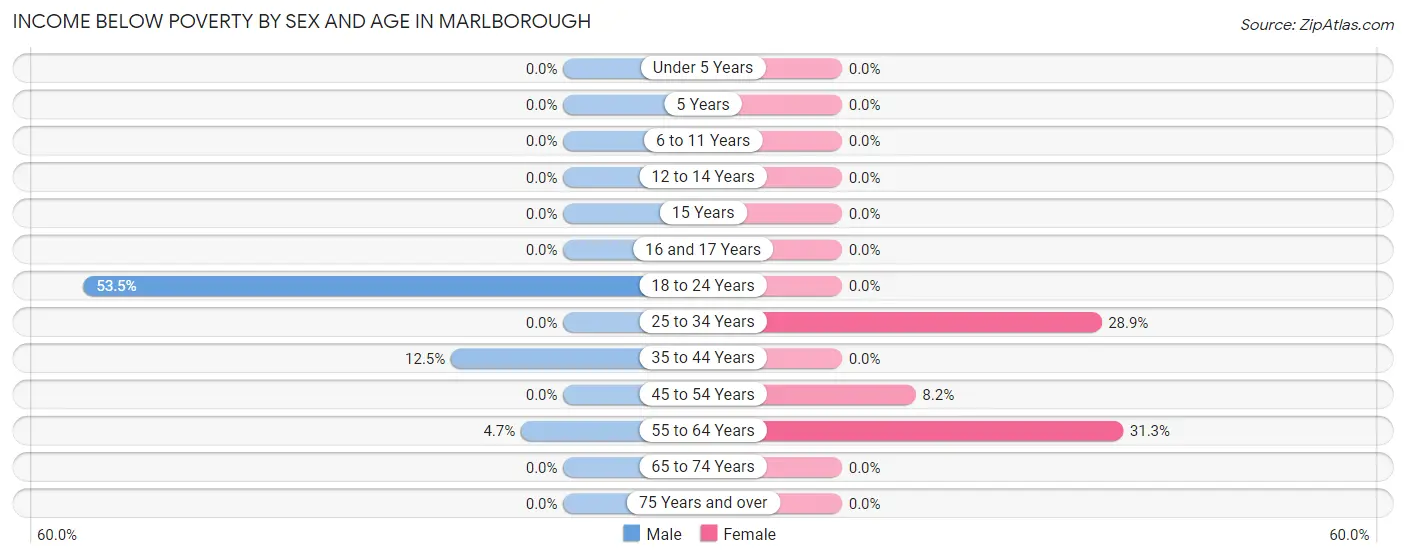
| Age Bracket | Male | Female |
| Under 5 Years | 0 (0.0%) | 0 (0.0%) |
| 5 Years | 0 (0.0%) | 0 (0.0%) |
| 6 to 11 Years | 0 (0.0%) | 0 (0.0%) |
| 12 to 14 Years | 0 (0.0%) | 0 (0.0%) |
| 15 Years | 0 (0.0%) | 0 (0.0%) |
| 16 and 17 Years | 0 (0.0%) | 0 (0.0%) |
| 18 to 24 Years | 31 (53.4%) | 0 (0.0%) |
| 25 to 34 Years | 0 (0.0%) | 13 (28.9%) |
| 35 to 44 Years | 8 (12.5%) | 0 (0.0%) |
| 45 to 54 Years | 0 (0.0%) | 5 (8.2%) |
| 55 to 64 Years | 4 (4.7%) | 36 (31.3%) |
| 65 to 74 Years | 0 (0.0%) | 0 (0.0%) |
| 75 Years and over | 0 (0.0%) | 0 (0.0%) |
| Total | 43 (8.8%) | 54 (10.7%) |
Income Above Poverty by Sex and Age in Marlborough
According to the poverty statistics in Marlborough, males aged under 5 years and females aged under 5 years are the age groups that are most secure financially, with 100.0% of males and 100.0% of females in these age groups living above the poverty line.
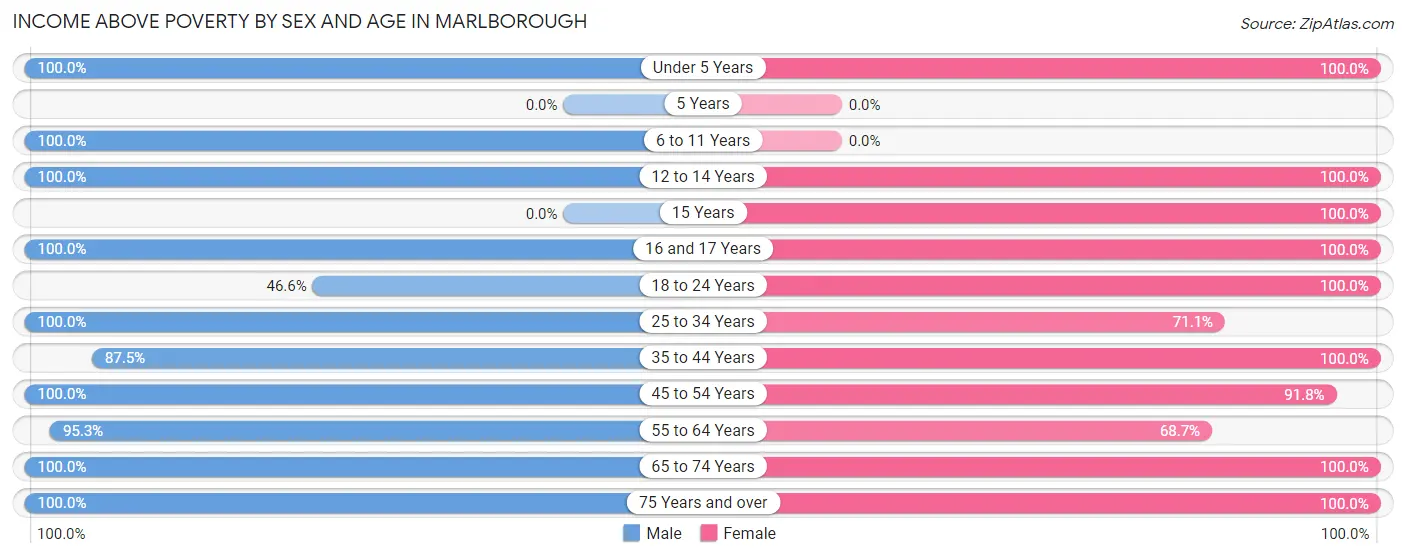
| Age Bracket | Male | Female |
| Under 5 Years | 28 (100.0%) | 7 (100.0%) |
| 5 Years | 0 (0.0%) | 0 (0.0%) |
| 6 to 11 Years | 15 (100.0%) | 0 (0.0%) |
| 12 to 14 Years | 23 (100.0%) | 7 (100.0%) |
| 15 Years | 0 (0.0%) | 5 (100.0%) |
| 16 and 17 Years | 7 (100.0%) | 55 (100.0%) |
| 18 to 24 Years | 27 (46.6%) | 13 (100.0%) |
| 25 to 34 Years | 55 (100.0%) | 32 (71.1%) |
| 35 to 44 Years | 56 (87.5%) | 90 (100.0%) |
| 45 to 54 Years | 65 (100.0%) | 56 (91.8%) |
| 55 to 64 Years | 81 (95.3%) | 79 (68.7%) |
| 65 to 74 Years | 28 (100.0%) | 43 (100.0%) |
| 75 Years and over | 60 (100.0%) | 62 (100.0%) |
| Total | 445 (91.2%) | 449 (89.3%) |
Income Below Poverty Among Married-Couple Families in Marlborough
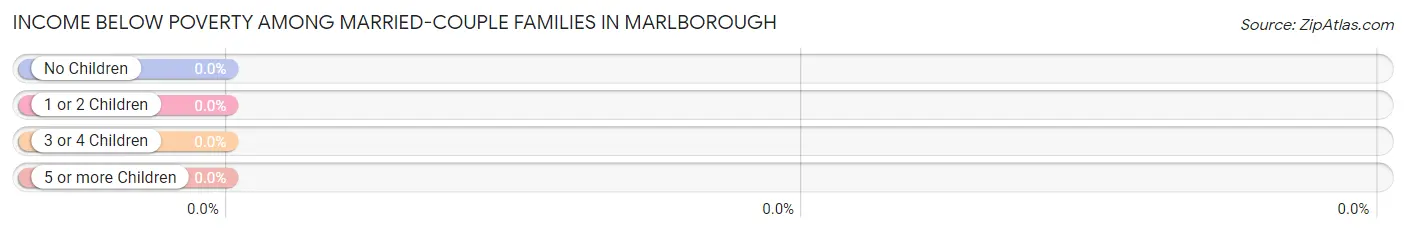
| Children | Above Poverty | Below Poverty |
| No Children | 116 (100.0%) | 0 (0.0%) |
| 1 or 2 Children | 82 (100.0%) | 0 (0.0%) |
| 3 or 4 Children | 0 (0.0%) | 0 (0.0%) |
| 5 or more Children | 0 (0.0%) | 0 (0.0%) |
| Total | 198 (100.0%) | 0 (0.0%) |
Income Below Poverty Among Single-Parent Households in Marlborough
| Children | Single Father | Single Mother |
| No Children | 0 (0.0%) | 0 (0.0%) |
| 1 or 2 Children | 0 (0.0%) | 0 (0.0%) |
| 3 or 4 Children | 0 (0.0%) | 0 (0.0%) |
| 5 or more Children | 0 (0.0%) | 0 (0.0%) |
| Total | 0 (0.0%) | 0 (0.0%) |
Income Below Poverty Among Married-Couple vs Single-Parent Households in Marlborough
| Children | Married-Couple Families | Single-Parent Households |
| No Children | 0 (0.0%) | 0 (0.0%) |
| 1 or 2 Children | 0 (0.0%) | 0 (0.0%) |
| 3 or 4 Children | 0 (0.0%) | 0 (0.0%) |
| 5 or more Children | 0 (0.0%) | 0 (0.0%) |
| Total | 0 (0.0%) | 0 (0.0%) |
Race in Marlborough
The most populous races in Marlborough are White / Caucasian (951 | 96.0%), Two or more Races (30 | 3.0%), and Native / Alaskan (10 | 1.0%).
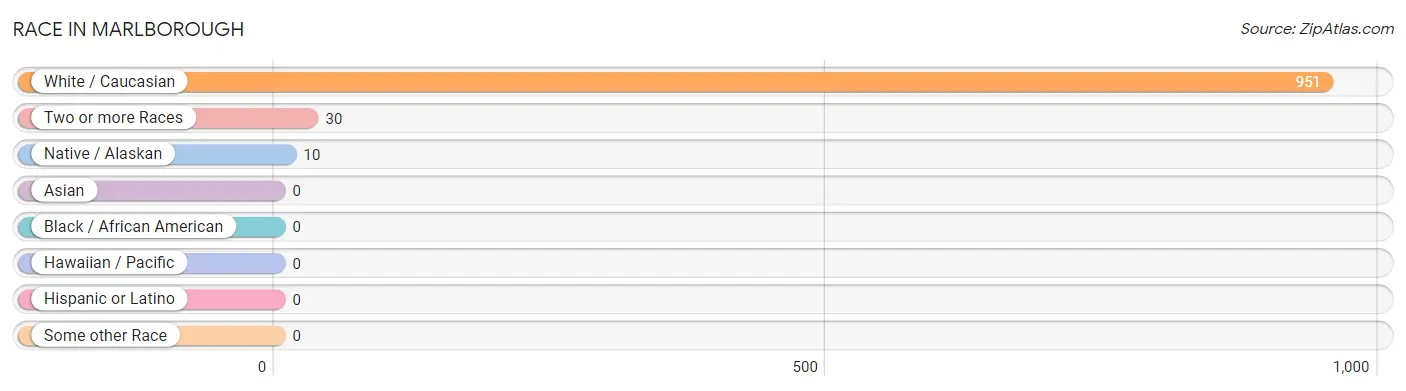
| Race | # Population | % Population |
| Asian | 0 | 0.0% |
| Black / African American | 0 | 0.0% |
| Hawaiian / Pacific | 0 | 0.0% |
| Hispanic or Latino | 0 | 0.0% |
| Native / Alaskan | 10 | 1.0% |
| White / Caucasian | 951 | 96.0% |
| Two or more Races | 30 | 3.0% |
| Some other Race | 0 | 0.0% |
| Total | 991 | 100.0% |
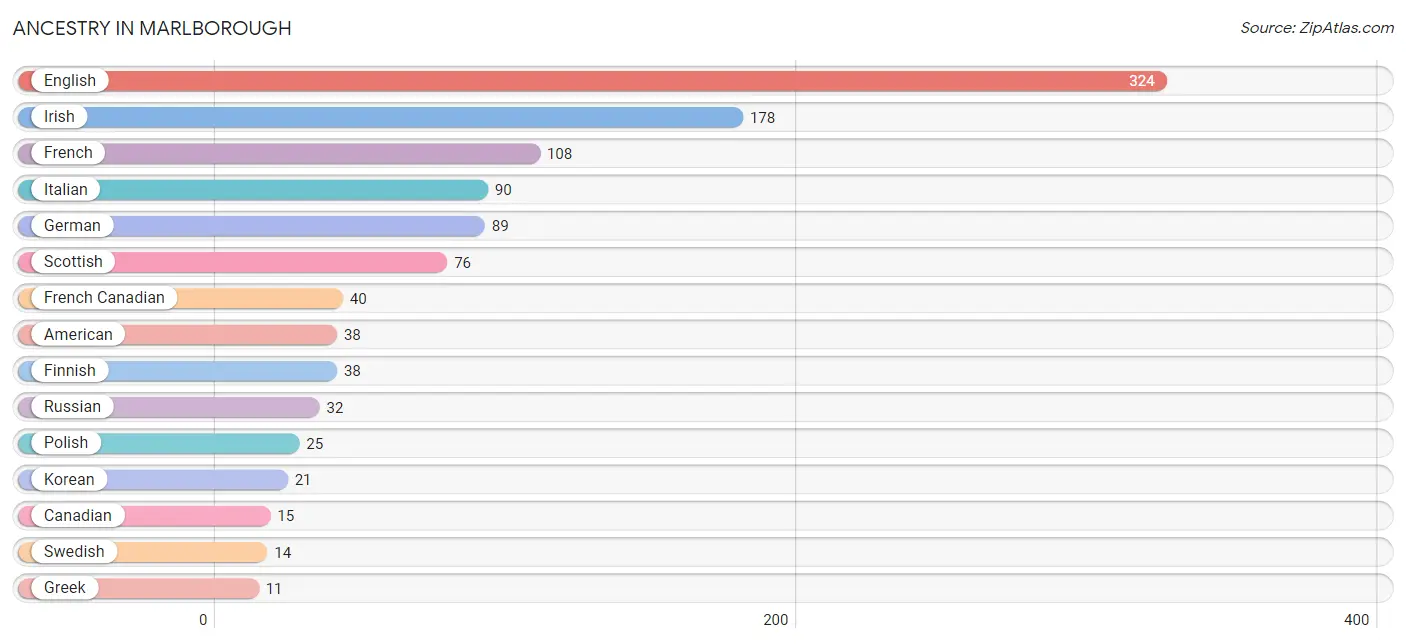
Ancestry in Marlborough
The most populous ancestries reported in Marlborough are English (324 | 32.7%), Irish (178 | 18.0%), French (108 | 10.9%), Italian (90 | 9.1%), and German (89 | 9.0%), together accounting for 79.6% of all Marlborough residents.
| Ancestry | # Population | % Population |
| American | 38 | 3.8% |
| Canadian | 15 | 1.5% |
| Czech | 6 | 0.6% |
| Danish | 4 | 0.4% |
| English | 324 | 32.7% |
| Finnish | 38 | 3.8% |
| French | 108 | 10.9% |
| French Canadian | 40 | 4.0% |
| German | 89 | 9.0% |
| Greek | 11 | 1.1% |
| Indian (Asian) | 7 | 0.7% |
| Irish | 178 | 18.0% |
| Italian | 90 | 9.1% |
| Jamaican | 4 | 0.4% |
| Korean | 21 | 2.1% |
| Norwegian | 11 | 1.1% |
| Polish | 25 | 2.5% |
| Russian | 32 | 3.2% |
| Scottish | 76 | 7.7% |
| Swedish | 14 | 1.4% |
| Thai | 7 | 0.7% |
| Ukrainian | 9 | 0.9% | View All 22 Rows |
Immigrants in Marlborough

| Immigration Origin | # Population | % Population | View All 0 Rows |
Sex and Age in Marlborough
Sex and Age in Marlborough
The most populous age groups in Marlborough are 55 to 59 Years (48 | 9.8%) for men and 60 to 64 Years (77 | 15.3%) for women.
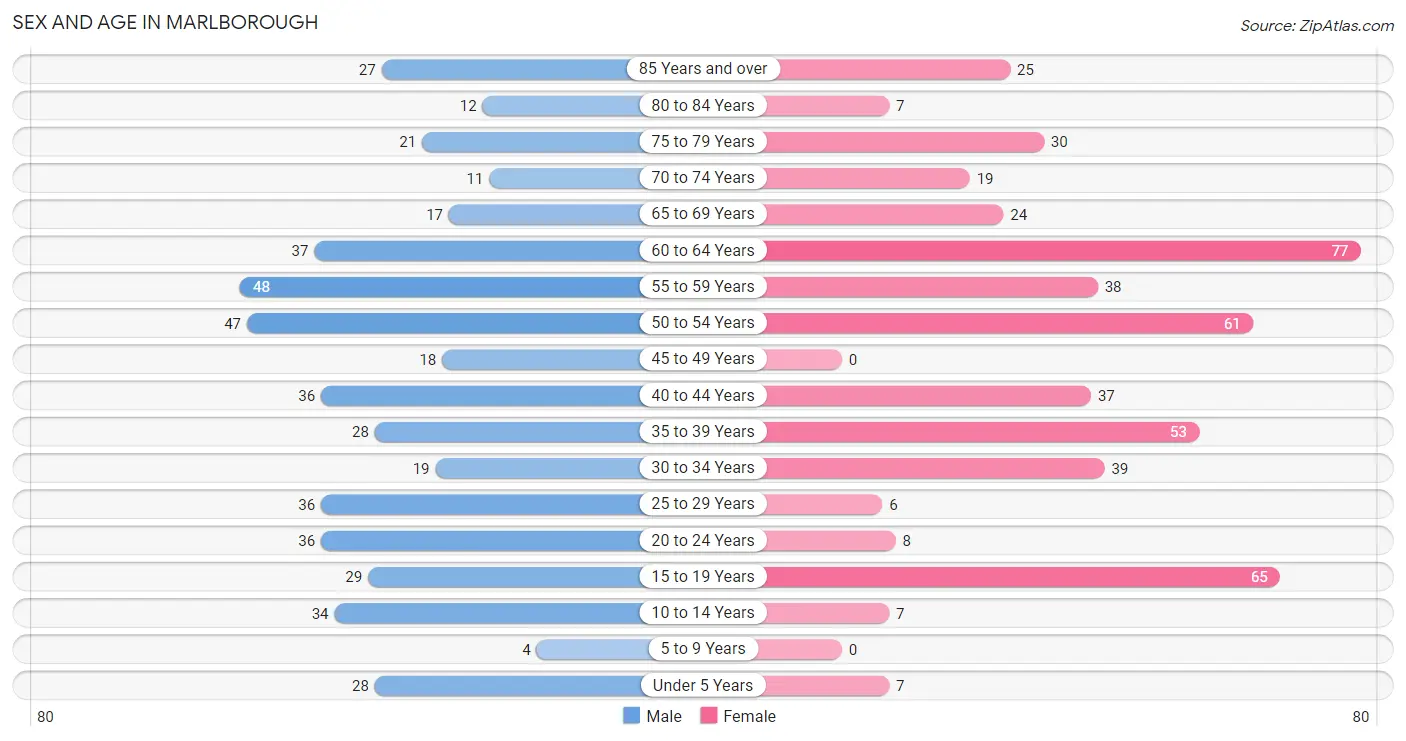
| Age Bracket | Male | Female |
| Under 5 Years | 28 (5.7%) | 7 (1.4%) |
| 5 to 9 Years | 4 (0.8%) | 0 (0.0%) |
| 10 to 14 Years | 34 (7.0%) | 7 (1.4%) |
| 15 to 19 Years | 29 (5.9%) | 65 (12.9%) |
| 20 to 24 Years | 36 (7.4%) | 8 (1.6%) |
| 25 to 29 Years | 36 (7.4%) | 6 (1.2%) |
| 30 to 34 Years | 19 (3.9%) | 39 (7.7%) |
| 35 to 39 Years | 28 (5.7%) | 53 (10.5%) |
| 40 to 44 Years | 36 (7.4%) | 37 (7.4%) |
| 45 to 49 Years | 18 (3.7%) | 0 (0.0%) |
| 50 to 54 Years | 47 (9.6%) | 61 (12.1%) |
| 55 to 59 Years | 48 (9.8%) | 38 (7.5%) |
| 60 to 64 Years | 37 (7.6%) | 77 (15.3%) |
| 65 to 69 Years | 17 (3.5%) | 24 (4.8%) |
| 70 to 74 Years | 11 (2.2%) | 19 (3.8%) |
| 75 to 79 Years | 21 (4.3%) | 30 (6.0%) |
| 80 to 84 Years | 12 (2.5%) | 7 (1.4%) |
| 85 Years and over | 27 (5.5%) | 25 (5.0%) |
| Total | 488 (100.0%) | 503 (100.0%) |
Families and Households in Marlborough
Median Family Size in Marlborough
The median family size in Marlborough is 2.82 persons per family, with married-couple families (198 | 86.8%) accounting for the largest median family size of 2.86 persons per family. On the other hand, single male/father families (5 | 2.2%) represent the smallest median family size with 2.20 persons per family.
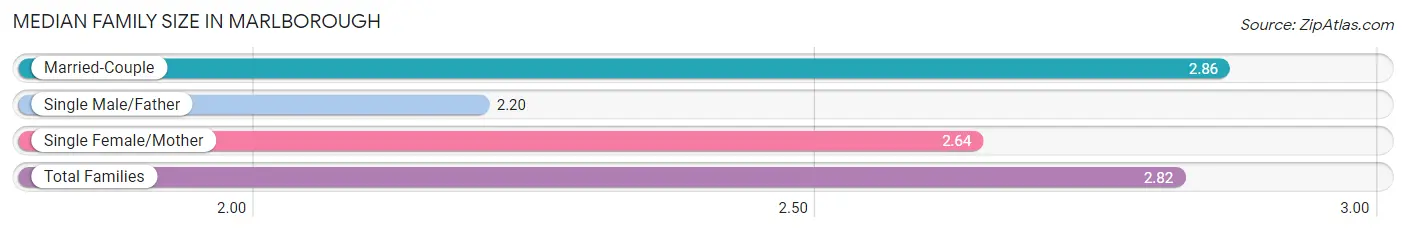
| Family Type | # Families | Family Size |
| Married-Couple | 198 (86.8%) | 2.86 |
| Single Male/Father | 5 (2.2%) | 2.20 |
| Single Female/Mother | 25 (11.0%) | 2.64 |
| Total Families | 228 (100.0%) | 2.82 |
Median Household Size in Marlborough
The median household size in Marlborough is 2.05 persons per household, with married-couple households (198 | 41.0%) accounting for the largest median household size of 2.86 persons per household. non-family households (255 | 52.8%) represent the smallest median household size with 1.36 persons per household.
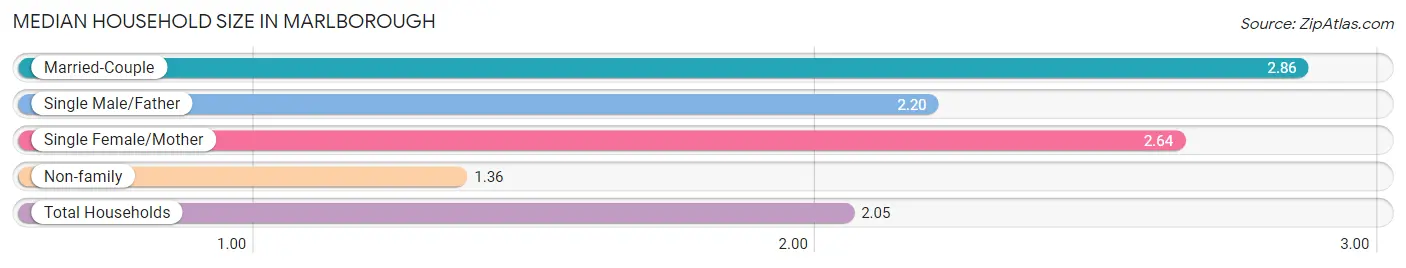
| Household Type | # Households | Household Size |
| Married-Couple | 198 (41.0%) | 2.86 |
| Single Male/Father | 5 (1.0%) | 2.20 |
| Single Female/Mother | 25 (5.2%) | 2.64 |
| Non-family | 255 (52.8%) | 1.36 |
| Total Households | 483 (100.0%) | 2.05 |
Household Size by Marriage Status in Marlborough
Out of a total of 483 households in Marlborough, 228 (47.2%) are family households, while 255 (52.8%) are nonfamily households. The most numerous type of family households are 2-person households, comprising 108, and the most common type of nonfamily households are 1-person households, comprising 182.
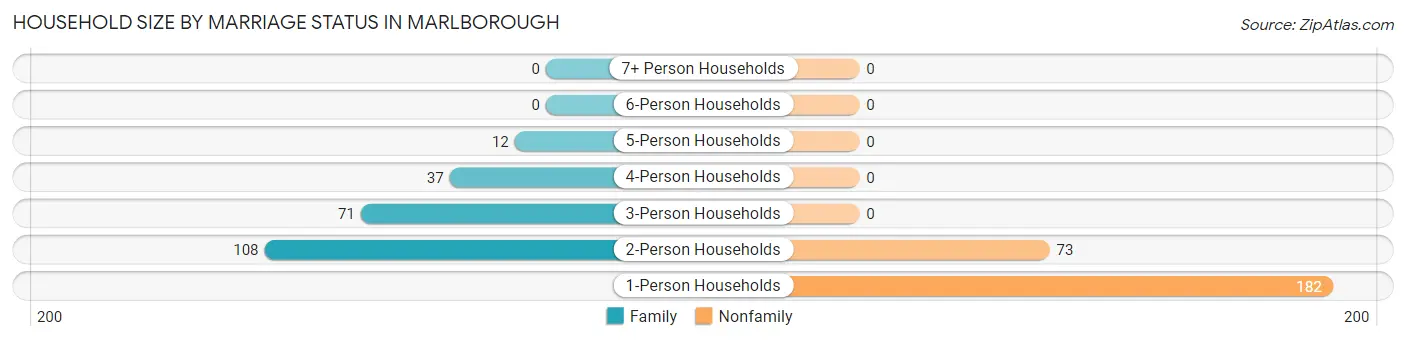
| Household Size | Family Households | Nonfamily Households |
| 1-Person Households | - | 182 (37.7%) |
| 2-Person Households | 108 (22.4%) | 73 (15.1%) |
| 3-Person Households | 71 (14.7%) | 0 (0.0%) |
| 4-Person Households | 37 (7.7%) | 0 (0.0%) |
| 5-Person Households | 12 (2.5%) | 0 (0.0%) |
| 6-Person Households | 0 (0.0%) | 0 (0.0%) |
| 7+ Person Households | 0 (0.0%) | 0 (0.0%) |
| Total | 228 (47.2%) | 255 (52.8%) |
Female Fertility in Marlborough
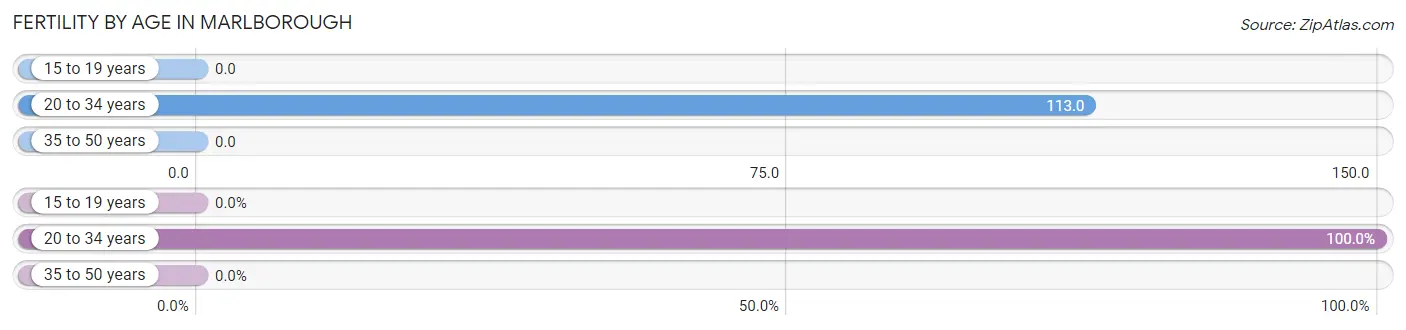
Fertility by Age in Marlborough
Average fertility rate in Marlborough is 29.0 births per 1,000 women. Women in the age bracket of 20 to 34 years have the highest fertility rate with 113.0 births per 1,000 women. Women in the age bracket of 20 to 34 years acount for 100.0% of all women with births.
| Age Bracket | Women with Births | Births / 1,000 Women |
| 15 to 19 years | 0 (0.0%) | 0.0 |
| 20 to 34 years | 6 (100.0%) | 113.0 |
| 35 to 50 years | 0 (0.0%) | 0.0 |
| Total | 6 (100.0%) | 29.0 |
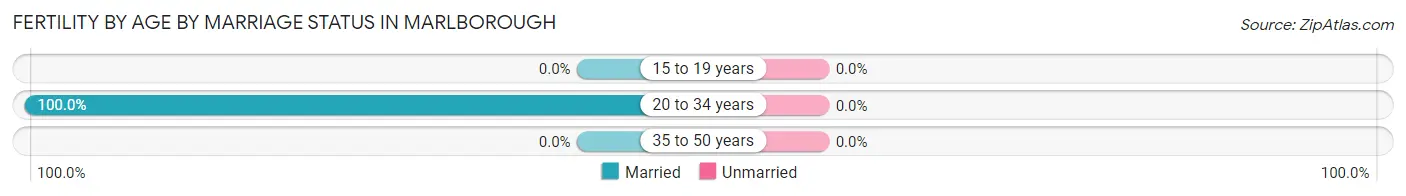
Fertility by Age by Marriage Status in Marlborough
| Age Bracket | Married | Unmarried |
| 15 to 19 years | 0 (0.0%) | 0 (0.0%) |
| 20 to 34 years | 6 (100.0%) | 0 (0.0%) |
| 35 to 50 years | 0 (0.0%) | 0 (0.0%) |
| Total | 6 (100.0%) | 0 (0.0%) |
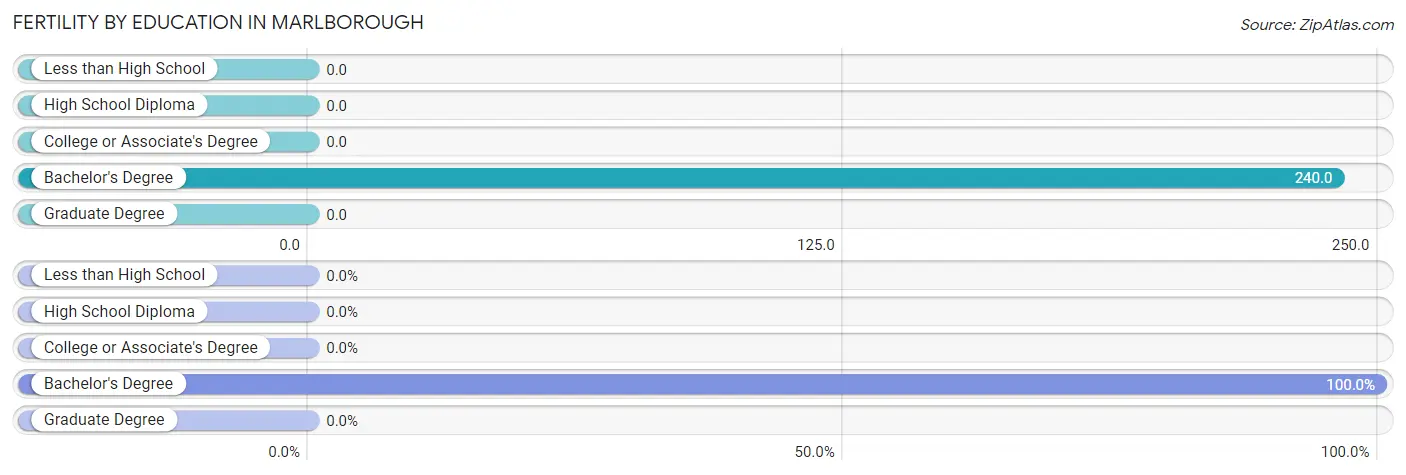
Fertility by Education in Marlborough
| Educational Attainment | Women with Births | Births / 1,000 Women |
| Less than High School | 0 (0.0%) | 0.0 |
| High School Diploma | 0 (0.0%) | 0.0 |
| College or Associate's Degree | 0 (0.0%) | 0.0 |
| Bachelor's Degree | 6 (100.0%) | 240.0 |
| Graduate Degree | 0 (0.0%) | 0.0 |
| Total | 6 (100.0%) | 29.0 |
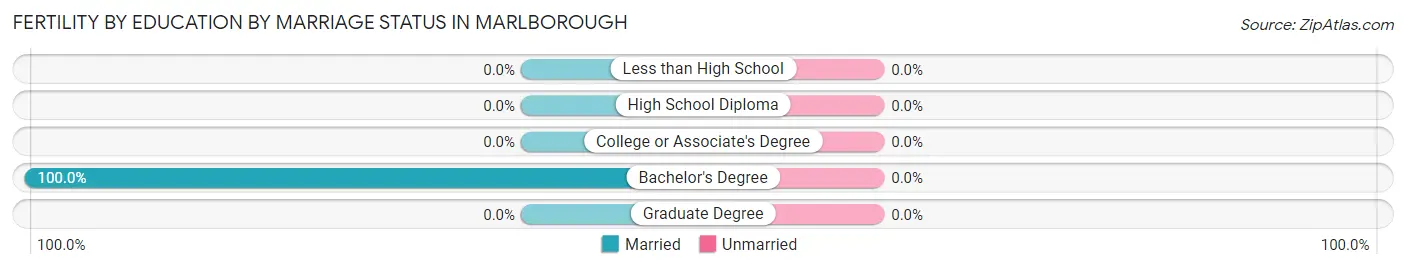
Fertility by Education by Marriage Status in Marlborough
| Educational Attainment | Married | Unmarried |
| Less than High School | 0 (0.0%) | 0 (0.0%) |
| High School Diploma | 0 (0.0%) | 0 (0.0%) |
| College or Associate's Degree | 0 (0.0%) | 0 (0.0%) |
| Bachelor's Degree | 6 (100.0%) | 0 (0.0%) |
| Graduate Degree | 0 (0.0%) | 0 (0.0%) |
| Total | 6 (100.0%) | 0 (0.0%) |
Employment Characteristics in Marlborough
Employment by Class of Employer in Marlborough
Among the 522 employed individuals in Marlborough, private company employees (380 | 72.8%), not-for-profit organizations (60 | 11.5%), and local government employees (50 | 9.6%) make up the most common classes of employment.
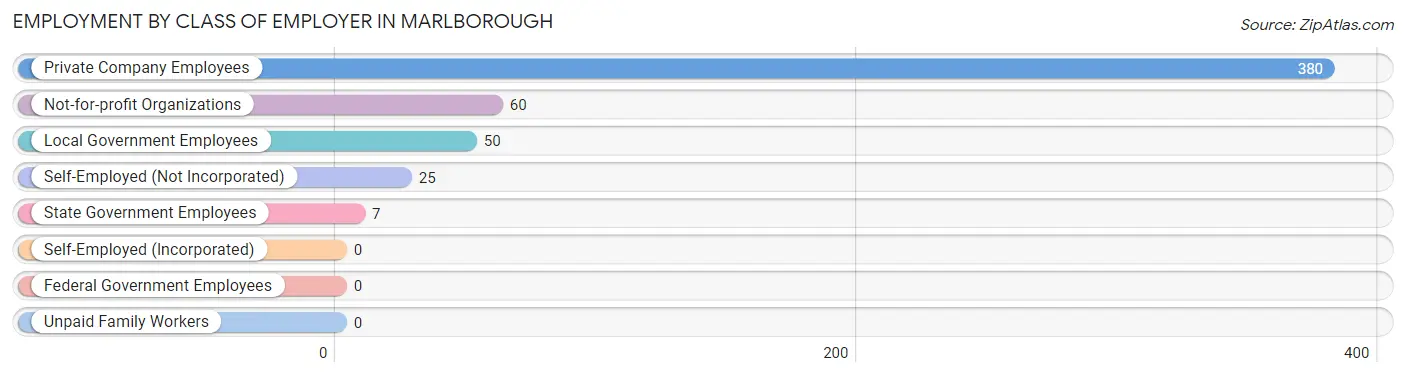
| Employer Class | # Employees | % Employees |
| Private Company Employees | 380 | 72.8% |
| Self-Employed (Incorporated) | 0 | 0.0% |
| Self-Employed (Not Incorporated) | 25 | 4.8% |
| Not-for-profit Organizations | 60 | 11.5% |
| Local Government Employees | 50 | 9.6% |
| State Government Employees | 7 | 1.3% |
| Federal Government Employees | 0 | 0.0% |
| Unpaid Family Workers | 0 | 0.0% |
| Total | 522 | 100.0% |
Employment Status by Age in Marlborough
According to the labor force statistics for Marlborough, out of the total population over 16 years of age (906), 59.4% or 538 individuals are in the labor force, with 0.7% or 4 of them unemployed. The age group with the highest labor force participation rate is 25 to 29 years, with 100.0% or 42 individuals in the labor force. Within the labor force, the 16 to 19 years age range has the highest percentage of unemployed individuals, with 13.3% or 4 of them being unemployed.
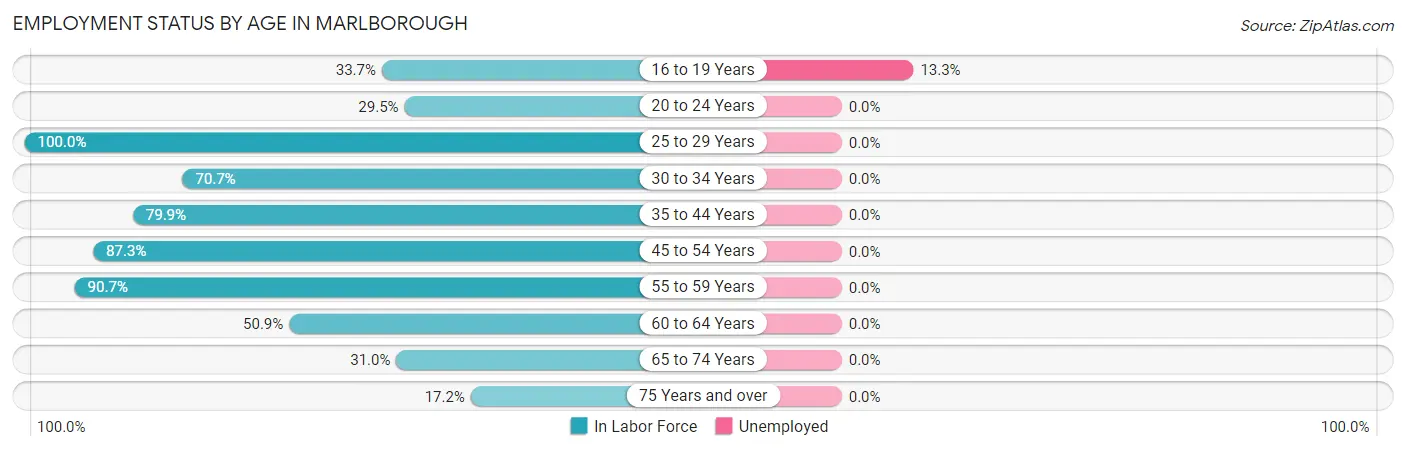
| Age Bracket | In Labor Force | Unemployed |
| 16 to 19 Years | 30 (33.7%) | 4 (13.3%) |
| 20 to 24 Years | 13 (29.5%) | 0 (0.0%) |
| 25 to 29 Years | 42 (100.0%) | 0 (0.0%) |
| 30 to 34 Years | 41 (70.7%) | 0 (0.0%) |
| 35 to 44 Years | 123 (79.9%) | 0 (0.0%) |
| 45 to 54 Years | 110 (87.3%) | 0 (0.0%) |
| 55 to 59 Years | 78 (90.7%) | 0 (0.0%) |
| 60 to 64 Years | 58 (50.9%) | 0 (0.0%) |
| 65 to 74 Years | 22 (31.0%) | 0 (0.0%) |
| 75 Years and over | 21 (17.2%) | 0 (0.0%) |
| Total | 538 (59.4%) | 4 (0.7%) |
Employment Status by Educational Attainment in Marlborough
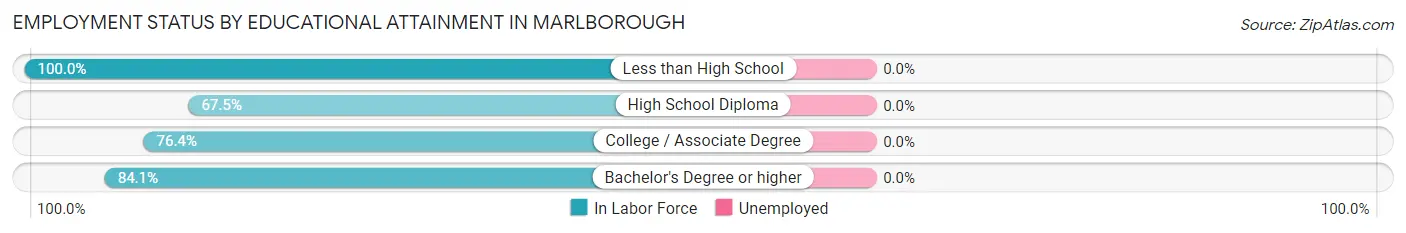
| Educational Attainment | In Labor Force | Unemployed |
| Less than High School | 38 (100.0%) | 0 (0.0%) |
| High School Diploma | 114 (67.5%) | 0 (0.0%) |
| College / Associate Degree | 136 (76.4%) | 0 (0.0%) |
| Bachelor's Degree or higher | 164 (84.1%) | 0 (0.0%) |
| Total | 452 (77.9%) | 0 (0.0%) |
Employment Occupations by Sex in Marlborough
Management, Business, Science and Arts Occupations
The most common Management, Business, Science and Arts occupations in Marlborough are Management (78 | 14.6%), Community & Social Service (64 | 12.0%), Education Instruction & Library (50 | 9.4%), Health Diagnosing & Treating (34 | 6.4%), and Computers, Engineering & Science (31 | 5.8%).
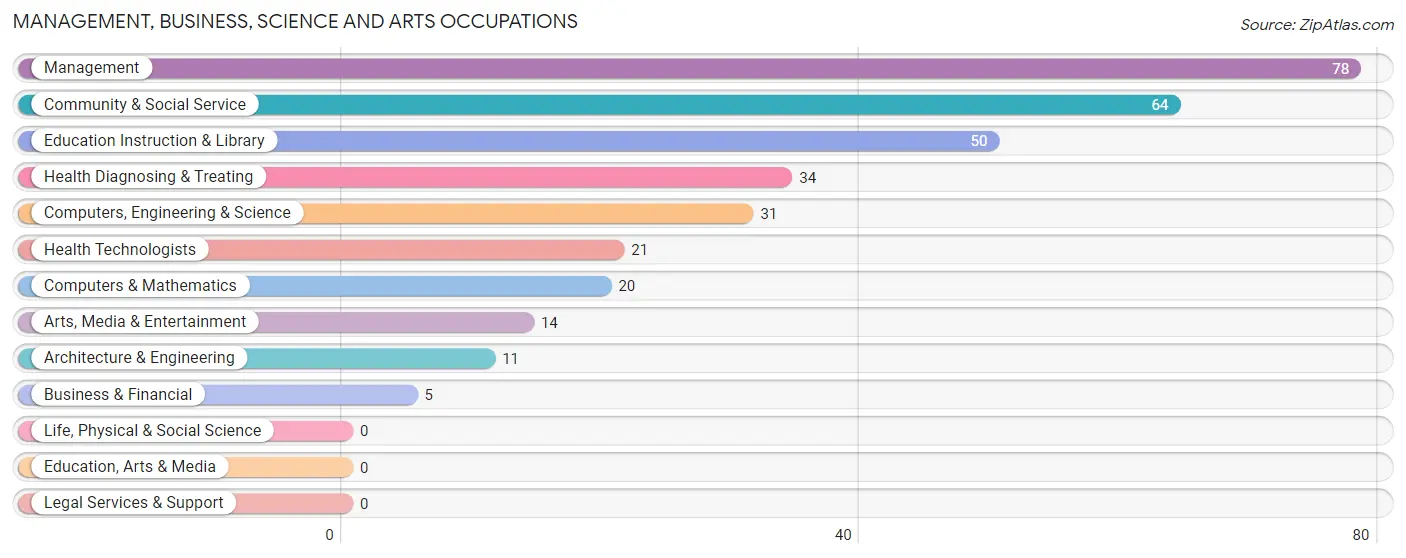
Management, Business, Science and Arts Occupations by Sex
Within the Management, Business, Science and Arts occupations in Marlborough, the most male-oriented occupations are Architecture & Engineering (100.0%), Arts, Media & Entertainment (100.0%), and Management (91.0%), while the most female-oriented occupations are Business & Financial (100.0%), Computers & Mathematics (100.0%), and Health Diagnosing & Treating (85.3%).
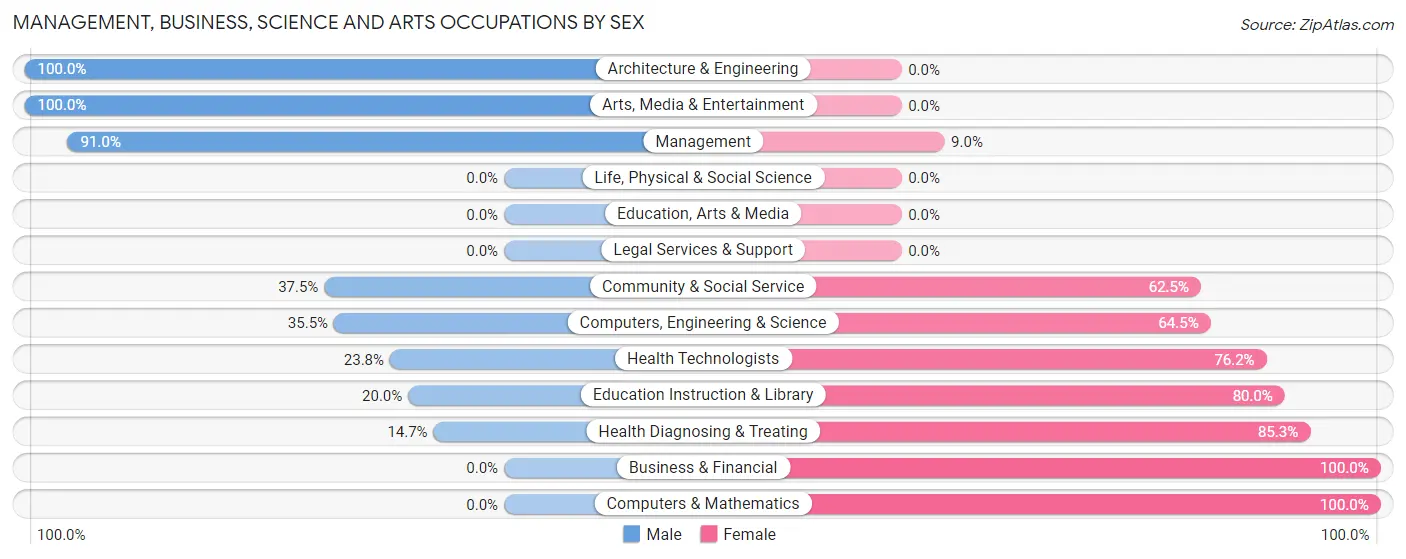
| Occupation | Male | Female |
| Management | 71 (91.0%) | 7 (9.0%) |
| Business & Financial | 0 (0.0%) | 5 (100.0%) |
| Computers, Engineering & Science | 11 (35.5%) | 20 (64.5%) |
| Computers & Mathematics | 0 (0.0%) | 20 (100.0%) |
| Architecture & Engineering | 11 (100.0%) | 0 (0.0%) |
| Life, Physical & Social Science | 0 (0.0%) | 0 (0.0%) |
| Community & Social Service | 24 (37.5%) | 40 (62.5%) |
| Education, Arts & Media | 0 (0.0%) | 0 (0.0%) |
| Legal Services & Support | 0 (0.0%) | 0 (0.0%) |
| Education Instruction & Library | 10 (20.0%) | 40 (80.0%) |
| Arts, Media & Entertainment | 14 (100.0%) | 0 (0.0%) |
| Health Diagnosing & Treating | 5 (14.7%) | 29 (85.3%) |
| Health Technologists | 5 (23.8%) | 16 (76.2%) |
| Total (Category) | 111 (52.4%) | 101 (47.6%) |
| Total (Overall) | 280 (52.4%) | 254 (47.6%) |
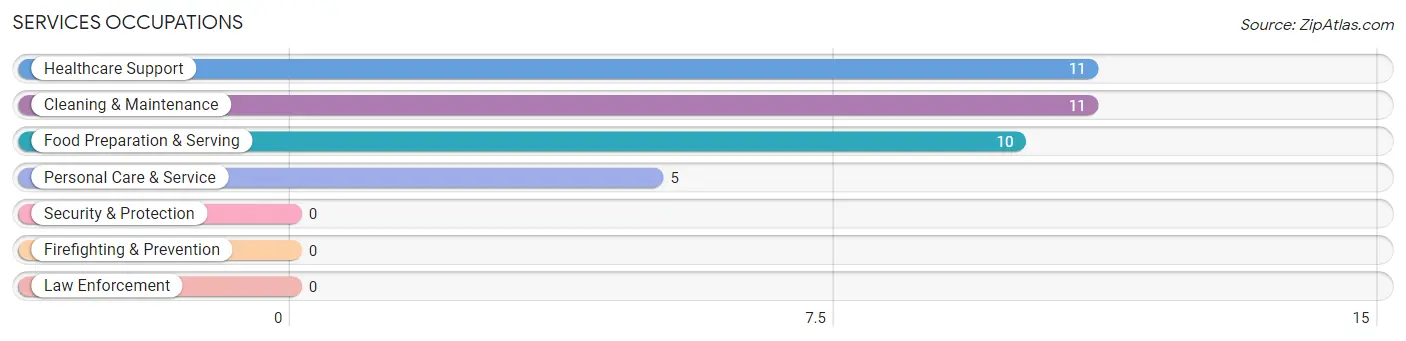
Services Occupations
The most common Services occupations in Marlborough are Healthcare Support (11 | 2.1%), Cleaning & Maintenance (11 | 2.1%), Food Preparation & Serving (10 | 1.9%), and Personal Care & Service (5 | 0.9%).
Services Occupations by Sex
Within the Services occupations in Marlborough, the most male-oriented occupations are Cleaning & Maintenance (100.0%), and Food Preparation & Serving (70.0%), while the most female-oriented occupations are Healthcare Support (100.0%), Personal Care & Service (100.0%), and Food Preparation & Serving (30.0%).
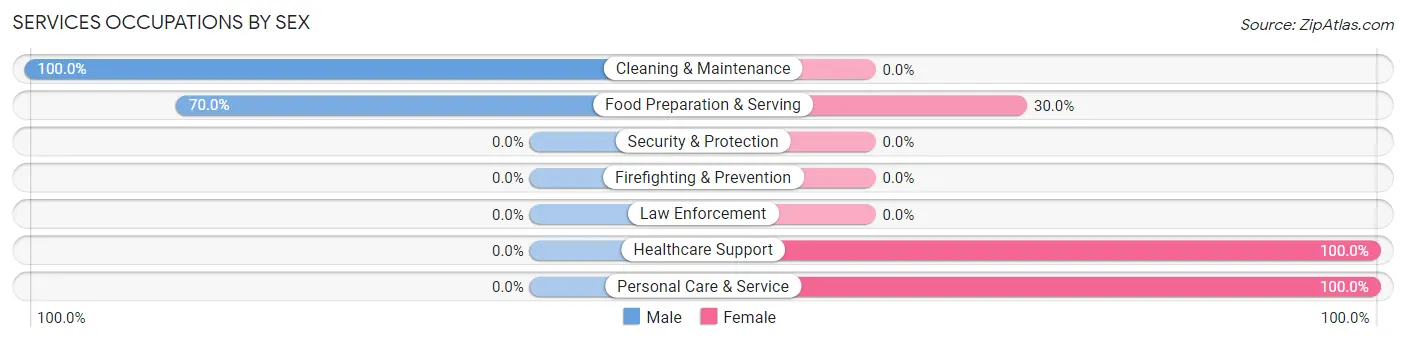
| Occupation | Male | Female |
| Healthcare Support | 0 (0.0%) | 11 (100.0%) |
| Security & Protection | 0 (0.0%) | 0 (0.0%) |
| Firefighting & Prevention | 0 (0.0%) | 0 (0.0%) |
| Law Enforcement | 0 (0.0%) | 0 (0.0%) |
| Food Preparation & Serving | 7 (70.0%) | 3 (30.0%) |
| Cleaning & Maintenance | 11 (100.0%) | 0 (0.0%) |
| Personal Care & Service | 0 (0.0%) | 5 (100.0%) |
| Total (Category) | 18 (48.6%) | 19 (51.3%) |
| Total (Overall) | 280 (52.4%) | 254 (47.6%) |
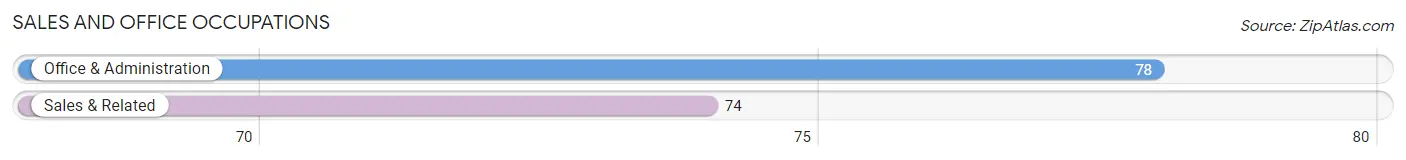
Sales and Office Occupations
The most common Sales and Office occupations in Marlborough are Office & Administration (78 | 14.6%), and Sales & Related (74 | 13.9%).
Sales and Office Occupations by Sex
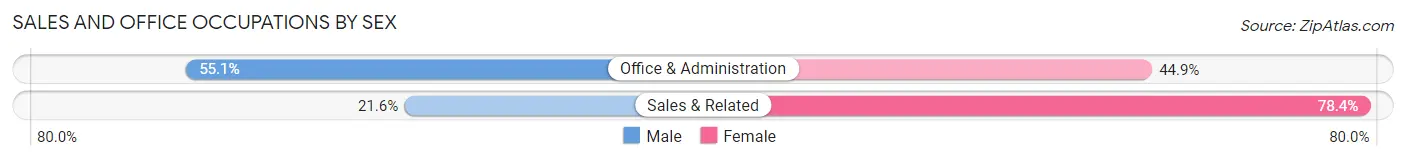
| Occupation | Male | Female |
| Sales & Related | 16 (21.6%) | 58 (78.4%) |
| Office & Administration | 43 (55.1%) | 35 (44.9%) |
| Total (Category) | 59 (38.8%) | 93 (61.2%) |
| Total (Overall) | 280 (52.4%) | 254 (47.6%) |
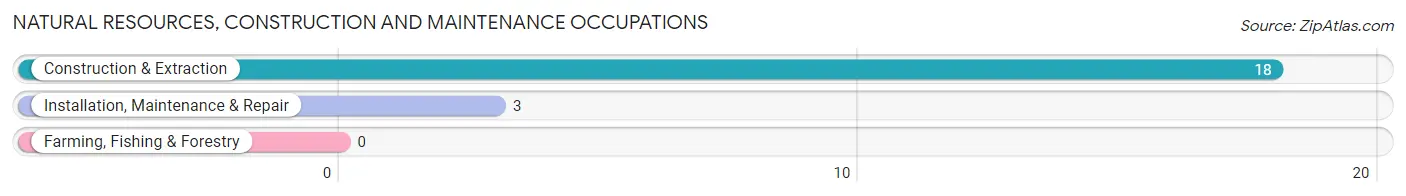
Natural Resources, Construction and Maintenance Occupations
The most common Natural Resources, Construction and Maintenance occupations in Marlborough are Construction & Extraction (18 | 3.4%), and Installation, Maintenance & Repair (3 | 0.6%).
Natural Resources, Construction and Maintenance Occupations by Sex
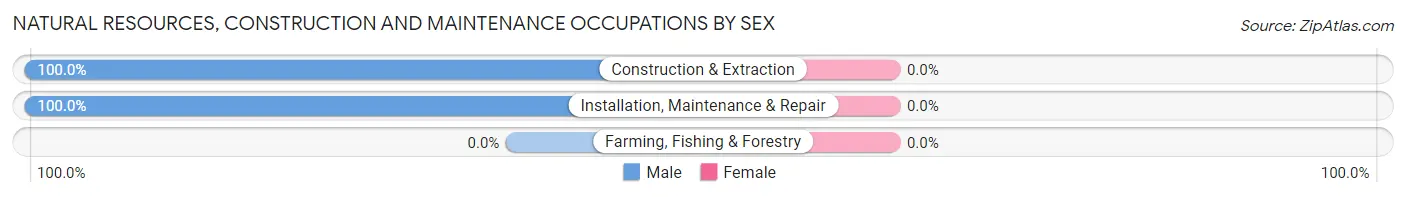
| Occupation | Male | Female |
| Farming, Fishing & Forestry | 0 (0.0%) | 0 (0.0%) |
| Construction & Extraction | 18 (100.0%) | 0 (0.0%) |
| Installation, Maintenance & Repair | 3 (100.0%) | 0 (0.0%) |
| Total (Category) | 21 (100.0%) | 0 (0.0%) |
| Total (Overall) | 280 (52.4%) | 254 (47.6%) |
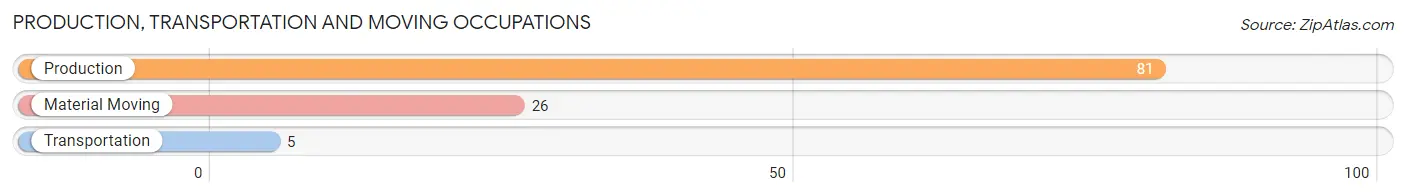
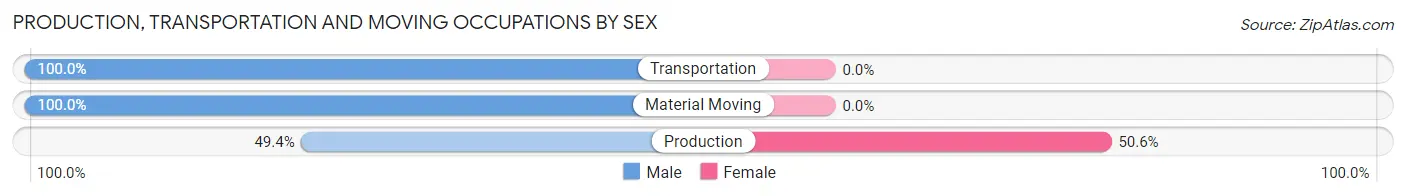
Production, Transportation and Moving Occupations
The most common Production, Transportation and Moving occupations in Marlborough are Production (81 | 15.2%), Material Moving (26 | 4.9%), and Transportation (5 | 0.9%).
Production, Transportation and Moving Occupations by Sex
| Occupation | Male | Female |
| Production | 40 (49.4%) | 41 (50.6%) |
| Transportation | 5 (100.0%) | 0 (0.0%) |
| Material Moving | 26 (100.0%) | 0 (0.0%) |
| Total (Category) | 71 (63.4%) | 41 (36.6%) |
| Total (Overall) | 280 (52.4%) | 254 (47.6%) |
Employment Industries by Sex in Marlborough
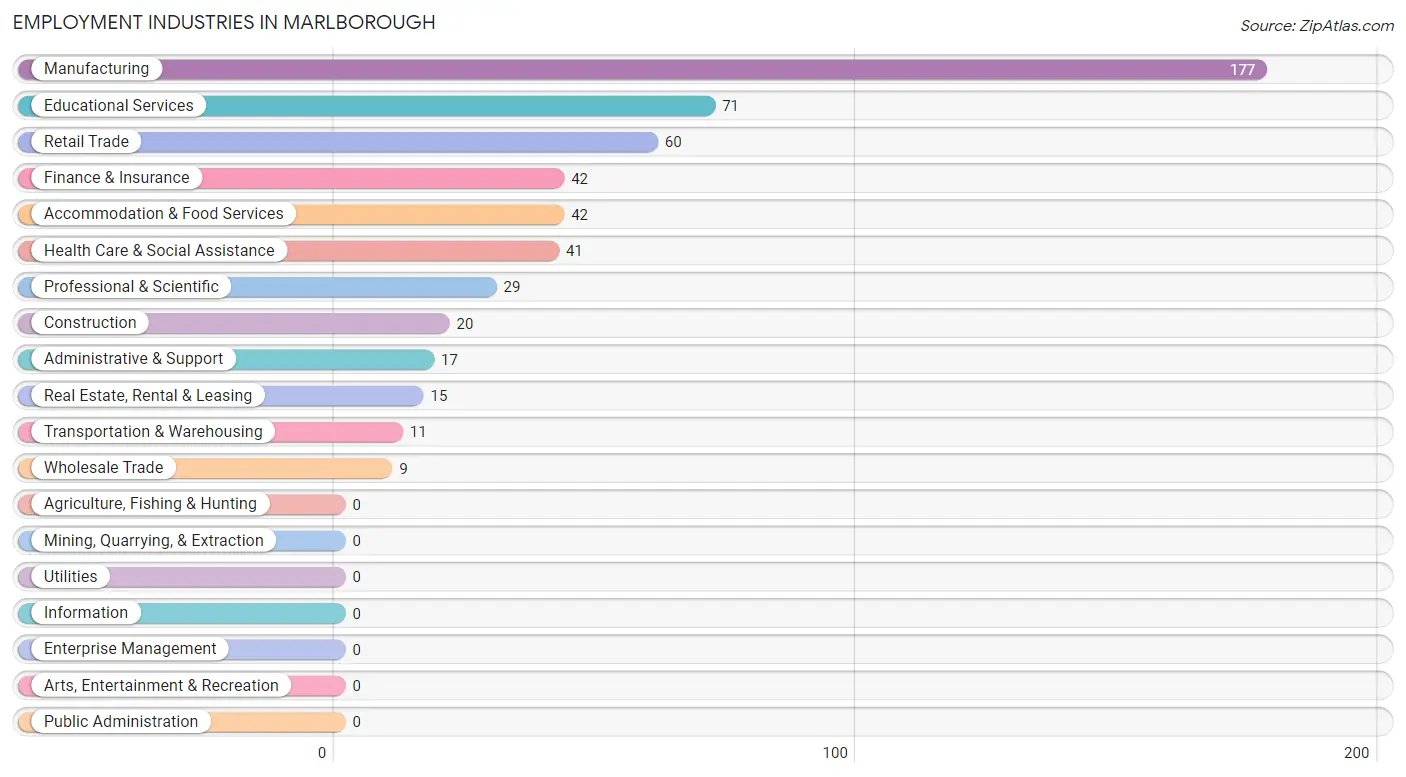
Employment Industries in Marlborough
The major employment industries in Marlborough include Manufacturing (177 | 33.2%), Educational Services (71 | 13.3%), Retail Trade (60 | 11.2%), Finance & Insurance (42 | 7.9%), and Accommodation & Food Services (42 | 7.9%).
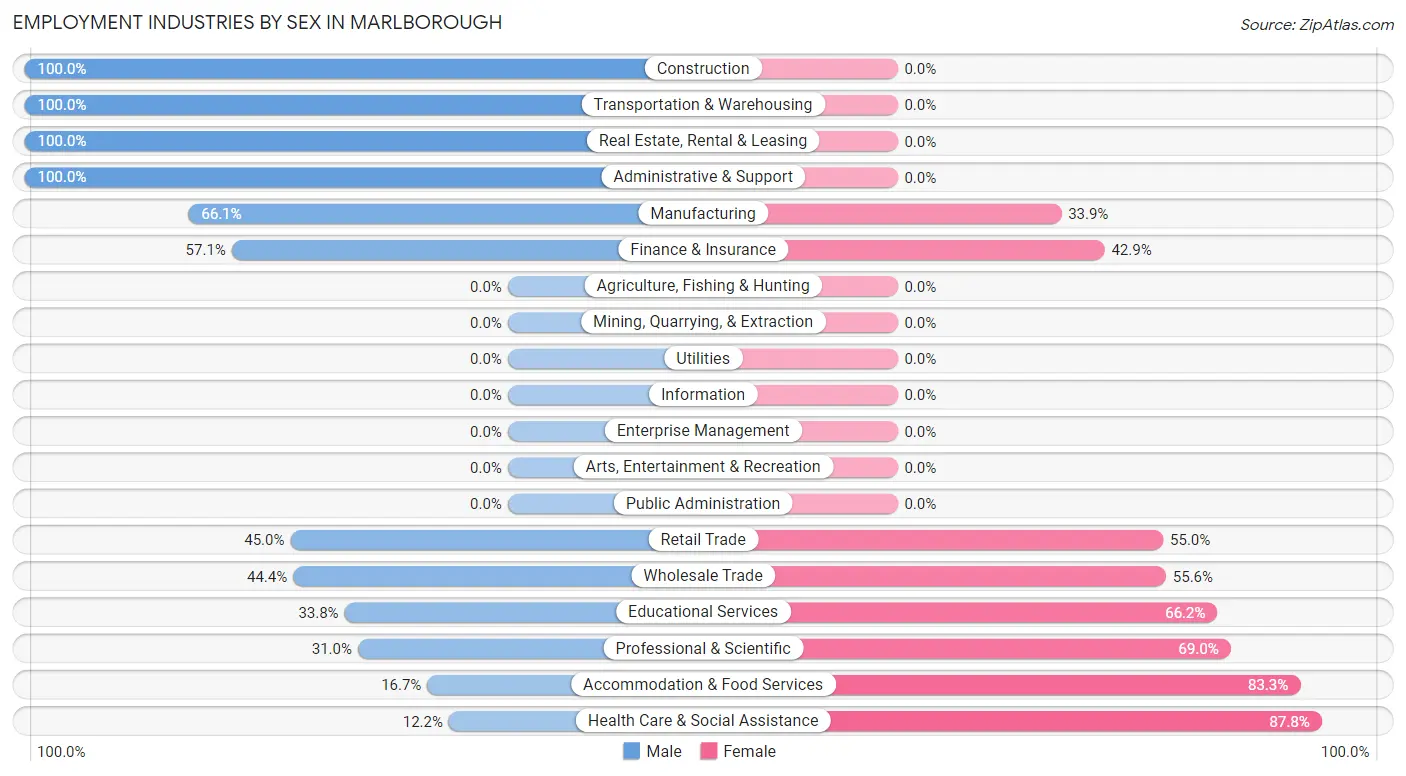
Employment Industries by Sex in Marlborough
The Marlborough industries that see more men than women are Construction (100.0%), Transportation & Warehousing (100.0%), and Real Estate, Rental & Leasing (100.0%), whereas the industries that tend to have a higher number of women are Health Care & Social Assistance (87.8%), Accommodation & Food Services (83.3%), and Professional & Scientific (69.0%).
| Industry | Male | Female |
| Agriculture, Fishing & Hunting | 0 (0.0%) | 0 (0.0%) |
| Mining, Quarrying, & Extraction | 0 (0.0%) | 0 (0.0%) |
| Construction | 20 (100.0%) | 0 (0.0%) |
| Manufacturing | 117 (66.1%) | 60 (33.9%) |
| Wholesale Trade | 4 (44.4%) | 5 (55.6%) |
| Retail Trade | 27 (45.0%) | 33 (55.0%) |
| Transportation & Warehousing | 11 (100.0%) | 0 (0.0%) |
| Utilities | 0 (0.0%) | 0 (0.0%) |
| Information | 0 (0.0%) | 0 (0.0%) |
| Finance & Insurance | 24 (57.1%) | 18 (42.9%) |
| Real Estate, Rental & Leasing | 15 (100.0%) | 0 (0.0%) |
| Professional & Scientific | 9 (31.0%) | 20 (69.0%) |
| Enterprise Management | 0 (0.0%) | 0 (0.0%) |
| Administrative & Support | 17 (100.0%) | 0 (0.0%) |
| Educational Services | 24 (33.8%) | 47 (66.2%) |
| Health Care & Social Assistance | 5 (12.2%) | 36 (87.8%) |
| Arts, Entertainment & Recreation | 0 (0.0%) | 0 (0.0%) |
| Accommodation & Food Services | 7 (16.7%) | 35 (83.3%) |
| Public Administration | 0 (0.0%) | 0 (0.0%) |
| Total | 280 (52.4%) | 254 (47.6%) |
Education in Marlborough
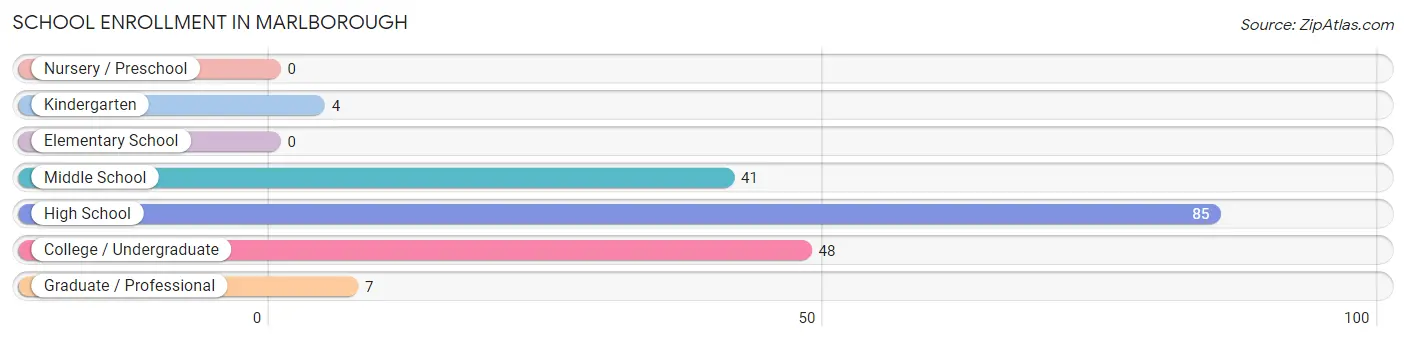
School Enrollment in Marlborough
The most common levels of schooling among the 185 students in Marlborough are high school (85 | 46.0%), college / undergraduate (48 | 26.0%), and middle school (41 | 22.2%).
| School Level | # Students | % Students |
| Nursery / Preschool | 0 | 0.0% |
| Kindergarten | 4 | 2.2% |
| Elementary School | 0 | 0.0% |
| Middle School | 41 | 22.2% |
| High School | 85 | 46.0% |
| College / Undergraduate | 48 | 26.0% |
| Graduate / Professional | 7 | 3.8% |
| Total | 185 | 100.0% |
School Enrollment by Age by Funding Source in Marlborough
Out of a total of 185 students who are enrolled in schools in Marlborough, 51 (27.6%) attend a private institution, while the remaining 134 (72.4%) are enrolled in public schools. The age group of 10 to 14 year olds has the highest likelihood of being enrolled in private schools, with 19 (46.3% in the age bracket) enrolled. Conversely, the age group of 5 to 9 year old has the lowest likelihood of being enrolled in a private school, with 4 (100.0% in the age bracket) attending a public institution.
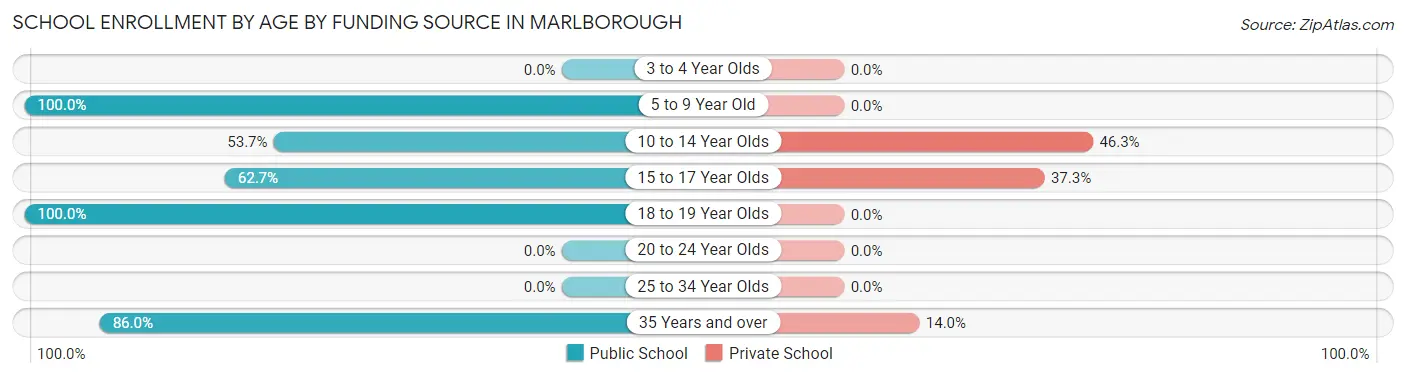
| Age Bracket | Public School | Private School |
| 3 to 4 Year Olds | 0 (0.0%) | 0 (0.0%) |
| 5 to 9 Year Old | 4 (100.0%) | 0 (0.0%) |
| 10 to 14 Year Olds | 22 (53.7%) | 19 (46.3%) |
| 15 to 17 Year Olds | 42 (62.7%) | 25 (37.3%) |
| 18 to 19 Year Olds | 23 (100.0%) | 0 (0.0%) |
| 20 to 24 Year Olds | 0 (0.0%) | 0 (0.0%) |
| 25 to 34 Year Olds | 0 (0.0%) | 0 (0.0%) |
| 35 Years and over | 43 (86.0%) | 7 (14.0%) |
| Total | 134 (72.4%) | 51 (27.6%) |
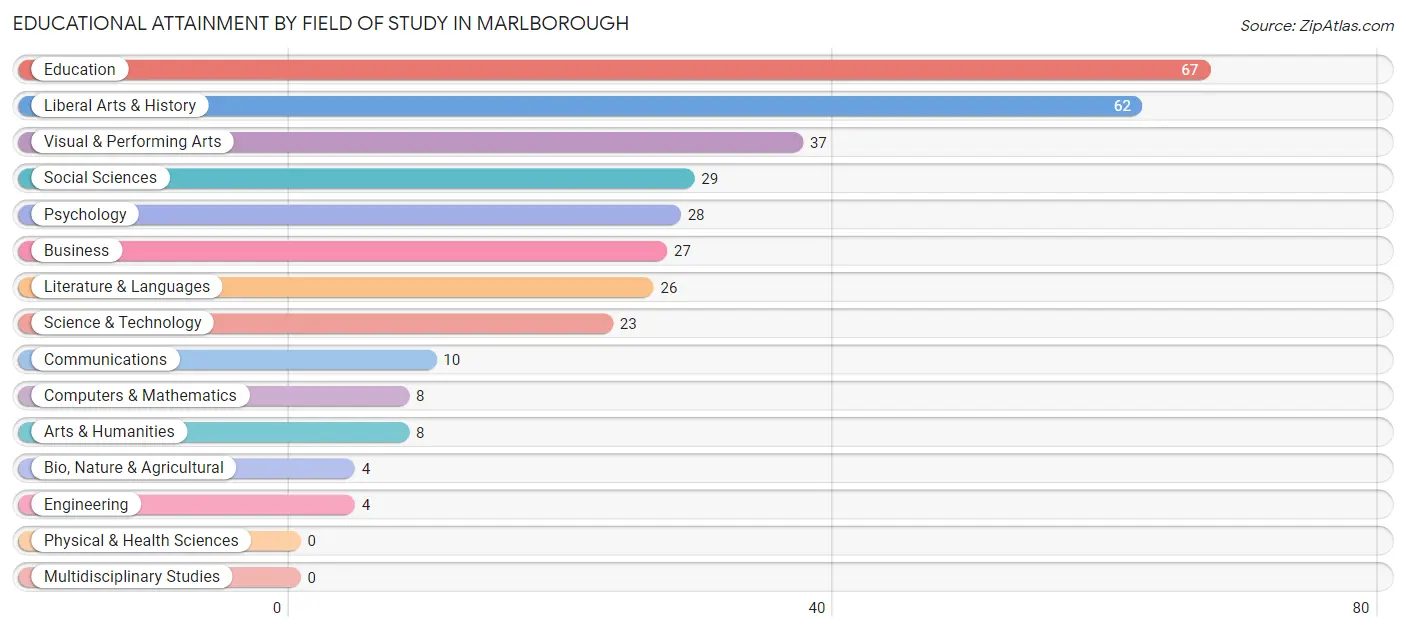
Educational Attainment by Field of Study in Marlborough
Education (67 | 20.1%), liberal arts & history (62 | 18.6%), visual & performing arts (37 | 11.1%), social sciences (29 | 8.7%), and psychology (28 | 8.4%) are the most common fields of study among 333 individuals in Marlborough who have obtained a bachelor's degree or higher.
| Field of Study | # Graduates | % Graduates |
| Computers & Mathematics | 8 | 2.4% |
| Bio, Nature & Agricultural | 4 | 1.2% |
| Physical & Health Sciences | 0 | 0.0% |
| Psychology | 28 | 8.4% |
| Social Sciences | 29 | 8.7% |
| Engineering | 4 | 1.2% |
| Multidisciplinary Studies | 0 | 0.0% |
| Science & Technology | 23 | 6.9% |
| Business | 27 | 8.1% |
| Education | 67 | 20.1% |
| Literature & Languages | 26 | 7.8% |
| Liberal Arts & History | 62 | 18.6% |
| Visual & Performing Arts | 37 | 11.1% |
| Communications | 10 | 3.0% |
| Arts & Humanities | 8 | 2.4% |
| Total | 333 | 100.0% |
Transportation & Commute in Marlborough
Vehicle Availability by Sex in Marlborough
The most prevalent vehicle ownership categories in Marlborough are males with 2 vehicles (162, accounting for 59.1%) and females with 2 vehicles (123, making up 65.3%).
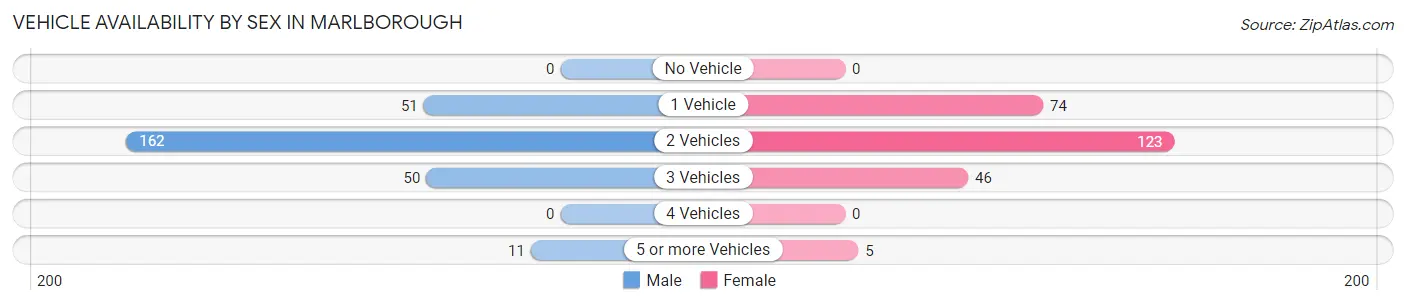
| Vehicles Available | Male | Female |
| No Vehicle | 0 (0.0%) | 0 (0.0%) |
| 1 Vehicle | 51 (18.6%) | 74 (29.8%) |
| 2 Vehicles | 162 (59.1%) | 123 (49.6%) |
| 3 Vehicles | 50 (18.2%) | 46 (18.5%) |
| 4 Vehicles | 0 (0.0%) | 0 (0.0%) |
| 5 or more Vehicles | 11 (4.0%) | 5 (2.0%) |
| Total | 274 (100.0%) | 248 (100.0%) |
Commute Time in Marlborough
The most frequently occuring commute durations in Marlborough are 10 to 14 minutes (100 commuters, 23.0%), 15 to 19 minutes (88 commuters, 20.2%), and 20 to 24 minutes (77 commuters, 17.7%).
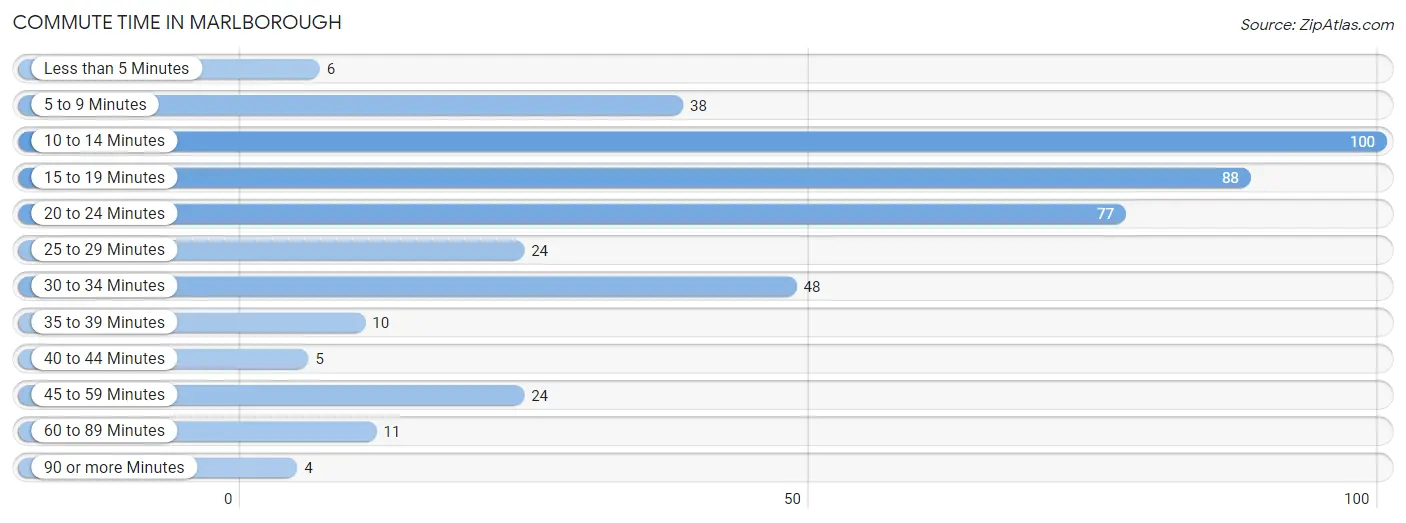
| Commute Time | # Commuters | % Commuters |
| Less than 5 Minutes | 6 | 1.4% |
| 5 to 9 Minutes | 38 | 8.7% |
| 10 to 14 Minutes | 100 | 23.0% |
| 15 to 19 Minutes | 88 | 20.2% |
| 20 to 24 Minutes | 77 | 17.7% |
| 25 to 29 Minutes | 24 | 5.5% |
| 30 to 34 Minutes | 48 | 11.0% |
| 35 to 39 Minutes | 10 | 2.3% |
| 40 to 44 Minutes | 5 | 1.1% |
| 45 to 59 Minutes | 24 | 5.5% |
| 60 to 89 Minutes | 11 | 2.5% |
| 90 or more Minutes | 4 | 0.9% |
Commute Time by Sex in Marlborough
The most common commute times in Marlborough are 10 to 14 minutes (48 commuters, 22.1%) for males and 10 to 14 minutes (52 commuters, 23.8%) for females.
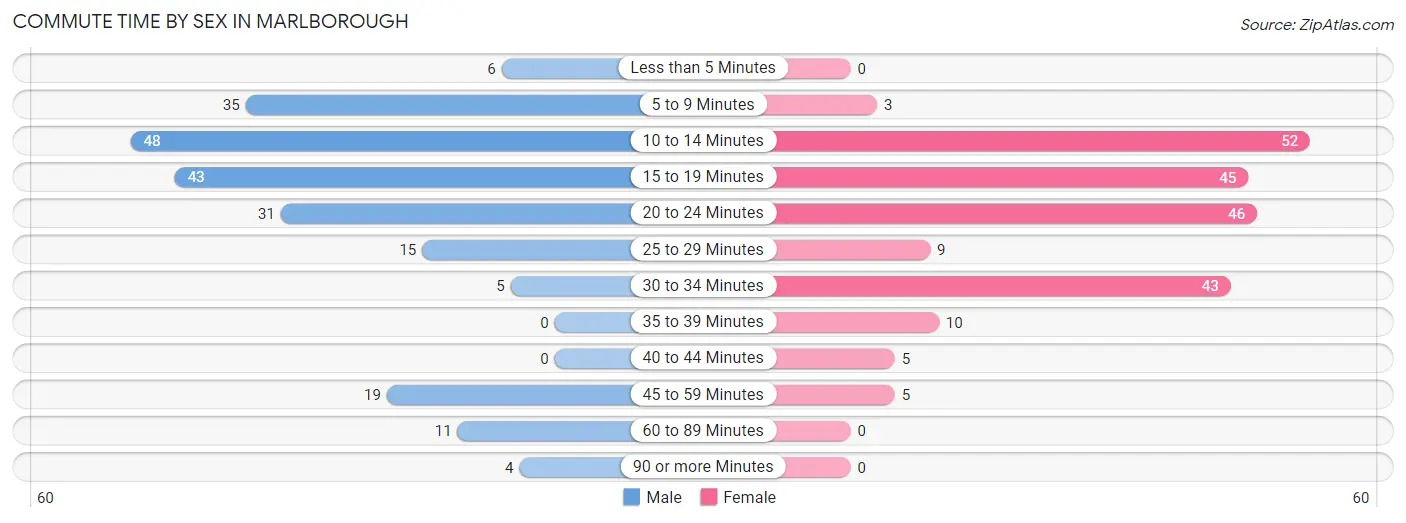
| Commute Time | Male | Female |
| Less than 5 Minutes | 6 (2.8%) | 0 (0.0%) |
| 5 to 9 Minutes | 35 (16.1%) | 3 (1.4%) |
| 10 to 14 Minutes | 48 (22.1%) | 52 (23.8%) |
| 15 to 19 Minutes | 43 (19.8%) | 45 (20.6%) |
| 20 to 24 Minutes | 31 (14.3%) | 46 (21.1%) |
| 25 to 29 Minutes | 15 (6.9%) | 9 (4.1%) |
| 30 to 34 Minutes | 5 (2.3%) | 43 (19.7%) |
| 35 to 39 Minutes | 0 (0.0%) | 10 (4.6%) |
| 40 to 44 Minutes | 0 (0.0%) | 5 (2.3%) |
| 45 to 59 Minutes | 19 (8.8%) | 5 (2.3%) |
| 60 to 89 Minutes | 11 (5.1%) | 0 (0.0%) |
| 90 or more Minutes | 4 (1.8%) | 0 (0.0%) |
Time of Departure to Work by Sex in Marlborough
The most frequent times of departure to work in Marlborough are 6:30 AM to 6:59 AM (50, 23.0%) for males and 12:00 AM to 4:59 AM (39, 17.9%) for females.
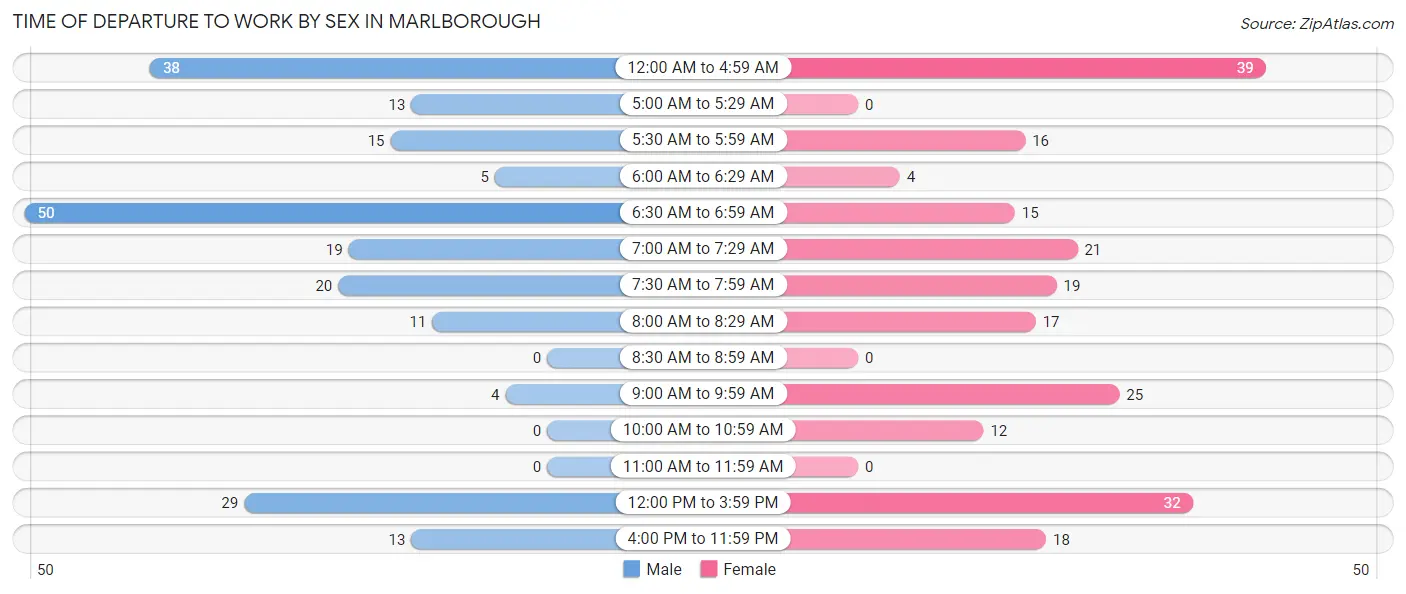
| Time of Departure | Male | Female |
| 12:00 AM to 4:59 AM | 38 (17.5%) | 39 (17.9%) |
| 5:00 AM to 5:29 AM | 13 (6.0%) | 0 (0.0%) |
| 5:30 AM to 5:59 AM | 15 (6.9%) | 16 (7.3%) |
| 6:00 AM to 6:29 AM | 5 (2.3%) | 4 (1.8%) |
| 6:30 AM to 6:59 AM | 50 (23.0%) | 15 (6.9%) |
| 7:00 AM to 7:29 AM | 19 (8.8%) | 21 (9.6%) |
| 7:30 AM to 7:59 AM | 20 (9.2%) | 19 (8.7%) |
| 8:00 AM to 8:29 AM | 11 (5.1%) | 17 (7.8%) |
| 8:30 AM to 8:59 AM | 0 (0.0%) | 0 (0.0%) |
| 9:00 AM to 9:59 AM | 4 (1.8%) | 25 (11.5%) |
| 10:00 AM to 10:59 AM | 0 (0.0%) | 12 (5.5%) |
| 11:00 AM to 11:59 AM | 0 (0.0%) | 0 (0.0%) |
| 12:00 PM to 3:59 PM | 29 (13.4%) | 32 (14.7%) |
| 4:00 PM to 11:59 PM | 13 (6.0%) | 18 (8.3%) |
| Total | 217 (100.0%) | 218 (100.0%) |
Housing Occupancy in Marlborough
Occupancy by Ownership in Marlborough
Of the total 483 dwellings in Marlborough, owner-occupied units account for 228 (47.2%), while renter-occupied units make up 255 (52.8%).
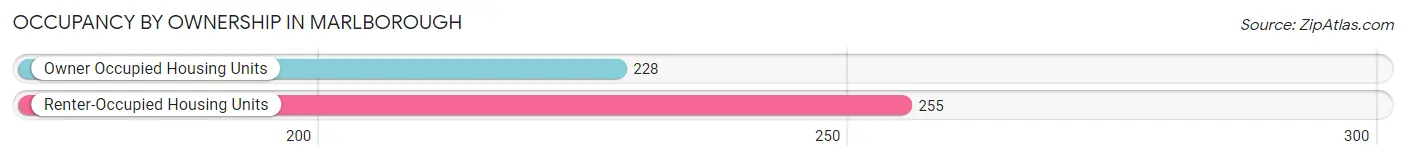
| Occupancy | # Housing Units | % Housing Units |
| Owner Occupied Housing Units | 228 | 47.2% |
| Renter-Occupied Housing Units | 255 | 52.8% |
| Total Occupied Housing Units | 483 | 100.0% |
Occupancy by Household Size in Marlborough
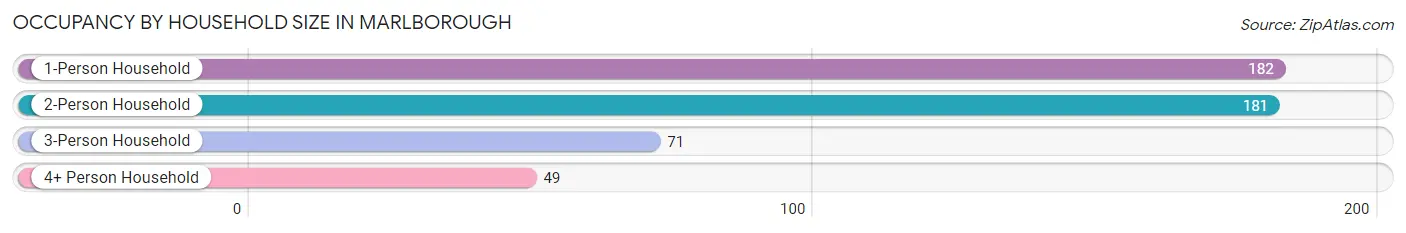
| Household Size | # Housing Units | % Housing Units |
| 1-Person Household | 182 | 37.7% |
| 2-Person Household | 181 | 37.5% |
| 3-Person Household | 71 | 14.7% |
| 4+ Person Household | 49 | 10.1% |
| Total Housing Units | 483 | 100.0% |
Occupancy by Ownership by Household Size in Marlborough
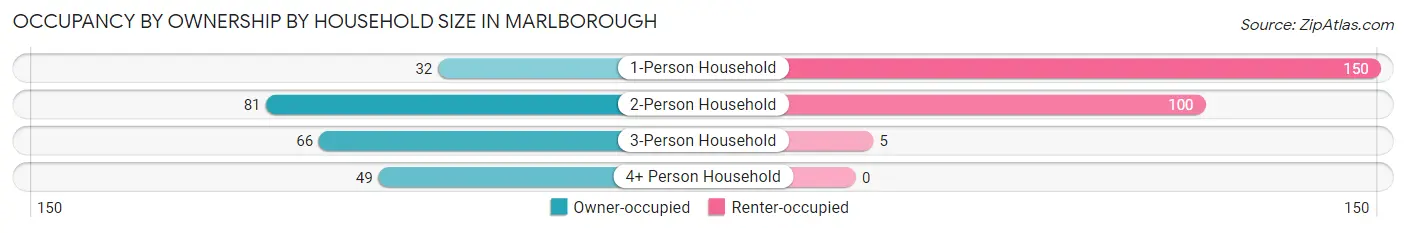
| Household Size | Owner-occupied | Renter-occupied |
| 1-Person Household | 32 (17.6%) | 150 (82.4%) |
| 2-Person Household | 81 (44.8%) | 100 (55.2%) |
| 3-Person Household | 66 (93.0%) | 5 (7.0%) |
| 4+ Person Household | 49 (100.0%) | 0 (0.0%) |
| Total Housing Units | 228 (47.2%) | 255 (52.8%) |
Occupancy by Educational Attainment in Marlborough
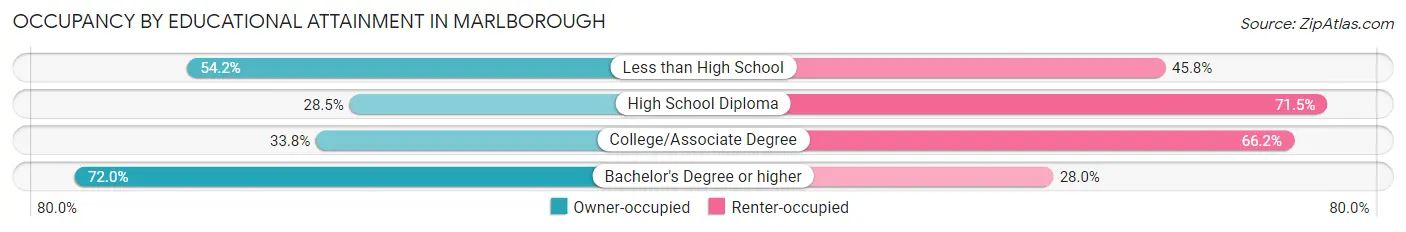
| Household Size | Owner-occupied | Renter-occupied |
| Less than High School | 13 (54.2%) | 11 (45.8%) |
| High School Diploma | 37 (28.5%) | 93 (71.5%) |
| College/Associate Degree | 52 (33.8%) | 102 (66.2%) |
| Bachelor's Degree or higher | 126 (72.0%) | 49 (28.0%) |
Occupancy by Age of Householder in Marlborough
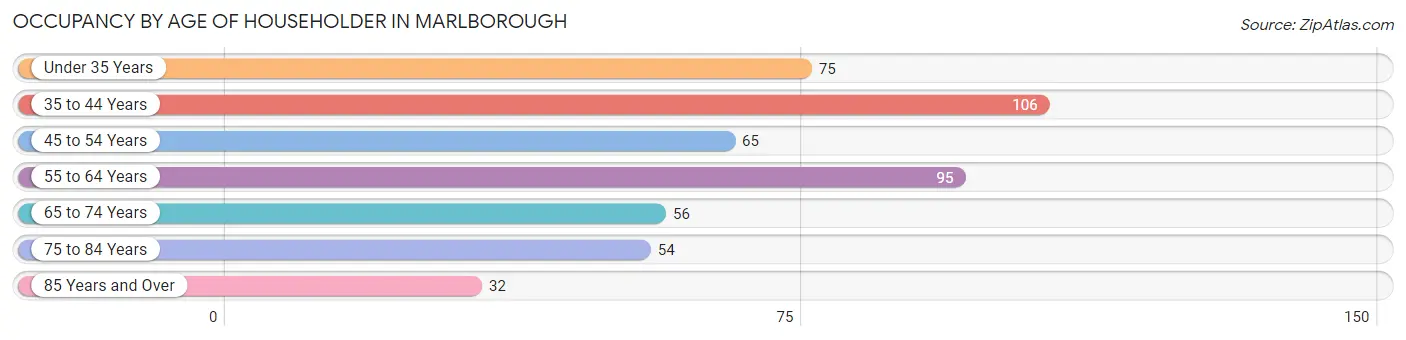
| Age Bracket | # Households | % Households |
| Under 35 Years | 75 | 15.5% |
| 35 to 44 Years | 106 | 22.0% |
| 45 to 54 Years | 65 | 13.5% |
| 55 to 64 Years | 95 | 19.7% |
| 65 to 74 Years | 56 | 11.6% |
| 75 to 84 Years | 54 | 11.2% |
| 85 Years and Over | 32 | 6.6% |
| Total | 483 | 100.0% |
Housing Finances in Marlborough
Median Income by Occupancy in Marlborough
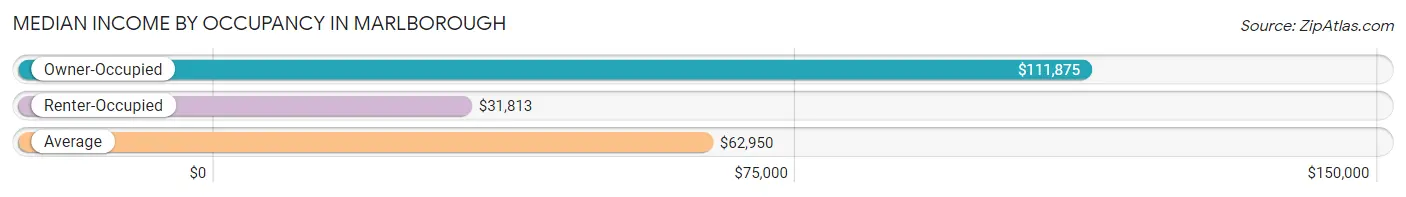
| Occupancy Type | # Households | Median Income |
| Owner-Occupied | 228 (47.2%) | $111,875 |
| Renter-Occupied | 255 (52.8%) | $31,813 |
| Average | 483 (100.0%) | $62,950 |
Occupancy by Householder Income Bracket in Marlborough
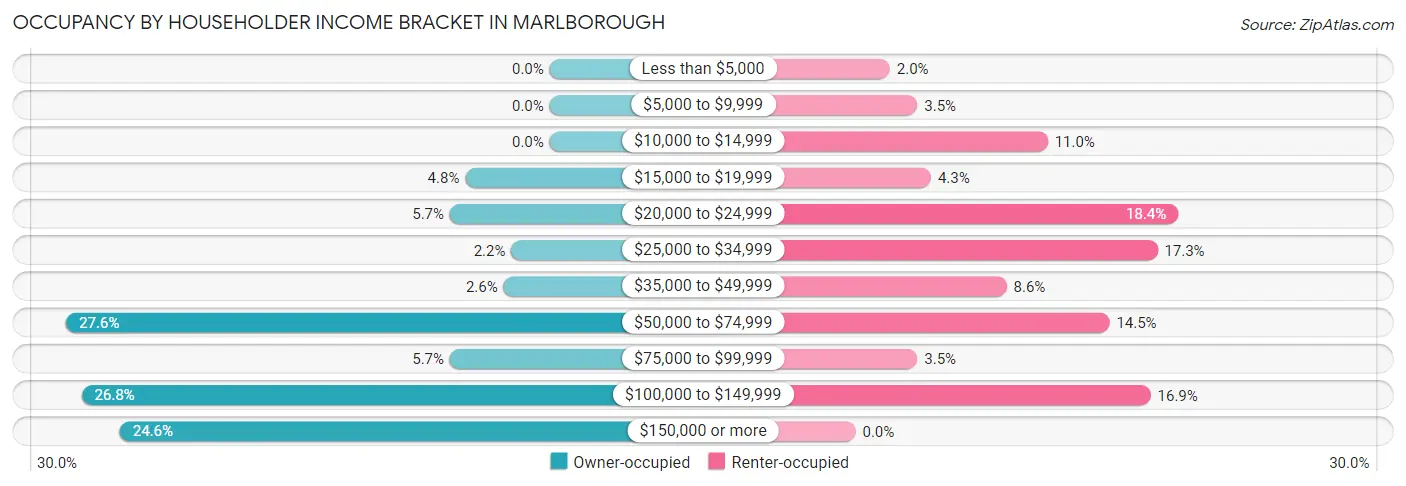
| Income Bracket | Owner-occupied | Renter-occupied |
| Less than $5,000 | 0 (0.0%) | 5 (2.0%) |
| $5,000 to $9,999 | 0 (0.0%) | 9 (3.5%) |
| $10,000 to $14,999 | 0 (0.0%) | 28 (11.0%) |
| $15,000 to $19,999 | 11 (4.8%) | 11 (4.3%) |
| $20,000 to $24,999 | 13 (5.7%) | 47 (18.4%) |
| $25,000 to $34,999 | 5 (2.2%) | 44 (17.2%) |
| $35,000 to $49,999 | 6 (2.6%) | 22 (8.6%) |
| $50,000 to $74,999 | 63 (27.6%) | 37 (14.5%) |
| $75,000 to $99,999 | 13 (5.7%) | 9 (3.5%) |
| $100,000 to $149,999 | 61 (26.8%) | 43 (16.9%) |
| $150,000 or more | 56 (24.6%) | 0 (0.0%) |
| Total | 228 (100.0%) | 255 (100.0%) |
Monthly Housing Cost Tiers in Marlborough
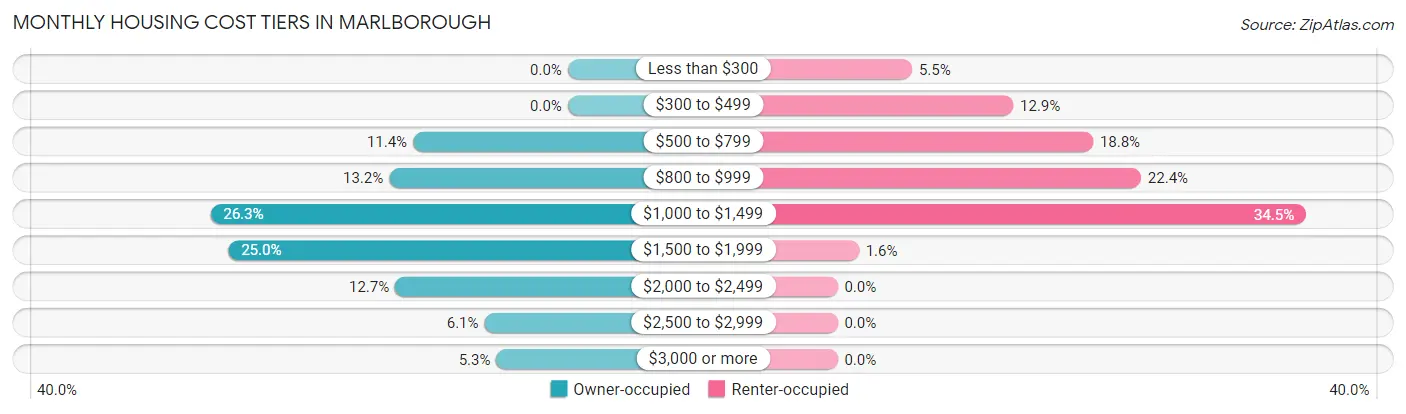
| Monthly Cost | Owner-occupied | Renter-occupied |
| Less than $300 | 0 (0.0%) | 14 (5.5%) |
| $300 to $499 | 0 (0.0%) | 33 (12.9%) |
| $500 to $799 | 26 (11.4%) | 48 (18.8%) |
| $800 to $999 | 30 (13.2%) | 57 (22.4%) |
| $1,000 to $1,499 | 60 (26.3%) | 88 (34.5%) |
| $1,500 to $1,999 | 57 (25.0%) | 4 (1.6%) |
| $2,000 to $2,499 | 29 (12.7%) | 0 (0.0%) |
| $2,500 to $2,999 | 14 (6.1%) | 0 (0.0%) |
| $3,000 or more | 12 (5.3%) | 0 (0.0%) |
| Total | 228 (100.0%) | 255 (100.0%) |
Physical Housing Characteristics in Marlborough
Housing Structures in Marlborough
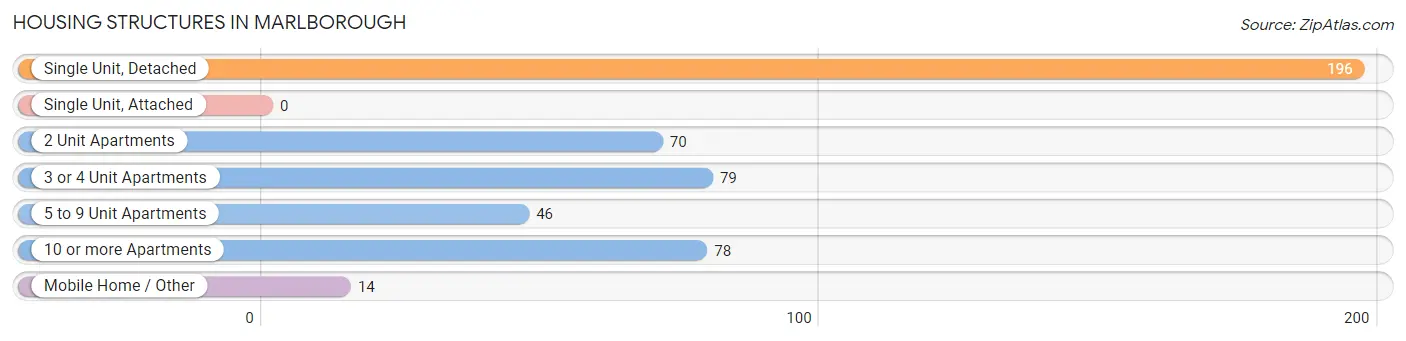
| Structure Type | # Housing Units | % Housing Units |
| Single Unit, Detached | 196 | 40.6% |
| Single Unit, Attached | 0 | 0.0% |
| 2 Unit Apartments | 70 | 14.5% |
| 3 or 4 Unit Apartments | 79 | 16.4% |
| 5 to 9 Unit Apartments | 46 | 9.5% |
| 10 or more Apartments | 78 | 16.2% |
| Mobile Home / Other | 14 | 2.9% |
| Total | 483 | 100.0% |
Housing Structures by Occupancy in Marlborough
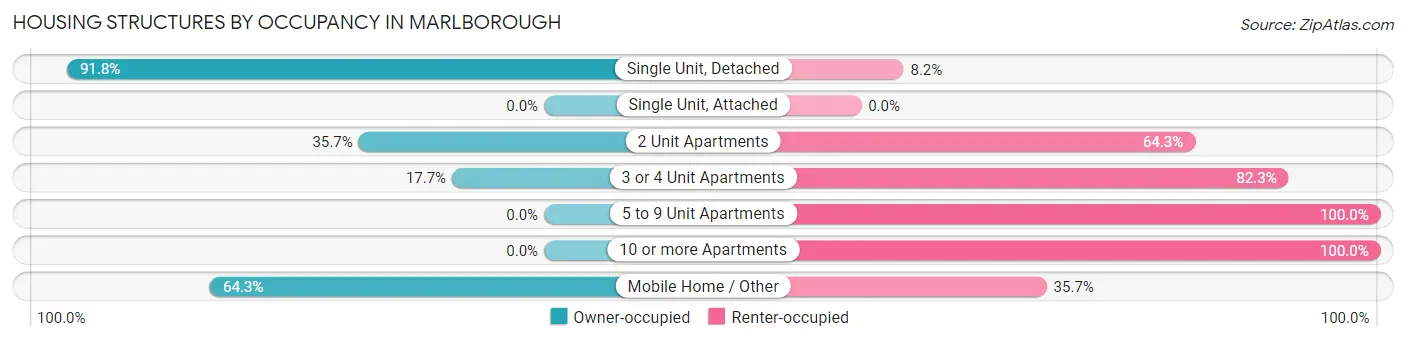
| Structure Type | Owner-occupied | Renter-occupied |
| Single Unit, Detached | 180 (91.8%) | 16 (8.2%) |
| Single Unit, Attached | 0 (0.0%) | 0 (0.0%) |
| 2 Unit Apartments | 25 (35.7%) | 45 (64.3%) |
| 3 or 4 Unit Apartments | 14 (17.7%) | 65 (82.3%) |
| 5 to 9 Unit Apartments | 0 (0.0%) | 46 (100.0%) |
| 10 or more Apartments | 0 (0.0%) | 78 (100.0%) |
| Mobile Home / Other | 9 (64.3%) | 5 (35.7%) |
| Total | 228 (47.2%) | 255 (52.8%) |
Housing Structures by Number of Rooms in Marlborough
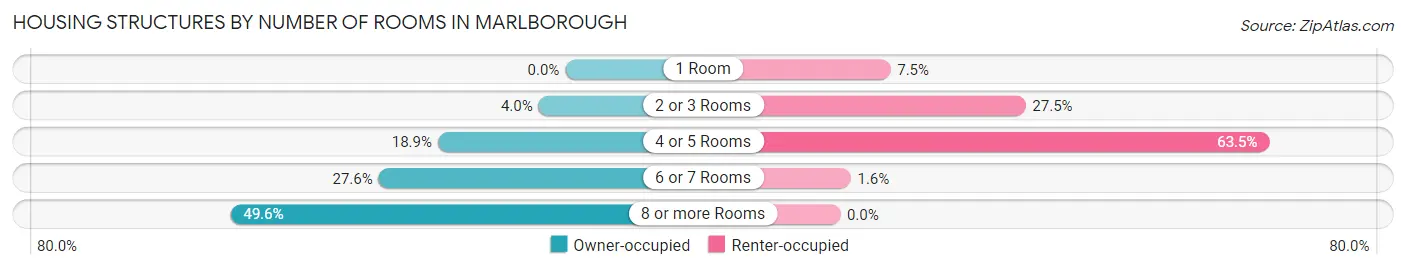
| Number of Rooms | Owner-occupied | Renter-occupied |
| 1 Room | 0 (0.0%) | 19 (7.4%) |
| 2 or 3 Rooms | 9 (4.0%) | 70 (27.5%) |
| 4 or 5 Rooms | 43 (18.9%) | 162 (63.5%) |
| 6 or 7 Rooms | 63 (27.6%) | 4 (1.6%) |
| 8 or more Rooms | 113 (49.6%) | 0 (0.0%) |
| Total | 228 (100.0%) | 255 (100.0%) |
Housing Structure by Heating Type in Marlborough
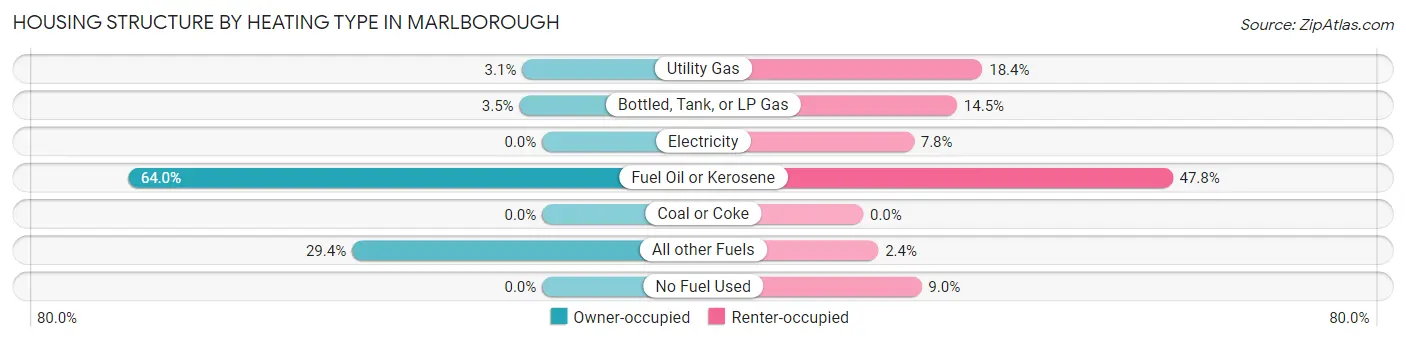
| Heating Type | Owner-occupied | Renter-occupied |
| Utility Gas | 7 (3.1%) | 47 (18.4%) |
| Bottled, Tank, or LP Gas | 8 (3.5%) | 37 (14.5%) |
| Electricity | 0 (0.0%) | 20 (7.8%) |
| Fuel Oil or Kerosene | 146 (64.0%) | 122 (47.8%) |
| Coal or Coke | 0 (0.0%) | 0 (0.0%) |
| All other Fuels | 67 (29.4%) | 6 (2.4%) |
| No Fuel Used | 0 (0.0%) | 23 (9.0%) |
| Total | 228 (100.0%) | 255 (100.0%) |
Household Vehicle Usage in Marlborough
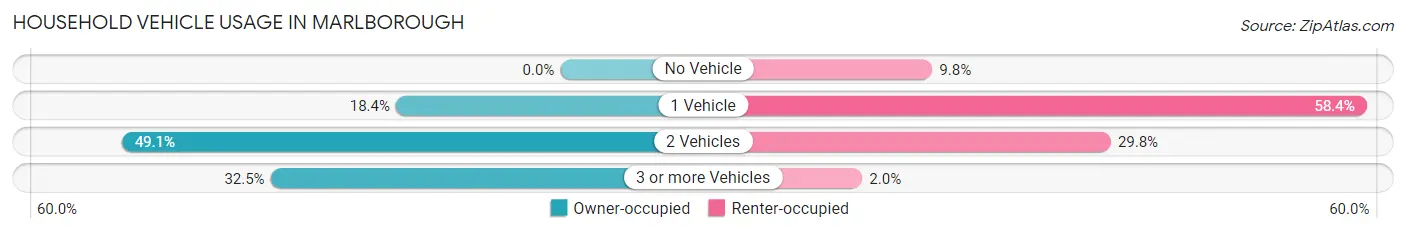
| Vehicles per Household | Owner-occupied | Renter-occupied |
| No Vehicle | 0 (0.0%) | 25 (9.8%) |
| 1 Vehicle | 42 (18.4%) | 149 (58.4%) |
| 2 Vehicles | 112 (49.1%) | 76 (29.8%) |
| 3 or more Vehicles | 74 (32.5%) | 5 (2.0%) |
| Total | 228 (100.0%) | 255 (100.0%) |
Real Estate & Mortgages in Marlborough
Real Estate and Mortgage Overview in Marlborough
| Characteristic | Without Mortgage | With Mortgage |
| Housing Units | 101 | 127 |
| Median Property Value | $260,700 | $227,100 |
| Median Household Income | $64,050 | $41 |
| Monthly Housing Costs | $882 | $12 |
| Real Estate Taxes | $6,442 | $10 |
Property Value by Mortgage Status in Marlborough
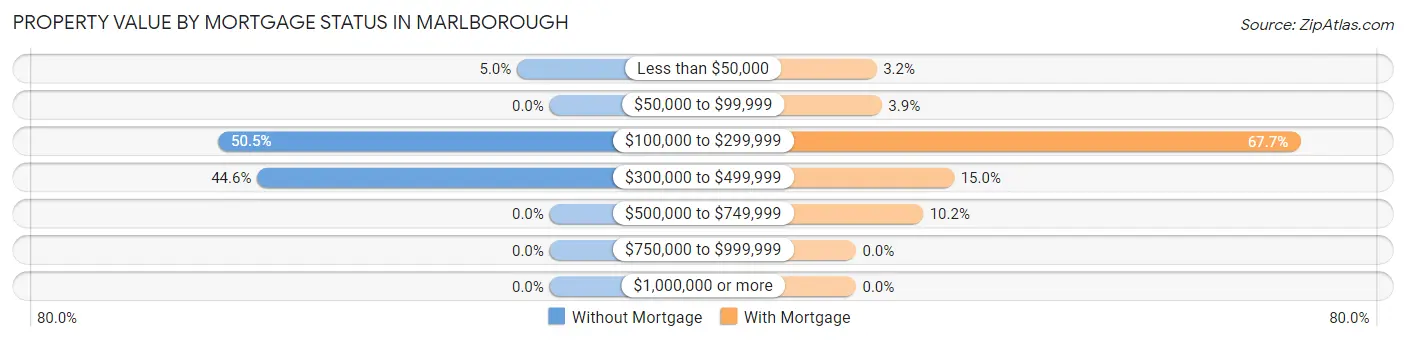
| Property Value | Without Mortgage | With Mortgage |
| Less than $50,000 | 5 (5.0%) | 4 (3.2%) |
| $50,000 to $99,999 | 0 (0.0%) | 5 (3.9%) |
| $100,000 to $299,999 | 51 (50.5%) | 86 (67.7%) |
| $300,000 to $499,999 | 45 (44.6%) | 19 (15.0%) |
| $500,000 to $749,999 | 0 (0.0%) | 13 (10.2%) |
| $750,000 to $999,999 | 0 (0.0%) | 0 (0.0%) |
| $1,000,000 or more | 0 (0.0%) | 0 (0.0%) |
| Total | 101 (100.0%) | 127 (100.0%) |
Household Income by Mortgage Status in Marlborough
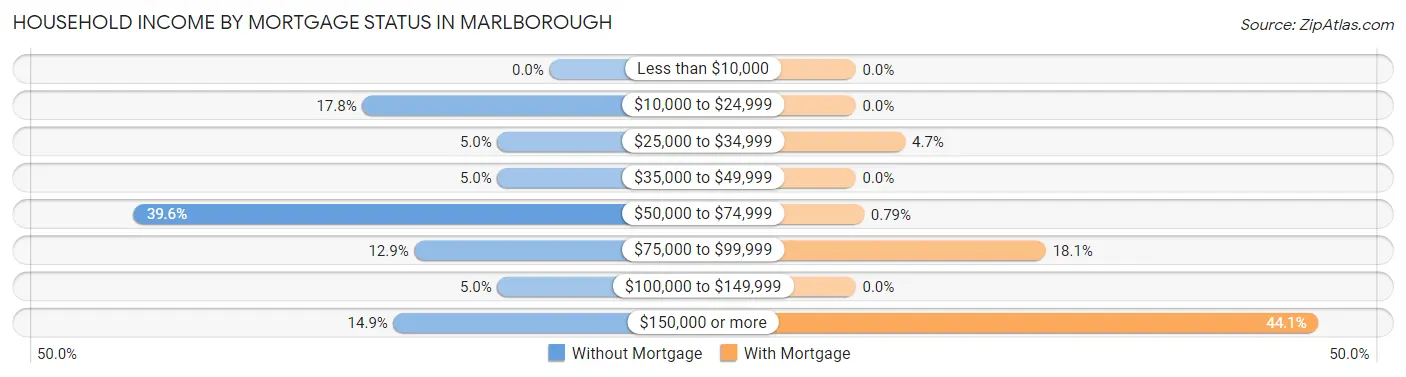
| Household Income | Without Mortgage | With Mortgage |
| Less than $10,000 | 0 (0.0%) | 0 (0.0%) |
| $10,000 to $24,999 | 18 (17.8%) | 0 (0.0%) |
| $25,000 to $34,999 | 5 (5.0%) | 6 (4.7%) |
| $35,000 to $49,999 | 5 (5.0%) | 0 (0.0%) |
| $50,000 to $74,999 | 40 (39.6%) | 1 (0.8%) |
| $75,000 to $99,999 | 13 (12.9%) | 23 (18.1%) |
| $100,000 to $149,999 | 5 (5.0%) | 0 (0.0%) |
| $150,000 or more | 15 (14.8%) | 56 (44.1%) |
| Total | 101 (100.0%) | 127 (100.0%) |
Property Value to Household Income Ratio in Marlborough
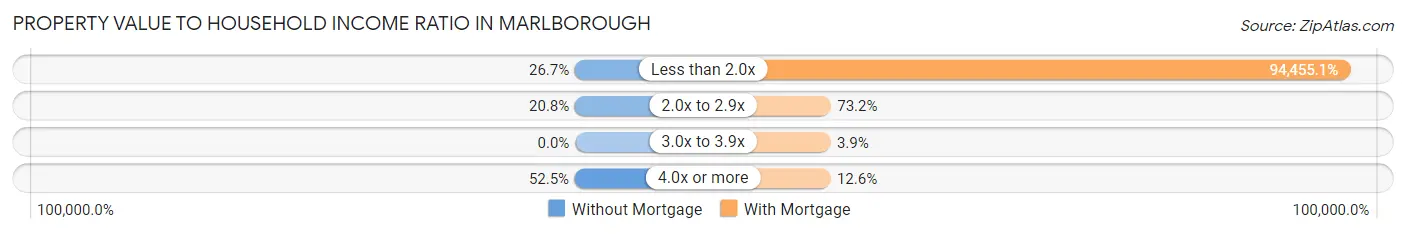
| Value-to-Income Ratio | Without Mortgage | With Mortgage |
| Less than 2.0x | 27 (26.7%) | 119,958 (94,455.1%) |
| 2.0x to 2.9x | 21 (20.8%) | 93 (73.2%) |
| 3.0x to 3.9x | 0 (0.0%) | 5 (3.9%) |
| 4.0x or more | 53 (52.5%) | 16 (12.6%) |
| Total | 101 (100.0%) | 127 (100.0%) |
Real Estate Taxes by Mortgage Status in Marlborough
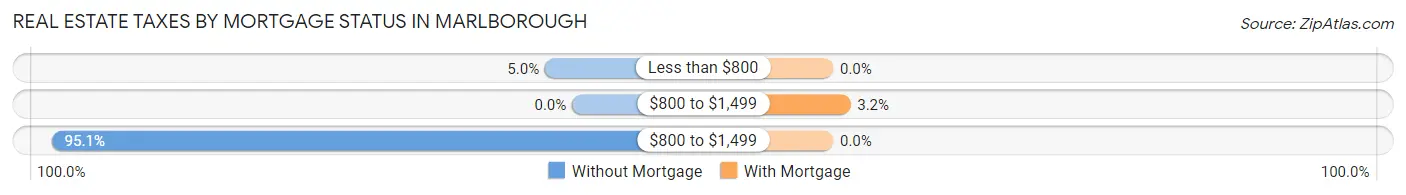
| Property Taxes | Without Mortgage | With Mortgage |
| Less than $800 | 5 (5.0%) | 0 (0.0%) |
| $800 to $1,499 | 0 (0.0%) | 4 (3.2%) |
| $800 to $1,499 | 96 (95.1%) | 0 (0.0%) |
| Total | 101 (100.0%) | 127 (100.0%) |
Health & Disability in Marlborough
Health Insurance Coverage by Age in Marlborough
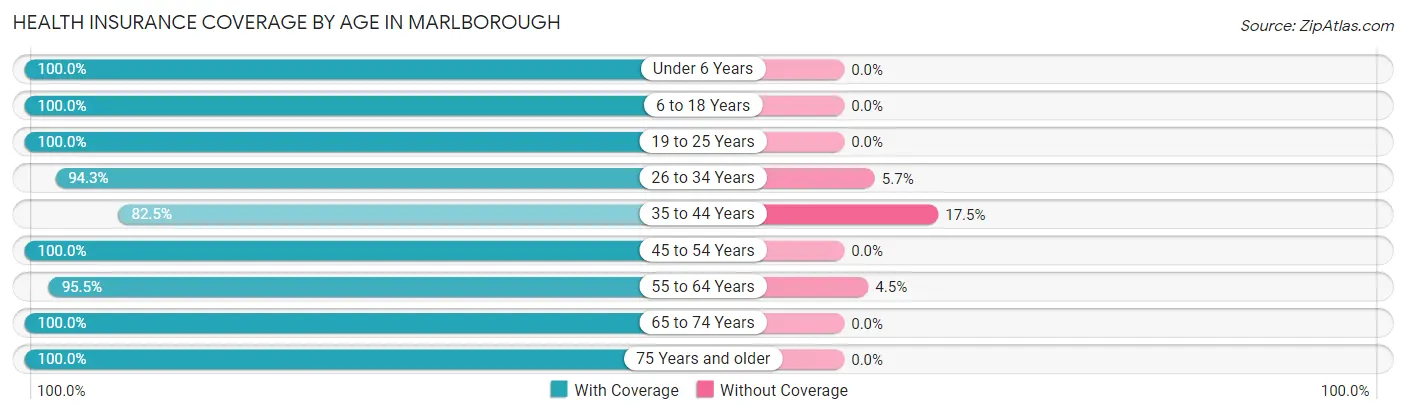
| Age Bracket | With Coverage | Without Coverage |
| Under 6 Years | 35 (100.0%) | 0 (0.0%) |
| 6 to 18 Years | 135 (100.0%) | 0 (0.0%) |
| 19 to 25 Years | 78 (100.0%) | 0 (0.0%) |
| 26 to 34 Years | 66 (94.3%) | 4 (5.7%) |
| 35 to 44 Years | 127 (82.5%) | 27 (17.5%) |
| 45 to 54 Years | 126 (100.0%) | 0 (0.0%) |
| 55 to 64 Years | 191 (95.5%) | 9 (4.5%) |
| 65 to 74 Years | 71 (100.0%) | 0 (0.0%) |
| 75 Years and older | 122 (100.0%) | 0 (0.0%) |
| Total | 951 (96.0%) | 40 (4.0%) |
Health Insurance Coverage by Citizenship Status in Marlborough
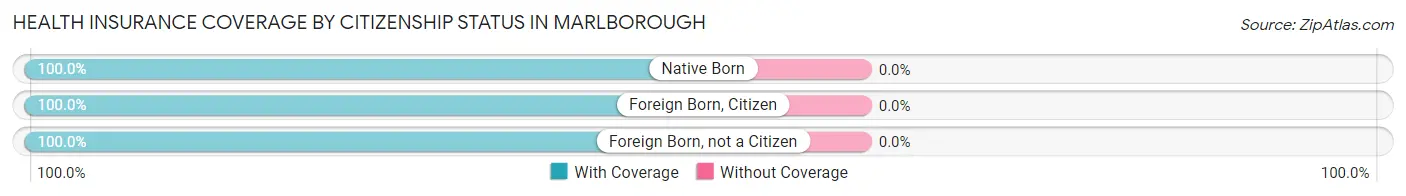
| Citizenship Status | With Coverage | Without Coverage |
| Native Born | 35 (100.0%) | 0 (0.0%) |
| Foreign Born, Citizen | 135 (100.0%) | 0 (0.0%) |
| Foreign Born, not a Citizen | 78 (100.0%) | 0 (0.0%) |
Health Insurance Coverage by Household Income in Marlborough
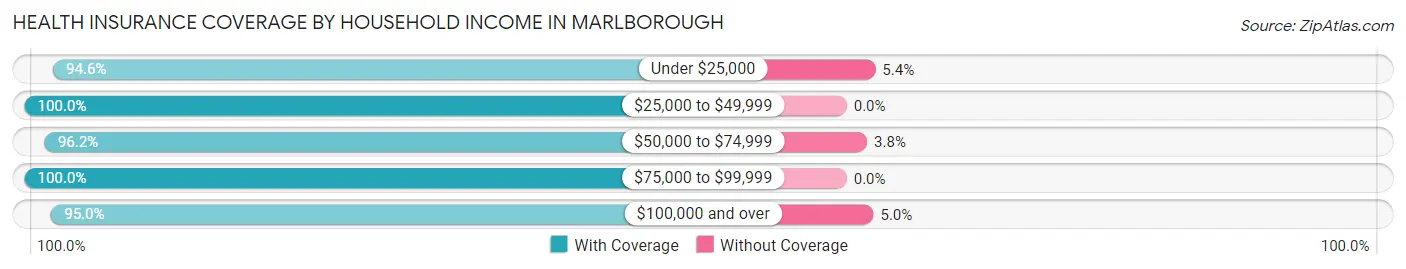
| Household Income | With Coverage | Without Coverage |
| Under $25,000 | 159 (94.6%) | 9 (5.4%) |
| $25,000 to $49,999 | 110 (100.0%) | 0 (0.0%) |
| $50,000 to $74,999 | 202 (96.2%) | 8 (3.8%) |
| $75,000 to $99,999 | 44 (100.0%) | 0 (0.0%) |
| $100,000 and over | 436 (95.0%) | 23 (5.0%) |
Public vs Private Health Insurance Coverage by Age in Marlborough
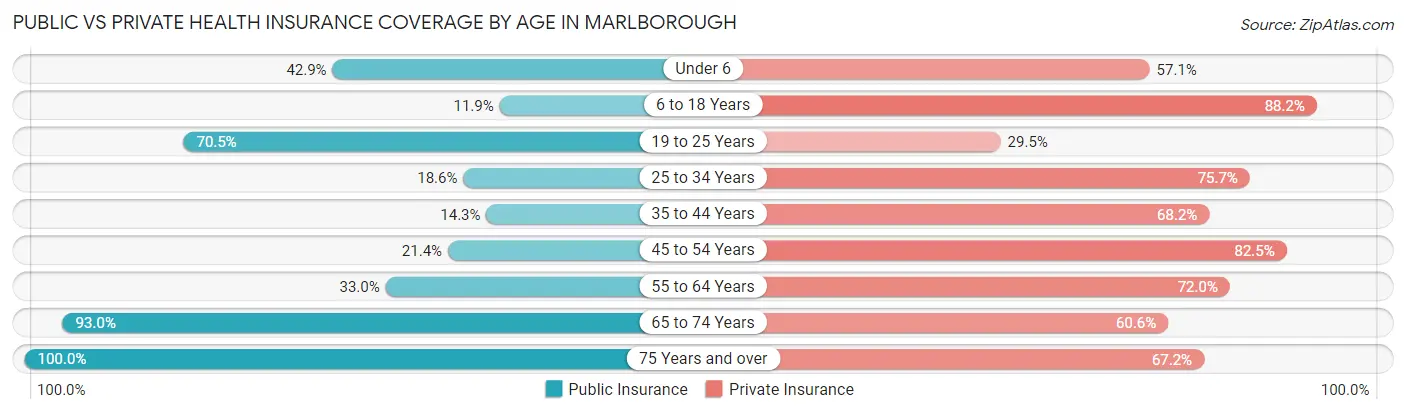
| Age Bracket | Public Insurance | Private Insurance |
| Under 6 | 15 (42.9%) | 20 (57.1%) |
| 6 to 18 Years | 16 (11.8%) | 119 (88.1%) |
| 19 to 25 Years | 55 (70.5%) | 23 (29.5%) |
| 25 to 34 Years | 13 (18.6%) | 53 (75.7%) |
| 35 to 44 Years | 22 (14.3%) | 105 (68.2%) |
| 45 to 54 Years | 27 (21.4%) | 104 (82.5%) |
| 55 to 64 Years | 66 (33.0%) | 144 (72.0%) |
| 65 to 74 Years | 66 (93.0%) | 43 (60.6%) |
| 75 Years and over | 122 (100.0%) | 82 (67.2%) |
| Total | 402 (40.6%) | 693 (69.9%) |
Disability Status by Sex by Age in Marlborough
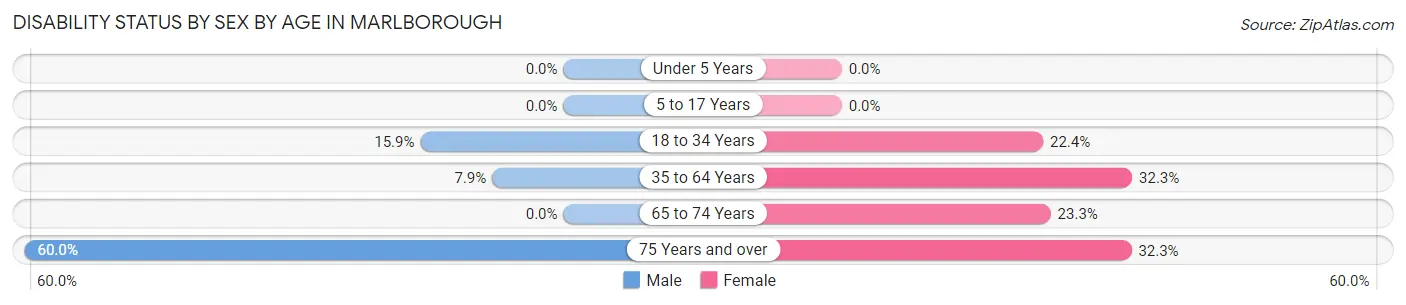
| Age Bracket | Male | Female |
| Under 5 Years | 0 (0.0%) | 0 (0.0%) |
| 5 to 17 Years | 0 (0.0%) | 0 (0.0%) |
| 18 to 34 Years | 18 (15.9%) | 13 (22.4%) |
| 35 to 64 Years | 17 (7.9%) | 86 (32.3%) |
| 65 to 74 Years | 0 (0.0%) | 10 (23.3%) |
| 75 Years and over | 36 (60.0%) | 20 (32.3%) |
Disability Class by Sex by Age in Marlborough
Disability Class: Hearing Difficulty
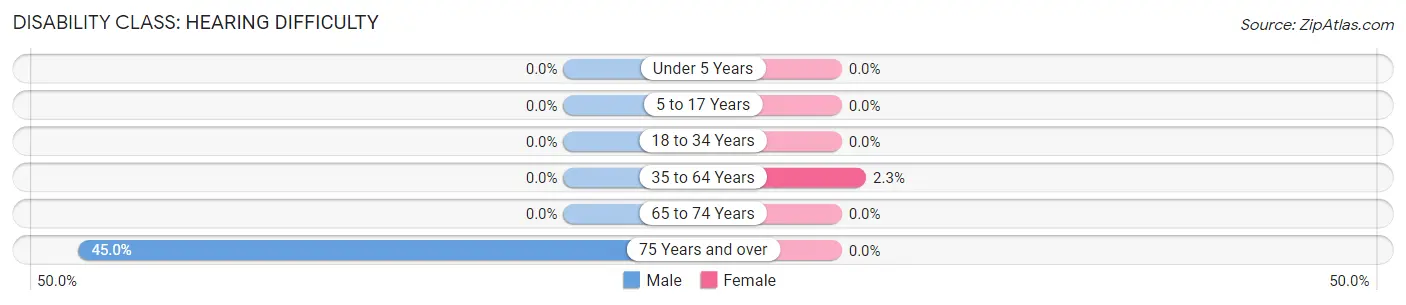
| Age Bracket | Male | Female |
| Under 5 Years | 0 (0.0%) | 0 (0.0%) |
| 5 to 17 Years | 0 (0.0%) | 0 (0.0%) |
| 18 to 34 Years | 0 (0.0%) | 0 (0.0%) |
| 35 to 64 Years | 0 (0.0%) | 6 (2.3%) |
| 65 to 74 Years | 0 (0.0%) | 0 (0.0%) |
| 75 Years and over | 27 (45.0%) | 0 (0.0%) |
Disability Class: Vision Difficulty
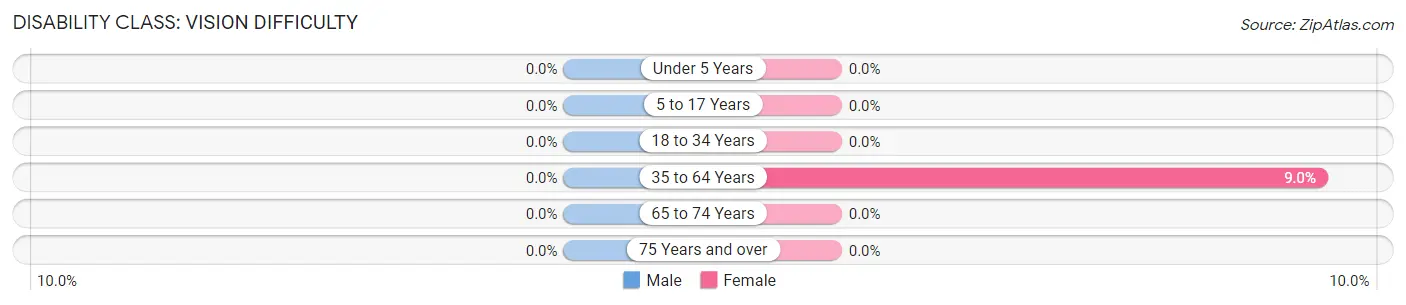
| Age Bracket | Male | Female |
| Under 5 Years | 0 (0.0%) | 0 (0.0%) |
| 5 to 17 Years | 0 (0.0%) | 0 (0.0%) |
| 18 to 34 Years | 0 (0.0%) | 0 (0.0%) |
| 35 to 64 Years | 0 (0.0%) | 24 (9.0%) |
| 65 to 74 Years | 0 (0.0%) | 0 (0.0%) |
| 75 Years and over | 0 (0.0%) | 0 (0.0%) |
Disability Class: Cognitive Difficulty
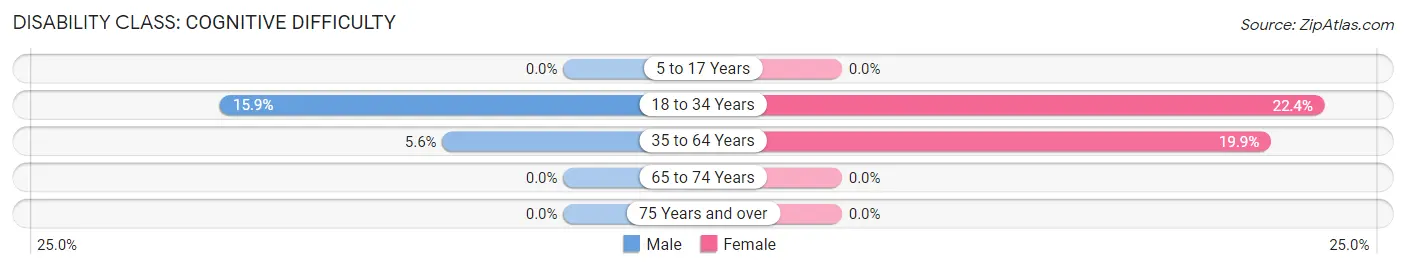
| Age Bracket | Male | Female |
| 5 to 17 Years | 0 (0.0%) | 0 (0.0%) |
| 18 to 34 Years | 18 (15.9%) | 13 (22.4%) |
| 35 to 64 Years | 12 (5.6%) | 53 (19.9%) |
| 65 to 74 Years | 0 (0.0%) | 0 (0.0%) |
| 75 Years and over | 0 (0.0%) | 0 (0.0%) |
Disability Class: Ambulatory Difficulty
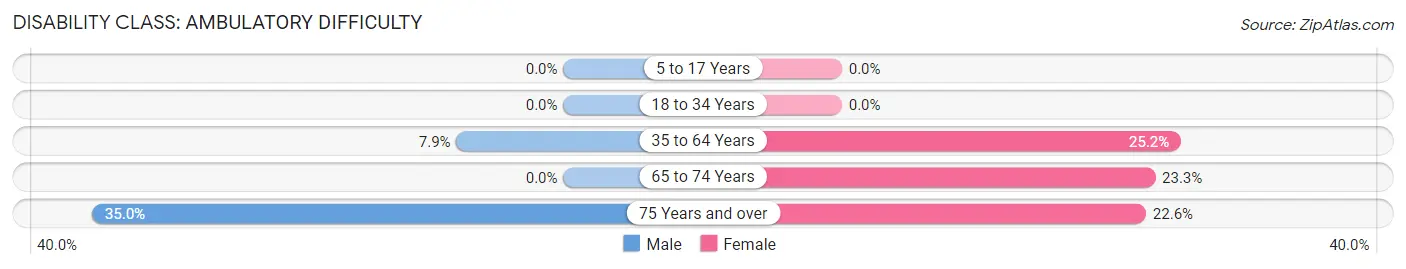
| Age Bracket | Male | Female |
| 5 to 17 Years | 0 (0.0%) | 0 (0.0%) |
| 18 to 34 Years | 0 (0.0%) | 0 (0.0%) |
| 35 to 64 Years | 17 (7.9%) | 67 (25.2%) |
| 65 to 74 Years | 0 (0.0%) | 10 (23.3%) |
| 75 Years and over | 21 (35.0%) | 14 (22.6%) |
Disability Class: Self-Care Difficulty
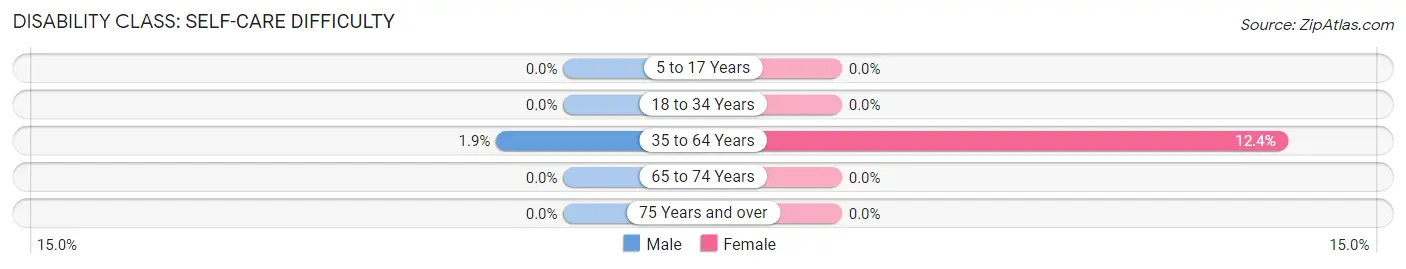
| Age Bracket | Male | Female |
| 5 to 17 Years | 0 (0.0%) | 0 (0.0%) |
| 18 to 34 Years | 0 (0.0%) | 0 (0.0%) |
| 35 to 64 Years | 4 (1.9%) | 33 (12.4%) |
| 65 to 74 Years | 0 (0.0%) | 0 (0.0%) |
| 75 Years and over | 0 (0.0%) | 0 (0.0%) |
Technology Access in Marlborough
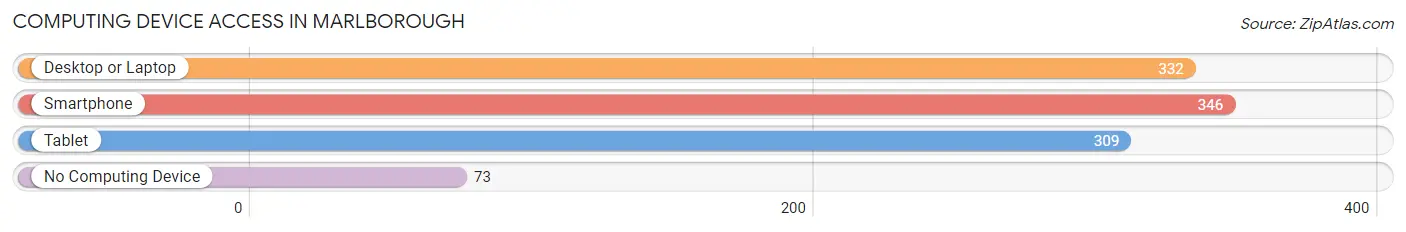
Computing Device Access in Marlborough
| Device Type | # Households | % Households |
| Desktop or Laptop | 332 | 68.7% |
| Smartphone | 346 | 71.6% |
| Tablet | 309 | 64.0% |
| No Computing Device | 73 | 15.1% |
| Total | 483 | 100.0% |
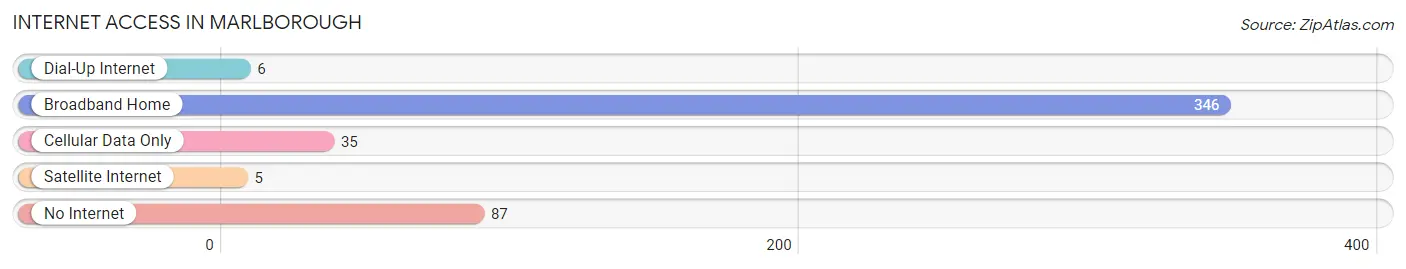
Internet Access in Marlborough
| Internet Type | # Households | % Households |
| Dial-Up Internet | 6 | 1.2% |
| Broadband Home | 346 | 71.6% |
| Cellular Data Only | 35 | 7.2% |
| Satellite Internet | 5 | 1.0% |
| No Internet | 87 | 18.0% |
| Total | 483 | 100.0% |
Marlborough Summary
Marlborough, New Hampshire is a small town located in Hillsborough County, in the southwestern part of the state. It is situated on the banks of the Contoocook River, and is bordered by the towns of Dublin, Antrim, and Bennington. The town has a population of 1,845, as of the 2010 census, and covers an area of 24.2 square miles.
History
Marlborough was first settled in 1763, when a group of settlers from Massachusetts purchased the land from the local Native Americans. The town was incorporated in 1776, and was named after the Duke of Marlborough, John Churchill. The town was primarily an agricultural community, with the main crops being corn, wheat, and hay. In the late 19th century, the town began to develop a small manufacturing industry, with the main products being furniture, shoes, and leather goods.
Geography
Marlborough is located in southwestern New Hampshire, in Hillsborough County. It is situated on the banks of the Contoocook River, and is bordered by the towns of Dublin, Antrim, and Bennington. The town has a total area of 24.2 square miles, of which 24.1 square miles is land and 0.1 square miles is water. The highest point in the town is the summit of Marlborough Mountain, which has an elevation of 1,845 feet.
Economy
Marlborough’s economy is primarily based on agriculture and tourism. The town is home to several small farms, which produce a variety of crops, including corn, wheat, hay, and vegetables. The town also has a small manufacturing industry, which produces furniture, shoes, and leather goods. In addition, the town is home to several small businesses, including restaurants, shops, and lodging establishments.
Demographics
As of the 2010 census, Marlborough had a population of 1,845. The racial makeup of the town was 97.2% White, 0.3% African American, 0.3% Native American, 0.3% Asian, 0.2% from other races, and 1.7% from two or more races. Hispanic or Latino of any race were 0.9% of the population. The median age in the town was 44.2 years, and the median household income was $60,938.
Marlborough is a small town with a rich history and a strong sense of community. The town is home to a variety of businesses and industries, and is a popular destination for tourists. The town has a diverse population, and is a great place to live and work.
Common Questions
What is Per Capita Income in Marlborough?
Per Capita income in Marlborough is $54,235.
What is the Median Family Income in Marlborough?
Median Family Income in Marlborough is $84,000.
What is the Median Household income in Marlborough?
Median Household Income in Marlborough is $62,950.
What is Income or Wage Gap in Marlborough?
Income or Wage Gap in Marlborough is 37.7%.
Women in Marlborough earn 62.3 cents for every dollar earned by a man.
What is Inequality or Gini Index in Marlborough?
Inequality or Gini Index in Marlborough is 0.59.
What is the Total Population of Marlborough?
Total Population of Marlborough is 991.
What is the Total Male Population of Marlborough?
Total Male Population of Marlborough is 488.
What is the Total Female Population of Marlborough?
Total Female Population of Marlborough is 503.
What is the Ratio of Males per 100 Females in Marlborough?
There are 97.02 Males per 100 Females in Marlborough.
What is the Ratio of Females per 100 Males in Marlborough?
There are 103.07 Females per 100 Males in Marlborough.
What is the Median Population Age in Marlborough?
Median Population Age in Marlborough is 50.4 Years.
What is the Average Family Size in Marlborough
Average Family Size in Marlborough is 2.8 People.
What is the Average Household Size in Marlborough
Average Household Size in Marlborough is 2.0 People.
How Large is the Labor Force in Marlborough?
There are 538 People in the Labor Forcein in Marlborough.
What is the Percentage of People in the Labor Force in Marlborough?
59.4% of People are in the Labor Force in Marlborough.
What is the Unemployment Rate in Marlborough?
Unemployment Rate in Marlborough is 0.7%.