Jaffrey, NH Map & Demographics
Jaffrey Map
Jaffrey Overview
$34,798
PER CAPITA INCOME
$117,554
AVG FAMILY INCOME
$86,384
AVG HOUSEHOLD INCOME
43.7%
WAGE / INCOME GAP [ % ]
56.3¢/ $1
WAGE / INCOME GAP [ $ ]
0.36
INEQUALITY / GINI INDEX
3,036
TOTAL POPULATION
1,502
MALE POPULATION
1,534
FEMALE POPULATION
97.91
MALES / 100 FEMALES
102.13
FEMALES / 100 MALES
37.7
MEDIAN AGE
3.4
AVG FAMILY SIZE
2.9
AVG HOUSEHOLD SIZE
1,666
LABOR FORCE [ PEOPLE ]
71.4%
PERCENT IN LABOR FORCE
7.4%
UNEMPLOYMENT RATE
Jaffrey Zip Codes
Jaffrey Area Codes
Income in Jaffrey
Income Overview in Jaffrey
Per Capita Income in Jaffrey is $34,798, while median incomes of families and households are $117,554 and $86,384 respectively.
| Characteristic | Number | Measure |
| Per Capita Income | 3,036 | $34,798 |
| Median Family Income | 714 | $117,554 |
| Mean Family Income | 714 | $118,520 |
| Median Household Income | 1,061 | $86,384 |
| Mean Household Income | 1,061 | $97,472 |
| Income Deficit | 714 | $0 |
| Wage / Income Gap (%) | 3,036 | 43.73% |
| Wage / Income Gap ($) | 3,036 | 56.27¢ per $1 |
| Gini / Inequality Index | 3,036 | 0.36 |
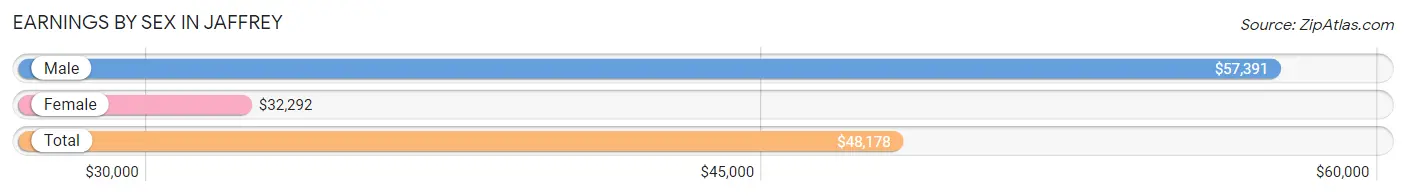
Earnings by Sex in Jaffrey
Average Earnings in Jaffrey are $48,178, $57,391 for men and $32,292 for women, a difference of 43.7%.
| Sex | Number | Average Earnings |
| Male | 864 (50.6%) | $57,391 |
| Female | 845 (49.4%) | $32,292 |
| Total | 1,709 (100.0%) | $48,178 |
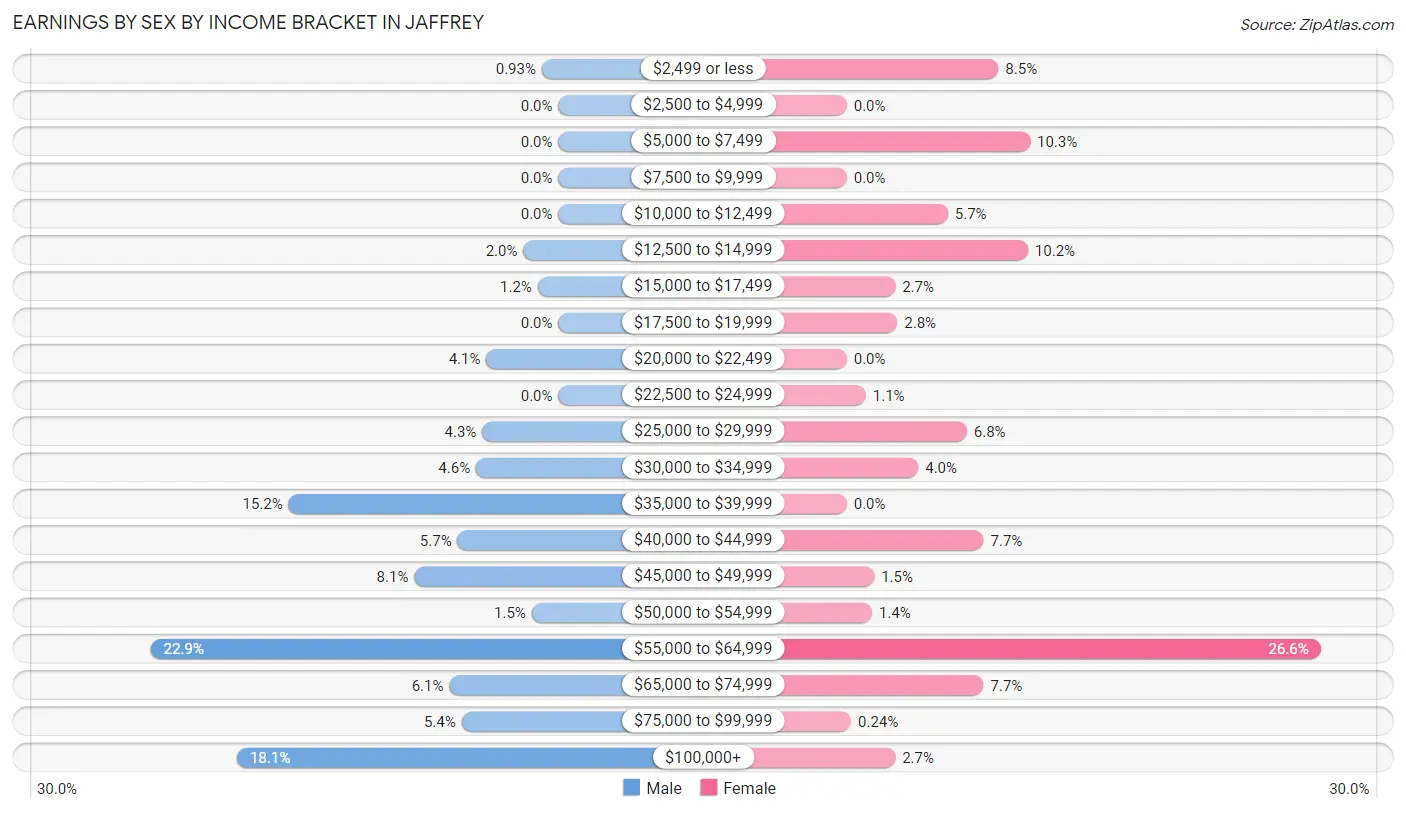
Earnings by Sex by Income Bracket in Jaffrey
The most common earnings brackets in Jaffrey are $55,000 to $64,999 for men (198 | 22.9%) and $55,000 to $64,999 for women (225 | 26.6%).
| Income | Male | Female |
| $2,499 or less | 8 (0.9%) | 72 (8.5%) |
| $2,500 to $4,999 | 0 (0.0%) | 0 (0.0%) |
| $5,000 to $7,499 | 0 (0.0%) | 87 (10.3%) |
| $7,500 to $9,999 | 0 (0.0%) | 0 (0.0%) |
| $10,000 to $12,499 | 0 (0.0%) | 48 (5.7%) |
| $12,500 to $14,999 | 17 (2.0%) | 86 (10.2%) |
| $15,000 to $17,499 | 10 (1.2%) | 23 (2.7%) |
| $17,500 to $19,999 | 0 (0.0%) | 24 (2.8%) |
| $20,000 to $22,499 | 35 (4.1%) | 0 (0.0%) |
| $22,500 to $24,999 | 0 (0.0%) | 9 (1.1%) |
| $25,000 to $29,999 | 37 (4.3%) | 57 (6.8%) |
| $30,000 to $34,999 | 40 (4.6%) | 34 (4.0%) |
| $35,000 to $39,999 | 131 (15.2%) | 0 (0.0%) |
| $40,000 to $44,999 | 49 (5.7%) | 65 (7.7%) |
| $45,000 to $49,999 | 70 (8.1%) | 13 (1.5%) |
| $50,000 to $54,999 | 13 (1.5%) | 12 (1.4%) |
| $55,000 to $64,999 | 198 (22.9%) | 225 (26.6%) |
| $65,000 to $74,999 | 53 (6.1%) | 65 (7.7%) |
| $75,000 to $99,999 | 47 (5.4%) | 2 (0.2%) |
| $100,000+ | 156 (18.1%) | 23 (2.7%) |
| Total | 864 (100.0%) | 845 (100.0%) |
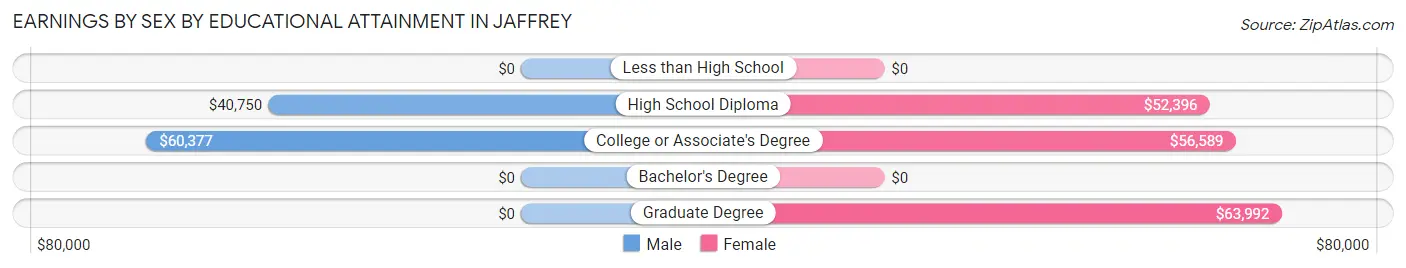
Earnings by Sex by Educational Attainment in Jaffrey
Average earnings in Jaffrey are $55,380 for men and $51,875 for women, a difference of 6.3%. Men with an educational attainment of college or associate's degree enjoy the highest average annual earnings of $60,377, while those with high school diploma education earn the least with $40,750. Women with an educational attainment of graduate degree earn the most with the average annual earnings of $63,992, while those with high school diploma education have the smallest earnings of $52,396.
| Educational Attainment | Male Income | Female Income |
| Less than High School | - | - |
| High School Diploma | $40,750 | $52,396 |
| College or Associate's Degree | $60,377 | $56,589 |
| Bachelor's Degree | - | - |
| Graduate Degree | - | - |
| Total | $55,380 | $51,875 |
Family Income in Jaffrey
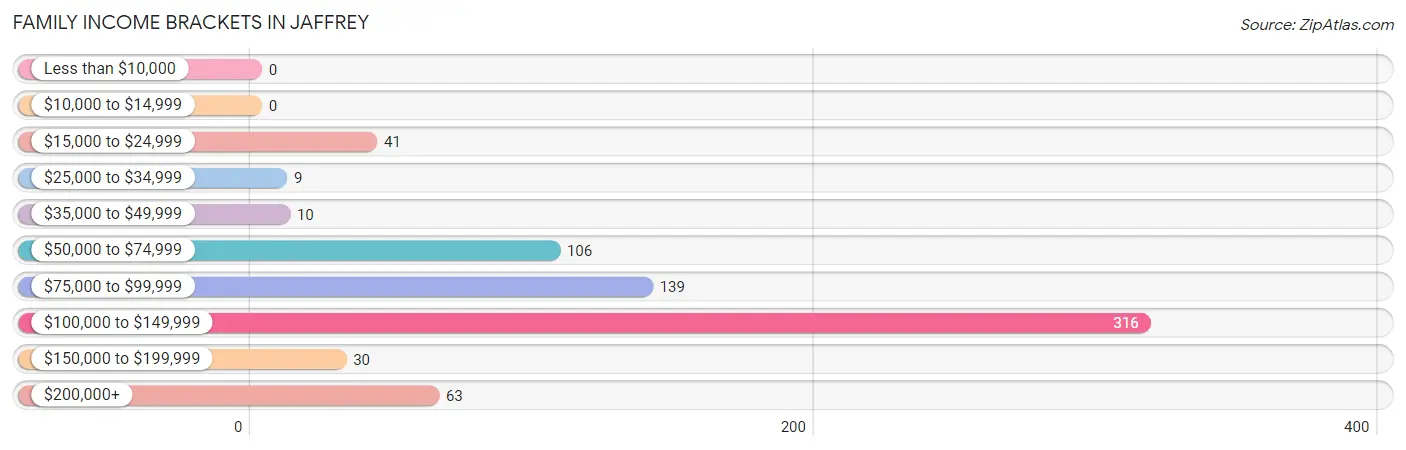
Family Income Brackets in Jaffrey
According to the Jaffrey family income data, there are 316 families falling into the $100,000 to $149,999 income range, which is the most common income bracket and makes up 44.3% of all families.
| Income Bracket | # Families | % Families |
| Less than $10,000 | 0 | 0.0% |
| $10,000 to $14,999 | 0 | 0.0% |
| $15,000 to $24,999 | 41 | 5.7% |
| $25,000 to $34,999 | 9 | 1.3% |
| $35,000 to $49,999 | 10 | 1.4% |
| $50,000 to $74,999 | 106 | 14.8% |
| $75,000 to $99,999 | 139 | 19.5% |
| $100,000 to $149,999 | 316 | 44.3% |
| $150,000 to $199,999 | 30 | 4.2% |
| $200,000+ | 63 | 8.8% |
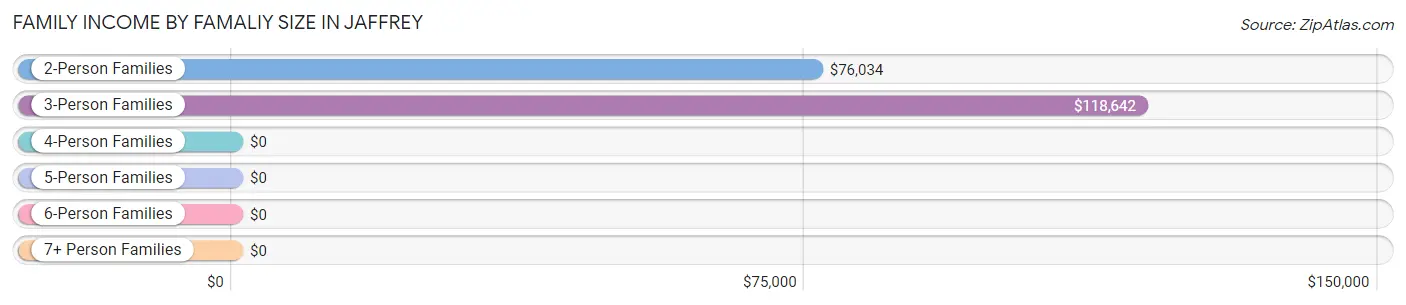
Family Income by Famaliy Size in Jaffrey
3-person families (283 | 39.6%) account for the highest median family income in Jaffrey with $118,642 per family, while 3-person families (283 | 39.6%) have the highest median income of $39,547 per family member.
| Income Bracket | # Families | Median Income |
| 2-Person Families | 187 (26.2%) | $76,034 |
| 3-Person Families | 283 (39.6%) | $118,642 |
| 4-Person Families | 170 (23.8%) | $0 |
| 5-Person Families | 12 (1.7%) | $0 |
| 6-Person Families | 62 (8.7%) | $0 |
| 7+ Person Families | 0 (0.0%) | $0 |
| Total | 714 (100.0%) | $117,554 |
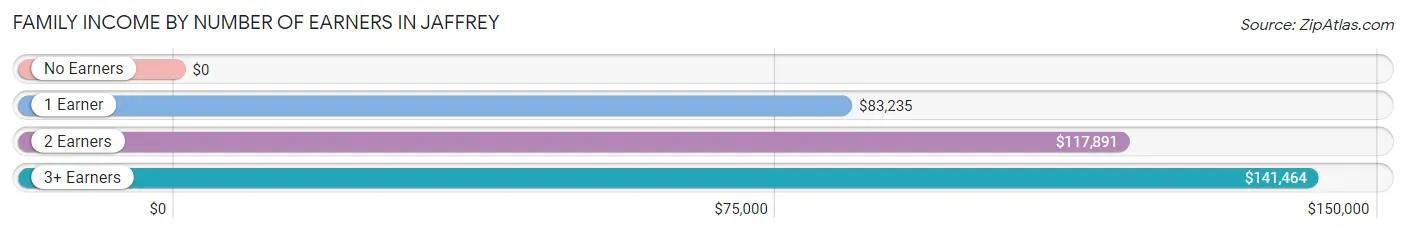
Family Income by Number of Earners in Jaffrey
| Number of Earners | # Families | Median Income |
| No Earners | 51 (7.1%) | $0 |
| 1 Earner | 166 (23.3%) | $83,235 |
| 2 Earners | 369 (51.7%) | $117,891 |
| 3+ Earners | 128 (17.9%) | $141,464 |
| Total | 714 (100.0%) | $117,554 |
Household Income in Jaffrey
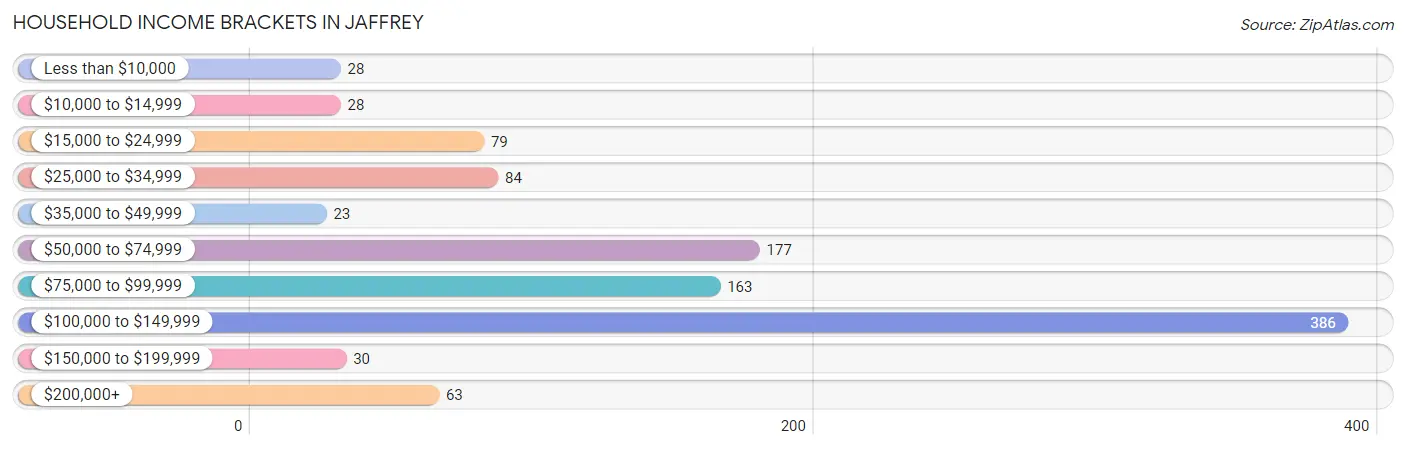
Household Income Brackets in Jaffrey
With 386 households falling in the category, the $100,000 to $149,999 income range is the most frequent in Jaffrey, accounting for 36.4% of all households. In contrast, only 23 households (2.2%) fall into the $35,000 to $49,999 income bracket, making it the least populous group.
| Income Bracket | # Households | % Households |
| Less than $10,000 | 28 | 2.6% |
| $10,000 to $14,999 | 28 | 2.6% |
| $15,000 to $24,999 | 79 | 7.4% |
| $25,000 to $34,999 | 84 | 7.9% |
| $35,000 to $49,999 | 23 | 2.2% |
| $50,000 to $74,999 | 177 | 16.7% |
| $75,000 to $99,999 | 163 | 15.4% |
| $100,000 to $149,999 | 386 | 36.4% |
| $150,000 to $199,999 | 30 | 2.8% |
| $200,000+ | 63 | 5.9% |
Household Income by Householder Age in Jaffrey
The median household income in Jaffrey is $86,384, with the highest median household income of $117,836 found in the 45 to 64 years age bracket for the primary householder. A total of 487 households (45.9%) fall into this category. Meanwhile, the 15 to 24 years age bracket for the primary householder has the lowest median household income of $0, with 49 households (4.6%) in this group.
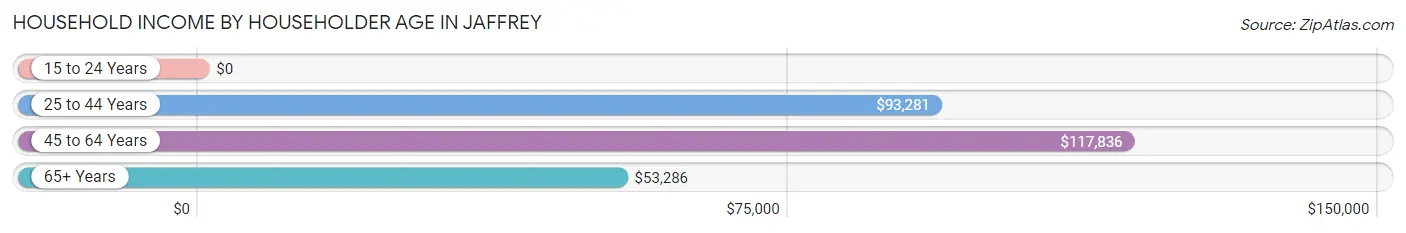
| Income Bracket | # Households | Median Income |
| 15 to 24 Years | 49 (4.6%) | $0 |
| 25 to 44 Years | 309 (29.1%) | $93,281 |
| 45 to 64 Years | 487 (45.9%) | $117,836 |
| 65+ Years | 216 (20.4%) | $53,286 |
| Total | 1,061 (100.0%) | $86,384 |
Poverty in Jaffrey
Income Below Poverty by Sex and Age in Jaffrey
With 3.2% poverty level for males and 10.0% for females among the residents of Jaffrey, 75 year old and over males and under 5 year old females are the most vulnerable to poverty, with 18 males (23.1%) and 28 females (100.0%) in their respective age groups living below the poverty level.
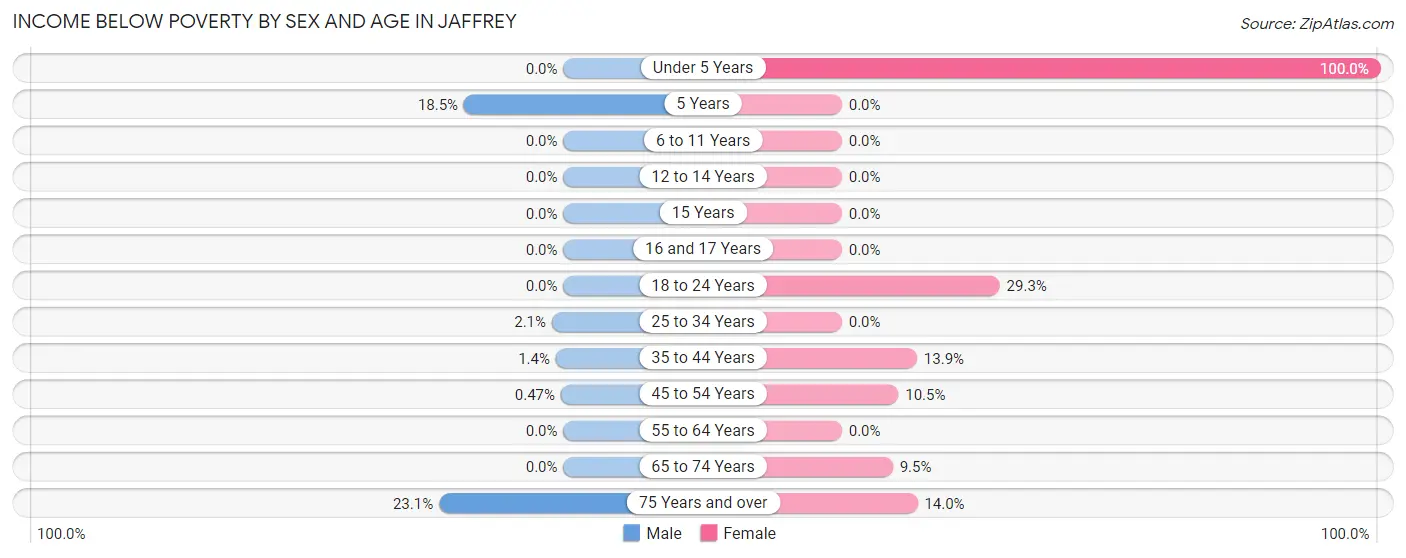
| Age Bracket | Male | Female |
| Under 5 Years | 0 (0.0%) | 28 (100.0%) |
| 5 Years | 19 (18.4%) | 0 (0.0%) |
| 6 to 11 Years | 0 (0.0%) | 0 (0.0%) |
| 12 to 14 Years | 0 (0.0%) | 0 (0.0%) |
| 15 Years | 0 (0.0%) | 0 (0.0%) |
| 16 and 17 Years | 0 (0.0%) | 0 (0.0%) |
| 18 to 24 Years | 0 (0.0%) | 46 (29.3%) |
| 25 to 34 Years | 7 (2.1%) | 0 (0.0%) |
| 35 to 44 Years | 3 (1.4%) | 23 (13.9%) |
| 45 to 54 Years | 1 (0.5%) | 28 (10.5%) |
| 55 to 64 Years | 0 (0.0%) | 0 (0.0%) |
| 65 to 74 Years | 0 (0.0%) | 12 (9.5%) |
| 75 Years and over | 18 (23.1%) | 16 (14.0%) |
| Total | 48 (3.2%) | 153 (10.0%) |
Income Above Poverty by Sex and Age in Jaffrey
According to the poverty statistics in Jaffrey, males aged under 5 years and females aged 6 to 11 years are the age groups that are most secure financially, with 100.0% of males and 100.0% of females in these age groups living above the poverty line.
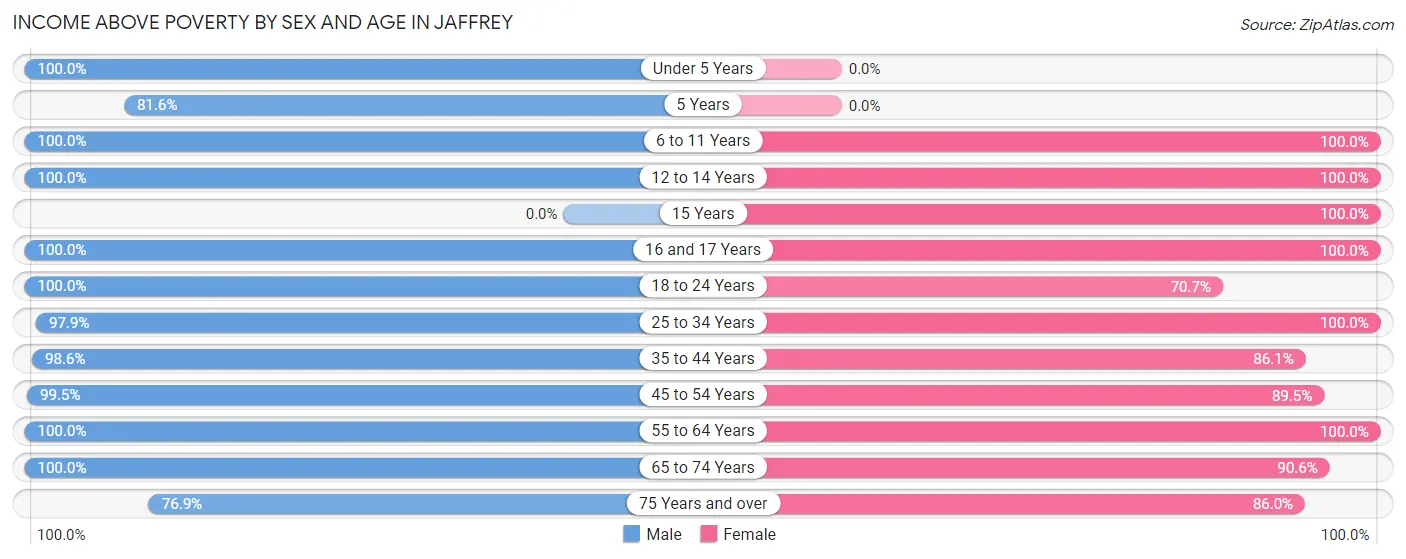
| Age Bracket | Male | Female |
| Under 5 Years | 90 (100.0%) | 0 (0.0%) |
| 5 Years | 84 (81.6%) | 0 (0.0%) |
| 6 to 11 Years | 112 (100.0%) | 159 (100.0%) |
| 12 to 14 Years | 46 (100.0%) | 82 (100.0%) |
| 15 Years | 0 (0.0%) | 74 (100.0%) |
| 16 and 17 Years | 14 (100.0%) | 52 (100.0%) |
| 18 to 24 Years | 37 (100.0%) | 111 (70.7%) |
| 25 to 34 Years | 322 (97.9%) | 108 (100.0%) |
| 35 to 44 Years | 211 (98.6%) | 142 (86.1%) |
| 45 to 54 Years | 213 (99.5%) | 239 (89.5%) |
| 55 to 64 Years | 205 (100.0%) | 201 (100.0%) |
| 65 to 74 Years | 52 (100.0%) | 115 (90.5%) |
| 75 Years and over | 60 (76.9%) | 98 (86.0%) |
| Total | 1,446 (96.8%) | 1,381 (90.0%) |
Income Below Poverty Among Married-Couple Families in Jaffrey
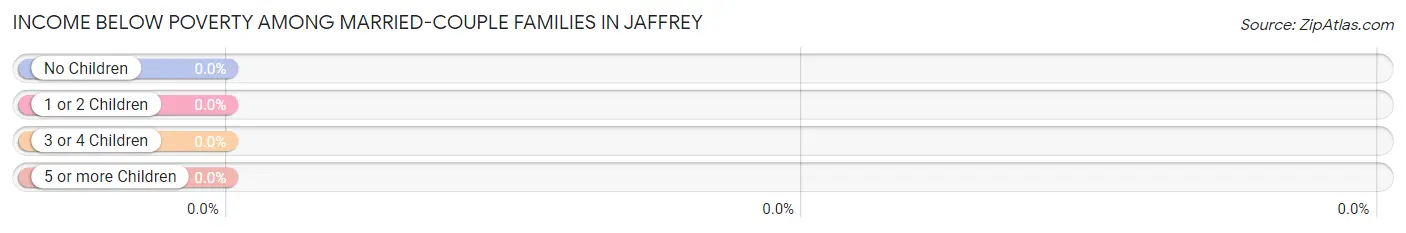
| Children | Above Poverty | Below Poverty |
| No Children | 374 (100.0%) | 0 (0.0%) |
| 1 or 2 Children | 162 (100.0%) | 0 (0.0%) |
| 3 or 4 Children | 62 (100.0%) | 0 (0.0%) |
| 5 or more Children | 0 (0.0%) | 0 (0.0%) |
| Total | 598 (100.0%) | 0 (0.0%) |
Income Below Poverty Among Single-Parent Households in Jaffrey
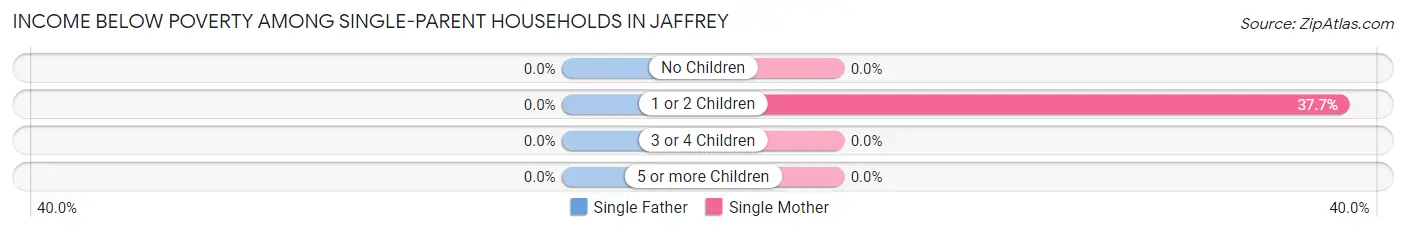
| Children | Single Father | Single Mother |
| No Children | 0 (0.0%) | 0 (0.0%) |
| 1 or 2 Children | 0 (0.0%) | 23 (37.7%) |
| 3 or 4 Children | 0 (0.0%) | 0 (0.0%) |
| 5 or more Children | 0 (0.0%) | 0 (0.0%) |
| Total | 0 (0.0%) | 23 (23.5%) |
Income Below Poverty Among Married-Couple vs Single-Parent Households in Jaffrey
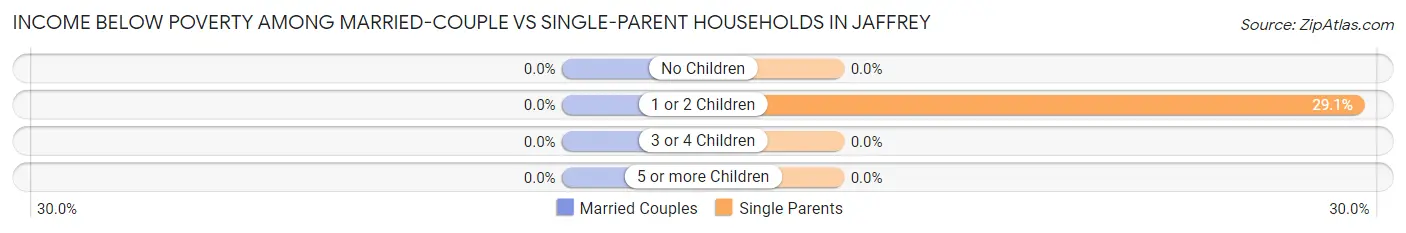
| Children | Married-Couple Families | Single-Parent Households |
| No Children | 0 (0.0%) | 0 (0.0%) |
| 1 or 2 Children | 0 (0.0%) | 23 (29.1%) |
| 3 or 4 Children | 0 (0.0%) | 0 (0.0%) |
| 5 or more Children | 0 (0.0%) | 0 (0.0%) |
| Total | 0 (0.0%) | 23 (19.8%) |
Race in Jaffrey
The most populous races in Jaffrey are White / Caucasian (2,723 | 89.7%), Two or more Races (183 | 6.0%), and Black / African American (61 | 2.0%).
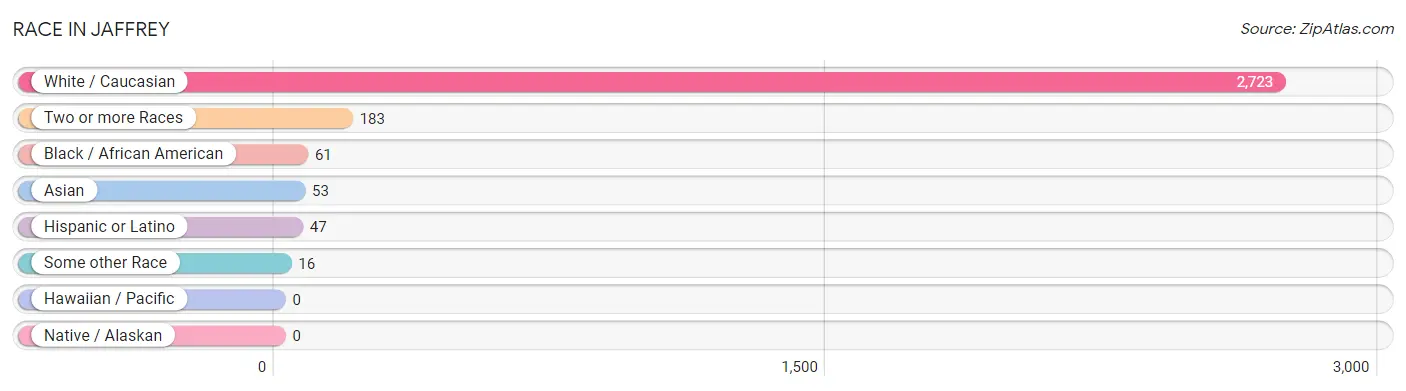
| Race | # Population | % Population |
| Asian | 53 | 1.8% |
| Black / African American | 61 | 2.0% |
| Hawaiian / Pacific | 0 | 0.0% |
| Hispanic or Latino | 47 | 1.5% |
| Native / Alaskan | 0 | 0.0% |
| White / Caucasian | 2,723 | 89.7% |
| Two or more Races | 183 | 6.0% |
| Some other Race | 16 | 0.5% |
| Total | 3,036 | 100.0% |
Ancestry in Jaffrey
The most populous ancestries reported in Jaffrey are French (953 | 31.4%), English (775 | 25.5%), Irish (523 | 17.2%), German (376 | 12.4%), and French Canadian (353 | 11.6%), together accounting for 98.2% of all Jaffrey residents.
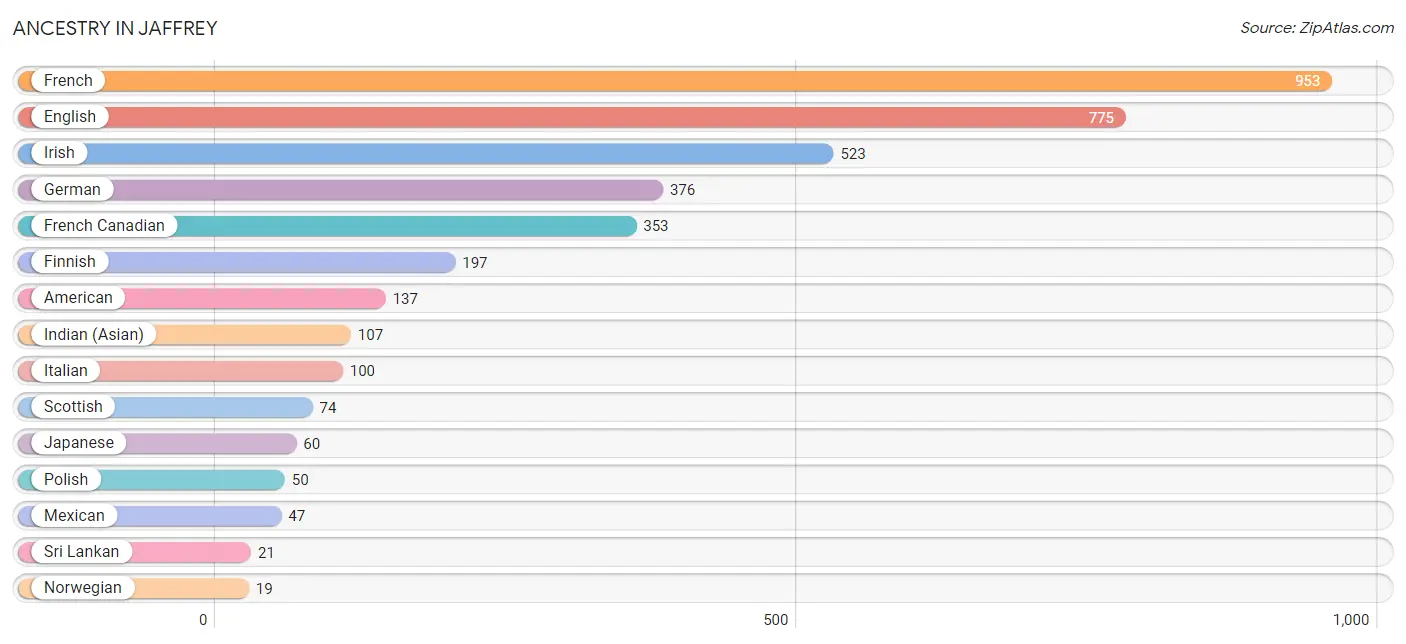
| Ancestry | # Population | % Population |
| American | 137 | 4.5% |
| Bahamian | 1 | 0.0% |
| Cherokee | 7 | 0.2% |
| Dutch | 16 | 0.5% |
| English | 775 | 25.5% |
| European | 12 | 0.4% |
| Finnish | 197 | 6.5% |
| French | 953 | 31.4% |
| French Canadian | 353 | 11.6% |
| German | 376 | 12.4% |
| Hungarian | 16 | 0.5% |
| Indian (Asian) | 107 | 3.5% |
| Iranian | 15 | 0.5% |
| Irish | 523 | 17.2% |
| Italian | 100 | 3.3% |
| Japanese | 60 | 2.0% |
| Mexican | 47 | 1.5% |
| Norwegian | 19 | 0.6% |
| Polish | 50 | 1.7% |
| Scottish | 74 | 2.4% |
| Sri Lankan | 21 | 0.7% | View All 21 Rows |
Immigrants in Jaffrey
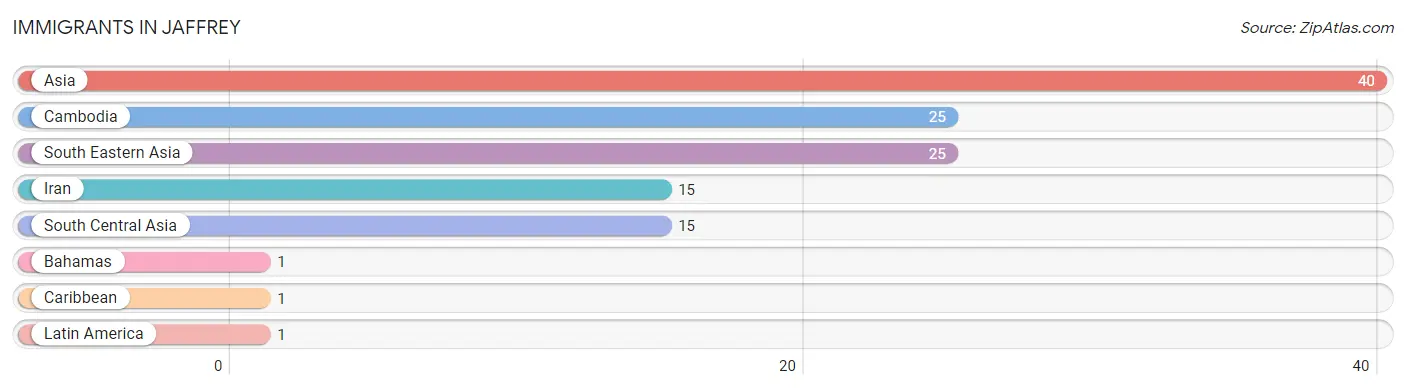
The most numerous immigrant groups reported in Jaffrey came from Asia (40 | 1.3%), Cambodia (25 | 0.8%), South Eastern Asia (25 | 0.8%), Iran (15 | 0.5%), and South Central Asia (15 | 0.5%), together accounting for 3.9% of all Jaffrey residents.
| Immigration Origin | # Population | % Population |
| Asia | 40 | 1.3% |
| Bahamas | 1 | 0.0% |
| Cambodia | 25 | 0.8% |
| Caribbean | 1 | 0.0% |
| Iran | 15 | 0.5% |
| Latin America | 1 | 0.0% |
| South Central Asia | 15 | 0.5% |
| South Eastern Asia | 25 | 0.8% | View All 8 Rows |
Sex and Age in Jaffrey
Sex and Age in Jaffrey
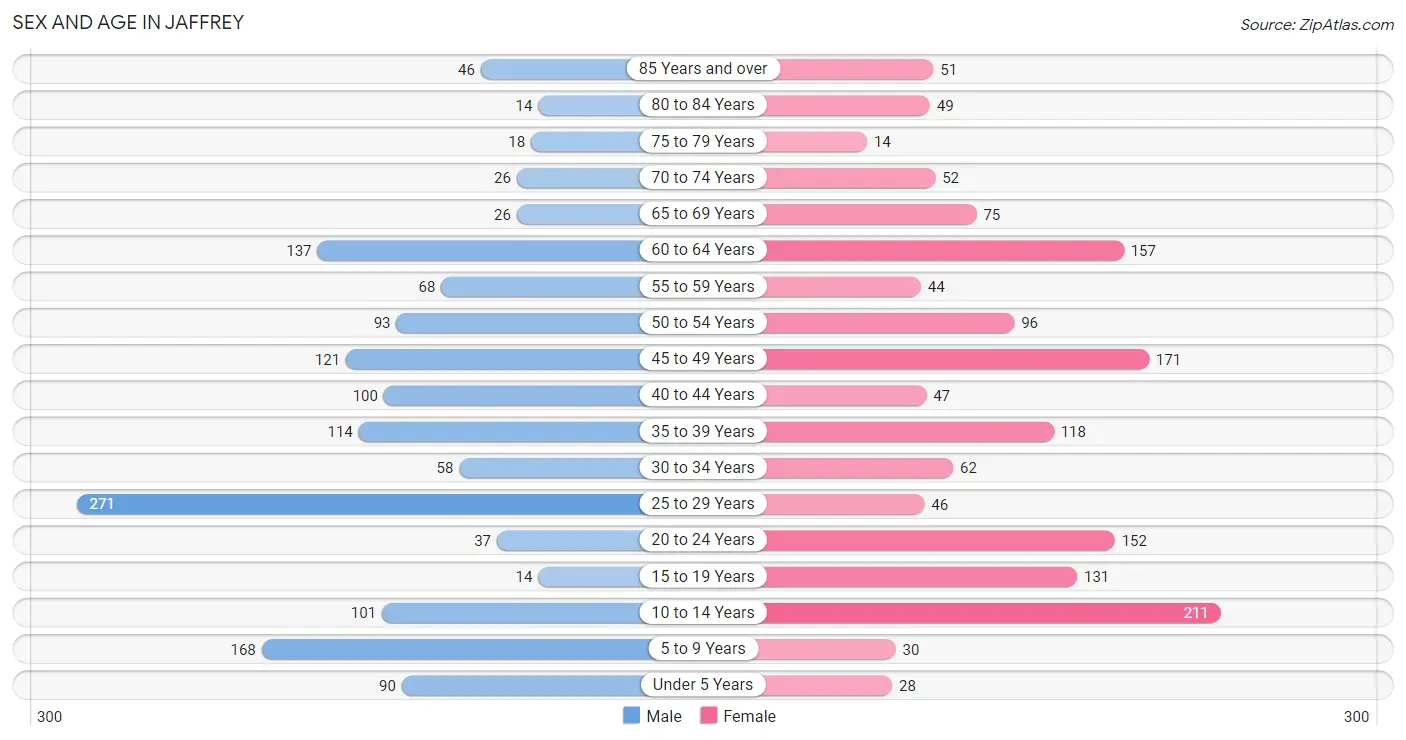
The most populous age groups in Jaffrey are 25 to 29 Years (271 | 18.0%) for men and 10 to 14 Years (211 | 13.8%) for women.
| Age Bracket | Male | Female |
| Under 5 Years | 90 (6.0%) | 28 (1.8%) |
| 5 to 9 Years | 168 (11.2%) | 30 (2.0%) |
| 10 to 14 Years | 101 (6.7%) | 211 (13.8%) |
| 15 to 19 Years | 14 (0.9%) | 131 (8.5%) |
| 20 to 24 Years | 37 (2.5%) | 152 (9.9%) |
| 25 to 29 Years | 271 (18.0%) | 46 (3.0%) |
| 30 to 34 Years | 58 (3.9%) | 62 (4.0%) |
| 35 to 39 Years | 114 (7.6%) | 118 (7.7%) |
| 40 to 44 Years | 100 (6.7%) | 47 (3.1%) |
| 45 to 49 Years | 121 (8.1%) | 171 (11.2%) |
| 50 to 54 Years | 93 (6.2%) | 96 (6.3%) |
| 55 to 59 Years | 68 (4.5%) | 44 (2.9%) |
| 60 to 64 Years | 137 (9.1%) | 157 (10.2%) |
| 65 to 69 Years | 26 (1.7%) | 75 (4.9%) |
| 70 to 74 Years | 26 (1.7%) | 52 (3.4%) |
| 75 to 79 Years | 18 (1.2%) | 14 (0.9%) |
| 80 to 84 Years | 14 (0.9%) | 49 (3.2%) |
| 85 Years and over | 46 (3.1%) | 51 (3.3%) |
| Total | 1,502 (100.0%) | 1,534 (100.0%) |
Families and Households in Jaffrey
Median Family Size in Jaffrey
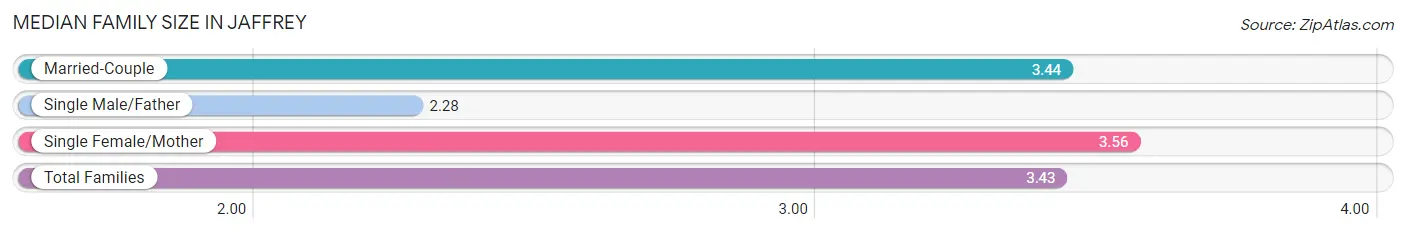
The median family size in Jaffrey is 3.43 persons per family, with single female/mother families (98 | 13.7%) accounting for the largest median family size of 3.56 persons per family. On the other hand, single male/father families (18 | 2.5%) represent the smallest median family size with 2.28 persons per family.
| Family Type | # Families | Family Size |
| Married-Couple | 598 (83.8%) | 3.44 |
| Single Male/Father | 18 (2.5%) | 2.28 |
| Single Female/Mother | 98 (13.7%) | 3.56 |
| Total Families | 714 (100.0%) | 3.43 |
Median Household Size in Jaffrey
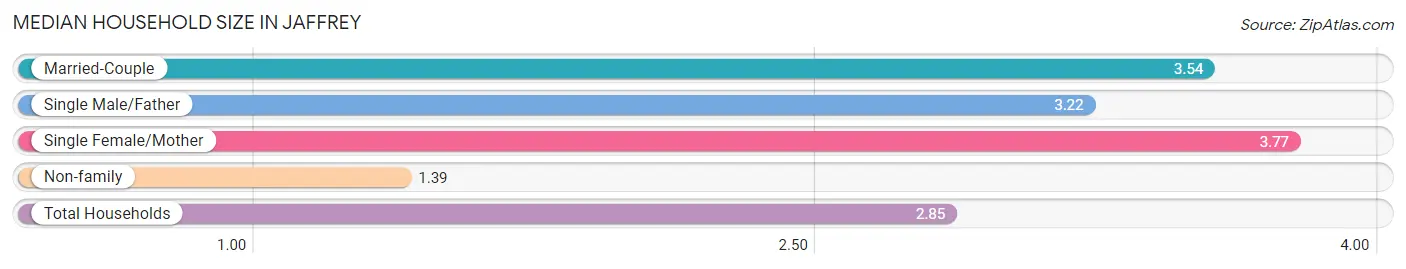
The median household size in Jaffrey is 2.85 persons per household, with single female/mother households (98 | 9.2%) accounting for the largest median household size of 3.77 persons per household. non-family households (347 | 32.7%) represent the smallest median household size with 1.39 persons per household.
| Household Type | # Households | Household Size |
| Married-Couple | 598 (56.4%) | 3.54 |
| Single Male/Father | 18 (1.7%) | 3.22 |
| Single Female/Mother | 98 (9.2%) | 3.77 |
| Non-family | 347 (32.7%) | 1.39 |
| Total Households | 1,061 (100.0%) | 2.85 |
Household Size by Marriage Status in Jaffrey
Out of a total of 1,061 households in Jaffrey, 714 (67.3%) are family households, while 347 (32.7%) are nonfamily households. The most numerous type of family households are 3-person households, comprising 297, and the most common type of nonfamily households are 1-person households, comprising 218.
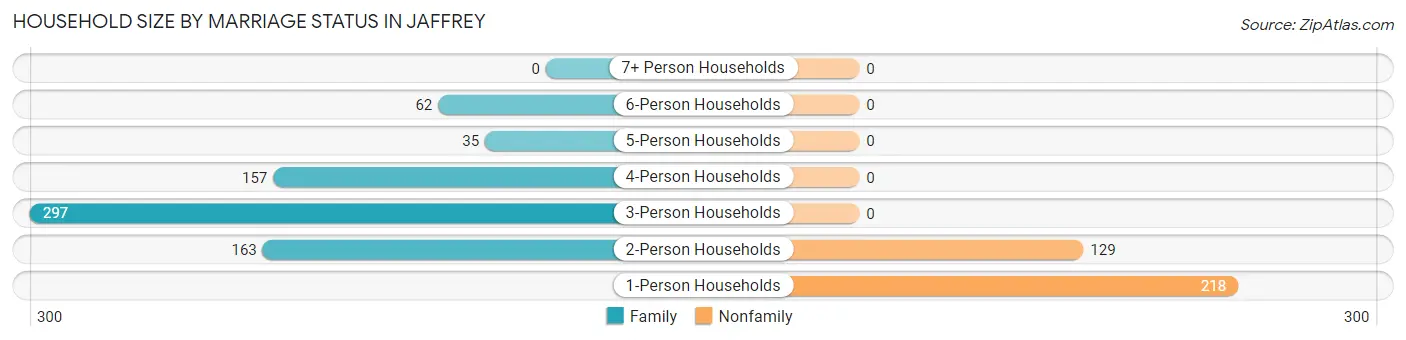
| Household Size | Family Households | Nonfamily Households |
| 1-Person Households | - | 218 (20.5%) |
| 2-Person Households | 163 (15.4%) | 129 (12.2%) |
| 3-Person Households | 297 (28.0%) | 0 (0.0%) |
| 4-Person Households | 157 (14.8%) | 0 (0.0%) |
| 5-Person Households | 35 (3.3%) | 0 (0.0%) |
| 6-Person Households | 62 (5.8%) | 0 (0.0%) |
| 7+ Person Households | 0 (0.0%) | 0 (0.0%) |
| Total | 714 (67.3%) | 347 (32.7%) |
Female Fertility in Jaffrey
Fertility by Age in Jaffrey
| Age Bracket | Women with Births | Births / 1,000 Women |
| 15 to 19 years | 0 (0.0%) | 0.0 |
| 20 to 34 years | 0 (0.0%) | 0.0 |
| 35 to 50 years | 0 (0.0%) | 0.0 |
| Total | 0 (0.0%) | 0.0 |
Fertility by Age by Marriage Status in Jaffrey
| Age Bracket | Married | Unmarried |
| 15 to 19 years | 0 (0.0%) | 0 (0.0%) |
| 20 to 34 years | 0 (0.0%) | 0 (0.0%) |
| 35 to 50 years | 0 (0.0%) | 0 (0.0%) |
| Total | 0 (0.0%) | 0 (0.0%) |
Fertility by Education in Jaffrey
| Educational Attainment | Women with Births | Births / 1,000 Women |
| Less than High School | 0 (0.0%) | 0.0 |
| High School Diploma | 0 (0.0%) | 0.0 |
| College or Associate's Degree | 0 (0.0%) | 0.0 |
| Bachelor's Degree | 0 (0.0%) | 0.0 |
| Graduate Degree | 0 (0.0%) | 0.0 |
| Total | 0 (0.0%) | 0.0 |
Fertility by Education by Marriage Status in Jaffrey
| Educational Attainment | Married | Unmarried |
| Less than High School | 0 (0.0%) | 0 (0.0%) |
| High School Diploma | 0 (0.0%) | 0 (0.0%) |
| College or Associate's Degree | 0 (0.0%) | 0 (0.0%) |
| Bachelor's Degree | 0 (0.0%) | 0 (0.0%) |
| Graduate Degree | 0 (0.0%) | 0 (0.0%) |
| Total | 0 (0.0%) | 0 (0.0%) |
Employment Characteristics in Jaffrey
Employment by Class of Employer in Jaffrey
Among the 1,540 employed individuals in Jaffrey, private company employees (1,063 | 69.0%), local government employees (187 | 12.1%), and not-for-profit organizations (153 | 9.9%) make up the most common classes of employment.
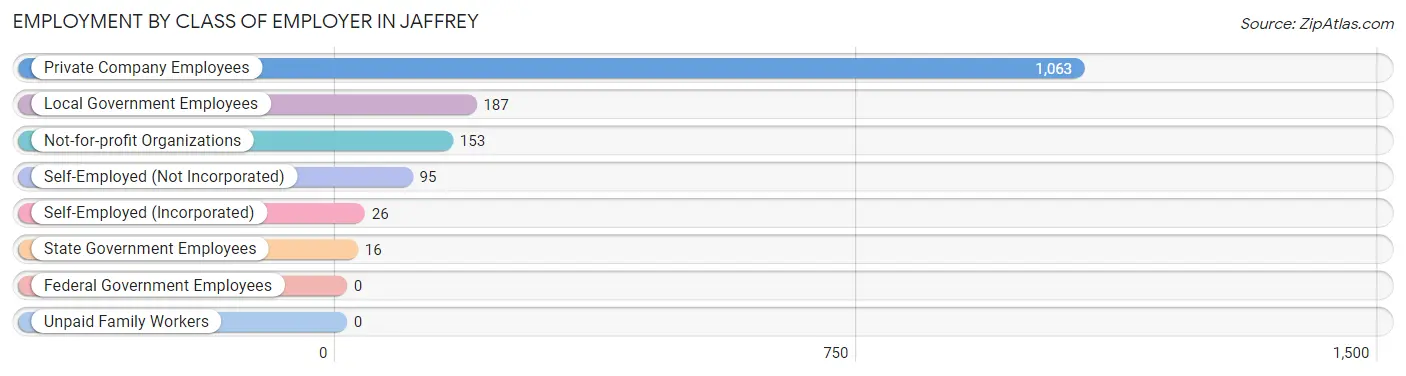
| Employer Class | # Employees | % Employees |
| Private Company Employees | 1,063 | 69.0% |
| Self-Employed (Incorporated) | 26 | 1.7% |
| Self-Employed (Not Incorporated) | 95 | 6.2% |
| Not-for-profit Organizations | 153 | 9.9% |
| Local Government Employees | 187 | 12.1% |
| State Government Employees | 16 | 1.0% |
| Federal Government Employees | 0 | 0.0% |
| Unpaid Family Workers | 0 | 0.0% |
| Total | 1,540 | 100.0% |
Employment Status by Age in Jaffrey
According to the labor force statistics for Jaffrey, out of the total population over 16 years of age (2,334), 71.4% or 1,666 individuals are in the labor force, with 7.4% or 123 of them unemployed. The age group with the highest labor force participation rate is 20 to 24 years, with 100.0% or 189 individuals in the labor force. Within the labor force, the 60 to 64 years age range has the highest percentage of unemployed individuals, with 31.6% or 80 of them being unemployed.
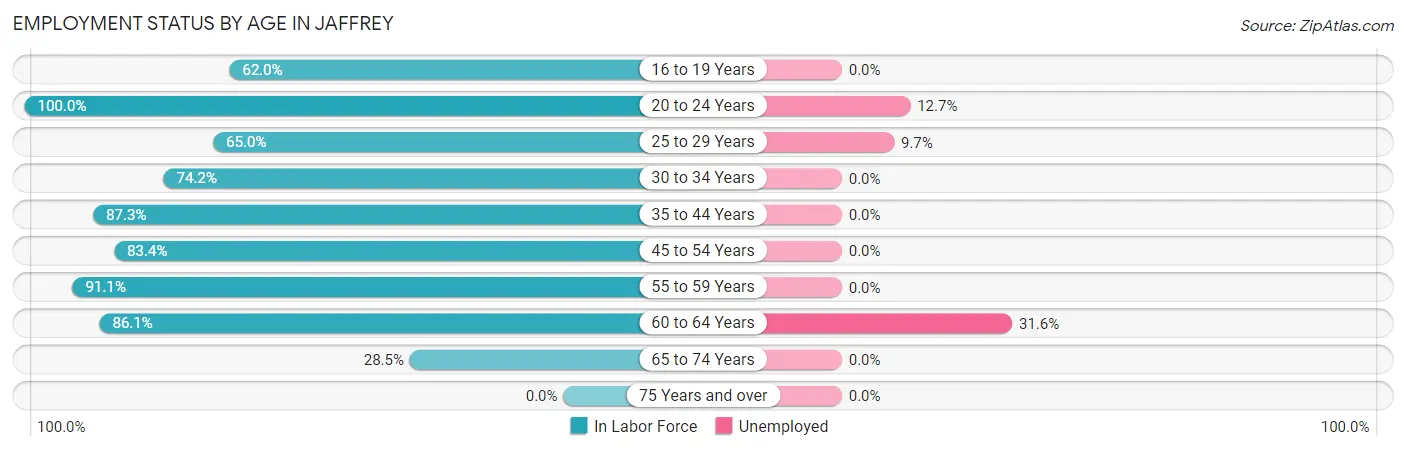
| Age Bracket | In Labor Force | Unemployed |
| 16 to 19 Years | 44 (62.0%) | 0 (0.0%) |
| 20 to 24 Years | 189 (100.0%) | 24 (12.7%) |
| 25 to 29 Years | 206 (65.0%) | 20 (9.7%) |
| 30 to 34 Years | 89 (74.2%) | 0 (0.0%) |
| 35 to 44 Years | 331 (87.3%) | 0 (0.0%) |
| 45 to 54 Years | 401 (83.4%) | 0 (0.0%) |
| 55 to 59 Years | 102 (91.1%) | 0 (0.0%) |
| 60 to 64 Years | 253 (86.1%) | 80 (31.6%) |
| 65 to 74 Years | 51 (28.5%) | 0 (0.0%) |
| 75 Years and over | 0 (0.0%) | 0 (0.0%) |
| Total | 1,666 (71.4%) | 123 (7.4%) |
Employment Status by Educational Attainment in Jaffrey
According to labor force statistics for Jaffrey, 81.2% of individuals (1,383) out of the total population between 25 and 64 years of age (1,703) are in the labor force, with 7.2% or 100 of them being unemployed. The group with the highest labor force participation rate are those with the educational attainment of less than high school, with 95.6% or 43 individuals in the labor force. Within the labor force, individuals with bachelor's degree or higher education have the highest percentage of unemployment, with 23.4% or 80 of them being unemployed.
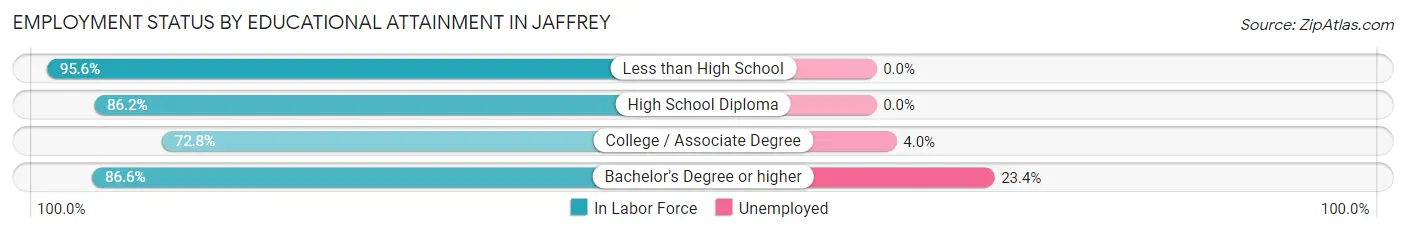
| Educational Attainment | In Labor Force | Unemployed |
| Less than High School | 43 (95.6%) | 0 (0.0%) |
| High School Diploma | 498 (86.2%) | 0 (0.0%) |
| College / Associate Degree | 499 (72.8%) | 27 (4.0%) |
| Bachelor's Degree or higher | 342 (86.6%) | 92 (23.4%) |
| Total | 1,383 (81.2%) | 123 (7.2%) |
Employment Occupations by Sex in Jaffrey
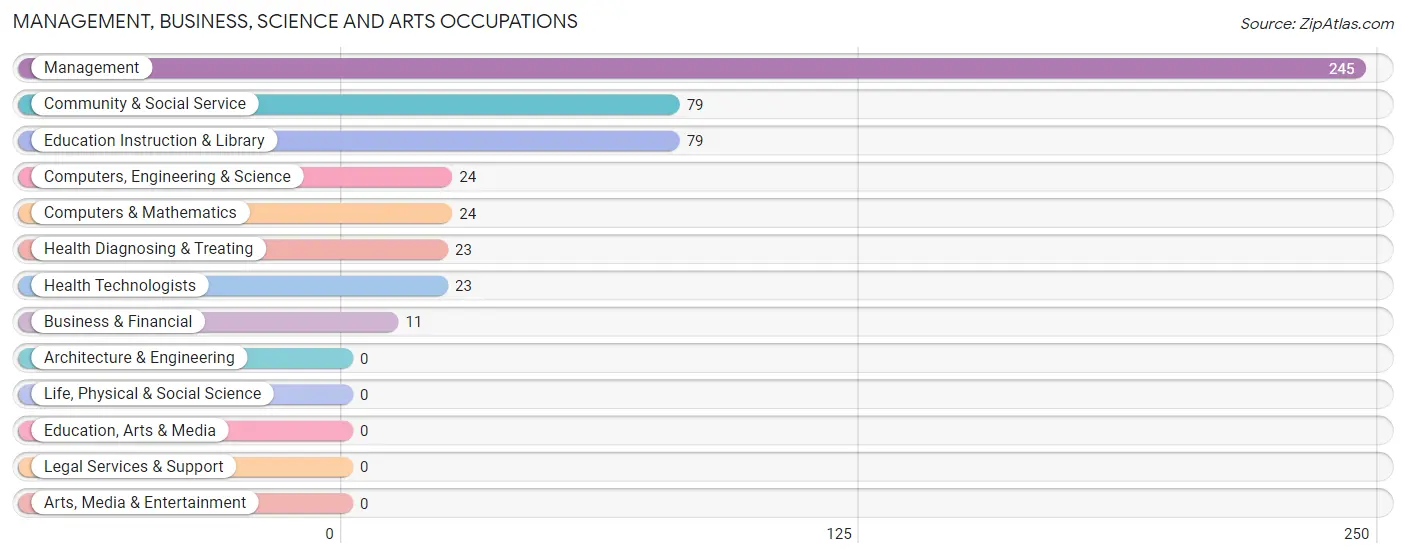
Management, Business, Science and Arts Occupations
The most common Management, Business, Science and Arts occupations in Jaffrey are Management (245 | 15.9%), Community & Social Service (79 | 5.1%), Education Instruction & Library (79 | 5.1%), Computers, Engineering & Science (24 | 1.6%), and Computers & Mathematics (24 | 1.6%).
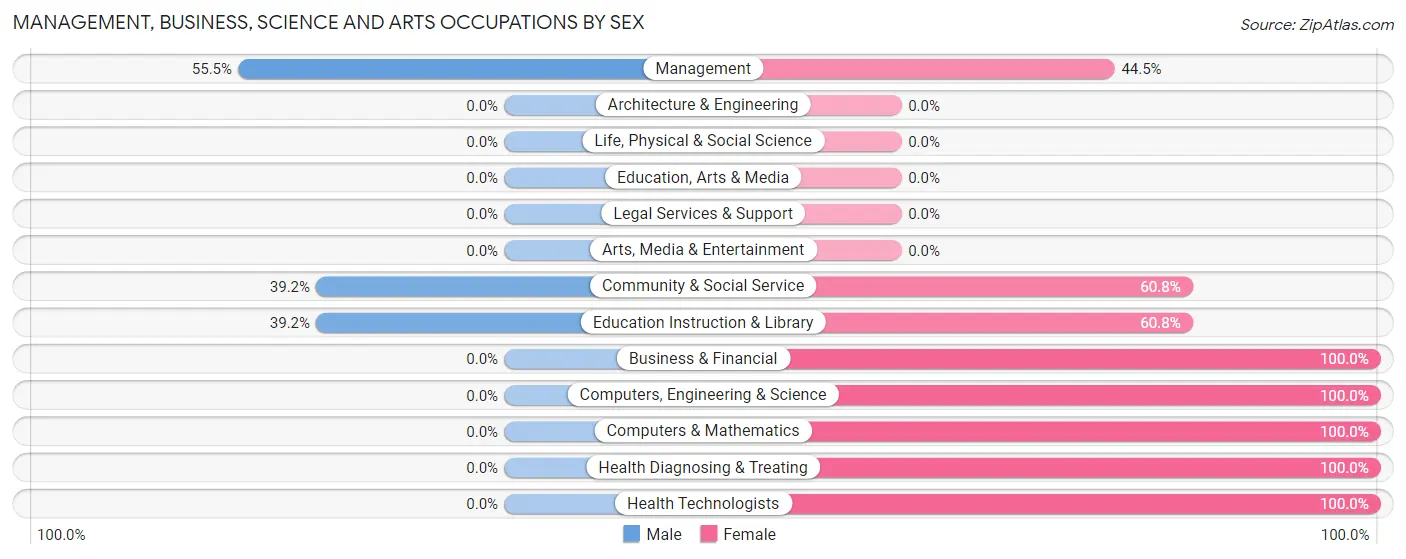
Management, Business, Science and Arts Occupations by Sex
Within the Management, Business, Science and Arts occupations in Jaffrey, the most male-oriented occupations are Management (55.5%), Community & Social Service (39.2%), and Education Instruction & Library (39.2%), while the most female-oriented occupations are Business & Financial (100.0%), Computers, Engineering & Science (100.0%), and Computers & Mathematics (100.0%).
| Occupation | Male | Female |
| Management | 136 (55.5%) | 109 (44.5%) |
| Business & Financial | 0 (0.0%) | 11 (100.0%) |
| Computers, Engineering & Science | 0 (0.0%) | 24 (100.0%) |
| Computers & Mathematics | 0 (0.0%) | 24 (100.0%) |
| Architecture & Engineering | 0 (0.0%) | 0 (0.0%) |
| Life, Physical & Social Science | 0 (0.0%) | 0 (0.0%) |
| Community & Social Service | 31 (39.2%) | 48 (60.8%) |
| Education, Arts & Media | 0 (0.0%) | 0 (0.0%) |
| Legal Services & Support | 0 (0.0%) | 0 (0.0%) |
| Education Instruction & Library | 31 (39.2%) | 48 (60.8%) |
| Arts, Media & Entertainment | 0 (0.0%) | 0 (0.0%) |
| Health Diagnosing & Treating | 0 (0.0%) | 23 (100.0%) |
| Health Technologists | 0 (0.0%) | 23 (100.0%) |
| Total (Category) | 167 (43.7%) | 215 (56.3%) |
| Total (Overall) | 837 (54.3%) | 705 (45.7%) |
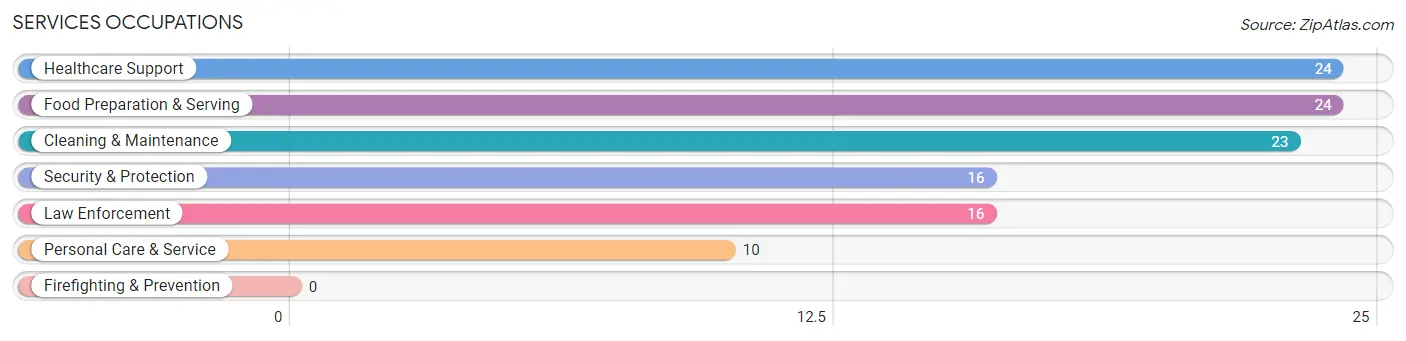
Services Occupations
The most common Services occupations in Jaffrey are Healthcare Support (24 | 1.6%), Food Preparation & Serving (24 | 1.6%), Cleaning & Maintenance (23 | 1.5%), Security & Protection (16 | 1.0%), and Law Enforcement (16 | 1.0%).
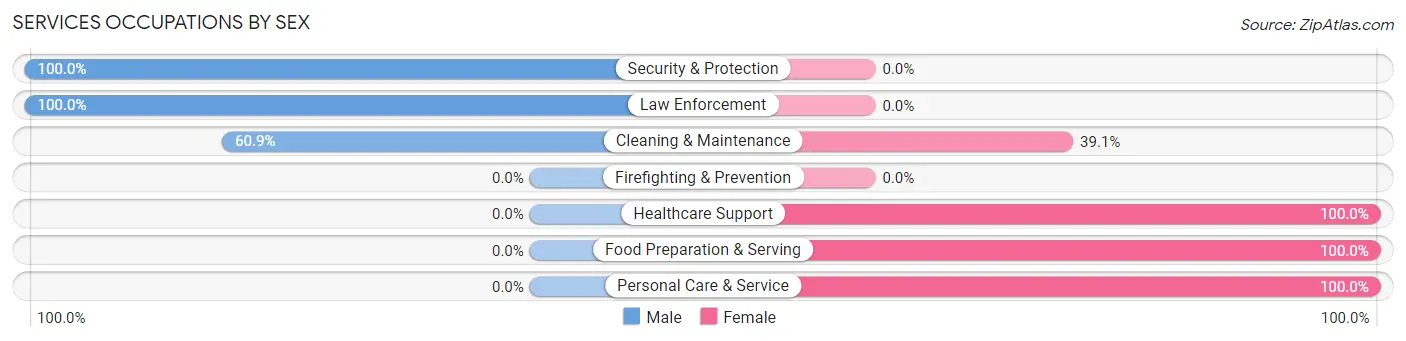
Services Occupations by Sex
Within the Services occupations in Jaffrey, the most male-oriented occupations are Security & Protection (100.0%), Law Enforcement (100.0%), and Cleaning & Maintenance (60.9%), while the most female-oriented occupations are Healthcare Support (100.0%), Food Preparation & Serving (100.0%), and Personal Care & Service (100.0%).
| Occupation | Male | Female |
| Healthcare Support | 0 (0.0%) | 24 (100.0%) |
| Security & Protection | 16 (100.0%) | 0 (0.0%) |
| Firefighting & Prevention | 0 (0.0%) | 0 (0.0%) |
| Law Enforcement | 16 (100.0%) | 0 (0.0%) |
| Food Preparation & Serving | 0 (0.0%) | 24 (100.0%) |
| Cleaning & Maintenance | 14 (60.9%) | 9 (39.1%) |
| Personal Care & Service | 0 (0.0%) | 10 (100.0%) |
| Total (Category) | 30 (30.9%) | 67 (69.1%) |
| Total (Overall) | 837 (54.3%) | 705 (45.7%) |
Sales and Office Occupations
The most common Sales and Office occupations in Jaffrey are Sales & Related (319 | 20.7%), and Office & Administration (121 | 7.9%).
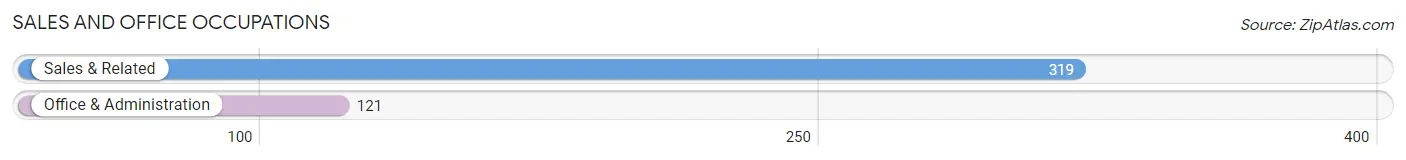
Sales and Office Occupations by Sex
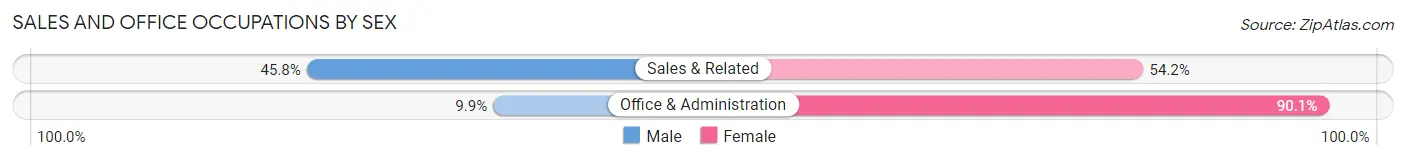
| Occupation | Male | Female |
| Sales & Related | 146 (45.8%) | 173 (54.2%) |
| Office & Administration | 12 (9.9%) | 109 (90.1%) |
| Total (Category) | 158 (35.9%) | 282 (64.1%) |
| Total (Overall) | 837 (54.3%) | 705 (45.7%) |
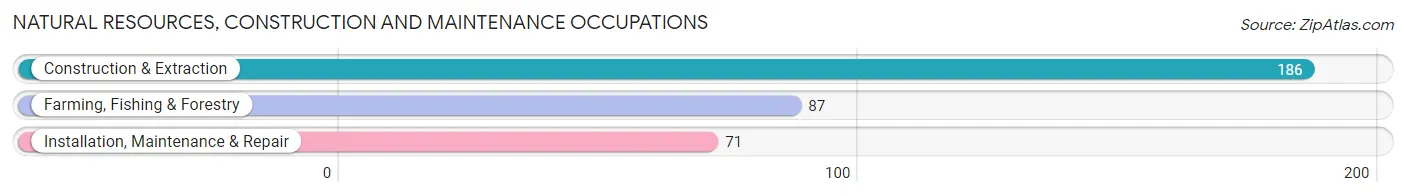
Natural Resources, Construction and Maintenance Occupations
The most common Natural Resources, Construction and Maintenance occupations in Jaffrey are Construction & Extraction (186 | 12.1%), Farming, Fishing & Forestry (87 | 5.6%), and Installation, Maintenance & Repair (71 | 4.6%).
Natural Resources, Construction and Maintenance Occupations by Sex
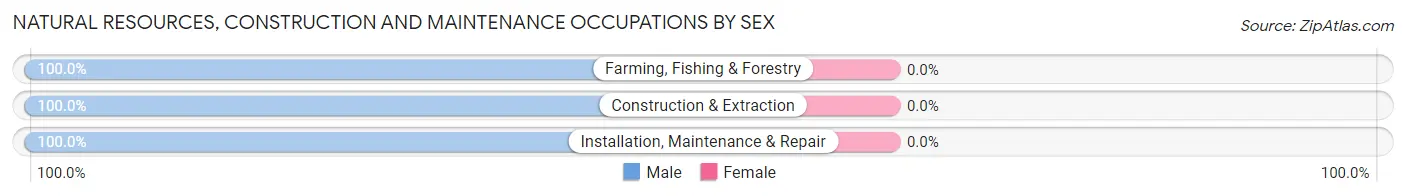
| Occupation | Male | Female |
| Farming, Fishing & Forestry | 87 (100.0%) | 0 (0.0%) |
| Construction & Extraction | 186 (100.0%) | 0 (0.0%) |
| Installation, Maintenance & Repair | 71 (100.0%) | 0 (0.0%) |
| Total (Category) | 344 (100.0%) | 0 (0.0%) |
| Total (Overall) | 837 (54.3%) | 705 (45.7%) |
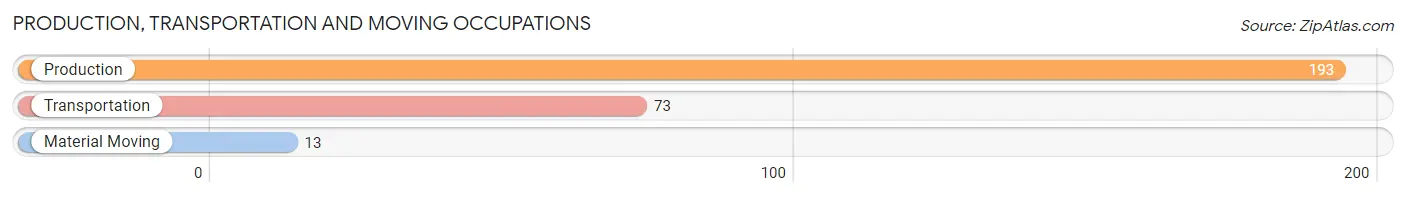
Production, Transportation and Moving Occupations
The most common Production, Transportation and Moving occupations in Jaffrey are Production (193 | 12.5%), Transportation (73 | 4.7%), and Material Moving (13 | 0.8%).
Production, Transportation and Moving Occupations by Sex
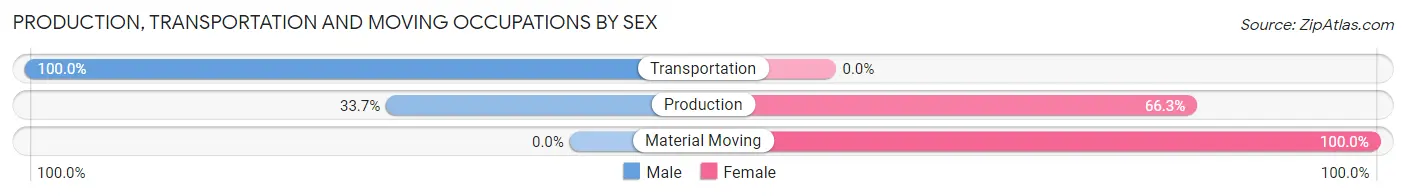
| Occupation | Male | Female |
| Production | 65 (33.7%) | 128 (66.3%) |
| Transportation | 73 (100.0%) | 0 (0.0%) |
| Material Moving | 0 (0.0%) | 13 (100.0%) |
| Total (Category) | 138 (49.5%) | 141 (50.5%) |
| Total (Overall) | 837 (54.3%) | 705 (45.7%) |
Employment Industries by Sex in Jaffrey
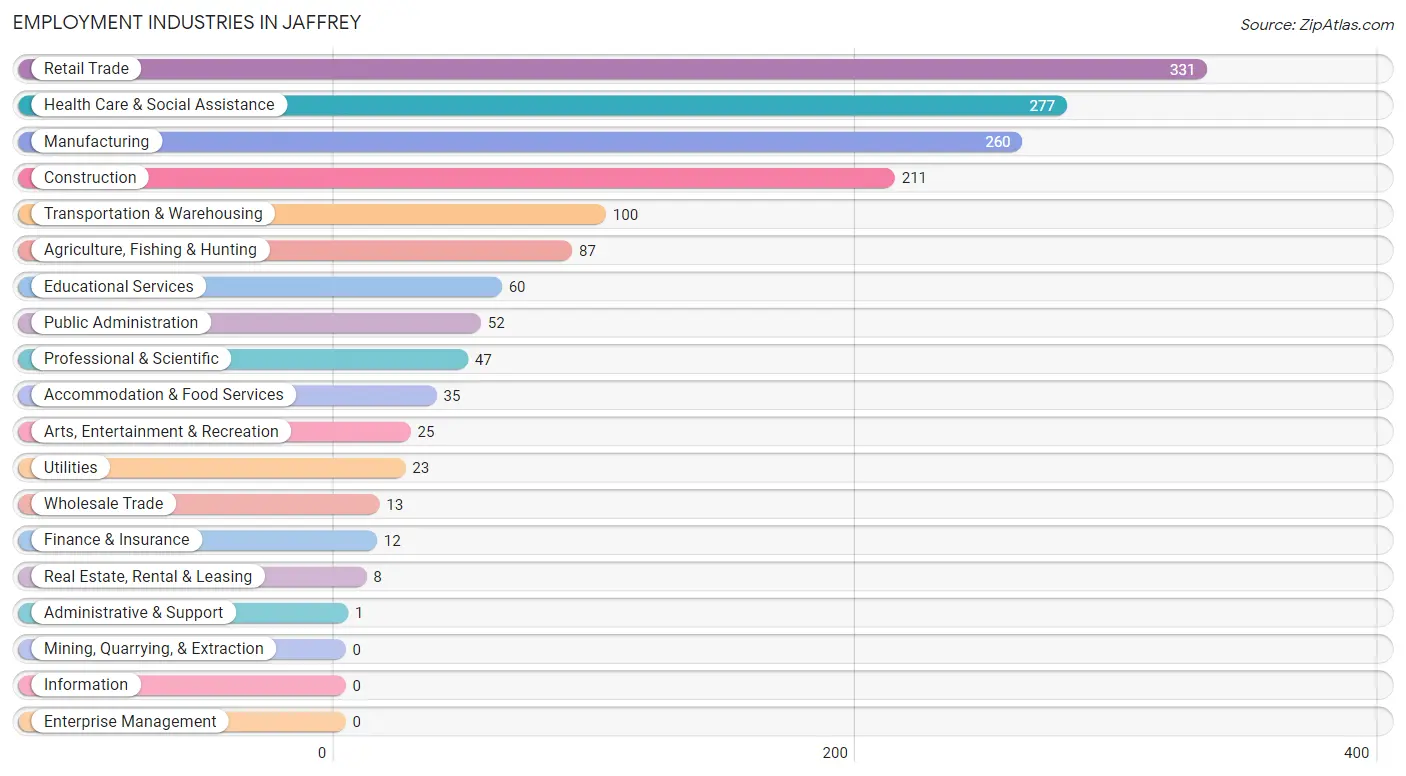
Employment Industries in Jaffrey
The major employment industries in Jaffrey include Retail Trade (331 | 21.5%), Health Care & Social Assistance (277 | 18.0%), Manufacturing (260 | 16.9%), Construction (211 | 13.7%), and Transportation & Warehousing (100 | 6.5%).
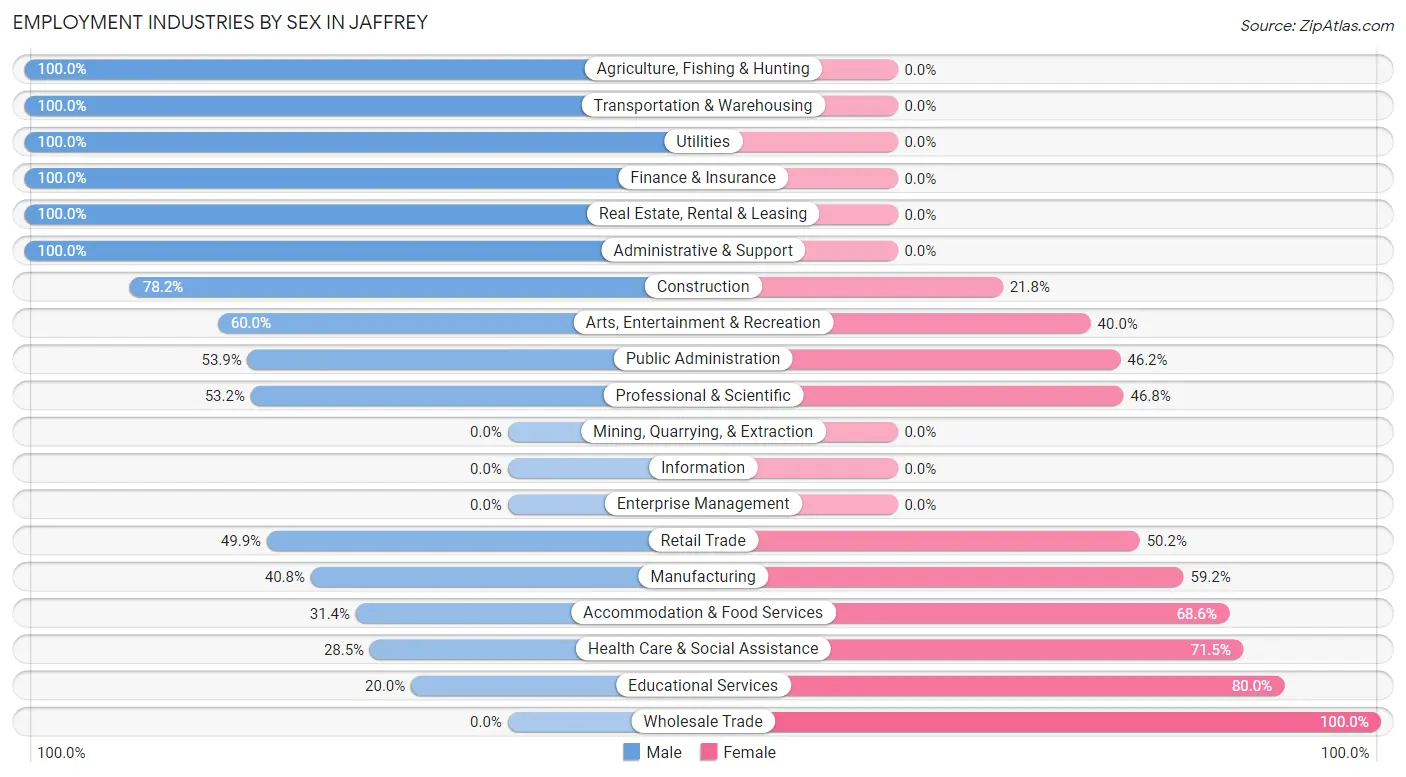
Employment Industries by Sex in Jaffrey
The Jaffrey industries that see more men than women are Agriculture, Fishing & Hunting (100.0%), Transportation & Warehousing (100.0%), and Utilities (100.0%), whereas the industries that tend to have a higher number of women are Wholesale Trade (100.0%), Educational Services (80.0%), and Health Care & Social Assistance (71.5%).
| Industry | Male | Female |
| Agriculture, Fishing & Hunting | 87 (100.0%) | 0 (0.0%) |
| Mining, Quarrying, & Extraction | 0 (0.0%) | 0 (0.0%) |
| Construction | 165 (78.2%) | 46 (21.8%) |
| Manufacturing | 106 (40.8%) | 154 (59.2%) |
| Wholesale Trade | 0 (0.0%) | 13 (100.0%) |
| Retail Trade | 165 (49.8%) | 166 (50.1%) |
| Transportation & Warehousing | 100 (100.0%) | 0 (0.0%) |
| Utilities | 23 (100.0%) | 0 (0.0%) |
| Information | 0 (0.0%) | 0 (0.0%) |
| Finance & Insurance | 12 (100.0%) | 0 (0.0%) |
| Real Estate, Rental & Leasing | 8 (100.0%) | 0 (0.0%) |
| Professional & Scientific | 25 (53.2%) | 22 (46.8%) |
| Enterprise Management | 0 (0.0%) | 0 (0.0%) |
| Administrative & Support | 1 (100.0%) | 0 (0.0%) |
| Educational Services | 12 (20.0%) | 48 (80.0%) |
| Health Care & Social Assistance | 79 (28.5%) | 198 (71.5%) |
| Arts, Entertainment & Recreation | 15 (60.0%) | 10 (40.0%) |
| Accommodation & Food Services | 11 (31.4%) | 24 (68.6%) |
| Public Administration | 28 (53.8%) | 24 (46.2%) |
| Total | 837 (54.3%) | 705 (45.7%) |
Education in Jaffrey
School Enrollment in Jaffrey
The most common levels of schooling among the 741 students in Jaffrey are middle school (279 | 37.7%), high school (154 | 20.8%), and elementary school (104 | 14.0%).
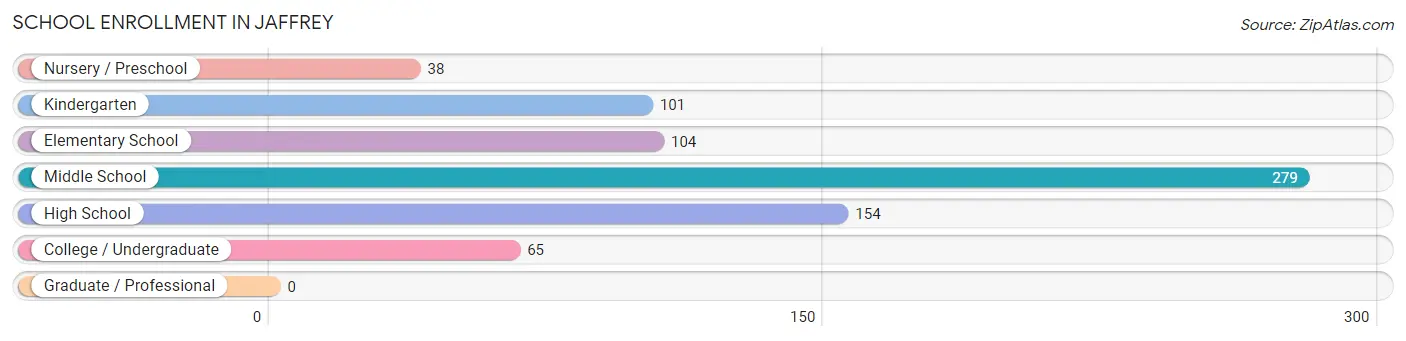
| School Level | # Students | % Students |
| Nursery / Preschool | 38 | 5.1% |
| Kindergarten | 101 | 13.6% |
| Elementary School | 104 | 14.0% |
| Middle School | 279 | 37.7% |
| High School | 154 | 20.8% |
| College / Undergraduate | 65 | 8.8% |
| Graduate / Professional | 0 | 0.0% |
| Total | 741 | 100.0% |
School Enrollment by Age by Funding Source in Jaffrey
Out of a total of 741 students who are enrolled in schools in Jaffrey, 112 (15.1%) attend a private institution, while the remaining 629 (84.9%) are enrolled in public schools. The age group of 35 years and over has the highest likelihood of being enrolled in private schools, with 23 (100.0% in the age bracket) enrolled. Conversely, the age group of 5 to 9 year old has the lowest likelihood of being enrolled in a private school, with 198 (100.0% in the age bracket) attending a public institution.
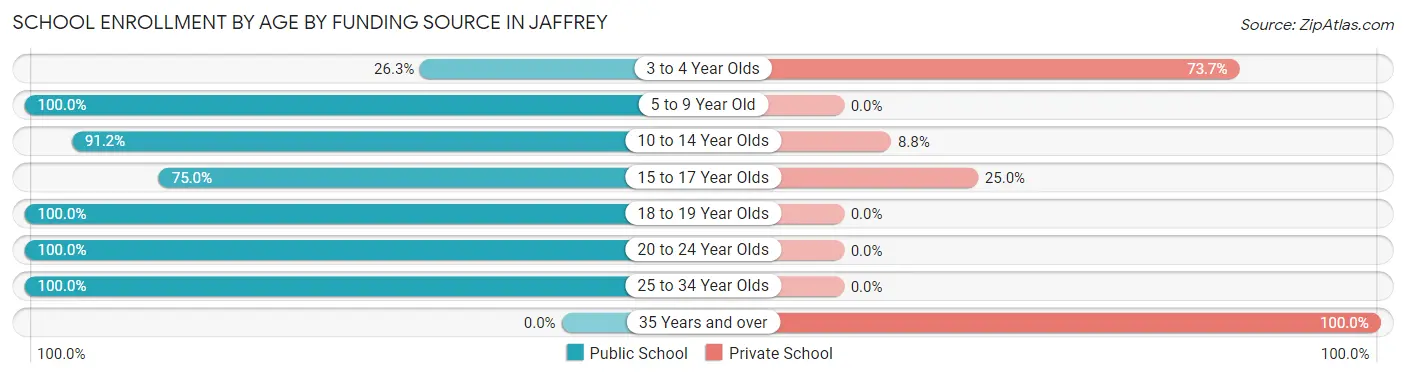
| Age Bracket | Public School | Private School |
| 3 to 4 Year Olds | 10 (26.3%) | 28 (73.7%) |
| 5 to 9 Year Old | 198 (100.0%) | 0 (0.0%) |
| 10 to 14 Year Olds | 269 (91.2%) | 26 (8.8%) |
| 15 to 17 Year Olds | 105 (75.0%) | 35 (25.0%) |
| 18 to 19 Year Olds | 5 (100.0%) | 0 (0.0%) |
| 20 to 24 Year Olds | 33 (100.0%) | 0 (0.0%) |
| 25 to 34 Year Olds | 9 (100.0%) | 0 (0.0%) |
| 35 Years and over | 0 (0.0%) | 23 (100.0%) |
| Total | 629 (84.9%) | 112 (15.1%) |
Educational Attainment by Field of Study in Jaffrey
Arts & humanities (136 | 25.6%), bio, nature & agricultural (85 | 16.0%), social sciences (56 | 10.5%), business (55 | 10.3%), and education (47 | 8.8%) are the most common fields of study among 532 individuals in Jaffrey who have obtained a bachelor's degree or higher.
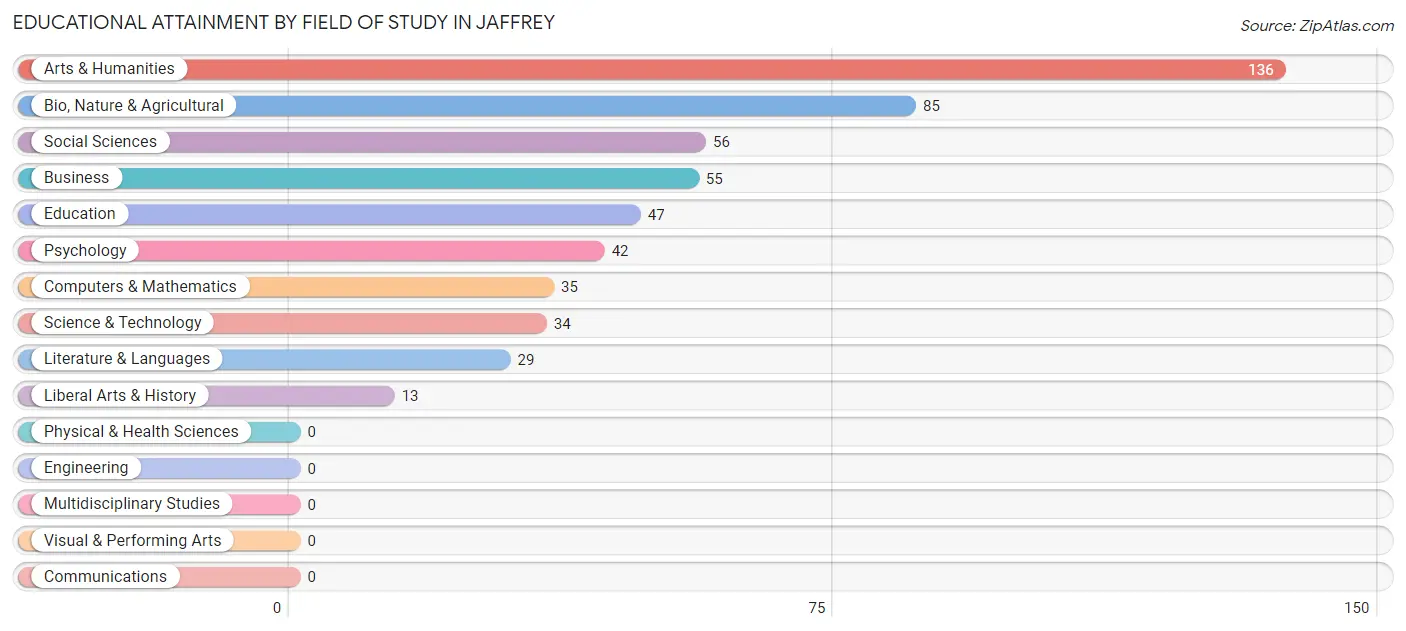
| Field of Study | # Graduates | % Graduates |
| Computers & Mathematics | 35 | 6.6% |
| Bio, Nature & Agricultural | 85 | 16.0% |
| Physical & Health Sciences | 0 | 0.0% |
| Psychology | 42 | 7.9% |
| Social Sciences | 56 | 10.5% |
| Engineering | 0 | 0.0% |
| Multidisciplinary Studies | 0 | 0.0% |
| Science & Technology | 34 | 6.4% |
| Business | 55 | 10.3% |
| Education | 47 | 8.8% |
| Literature & Languages | 29 | 5.4% |
| Liberal Arts & History | 13 | 2.4% |
| Visual & Performing Arts | 0 | 0.0% |
| Communications | 0 | 0.0% |
| Arts & Humanities | 136 | 25.6% |
| Total | 532 | 100.0% |
Transportation & Commute in Jaffrey
Vehicle Availability by Sex in Jaffrey
The most prevalent vehicle ownership categories in Jaffrey are males with 2 vehicles (361, accounting for 43.3%) and females with 2 vehicles (298, making up 51.2%).
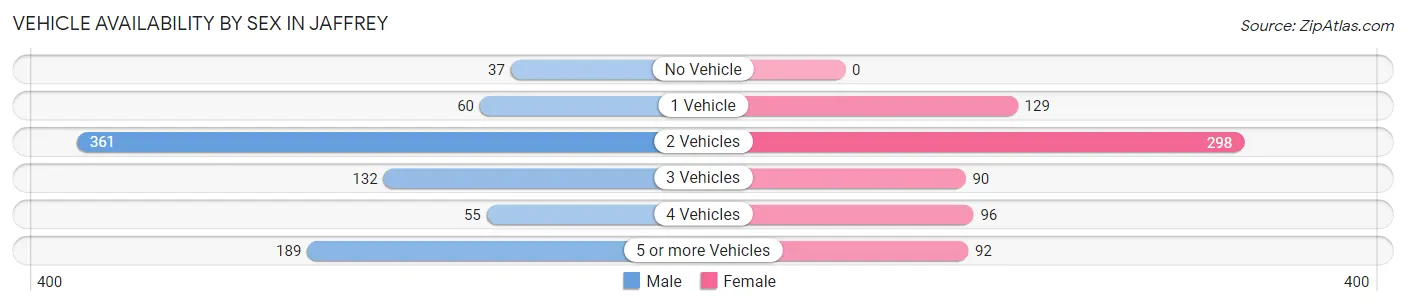
| Vehicles Available | Male | Female |
| No Vehicle | 37 (4.4%) | 0 (0.0%) |
| 1 Vehicle | 60 (7.2%) | 129 (18.3%) |
| 2 Vehicles | 361 (43.3%) | 298 (42.3%) |
| 3 Vehicles | 132 (15.8%) | 90 (12.8%) |
| 4 Vehicles | 55 (6.6%) | 96 (13.6%) |
| 5 or more Vehicles | 189 (22.7%) | 92 (13.1%) |
| Total | 834 (100.0%) | 705 (100.0%) |
Commute Time in Jaffrey
The most frequently occuring commute durations in Jaffrey are 5 to 9 minutes (310 commuters, 21.4%), 30 to 34 minutes (258 commuters, 17.8%), and 40 to 44 minutes (145 commuters, 10.0%).
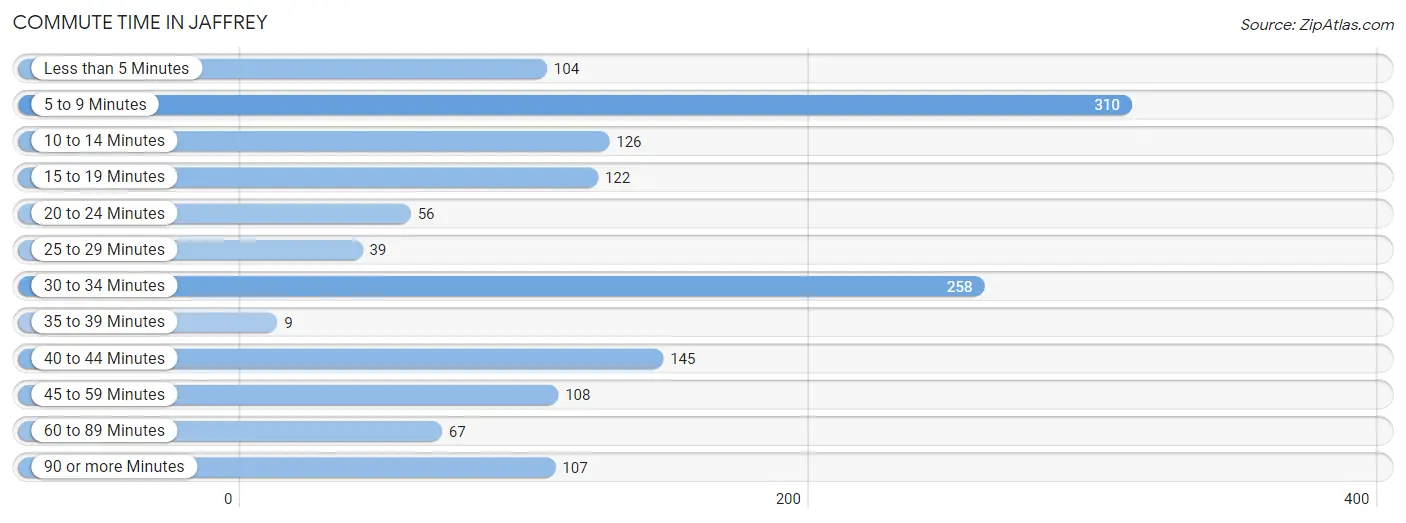
| Commute Time | # Commuters | % Commuters |
| Less than 5 Minutes | 104 | 7.2% |
| 5 to 9 Minutes | 310 | 21.4% |
| 10 to 14 Minutes | 126 | 8.7% |
| 15 to 19 Minutes | 122 | 8.4% |
| 20 to 24 Minutes | 56 | 3.9% |
| 25 to 29 Minutes | 39 | 2.7% |
| 30 to 34 Minutes | 258 | 17.8% |
| 35 to 39 Minutes | 9 | 0.6% |
| 40 to 44 Minutes | 145 | 10.0% |
| 45 to 59 Minutes | 108 | 7.4% |
| 60 to 89 Minutes | 67 | 4.6% |
| 90 or more Minutes | 107 | 7.4% |
Commute Time by Sex in Jaffrey
The most common commute times in Jaffrey are 5 to 9 minutes (193 commuters, 24.5%) for males and 30 to 34 minutes (172 commuters, 25.9%) for females.
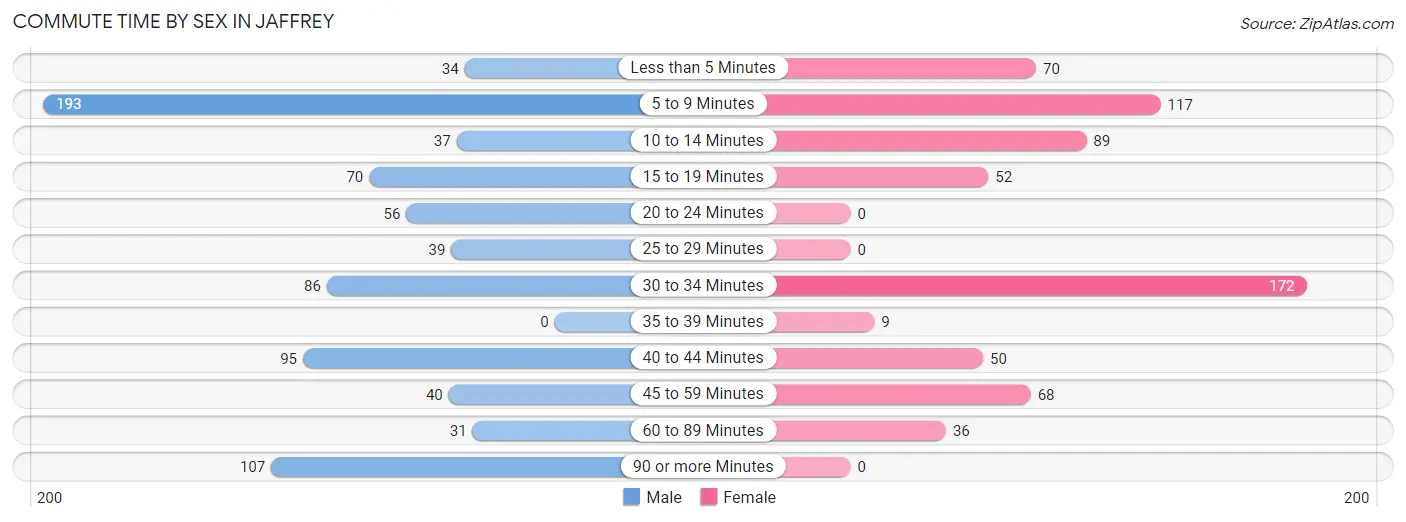
| Commute Time | Male | Female |
| Less than 5 Minutes | 34 (4.3%) | 70 (10.6%) |
| 5 to 9 Minutes | 193 (24.5%) | 117 (17.6%) |
| 10 to 14 Minutes | 37 (4.7%) | 89 (13.4%) |
| 15 to 19 Minutes | 70 (8.9%) | 52 (7.8%) |
| 20 to 24 Minutes | 56 (7.1%) | 0 (0.0%) |
| 25 to 29 Minutes | 39 (5.0%) | 0 (0.0%) |
| 30 to 34 Minutes | 86 (10.9%) | 172 (25.9%) |
| 35 to 39 Minutes | 0 (0.0%) | 9 (1.4%) |
| 40 to 44 Minutes | 95 (12.1%) | 50 (7.5%) |
| 45 to 59 Minutes | 40 (5.1%) | 68 (10.3%) |
| 60 to 89 Minutes | 31 (3.9%) | 36 (5.4%) |
| 90 or more Minutes | 107 (13.6%) | 0 (0.0%) |
Time of Departure to Work by Sex in Jaffrey
The most frequent times of departure to work in Jaffrey are 6:00 AM to 6:29 AM (198, 25.1%) for males and 7:30 AM to 7:59 AM (215, 32.4%) for females.
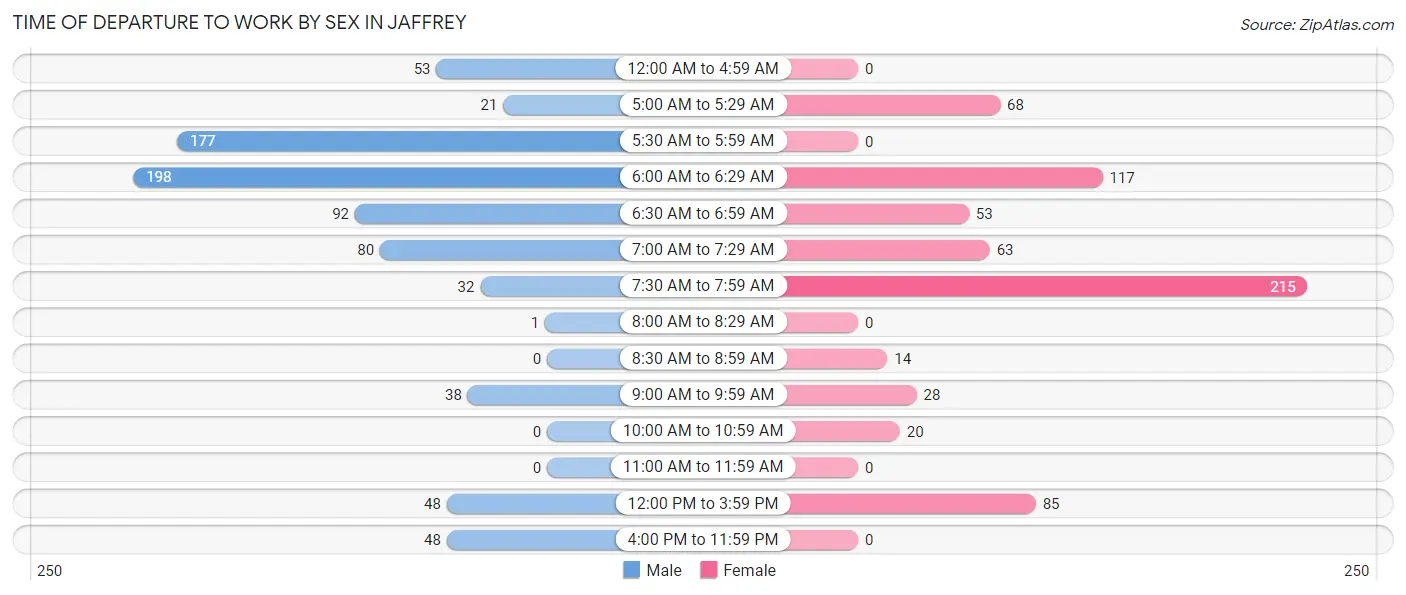
| Time of Departure | Male | Female |
| 12:00 AM to 4:59 AM | 53 (6.7%) | 0 (0.0%) |
| 5:00 AM to 5:29 AM | 21 (2.7%) | 68 (10.3%) |
| 5:30 AM to 5:59 AM | 177 (22.5%) | 0 (0.0%) |
| 6:00 AM to 6:29 AM | 198 (25.1%) | 117 (17.6%) |
| 6:30 AM to 6:59 AM | 92 (11.7%) | 53 (8.0%) |
| 7:00 AM to 7:29 AM | 80 (10.2%) | 63 (9.5%) |
| 7:30 AM to 7:59 AM | 32 (4.1%) | 215 (32.4%) |
| 8:00 AM to 8:29 AM | 1 (0.1%) | 0 (0.0%) |
| 8:30 AM to 8:59 AM | 0 (0.0%) | 14 (2.1%) |
| 9:00 AM to 9:59 AM | 38 (4.8%) | 28 (4.2%) |
| 10:00 AM to 10:59 AM | 0 (0.0%) | 20 (3.0%) |
| 11:00 AM to 11:59 AM | 0 (0.0%) | 0 (0.0%) |
| 12:00 PM to 3:59 PM | 48 (6.1%) | 85 (12.8%) |
| 4:00 PM to 11:59 PM | 48 (6.1%) | 0 (0.0%) |
| Total | 788 (100.0%) | 663 (100.0%) |
Housing Occupancy in Jaffrey
Occupancy by Ownership in Jaffrey
Of the total 1,061 dwellings in Jaffrey, owner-occupied units account for 761 (71.7%), while renter-occupied units make up 300 (28.3%).
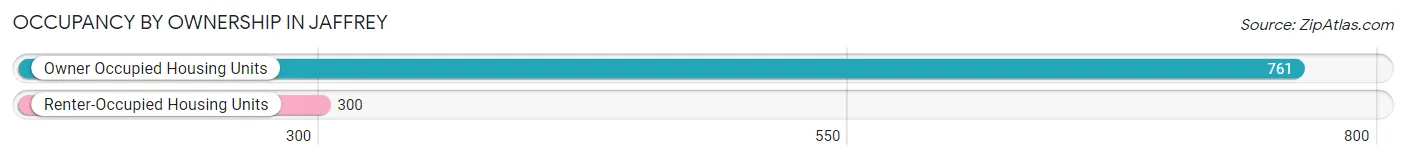
| Occupancy | # Housing Units | % Housing Units |
| Owner Occupied Housing Units | 761 | 71.7% |
| Renter-Occupied Housing Units | 300 | 28.3% |
| Total Occupied Housing Units | 1,061 | 100.0% |
Occupancy by Household Size in Jaffrey
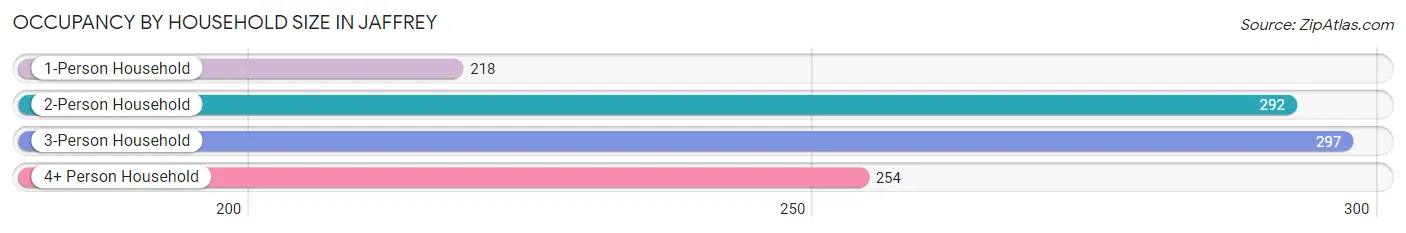
| Household Size | # Housing Units | % Housing Units |
| 1-Person Household | 218 | 20.5% |
| 2-Person Household | 292 | 27.5% |
| 3-Person Household | 297 | 28.0% |
| 4+ Person Household | 254 | 23.9% |
| Total Housing Units | 1,061 | 100.0% |
Occupancy by Ownership by Household Size in Jaffrey
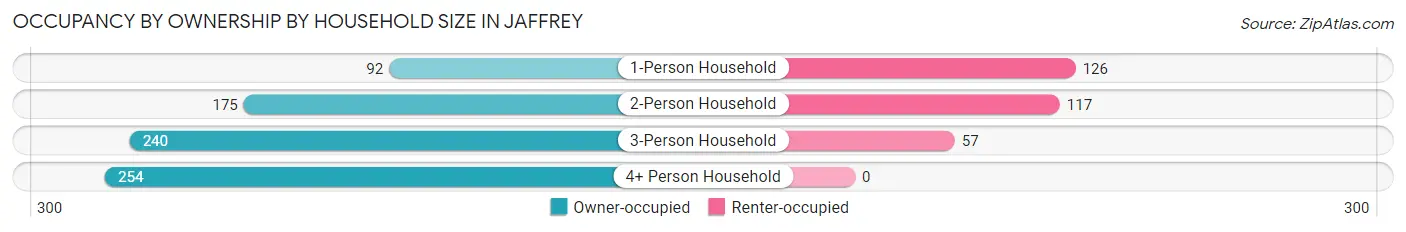
| Household Size | Owner-occupied | Renter-occupied |
| 1-Person Household | 92 (42.2%) | 126 (57.8%) |
| 2-Person Household | 175 (59.9%) | 117 (40.1%) |
| 3-Person Household | 240 (80.8%) | 57 (19.2%) |
| 4+ Person Household | 254 (100.0%) | 0 (0.0%) |
| Total Housing Units | 761 (71.7%) | 300 (28.3%) |
Occupancy by Educational Attainment in Jaffrey
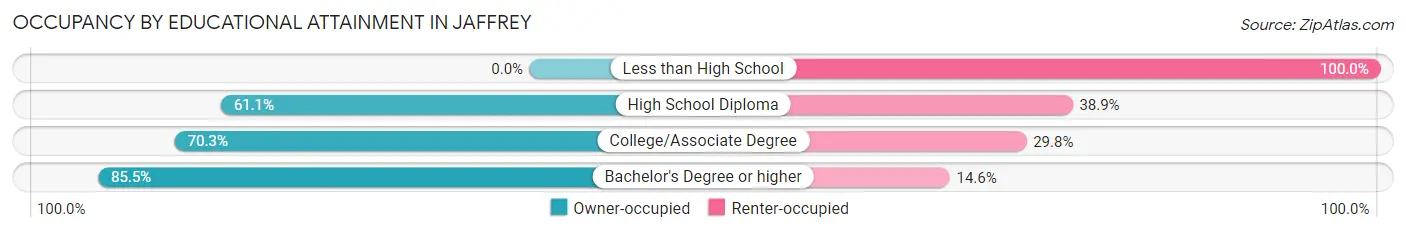
| Household Size | Owner-occupied | Renter-occupied |
| Less than High School | 0 (0.0%) | 19 (100.0%) |
| High School Diploma | 190 (61.1%) | 121 (38.9%) |
| College/Associate Degree | 248 (70.3%) | 105 (29.7%) |
| Bachelor's Degree or higher | 323 (85.5%) | 55 (14.5%) |
Occupancy by Age of Householder in Jaffrey
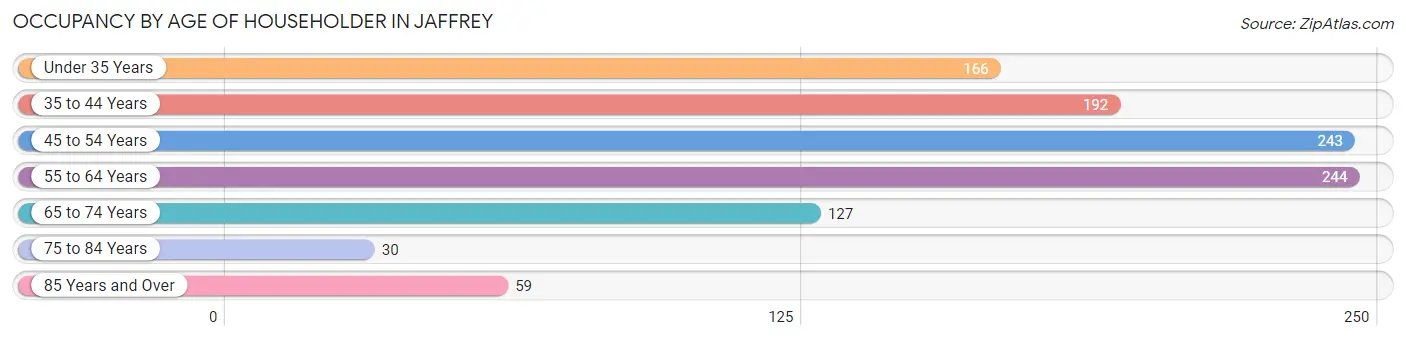
| Age Bracket | # Households | % Households |
| Under 35 Years | 166 | 15.7% |
| 35 to 44 Years | 192 | 18.1% |
| 45 to 54 Years | 243 | 22.9% |
| 55 to 64 Years | 244 | 23.0% |
| 65 to 74 Years | 127 | 12.0% |
| 75 to 84 Years | 30 | 2.8% |
| 85 Years and Over | 59 | 5.6% |
| Total | 1,061 | 100.0% |
Housing Finances in Jaffrey
Median Income by Occupancy in Jaffrey
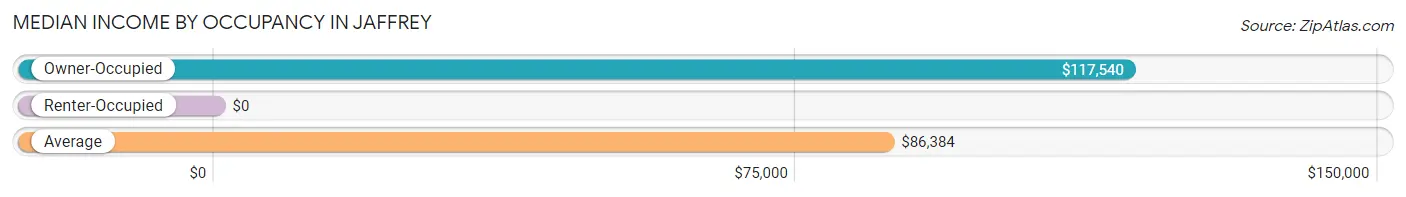
| Occupancy Type | # Households | Median Income |
| Owner-Occupied | 761 (71.7%) | $117,540 |
| Renter-Occupied | 300 (28.3%) | $0 |
| Average | 1,061 (100.0%) | $86,384 |
Occupancy by Householder Income Bracket in Jaffrey
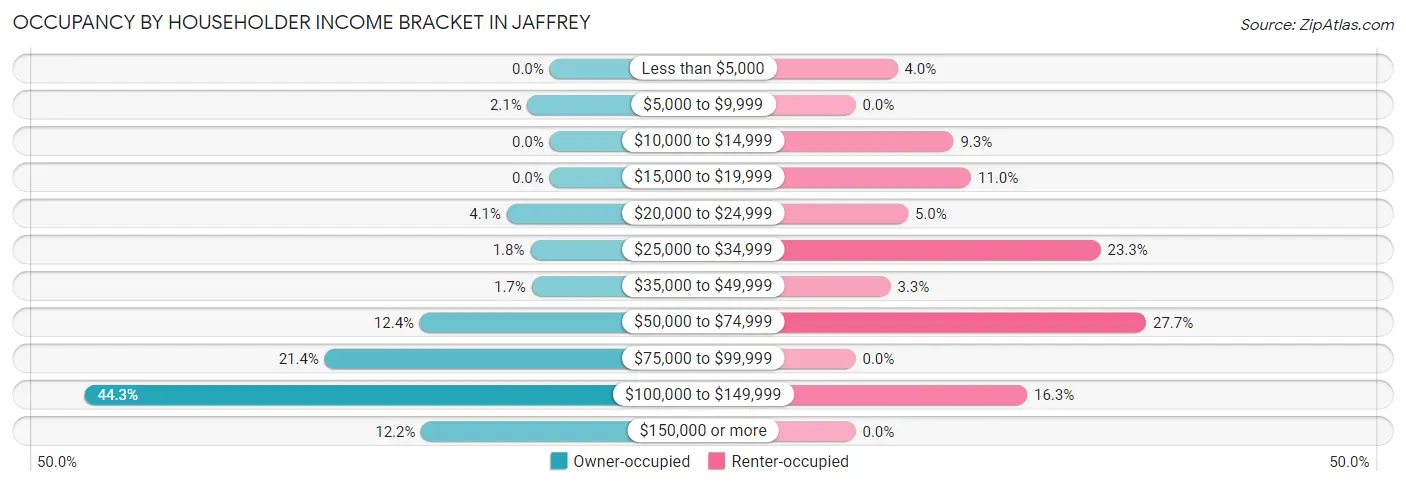
| Income Bracket | Owner-occupied | Renter-occupied |
| Less than $5,000 | 0 (0.0%) | 12 (4.0%) |
| $5,000 to $9,999 | 16 (2.1%) | 0 (0.0%) |
| $10,000 to $14,999 | 0 (0.0%) | 28 (9.3%) |
| $15,000 to $19,999 | 0 (0.0%) | 33 (11.0%) |
| $20,000 to $24,999 | 31 (4.1%) | 15 (5.0%) |
| $25,000 to $34,999 | 14 (1.8%) | 70 (23.3%) |
| $35,000 to $49,999 | 13 (1.7%) | 10 (3.3%) |
| $50,000 to $74,999 | 94 (12.3%) | 83 (27.7%) |
| $75,000 to $99,999 | 163 (21.4%) | 0 (0.0%) |
| $100,000 to $149,999 | 337 (44.3%) | 49 (16.3%) |
| $150,000 or more | 93 (12.2%) | 0 (0.0%) |
| Total | 761 (100.0%) | 300 (100.0%) |
Monthly Housing Cost Tiers in Jaffrey
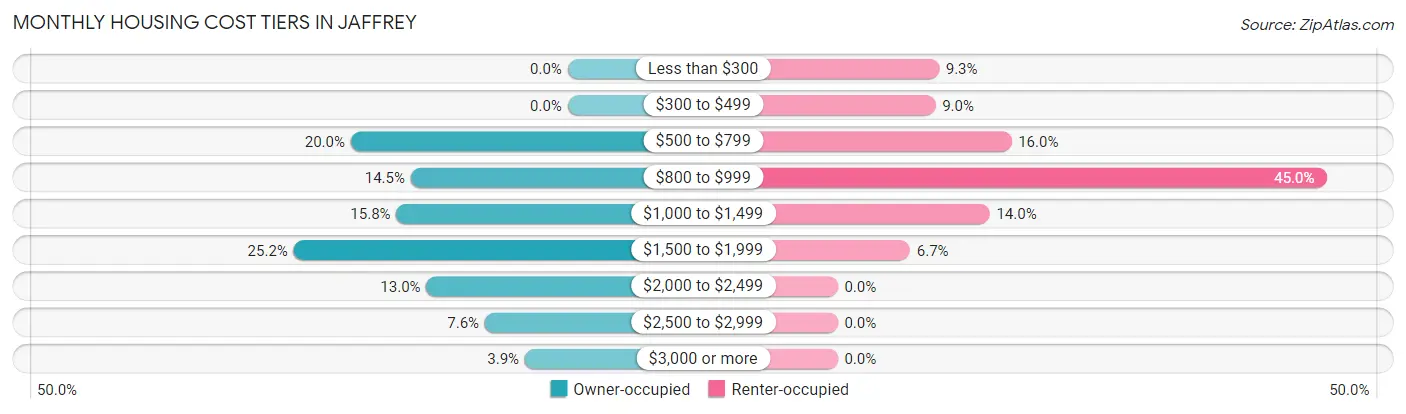
| Monthly Cost | Owner-occupied | Renter-occupied |
| Less than $300 | 0 (0.0%) | 28 (9.3%) |
| $300 to $499 | 0 (0.0%) | 27 (9.0%) |
| $500 to $799 | 152 (20.0%) | 48 (16.0%) |
| $800 to $999 | 110 (14.4%) | 135 (45.0%) |
| $1,000 to $1,499 | 120 (15.8%) | 42 (14.0%) |
| $1,500 to $1,999 | 192 (25.2%) | 20 (6.7%) |
| $2,000 to $2,499 | 99 (13.0%) | 0 (0.0%) |
| $2,500 to $2,999 | 58 (7.6%) | 0 (0.0%) |
| $3,000 or more | 30 (3.9%) | 0 (0.0%) |
| Total | 761 (100.0%) | 300 (100.0%) |
Physical Housing Characteristics in Jaffrey
Housing Structures in Jaffrey
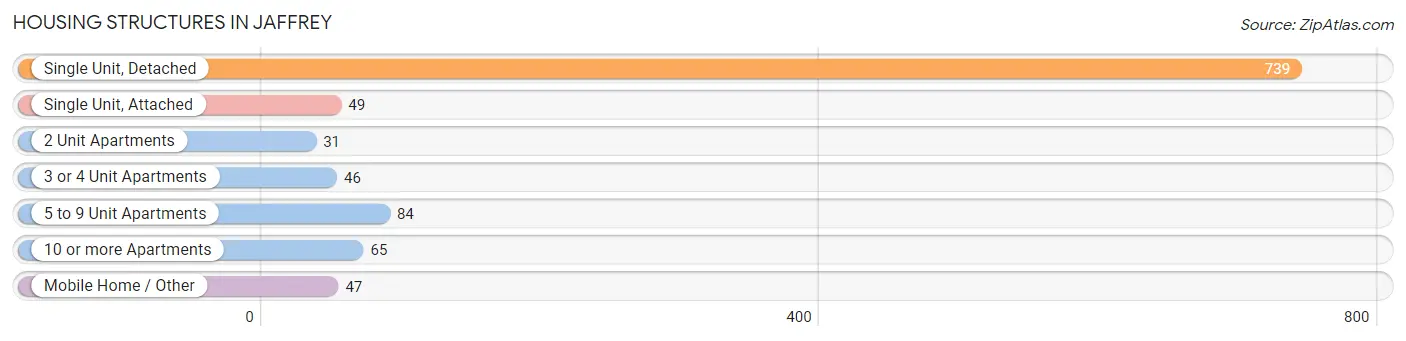
| Structure Type | # Housing Units | % Housing Units |
| Single Unit, Detached | 739 | 69.7% |
| Single Unit, Attached | 49 | 4.6% |
| 2 Unit Apartments | 31 | 2.9% |
| 3 or 4 Unit Apartments | 46 | 4.3% |
| 5 to 9 Unit Apartments | 84 | 7.9% |
| 10 or more Apartments | 65 | 6.1% |
| Mobile Home / Other | 47 | 4.4% |
| Total | 1,061 | 100.0% |
Housing Structures by Occupancy in Jaffrey
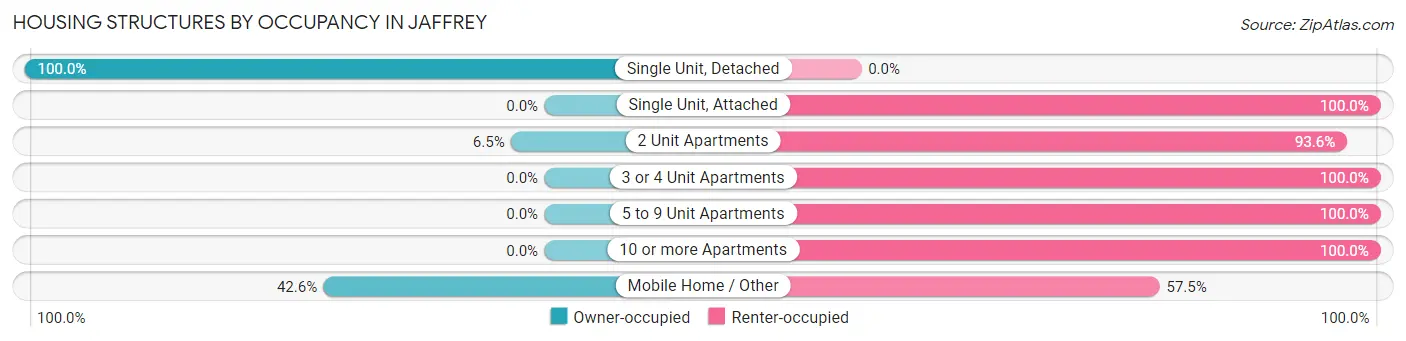
| Structure Type | Owner-occupied | Renter-occupied |
| Single Unit, Detached | 739 (100.0%) | 0 (0.0%) |
| Single Unit, Attached | 0 (0.0%) | 49 (100.0%) |
| 2 Unit Apartments | 2 (6.5%) | 29 (93.5%) |
| 3 or 4 Unit Apartments | 0 (0.0%) | 46 (100.0%) |
| 5 to 9 Unit Apartments | 0 (0.0%) | 84 (100.0%) |
| 10 or more Apartments | 0 (0.0%) | 65 (100.0%) |
| Mobile Home / Other | 20 (42.5%) | 27 (57.5%) |
| Total | 761 (71.7%) | 300 (28.3%) |
Housing Structures by Number of Rooms in Jaffrey
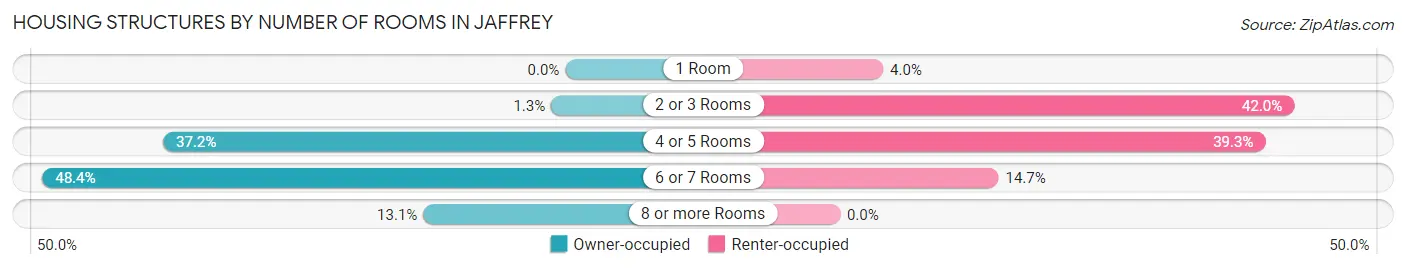
| Number of Rooms | Owner-occupied | Renter-occupied |
| 1 Room | 0 (0.0%) | 12 (4.0%) |
| 2 or 3 Rooms | 10 (1.3%) | 126 (42.0%) |
| 4 or 5 Rooms | 283 (37.2%) | 118 (39.3%) |
| 6 or 7 Rooms | 368 (48.4%) | 44 (14.7%) |
| 8 or more Rooms | 100 (13.1%) | 0 (0.0%) |
| Total | 761 (100.0%) | 300 (100.0%) |
Housing Structure by Heating Type in Jaffrey
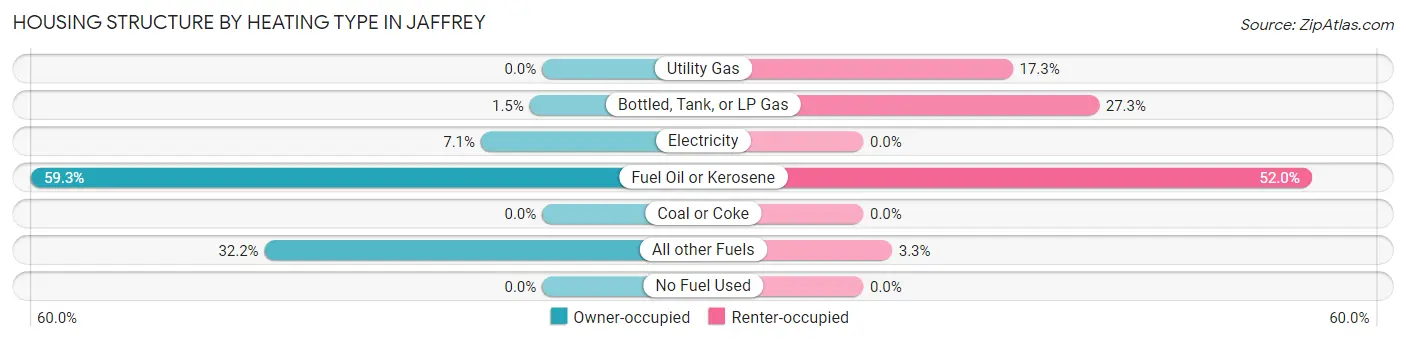
| Heating Type | Owner-occupied | Renter-occupied |
| Utility Gas | 0 (0.0%) | 52 (17.3%) |
| Bottled, Tank, or LP Gas | 11 (1.5%) | 82 (27.3%) |
| Electricity | 54 (7.1%) | 0 (0.0%) |
| Fuel Oil or Kerosene | 451 (59.3%) | 156 (52.0%) |
| Coal or Coke | 0 (0.0%) | 0 (0.0%) |
| All other Fuels | 245 (32.2%) | 10 (3.3%) |
| No Fuel Used | 0 (0.0%) | 0 (0.0%) |
| Total | 761 (100.0%) | 300 (100.0%) |
Household Vehicle Usage in Jaffrey
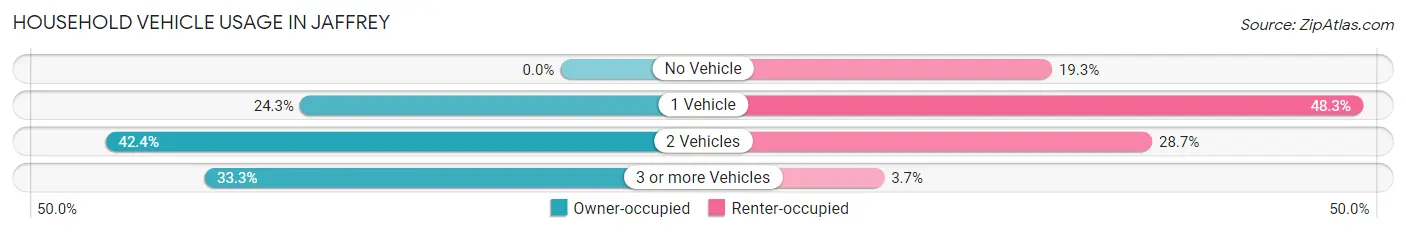
| Vehicles per Household | Owner-occupied | Renter-occupied |
| No Vehicle | 0 (0.0%) | 58 (19.3%) |
| 1 Vehicle | 185 (24.3%) | 145 (48.3%) |
| 2 Vehicles | 323 (42.4%) | 86 (28.7%) |
| 3 or more Vehicles | 253 (33.3%) | 11 (3.7%) |
| Total | 761 (100.0%) | 300 (100.0%) |
Real Estate & Mortgages in Jaffrey
Real Estate and Mortgage Overview in Jaffrey
| Characteristic | Without Mortgage | With Mortgage |
| Housing Units | 240 | 521 |
| Median Property Value | $169,900 | $236,200 |
| Median Household Income | $111,413 | $93 |
| Monthly Housing Costs | $769 | $30 |
| Real Estate Taxes | $4,680 | $0 |
Property Value by Mortgage Status in Jaffrey
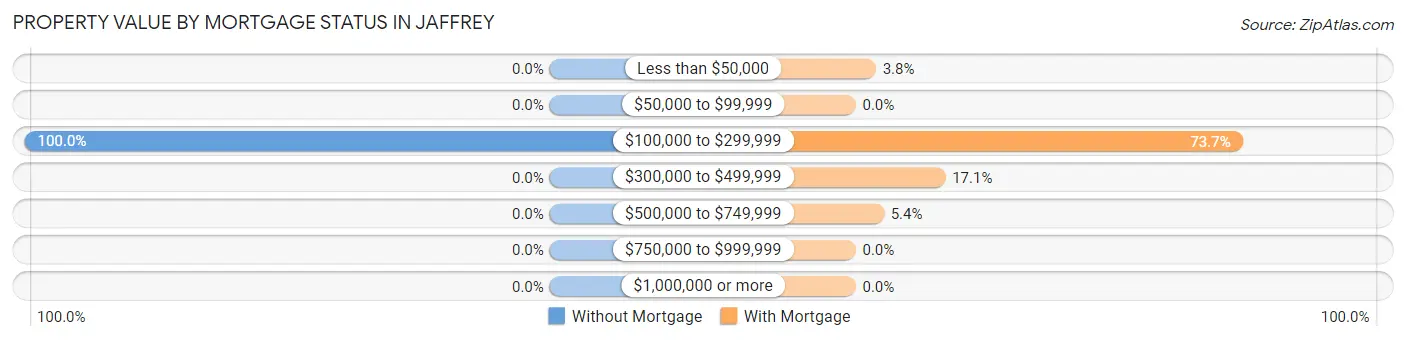
| Property Value | Without Mortgage | With Mortgage |
| Less than $50,000 | 0 (0.0%) | 20 (3.8%) |
| $50,000 to $99,999 | 0 (0.0%) | 0 (0.0%) |
| $100,000 to $299,999 | 240 (100.0%) | 384 (73.7%) |
| $300,000 to $499,999 | 0 (0.0%) | 89 (17.1%) |
| $500,000 to $749,999 | 0 (0.0%) | 28 (5.4%) |
| $750,000 to $999,999 | 0 (0.0%) | 0 (0.0%) |
| $1,000,000 or more | 0 (0.0%) | 0 (0.0%) |
| Total | 240 (100.0%) | 521 (100.0%) |
Household Income by Mortgage Status in Jaffrey
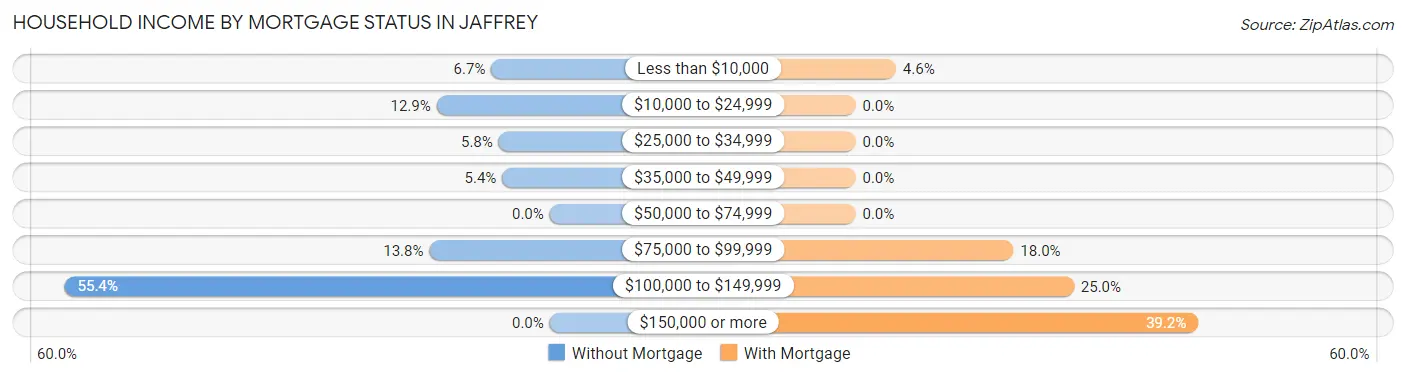
| Household Income | Without Mortgage | With Mortgage |
| Less than $10,000 | 16 (6.7%) | 24 (4.6%) |
| $10,000 to $24,999 | 31 (12.9%) | 0 (0.0%) |
| $25,000 to $34,999 | 14 (5.8%) | 0 (0.0%) |
| $35,000 to $49,999 | 13 (5.4%) | 0 (0.0%) |
| $50,000 to $74,999 | 0 (0.0%) | 0 (0.0%) |
| $75,000 to $99,999 | 33 (13.8%) | 94 (18.0%) |
| $100,000 to $149,999 | 133 (55.4%) | 130 (24.9%) |
| $150,000 or more | 0 (0.0%) | 204 (39.2%) |
| Total | 240 (100.0%) | 521 (100.0%) |
Property Value to Household Income Ratio in Jaffrey
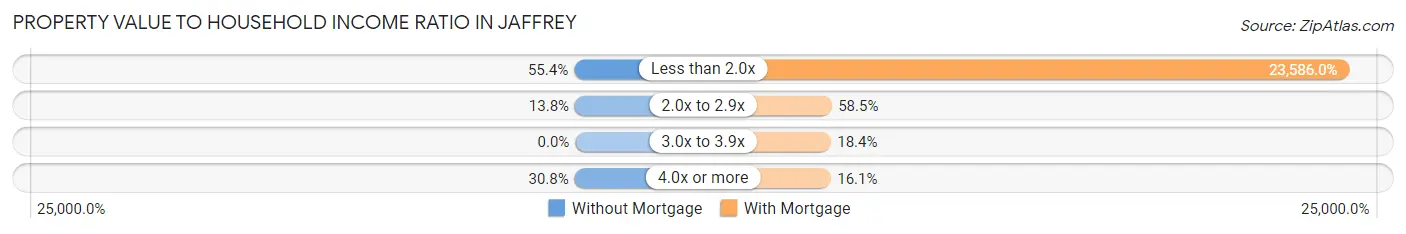
| Value-to-Income Ratio | Without Mortgage | With Mortgage |
| Less than 2.0x | 133 (55.4%) | 122,883 (23,586.0%) |
| 2.0x to 2.9x | 33 (13.8%) | 305 (58.5%) |
| 3.0x to 3.9x | 0 (0.0%) | 96 (18.4%) |
| 4.0x or more | 74 (30.8%) | 84 (16.1%) |
| Total | 240 (100.0%) | 521 (100.0%) |
Real Estate Taxes by Mortgage Status in Jaffrey
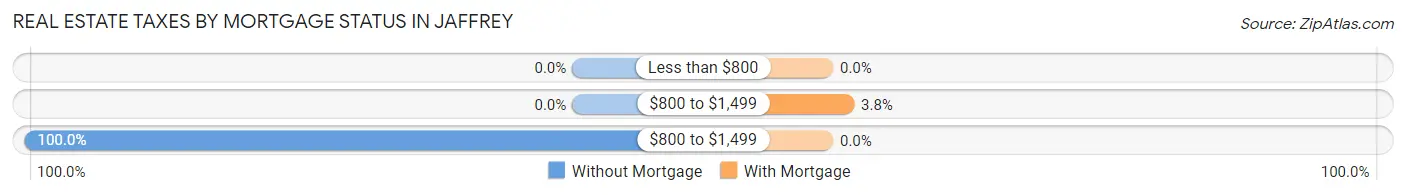
| Property Taxes | Without Mortgage | With Mortgage |
| Less than $800 | 0 (0.0%) | 0 (0.0%) |
| $800 to $1,499 | 0 (0.0%) | 20 (3.8%) |
| $800 to $1,499 | 240 (100.0%) | 0 (0.0%) |
| Total | 240 (100.0%) | 521 (100.0%) |
Health & Disability in Jaffrey
Health Insurance Coverage by Age in Jaffrey
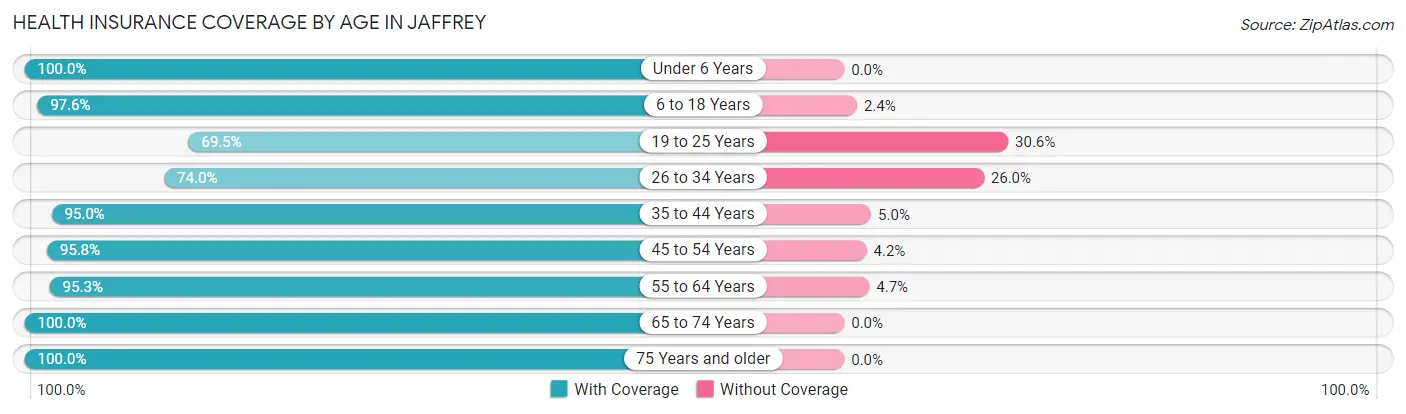
| Age Bracket | With Coverage | Without Coverage |
| Under 6 Years | 221 (100.0%) | 0 (0.0%) |
| 6 to 18 Years | 539 (97.6%) | 13 (2.4%) |
| 19 to 25 Years | 216 (69.5%) | 95 (30.5%) |
| 26 to 34 Years | 233 (74.0%) | 82 (26.0%) |
| 35 to 44 Years | 360 (95.0%) | 19 (5.0%) |
| 45 to 54 Years | 461 (95.8%) | 20 (4.2%) |
| 55 to 64 Years | 387 (95.3%) | 19 (4.7%) |
| 65 to 74 Years | 179 (100.0%) | 0 (0.0%) |
| 75 Years and older | 192 (100.0%) | 0 (0.0%) |
| Total | 2,788 (91.8%) | 248 (8.2%) |
Health Insurance Coverage by Citizenship Status in Jaffrey
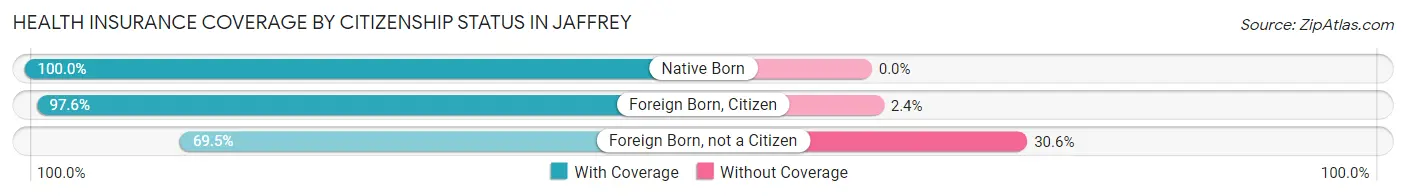
| Citizenship Status | With Coverage | Without Coverage |
| Native Born | 221 (100.0%) | 0 (0.0%) |
| Foreign Born, Citizen | 539 (97.6%) | 13 (2.4%) |
| Foreign Born, not a Citizen | 216 (69.5%) | 95 (30.5%) |
Health Insurance Coverage by Household Income in Jaffrey
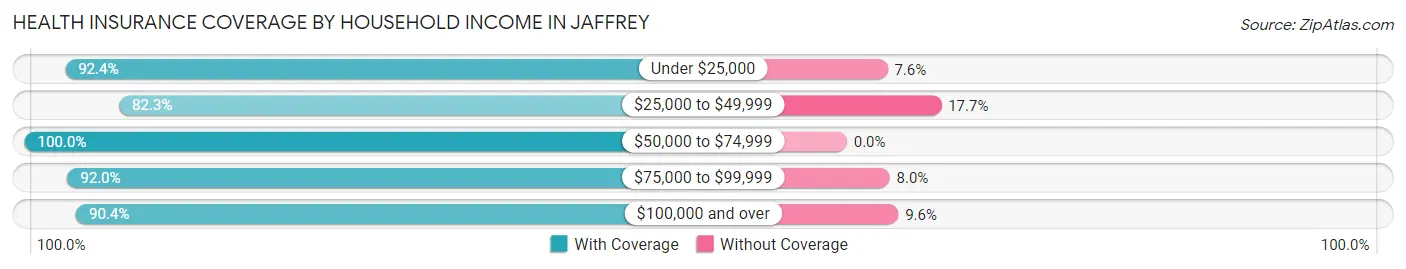
| Household Income | With Coverage | Without Coverage |
| Under $25,000 | 206 (92.4%) | 17 (7.6%) |
| $25,000 to $49,999 | 107 (82.3%) | 23 (17.7%) |
| $50,000 to $74,999 | 436 (100.0%) | 0 (0.0%) |
| $75,000 to $99,999 | 447 (92.0%) | 39 (8.0%) |
| $100,000 and over | 1,584 (90.4%) | 169 (9.6%) |
Public vs Private Health Insurance Coverage by Age in Jaffrey
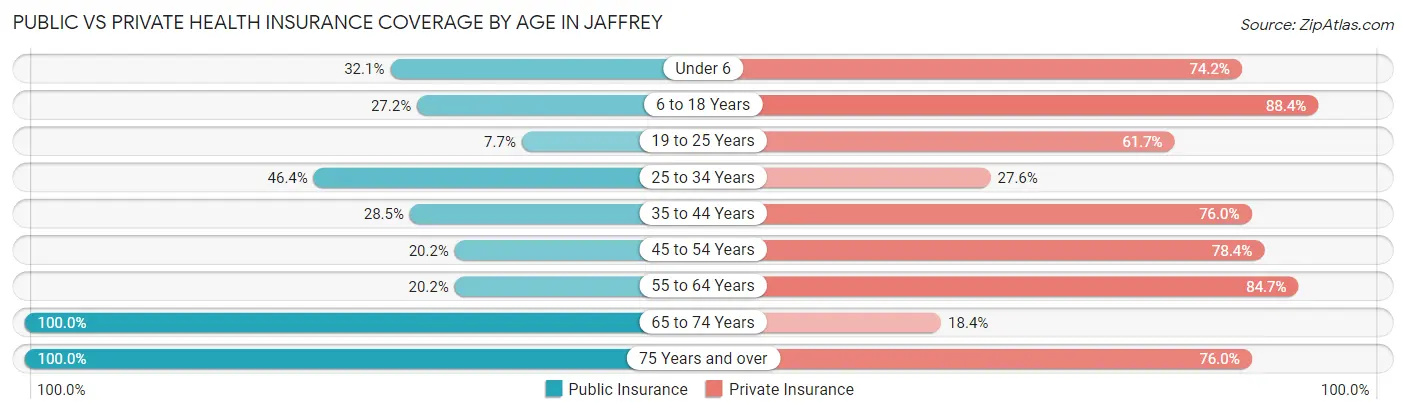
| Age Bracket | Public Insurance | Private Insurance |
| Under 6 | 71 (32.1%) | 164 (74.2%) |
| 6 to 18 Years | 150 (27.2%) | 488 (88.4%) |
| 19 to 25 Years | 24 (7.7%) | 192 (61.7%) |
| 25 to 34 Years | 146 (46.4%) | 87 (27.6%) |
| 35 to 44 Years | 108 (28.5%) | 288 (76.0%) |
| 45 to 54 Years | 97 (20.2%) | 377 (78.4%) |
| 55 to 64 Years | 82 (20.2%) | 344 (84.7%) |
| 65 to 74 Years | 179 (100.0%) | 33 (18.4%) |
| 75 Years and over | 192 (100.0%) | 146 (76.0%) |
| Total | 1,049 (34.5%) | 2,119 (69.8%) |
Disability Status by Sex by Age in Jaffrey
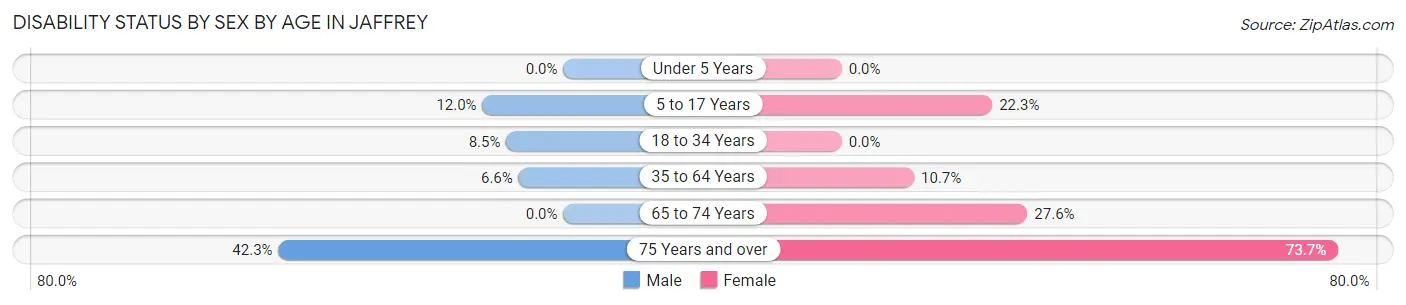
| Age Bracket | Male | Female |
| Under 5 Years | 0 (0.0%) | 0 (0.0%) |
| 5 to 17 Years | 34 (12.0%) | 82 (22.3%) |
| 18 to 34 Years | 31 (8.5%) | 0 (0.0%) |
| 35 to 64 Years | 42 (6.6%) | 68 (10.7%) |
| 65 to 74 Years | 0 (0.0%) | 35 (27.6%) |
| 75 Years and over | 33 (42.3%) | 84 (73.7%) |
Disability Class by Sex by Age in Jaffrey
Disability Class: Hearing Difficulty
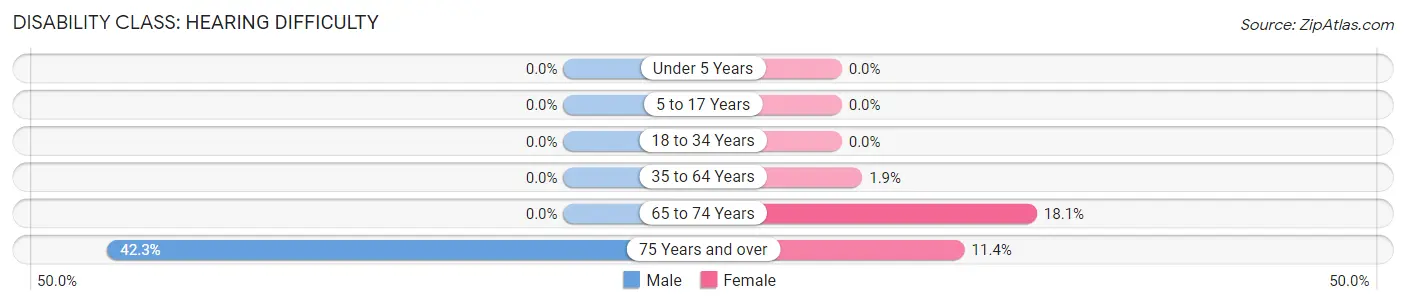
| Age Bracket | Male | Female |
| Under 5 Years | 0 (0.0%) | 0 (0.0%) |
| 5 to 17 Years | 0 (0.0%) | 0 (0.0%) |
| 18 to 34 Years | 0 (0.0%) | 0 (0.0%) |
| 35 to 64 Years | 0 (0.0%) | 12 (1.9%) |
| 65 to 74 Years | 0 (0.0%) | 23 (18.1%) |
| 75 Years and over | 33 (42.3%) | 13 (11.4%) |
Disability Class: Vision Difficulty
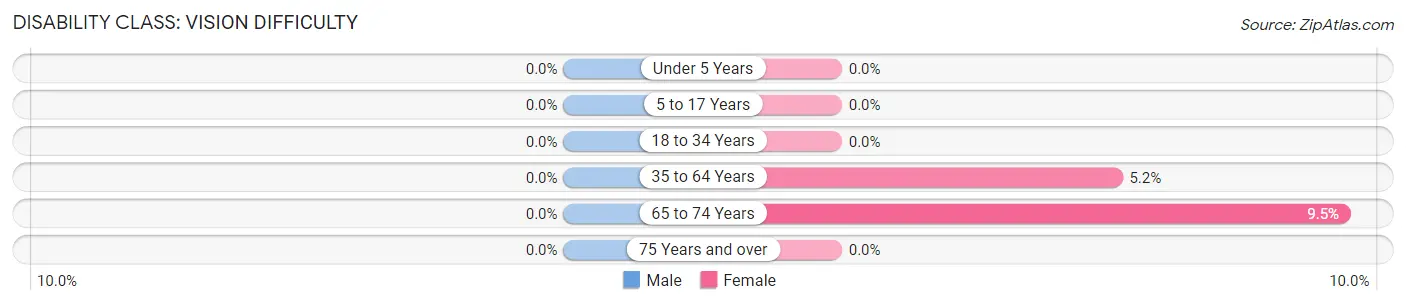
| Age Bracket | Male | Female |
| Under 5 Years | 0 (0.0%) | 0 (0.0%) |
| 5 to 17 Years | 0 (0.0%) | 0 (0.0%) |
| 18 to 34 Years | 0 (0.0%) | 0 (0.0%) |
| 35 to 64 Years | 0 (0.0%) | 33 (5.2%) |
| 65 to 74 Years | 0 (0.0%) | 12 (9.5%) |
| 75 Years and over | 0 (0.0%) | 0 (0.0%) |
Disability Class: Cognitive Difficulty
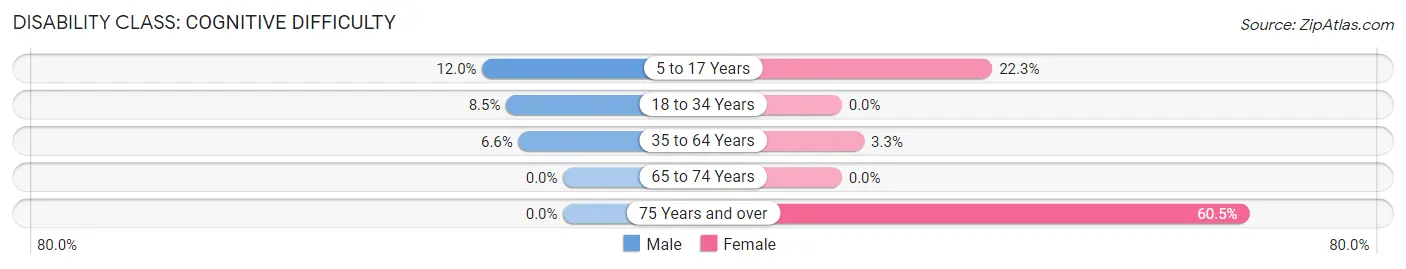
| Age Bracket | Male | Female |
| 5 to 17 Years | 34 (12.0%) | 82 (22.3%) |
| 18 to 34 Years | 31 (8.5%) | 0 (0.0%) |
| 35 to 64 Years | 42 (6.6%) | 21 (3.3%) |
| 65 to 74 Years | 0 (0.0%) | 0 (0.0%) |
| 75 Years and over | 0 (0.0%) | 69 (60.5%) |
Disability Class: Ambulatory Difficulty
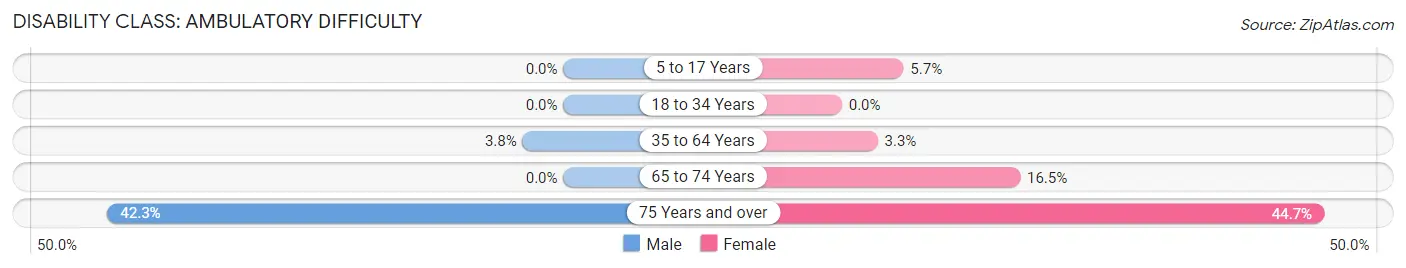
| Age Bracket | Male | Female |
| 5 to 17 Years | 0 (0.0%) | 21 (5.7%) |
| 18 to 34 Years | 0 (0.0%) | 0 (0.0%) |
| 35 to 64 Years | 24 (3.8%) | 21 (3.3%) |
| 65 to 74 Years | 0 (0.0%) | 21 (16.5%) |
| 75 Years and over | 33 (42.3%) | 51 (44.7%) |
Disability Class: Self-Care Difficulty
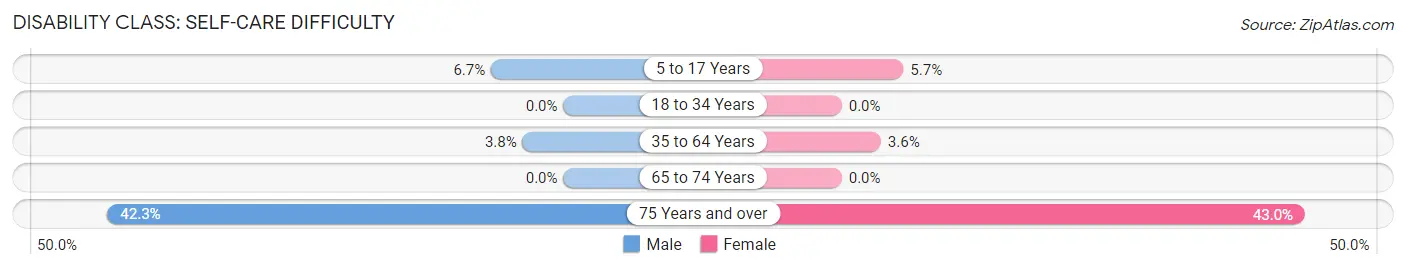
| Age Bracket | Male | Female |
| 5 to 17 Years | 19 (6.7%) | 21 (5.7%) |
| 18 to 34 Years | 0 (0.0%) | 0 (0.0%) |
| 35 to 64 Years | 24 (3.8%) | 23 (3.6%) |
| 65 to 74 Years | 0 (0.0%) | 0 (0.0%) |
| 75 Years and over | 33 (42.3%) | 49 (43.0%) |
Technology Access in Jaffrey
Computing Device Access in Jaffrey
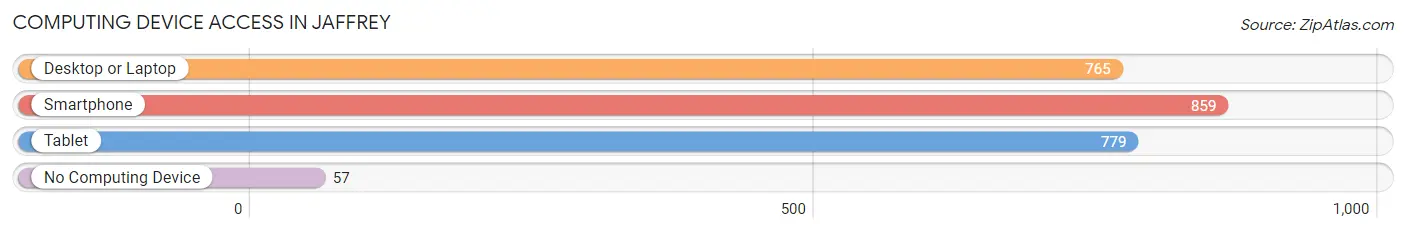
| Device Type | # Households | % Households |
| Desktop or Laptop | 765 | 72.1% |
| Smartphone | 859 | 81.0% |
| Tablet | 779 | 73.4% |
| No Computing Device | 57 | 5.4% |
| Total | 1,061 | 100.0% |
Internet Access in Jaffrey
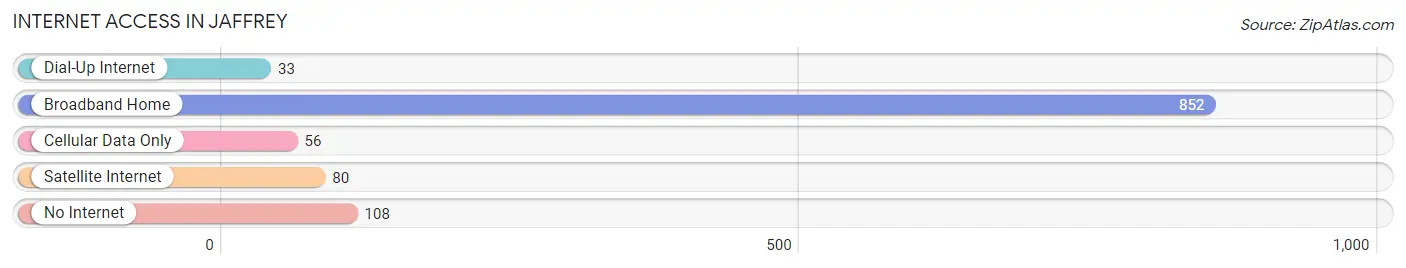
| Internet Type | # Households | % Households |
| Dial-Up Internet | 33 | 3.1% |
| Broadband Home | 852 | 80.3% |
| Cellular Data Only | 56 | 5.3% |
| Satellite Internet | 80 | 7.5% |
| No Internet | 108 | 10.2% |
| Total | 1,061 | 100.0% |
Jaffrey Summary
Jaffrey is a town located in Cheshire County, New Hampshire, United States. The population was 5,457 at the 2010 census. It is home to the annual Jaffrey Civic Center Fair, the oldest continuous fair in the United States.
History
The area that is now Jaffrey was first settled in 1736 by a group of Scots-Irish immigrants led by Reverend John Murray. The town was originally known as Monadnock No. 4, and was part of the Massachusetts Bay Colony. In 1749, the town was incorporated as Jaffrey, named after George Jaffrey, a prominent Boston merchant.
In the late 18th century, Jaffrey was a center of industry, with several mills and factories located along the Contoocook River. The town was also home to several inns and taverns, which served travelers on the Boston to Montreal stagecoach route.
In the 19th century, Jaffrey was a popular summer resort destination, with several grand hotels located in the area. The town was also home to several prominent citizens, including the poet Celia Thaxter and the inventor of the first practical typewriter, Christopher Latham Sholes.
Geography
Jaffrey is located in southwestern New Hampshire, in the Monadnock Region. The town is bordered by the towns of Rindge to the north, Peterborough to the east, Dublin to the south, and Troy to the west.
The town is situated in the foothills of Mount Monadnock, the most climbed mountain in the world. The highest point in Jaffrey is the summit of Pack Monadnock, at 2,290 feet (698 m) above sea level.
The town is drained by the Contoocook River, which flows through the center of town. The town is home to several lakes, including Lake Monomonac, Lake Contoocook, and Lake Potanipo.
Economy
The economy of Jaffrey is largely based on tourism and manufacturing. The town is home to several tourist attractions, including the Jaffrey Civic Center Fair, the oldest continuous fair in the United States. The fair is held annually in August and features agricultural exhibits, carnival rides, and live entertainment.
The town is also home to several manufacturing companies, including the Jaffrey-based Monadnock Paper Mills, which produces paper products for the printing and publishing industries. Other local businesses include a variety of retail stores, restaurants, and professional services.
Demographics
As of the 2010 census, there were 5,457 people, 2,093 households, and 1,420 families residing in the town. The population density was 166.2 people per square mile (64.1/km2). There were 2,323 housing units at an average density of 70.3 per square mile (27.1/km2).
The racial makeup of the town was 97.2% White, 0.4% African American, 0.3% Native American, 0.5% Asian, 0.1% Pacific Islander, 0.3% from other races, and 1.2% from two or more races. Hispanic or Latino of any race were 1.3% of the population.
There were 2,093 households, out of which 33.2% had children under the age of 18 living with them, 54.2% were married couples living together, 9.7% had a female householder with no husband present, and 31.7% were non-families. 25.2% of all households were made up of individuals, and 10.2% had someone living alone who was 65 years of age or older. The average household size was 2.54 and the average family size was 3.05.
In the town, the population was spread out, with 25.3% under the age of 18, 6.2% from 18 to 24, 28.2% from 25 to 44, 25.7% from 45 to 64, and 14.6% who were 65 years of age or older. The median age was 39 years. For every 100 females, there were 95.2 males. For every 100 females age 18 and over, there were 92.2 males.
The median income for a household in the town was $50,902, and the median income for a family was $60,938. Males had a median income of $41,944 versus $30,917 for females. The per capita income for the town was $24,845. About 4.2% of families and 6.2% of the population were below the poverty line, including 8.2% of those under age 18 and 5.2% of those age 65 or over.
Common Questions
What is Per Capita Income in Jaffrey?
Per Capita income in Jaffrey is $34,798.
What is the Median Family Income in Jaffrey?
Median Family Income in Jaffrey is $117,554.
What is the Median Household income in Jaffrey?
Median Household Income in Jaffrey is $86,384.
What is Income or Wage Gap in Jaffrey?
Income or Wage Gap in Jaffrey is 43.7%.
Women in Jaffrey earn 56.3 cents for every dollar earned by a man.
What is Inequality or Gini Index in Jaffrey?
Inequality or Gini Index in Jaffrey is 0.36.
What is the Total Population of Jaffrey?
Total Population of Jaffrey is 3,036.
What is the Total Male Population of Jaffrey?
Total Male Population of Jaffrey is 1,502.
What is the Total Female Population of Jaffrey?
Total Female Population of Jaffrey is 1,534.
What is the Ratio of Males per 100 Females in Jaffrey?
There are 97.91 Males per 100 Females in Jaffrey.
What is the Ratio of Females per 100 Males in Jaffrey?
There are 102.13 Females per 100 Males in Jaffrey.
What is the Median Population Age in Jaffrey?
Median Population Age in Jaffrey is 37.7 Years.
What is the Average Family Size in Jaffrey
Average Family Size in Jaffrey is 3.4 People.
What is the Average Household Size in Jaffrey
Average Household Size in Jaffrey is 2.9 People.
How Large is the Labor Force in Jaffrey?
There are 1,666 People in the Labor Forcein in Jaffrey.
What is the Percentage of People in the Labor Force in Jaffrey?
71.4% of People are in the Labor Force in Jaffrey.
What is the Unemployment Rate in Jaffrey?
Unemployment Rate in Jaffrey is 7.4%.