Newfields, NH Map & Demographics
Newfields Map
Newfields Overview
$58,664
PER CAPITA INCOME
$178,750
AVG FAMILY INCOME
$173,295
AVG HOUSEHOLD INCOME
54.9%
WAGE / INCOME GAP [ % ]
45.1¢/ $1
WAGE / INCOME GAP [ $ ]
0.24
INEQUALITY / GINI INDEX
291
TOTAL POPULATION
145
MALE POPULATION
146
FEMALE POPULATION
99.32
MALES / 100 FEMALES
100.69
FEMALES / 100 MALES
46.8
MEDIAN AGE
3.0
AVG FAMILY SIZE
2.7
AVG HOUSEHOLD SIZE
174
LABOR FORCE [ PEOPLE ]
73.4%
PERCENT IN LABOR FORCE
1.7%
UNEMPLOYMENT RATE
Newfields Zip Codes
Newfields Area Codes
Income in Newfields
Income Overview in Newfields
Per Capita Income in Newfields is $58,664, while median incomes of families and households are $178,750 and $173,295 respectively.
| Characteristic | Number | Measure |
| Per Capita Income | 291 | $58,664 |
| Median Family Income | 89 | $178,750 |
| Mean Family Income | 89 | $161,499 |
| Median Household Income | 107 | $173,295 |
| Mean Household Income | 107 | $158,428 |
| Income Deficit | 89 | $0 |
| Wage / Income Gap (%) | 291 | 54.91% |
| Wage / Income Gap ($) | 291 | 45.09¢ per $1 |
| Gini / Inequality Index | 291 | 0.24 |
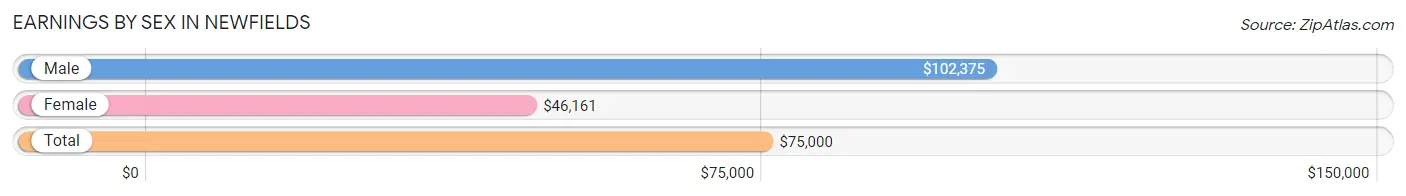
Earnings by Sex in Newfields
Average Earnings in Newfields are $75,000, $102,375 for men and $46,161 for women, a difference of 54.9%.
| Sex | Number | Average Earnings |
| Male | 95 (49.0%) | $102,375 |
| Female | 99 (51.0%) | $46,161 |
| Total | 194 (100.0%) | $75,000 |
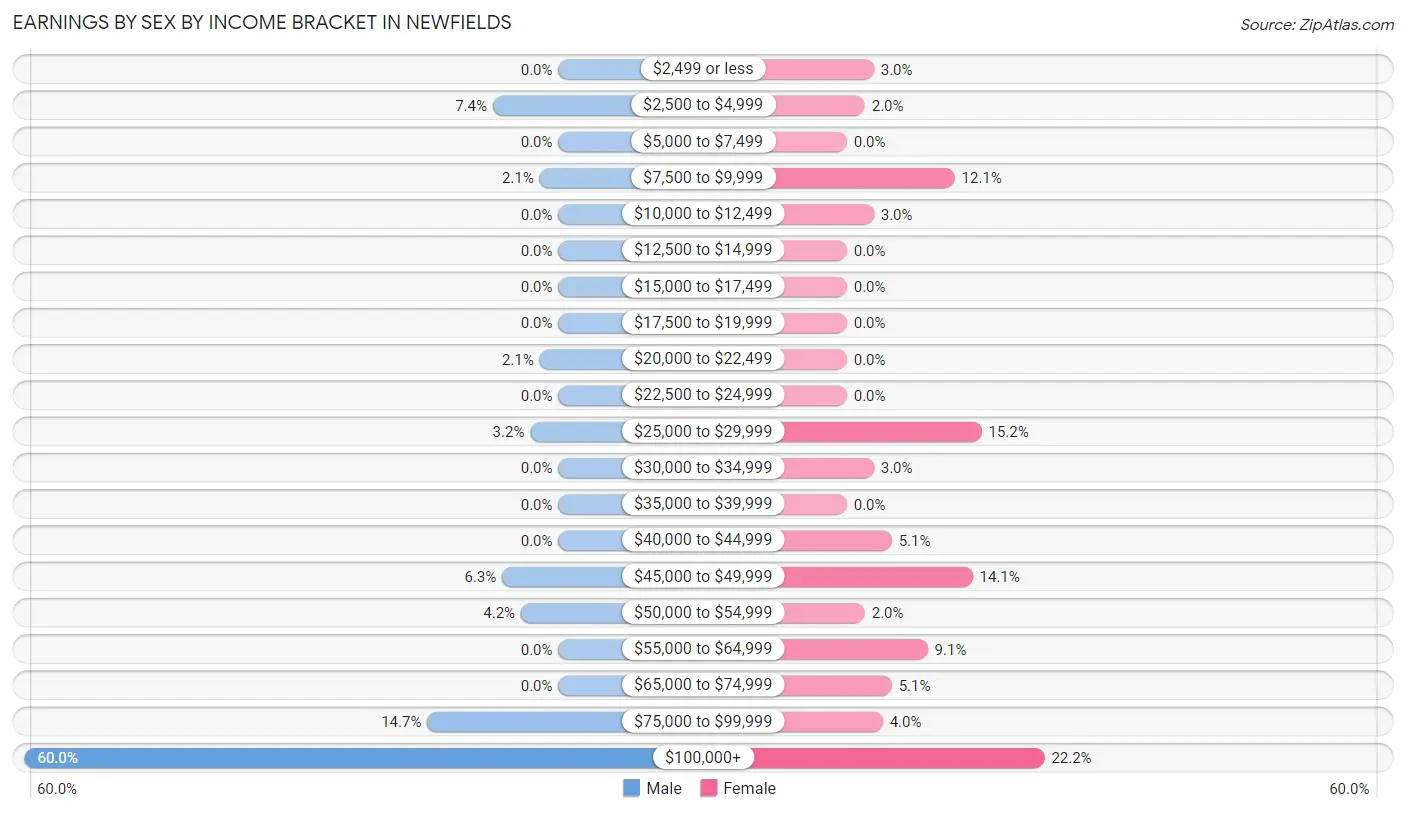
Earnings by Sex by Income Bracket in Newfields
The most common earnings brackets in Newfields are $100,000+ for men (57 | 60.0%) and $100,000+ for women (22 | 22.2%).
| Income | Male | Female |
| $2,499 or less | 0 (0.0%) | 3 (3.0%) |
| $2,500 to $4,999 | 7 (7.4%) | 2 (2.0%) |
| $5,000 to $7,499 | 0 (0.0%) | 0 (0.0%) |
| $7,500 to $9,999 | 2 (2.1%) | 12 (12.1%) |
| $10,000 to $12,499 | 0 (0.0%) | 3 (3.0%) |
| $12,500 to $14,999 | 0 (0.0%) | 0 (0.0%) |
| $15,000 to $17,499 | 0 (0.0%) | 0 (0.0%) |
| $17,500 to $19,999 | 0 (0.0%) | 0 (0.0%) |
| $20,000 to $22,499 | 2 (2.1%) | 0 (0.0%) |
| $22,500 to $24,999 | 0 (0.0%) | 0 (0.0%) |
| $25,000 to $29,999 | 3 (3.2%) | 15 (15.1%) |
| $30,000 to $34,999 | 0 (0.0%) | 3 (3.0%) |
| $35,000 to $39,999 | 0 (0.0%) | 0 (0.0%) |
| $40,000 to $44,999 | 0 (0.0%) | 5 (5.1%) |
| $45,000 to $49,999 | 6 (6.3%) | 14 (14.1%) |
| $50,000 to $54,999 | 4 (4.2%) | 2 (2.0%) |
| $55,000 to $64,999 | 0 (0.0%) | 9 (9.1%) |
| $65,000 to $74,999 | 0 (0.0%) | 5 (5.1%) |
| $75,000 to $99,999 | 14 (14.7%) | 4 (4.0%) |
| $100,000+ | 57 (60.0%) | 22 (22.2%) |
| Total | 95 (100.0%) | 99 (100.0%) |
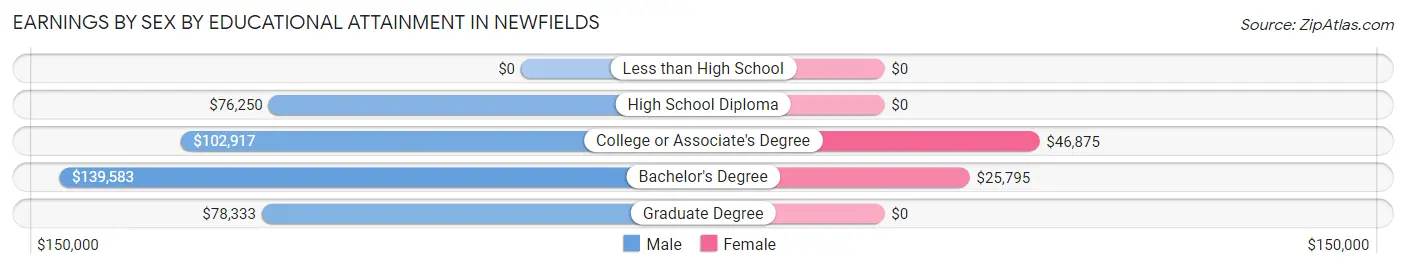
Earnings by Sex by Educational Attainment in Newfields
Average earnings in Newfields are $102,375 for men and $46,875 for women, a difference of 54.2%. Men with an educational attainment of bachelor's degree enjoy the highest average annual earnings of $139,583, while those with high school diploma education earn the least with $76,250. Women with an educational attainment of college or associate's degree earn the most with the average annual earnings of $46,875, while those with bachelor's degree education have the smallest earnings of $25,795.
| Educational Attainment | Male Income | Female Income |
| Less than High School | - | - |
| High School Diploma | $76,250 | $0 |
| College or Associate's Degree | $102,917 | $46,875 |
| Bachelor's Degree | $139,583 | $25,795 |
| Graduate Degree | $78,333 | $0 |
| Total | $102,375 | $46,875 |
Family Income in Newfields
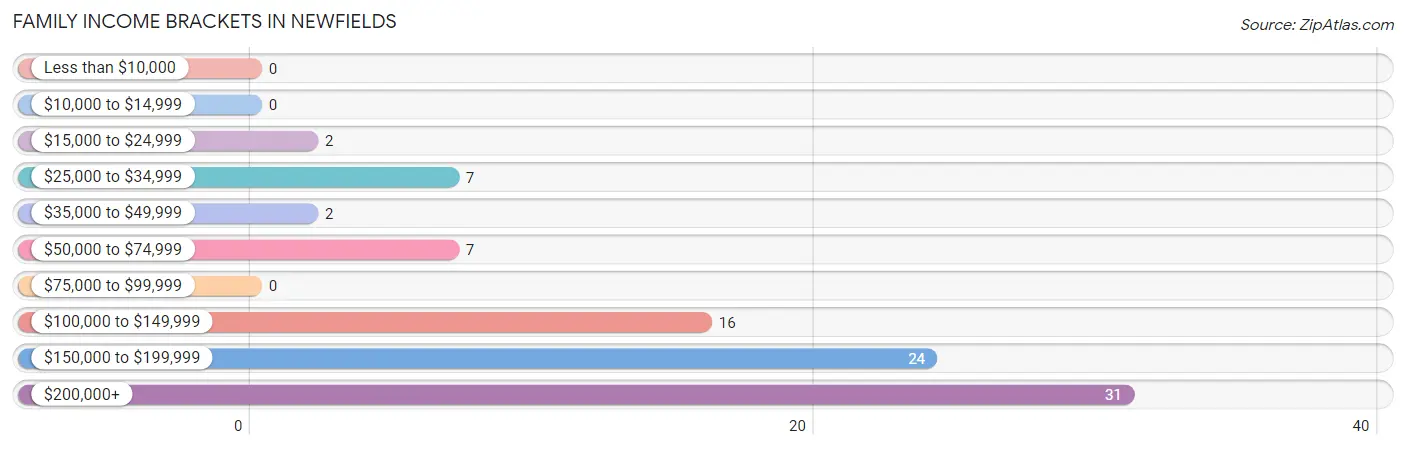
Family Income Brackets in Newfields
According to the Newfields family income data, there are 31 families falling into the $200,000+ income range, which is the most common income bracket and makes up 34.8% of all families.
| Income Bracket | # Families | % Families |
| Less than $10,000 | 0 | 0.0% |
| $10,000 to $14,999 | 0 | 0.0% |
| $15,000 to $24,999 | 2 | 2.2% |
| $25,000 to $34,999 | 7 | 7.9% |
| $35,000 to $49,999 | 2 | 2.2% |
| $50,000 to $74,999 | 7 | 7.9% |
| $75,000 to $99,999 | 0 | 0.0% |
| $100,000 to $149,999 | 16 | 18.0% |
| $150,000 to $199,999 | 24 | 27.0% |
| $200,000+ | 31 | 34.8% |
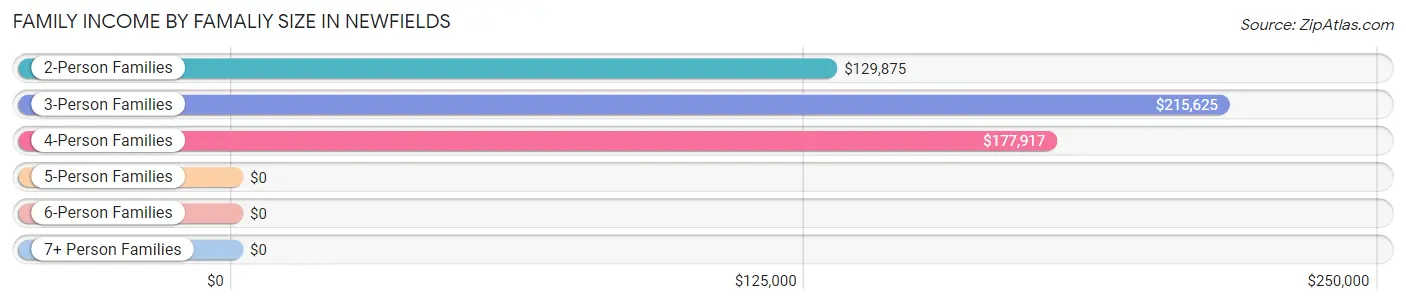
Family Income by Famaliy Size in Newfields
3-person families (35 | 39.3%) account for the highest median family income in Newfields with $215,625 per family, while 3-person families (35 | 39.3%) have the highest median income of $71,875 per family member.
| Income Bracket | # Families | Median Income |
| 2-Person Families | 37 (41.6%) | $129,875 |
| 3-Person Families | 35 (39.3%) | $215,625 |
| 4-Person Families | 11 (12.4%) | $177,917 |
| 5-Person Families | 6 (6.7%) | $0 |
| 6-Person Families | 0 (0.0%) | $0 |
| 7+ Person Families | 0 (0.0%) | $0 |
| Total | 89 (100.0%) | $178,750 |
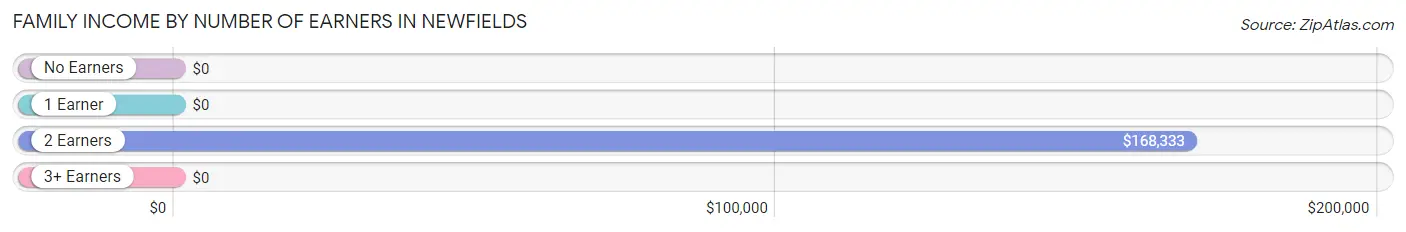
Family Income by Number of Earners in Newfields
| Number of Earners | # Families | Median Income |
| No Earners | 5 (5.6%) | $0 |
| 1 Earner | 6 (6.7%) | $0 |
| 2 Earners | 72 (80.9%) | $168,333 |
| 3+ Earners | 6 (6.7%) | $0 |
| Total | 89 (100.0%) | $178,750 |
Household Income in Newfields
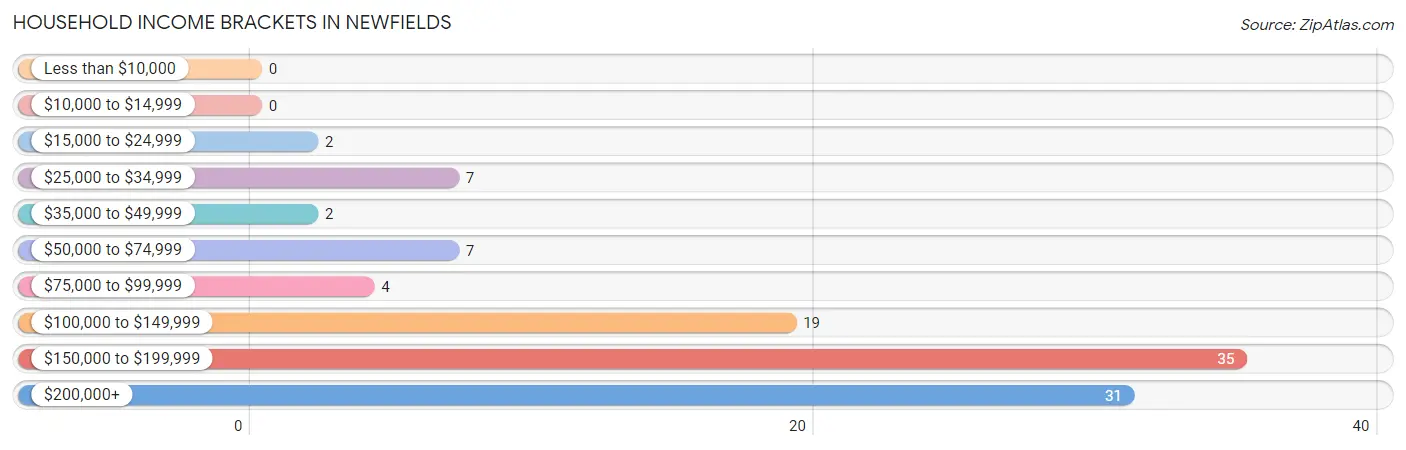
Household Income Brackets in Newfields
With 35 households falling in the category, the $150,000 to $199,999 income range is the most frequent in Newfields, accounting for 32.7% of all households.
| Income Bracket | # Households | % Households |
| Less than $10,000 | 0 | 0.0% |
| $10,000 to $14,999 | 0 | 0.0% |
| $15,000 to $24,999 | 2 | 1.9% |
| $25,000 to $34,999 | 7 | 6.5% |
| $35,000 to $49,999 | 2 | 1.9% |
| $50,000 to $74,999 | 7 | 6.5% |
| $75,000 to $99,999 | 4 | 3.7% |
| $100,000 to $149,999 | 19 | 17.8% |
| $150,000 to $199,999 | 35 | 32.7% |
| $200,000+ | 31 | 29.0% |
Household Income by Householder Age in Newfields
The median household income in Newfields is $173,295, with the highest median household income of $182,500 found in the 25 to 44 years age bracket for the primary householder. A total of 18 households (16.8%) fall into this category. Meanwhile, the 15 to 24 years age bracket for the primary householder has the lowest median household income of $0, with 3 households (2.8%) in this group.
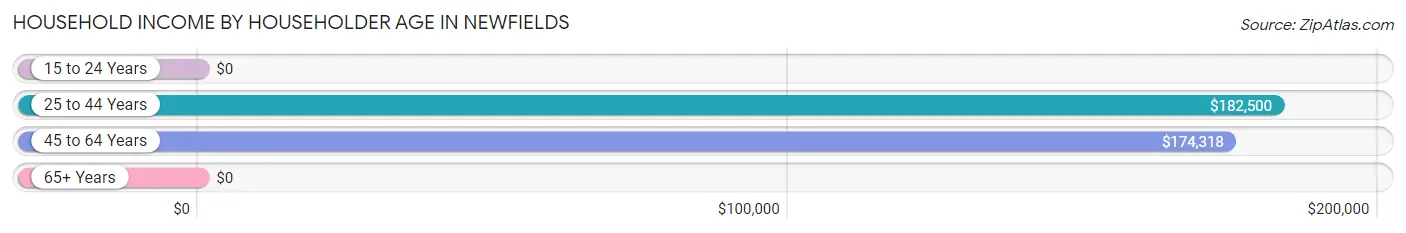
| Income Bracket | # Households | Median Income |
| 15 to 24 Years | 3 (2.8%) | $0 |
| 25 to 44 Years | 18 (16.8%) | $182,500 |
| 45 to 64 Years | 70 (65.4%) | $174,318 |
| 65+ Years | 16 (14.9%) | $0 |
| Total | 107 (100.0%) | $173,295 |
Poverty in Newfields
Income Below Poverty by Sex and Age in Newfields
With 1.4% poverty level for males and 3.4% for females among the residents of Newfields, 45 to 54 year old males and 18 to 24 year old females are the most vulnerable to poverty, with 2 males (6.7%) and 3 females (50.0%) in their respective age groups living below the poverty level.
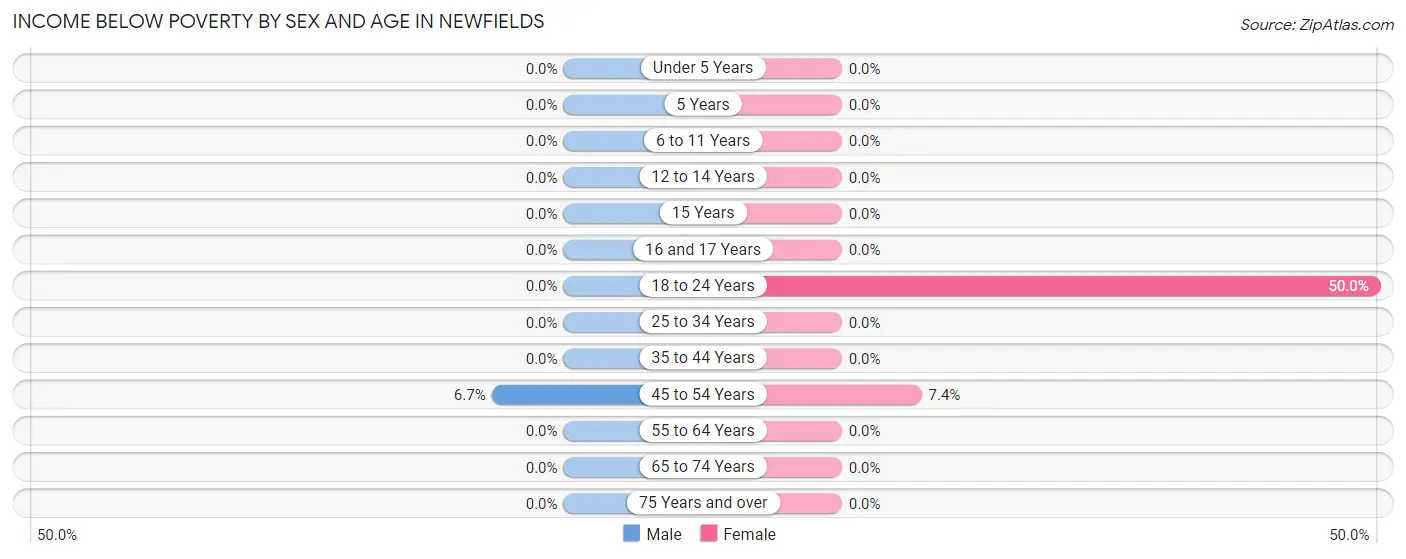
| Age Bracket | Male | Female |
| Under 5 Years | 0 (0.0%) | 0 (0.0%) |
| 5 Years | 0 (0.0%) | 0 (0.0%) |
| 6 to 11 Years | 0 (0.0%) | 0 (0.0%) |
| 12 to 14 Years | 0 (0.0%) | 0 (0.0%) |
| 15 Years | 0 (0.0%) | 0 (0.0%) |
| 16 and 17 Years | 0 (0.0%) | 0 (0.0%) |
| 18 to 24 Years | 0 (0.0%) | 3 (50.0%) |
| 25 to 34 Years | 0 (0.0%) | 0 (0.0%) |
| 35 to 44 Years | 0 (0.0%) | 0 (0.0%) |
| 45 to 54 Years | 2 (6.7%) | 2 (7.4%) |
| 55 to 64 Years | 0 (0.0%) | 0 (0.0%) |
| 65 to 74 Years | 0 (0.0%) | 0 (0.0%) |
| 75 Years and over | 0 (0.0%) | 0 (0.0%) |
| Total | 2 (1.4%) | 5 (3.4%) |
Income Above Poverty by Sex and Age in Newfields
According to the poverty statistics in Newfields, males aged 5 years and females aged under 5 years are the age groups that are most secure financially, with 100.0% of males and 100.0% of females in these age groups living above the poverty line.
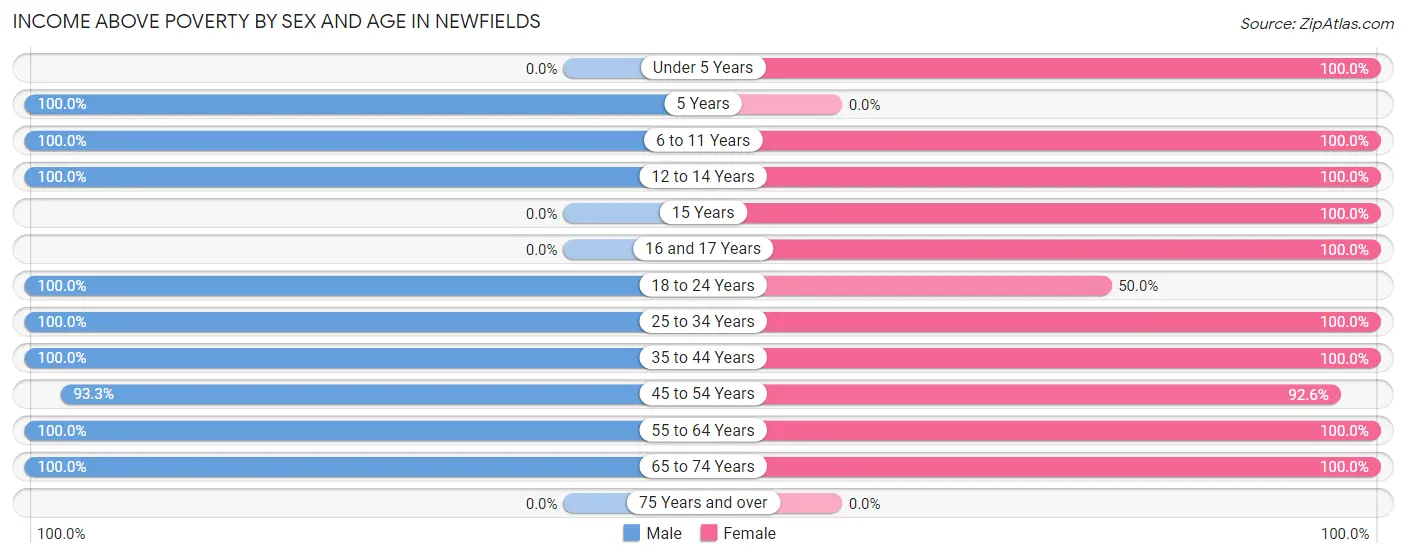
| Age Bracket | Male | Female |
| Under 5 Years | 0 (0.0%) | 5 (100.0%) |
| 5 Years | 3 (100.0%) | 0 (0.0%) |
| 6 to 11 Years | 17 (100.0%) | 5 (100.0%) |
| 12 to 14 Years | 2 (100.0%) | 8 (100.0%) |
| 15 Years | 0 (0.0%) | 14 (100.0%) |
| 16 and 17 Years | 0 (0.0%) | 5 (100.0%) |
| 18 to 24 Years | 21 (100.0%) | 3 (50.0%) |
| 25 to 34 Years | 12 (100.0%) | 3 (100.0%) |
| 35 to 44 Years | 18 (100.0%) | 15 (100.0%) |
| 45 to 54 Years | 28 (93.3%) | 25 (92.6%) |
| 55 to 64 Years | 26 (100.0%) | 50 (100.0%) |
| 65 to 74 Years | 16 (100.0%) | 8 (100.0%) |
| 75 Years and over | 0 (0.0%) | 0 (0.0%) |
| Total | 143 (98.6%) | 141 (96.6%) |
Income Below Poverty Among Married-Couple Families in Newfields
The poverty statistics for married-couple families in Newfields show that 2.4% or 2 of the total 85 families live below the poverty line. Families with no children have the highest poverty rate of 4.0%, comprising of 2 families. On the other hand, families with 1 or 2 children have the lowest poverty rate of 0.0%, which includes 0 families.
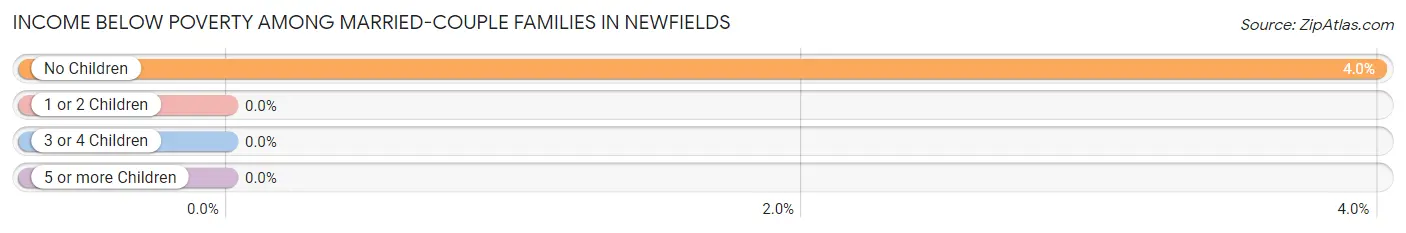
| Children | Above Poverty | Below Poverty |
| No Children | 48 (96.0%) | 2 (4.0%) |
| 1 or 2 Children | 29 (100.0%) | 0 (0.0%) |
| 3 or 4 Children | 6 (100.0%) | 0 (0.0%) |
| 5 or more Children | 0 (0.0%) | 0 (0.0%) |
| Total | 83 (97.7%) | 2 (2.4%) |
Income Below Poverty Among Single-Parent Households in Newfields
| Children | Single Father | Single Mother |
| No Children | 0 (0.0%) | 0 (0.0%) |
| 1 or 2 Children | 0 (0.0%) | 0 (0.0%) |
| 3 or 4 Children | 0 (0.0%) | 0 (0.0%) |
| 5 or more Children | 0 (0.0%) | 0 (0.0%) |
| Total | 0 (0.0%) | 0 (0.0%) |
Income Below Poverty Among Married-Couple vs Single-Parent Households in Newfields
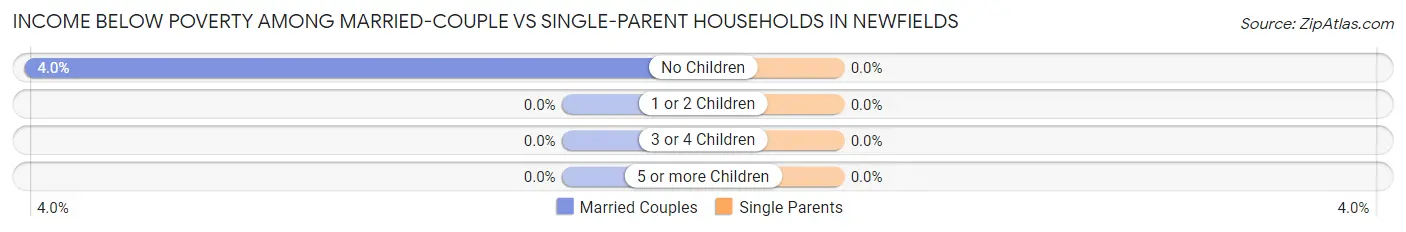
| Children | Married-Couple Families | Single-Parent Households |
| No Children | 2 (4.0%) | 0 (0.0%) |
| 1 or 2 Children | 0 (0.0%) | 0 (0.0%) |
| 3 or 4 Children | 0 (0.0%) | 0 (0.0%) |
| 5 or more Children | 0 (0.0%) | 0 (0.0%) |
| Total | 2 (2.4%) | 0 (0.0%) |
Race in Newfields
The most populous races in Newfields are White / Caucasian (275 | 94.5%), Two or more Races (10 | 3.4%), and Hispanic or Latino (7 | 2.4%).
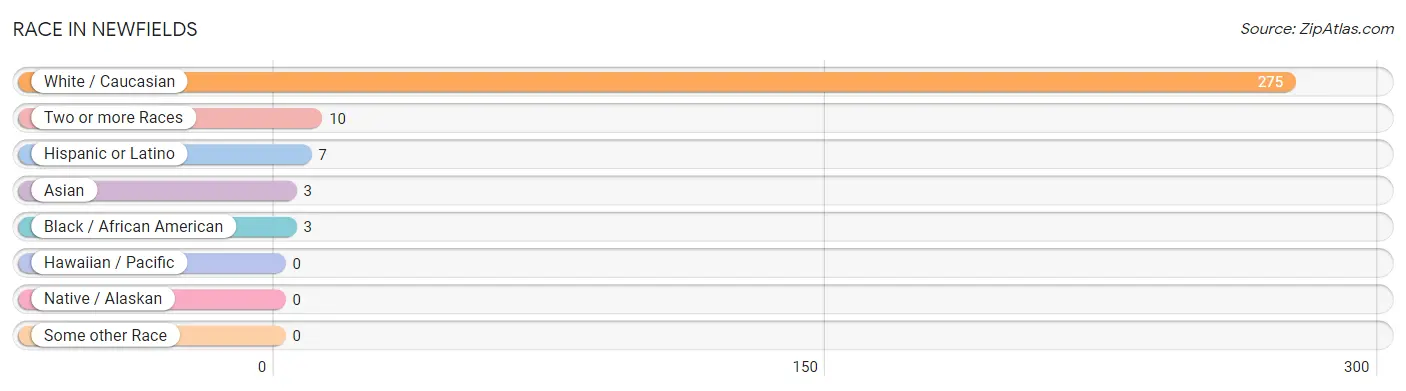
| Race | # Population | % Population |
| Asian | 3 | 1.0% |
| Black / African American | 3 | 1.0% |
| Hawaiian / Pacific | 0 | 0.0% |
| Hispanic or Latino | 7 | 2.4% |
| Native / Alaskan | 0 | 0.0% |
| White / Caucasian | 275 | 94.5% |
| Two or more Races | 10 | 3.4% |
| Some other Race | 0 | 0.0% |
| Total | 291 | 100.0% |
Ancestry in Newfields
The most populous ancestries reported in Newfields are Irish (85 | 29.2%), English (65 | 22.3%), French Canadian (35 | 12.0%), Scotch-Irish (31 | 10.6%), and Italian (29 | 10.0%), together accounting for 84.2% of all Newfields residents.
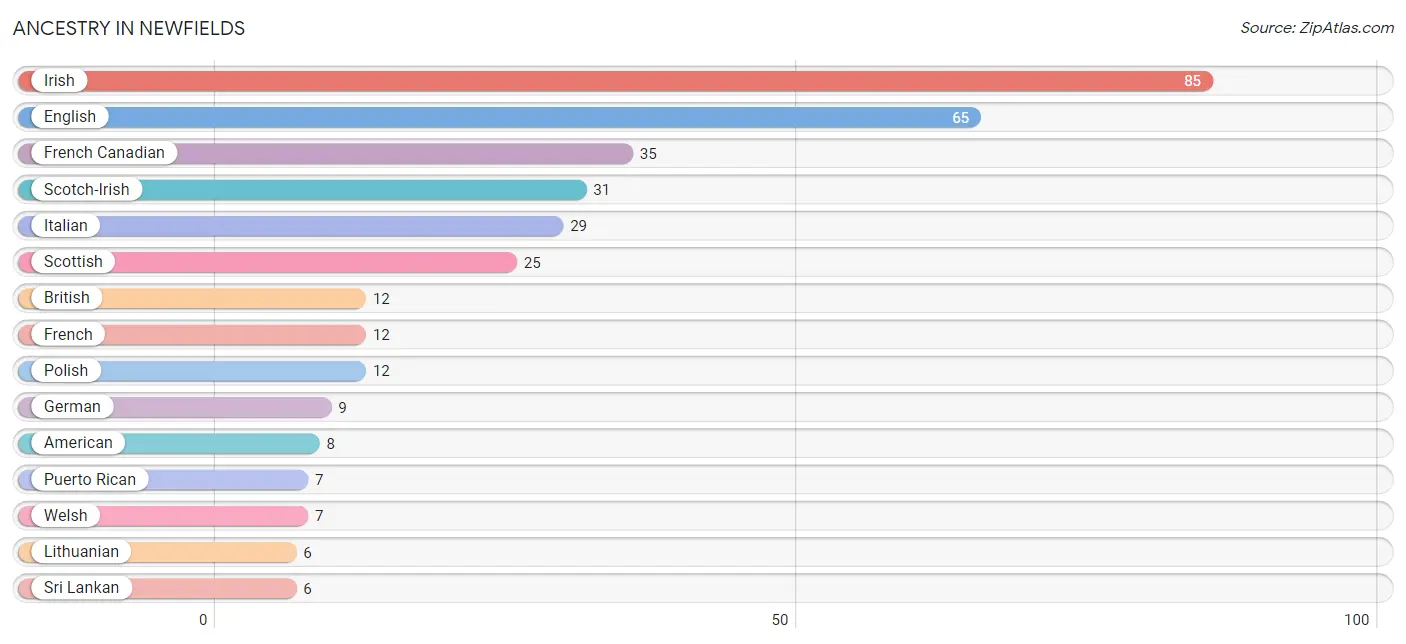
| Ancestry | # Population | % Population |
| American | 8 | 2.8% |
| Basque | 3 | 1.0% |
| British | 12 | 4.1% |
| Czech | 3 | 1.0% |
| Dutch | 3 | 1.0% |
| English | 65 | 22.3% |
| French | 12 | 4.1% |
| French Canadian | 35 | 12.0% |
| German | 9 | 3.1% |
| Irish | 85 | 29.2% |
| Italian | 29 | 10.0% |
| Lithuanian | 6 | 2.1% |
| Norwegian | 2 | 0.7% |
| Polish | 12 | 4.1% |
| Puerto Rican | 7 | 2.4% |
| Scotch-Irish | 31 | 10.6% |
| Scottish | 25 | 8.6% |
| Sri Lankan | 6 | 2.1% |
| Subsaharan African | 3 | 1.0% |
| Swedish | 3 | 1.0% |
| Swiss | 2 | 0.7% |
| Welsh | 7 | 2.4% | View All 22 Rows |
Immigrants in Newfields
The most numerous immigrant groups reported in Newfields came from Europe (11 | 3.8%), Northern Europe (6 | 2.1%), Asia (3 | 1.0%), Belgium (3 | 1.0%), and South Eastern Asia (3 | 1.0%), together accounting for 8.9% of all Newfields residents.
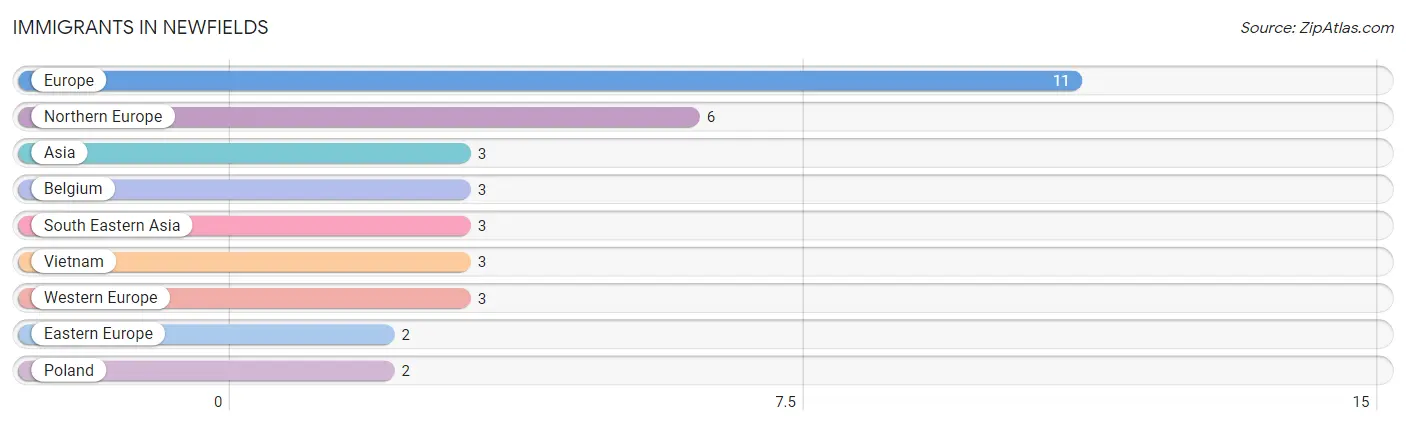
| Immigration Origin | # Population | % Population |
| Asia | 3 | 1.0% |
| Belgium | 3 | 1.0% |
| Eastern Europe | 2 | 0.7% |
| Europe | 11 | 3.8% |
| Northern Europe | 6 | 2.1% |
| Poland | 2 | 0.7% |
| South Eastern Asia | 3 | 1.0% |
| Vietnam | 3 | 1.0% |
| Western Europe | 3 | 1.0% | View All 9 Rows |
Sex and Age in Newfields
Sex and Age in Newfields
The most populous age groups in Newfields are 45 to 49 Years (25 | 17.2%) for men and 55 to 59 Years (36 | 24.7%) for women.
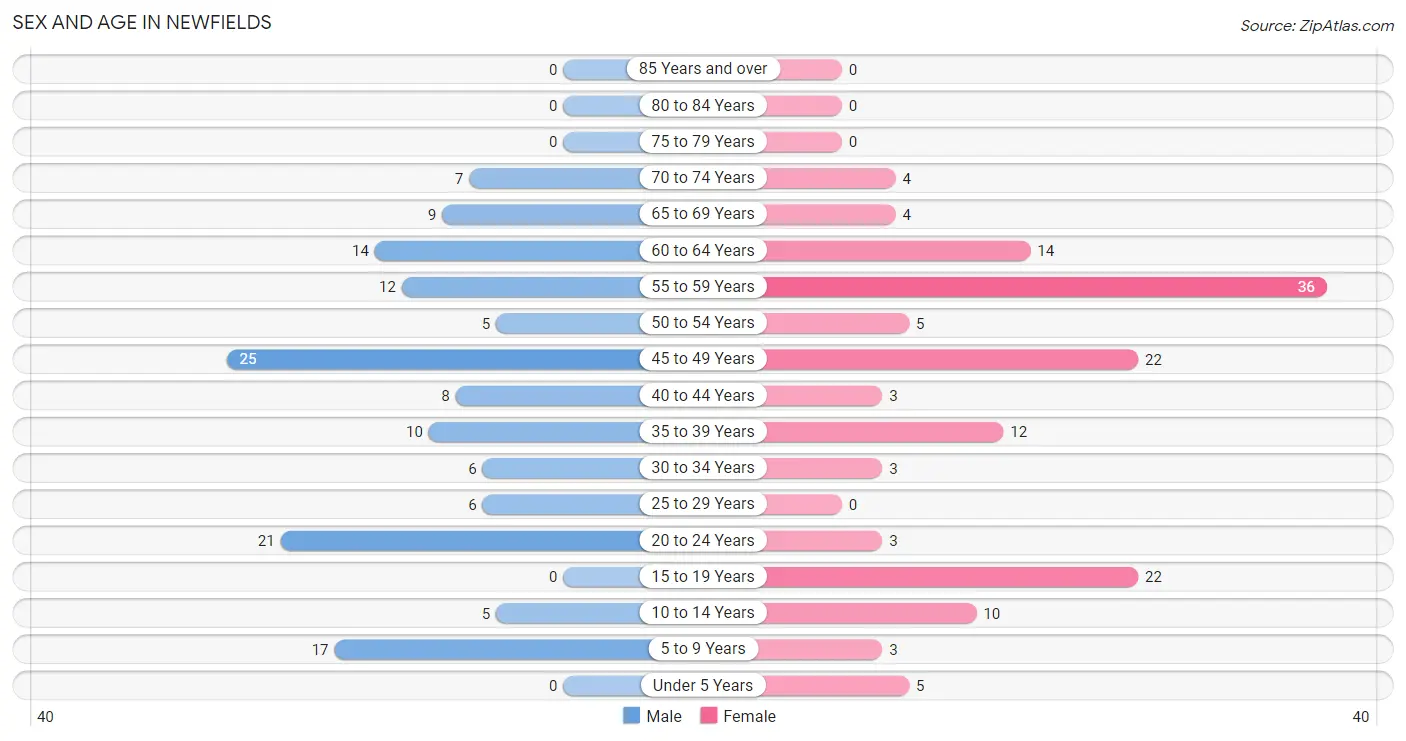
| Age Bracket | Male | Female |
| Under 5 Years | 0 (0.0%) | 5 (3.4%) |
| 5 to 9 Years | 17 (11.7%) | 3 (2.1%) |
| 10 to 14 Years | 5 (3.5%) | 10 (6.9%) |
| 15 to 19 Years | 0 (0.0%) | 22 (15.1%) |
| 20 to 24 Years | 21 (14.5%) | 3 (2.1%) |
| 25 to 29 Years | 6 (4.1%) | 0 (0.0%) |
| 30 to 34 Years | 6 (4.1%) | 3 (2.1%) |
| 35 to 39 Years | 10 (6.9%) | 12 (8.2%) |
| 40 to 44 Years | 8 (5.5%) | 3 (2.1%) |
| 45 to 49 Years | 25 (17.2%) | 22 (15.1%) |
| 50 to 54 Years | 5 (3.5%) | 5 (3.4%) |
| 55 to 59 Years | 12 (8.3%) | 36 (24.7%) |
| 60 to 64 Years | 14 (9.7%) | 14 (9.6%) |
| 65 to 69 Years | 9 (6.2%) | 4 (2.7%) |
| 70 to 74 Years | 7 (4.8%) | 4 (2.7%) |
| 75 to 79 Years | 0 (0.0%) | 0 (0.0%) |
| 80 to 84 Years | 0 (0.0%) | 0 (0.0%) |
| 85 Years and over | 0 (0.0%) | 0 (0.0%) |
| Total | 145 (100.0%) | 146 (100.0%) |
Families and Households in Newfields
Median Family Size in Newfields
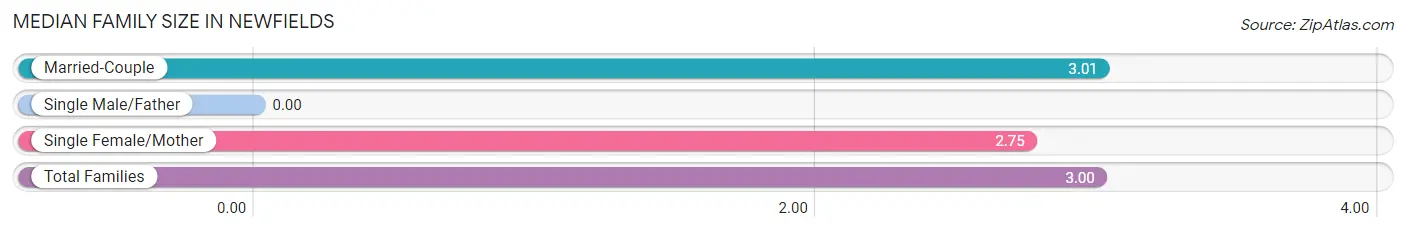
| Family Type | # Families | Family Size |
| Married-Couple | 85 (95.5%) | 3.01 |
| Single Male/Father | 0 (0.0%) | - |
| Single Female/Mother | 4 (4.5%) | 2.75 |
| Total Families | 89 (100.0%) | 3.00 |
Median Household Size in Newfields
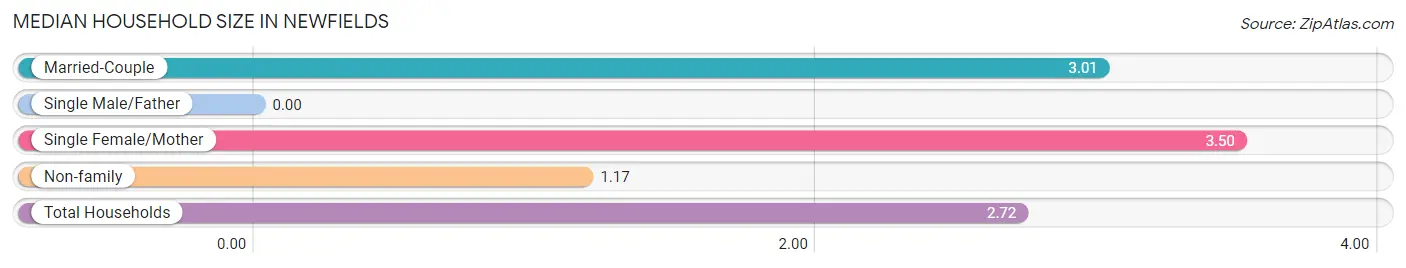
| Household Type | # Households | Household Size |
| Married-Couple | 85 (79.4%) | 3.01 |
| Single Male/Father | 0 (0.0%) | - |
| Single Female/Mother | 4 (3.7%) | 3.50 |
| Non-family | 18 (16.8%) | 1.17 |
| Total Households | 107 (100.0%) | 2.72 |
Household Size by Marriage Status in Newfields
Out of a total of 107 households in Newfields, 89 (83.2%) are family households, while 18 (16.8%) are nonfamily households. The most numerous type of family households are 2-person households, comprising 37, and the most common type of nonfamily households are 1-person households, comprising 15.
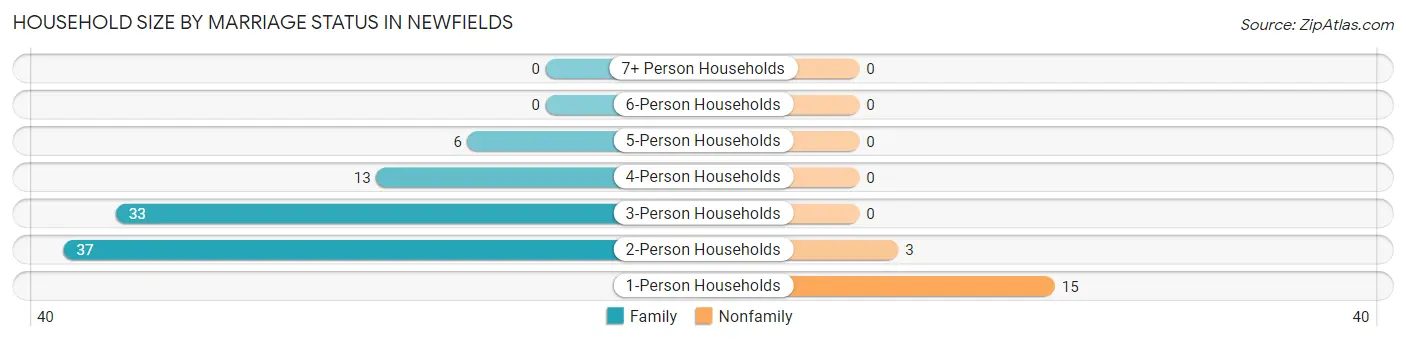
| Household Size | Family Households | Nonfamily Households |
| 1-Person Households | - | 15 (14.0%) |
| 2-Person Households | 37 (34.6%) | 3 (2.8%) |
| 3-Person Households | 33 (30.8%) | 0 (0.0%) |
| 4-Person Households | 13 (12.1%) | 0 (0.0%) |
| 5-Person Households | 6 (5.6%) | 0 (0.0%) |
| 6-Person Households | 0 (0.0%) | 0 (0.0%) |
| 7+ Person Households | 0 (0.0%) | 0 (0.0%) |
| Total | 89 (83.2%) | 18 (16.8%) |
Female Fertility in Newfields
Fertility by Age in Newfields
Average fertility rate in Newfields is 43.0 births per 1,000 women. Women in the age bracket of 20 to 34 years have the highest fertility rate with 500.0 births per 1,000 women. Women in the age bracket of 20 to 34 years acount for 100.0% of all women with births.
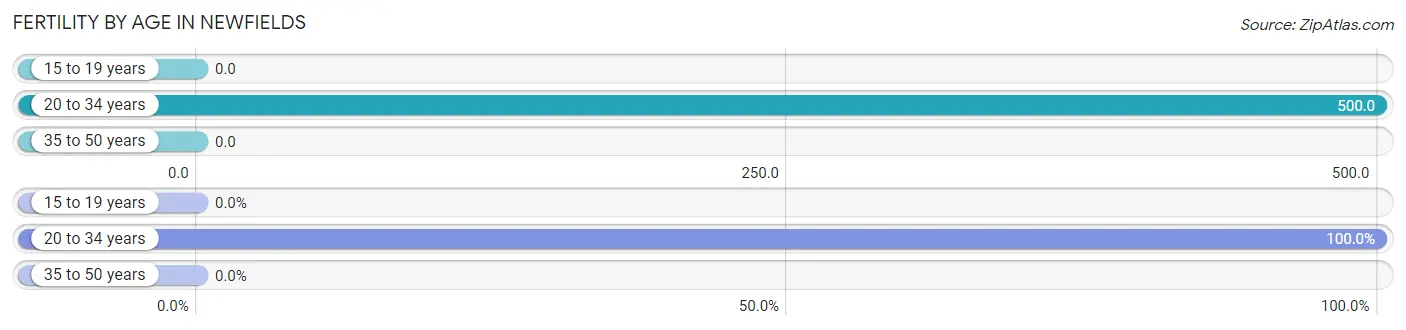
| Age Bracket | Women with Births | Births / 1,000 Women |
| 15 to 19 years | 0 (0.0%) | 0.0 |
| 20 to 34 years | 3 (100.0%) | 500.0 |
| 35 to 50 years | 0 (0.0%) | 0.0 |
| Total | 3 (100.0%) | 43.0 |
Fertility by Age by Marriage Status in Newfields
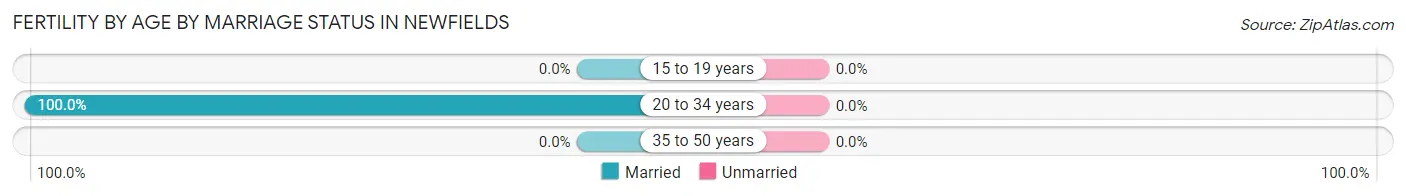
| Age Bracket | Married | Unmarried |
| 15 to 19 years | 0 (0.0%) | 0 (0.0%) |
| 20 to 34 years | 3 (100.0%) | 0 (0.0%) |
| 35 to 50 years | 0 (0.0%) | 0 (0.0%) |
| Total | 3 (100.0%) | 0 (0.0%) |
Fertility by Education in Newfields
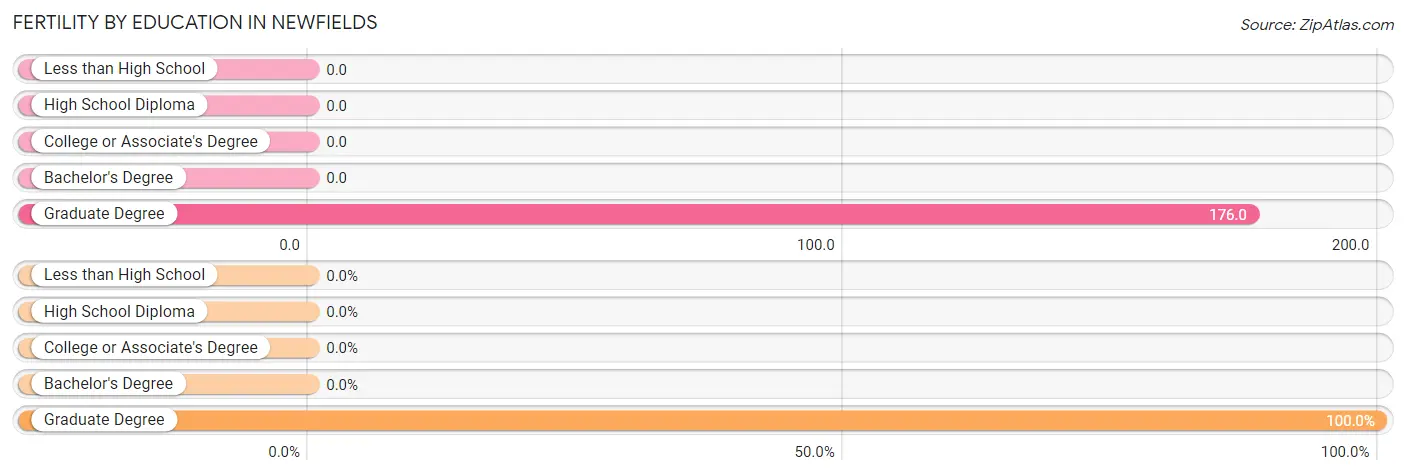
| Educational Attainment | Women with Births | Births / 1,000 Women |
| Less than High School | 0 (0.0%) | 0.0 |
| High School Diploma | 0 (0.0%) | 0.0 |
| College or Associate's Degree | 0 (0.0%) | 0.0 |
| Bachelor's Degree | 0 (0.0%) | 0.0 |
| Graduate Degree | 3 (100.0%) | 176.0 |
| Total | 3 (100.0%) | 43.0 |
Fertility by Education by Marriage Status in Newfields
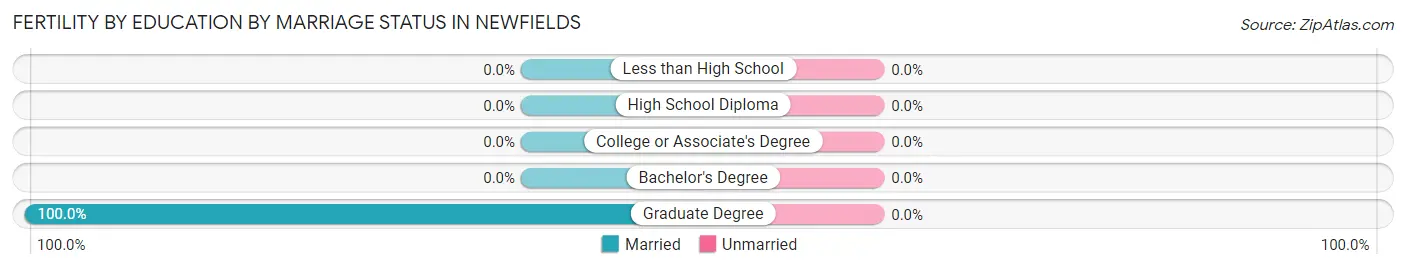
| Educational Attainment | Married | Unmarried |
| Less than High School | 0 (0.0%) | 0 (0.0%) |
| High School Diploma | 0 (0.0%) | 0 (0.0%) |
| College or Associate's Degree | 0 (0.0%) | 0 (0.0%) |
| Bachelor's Degree | 0 (0.0%) | 0 (0.0%) |
| Graduate Degree | 3 (100.0%) | 0 (0.0%) |
| Total | 3 (100.0%) | 0 (0.0%) |
Employment Characteristics in Newfields
Employment by Class of Employer in Newfields
Among the 168 employed individuals in Newfields, private company employees (104 | 61.9%), not-for-profit organizations (31 | 18.4%), and self-employed (not incorporated) (16 | 9.5%) make up the most common classes of employment.
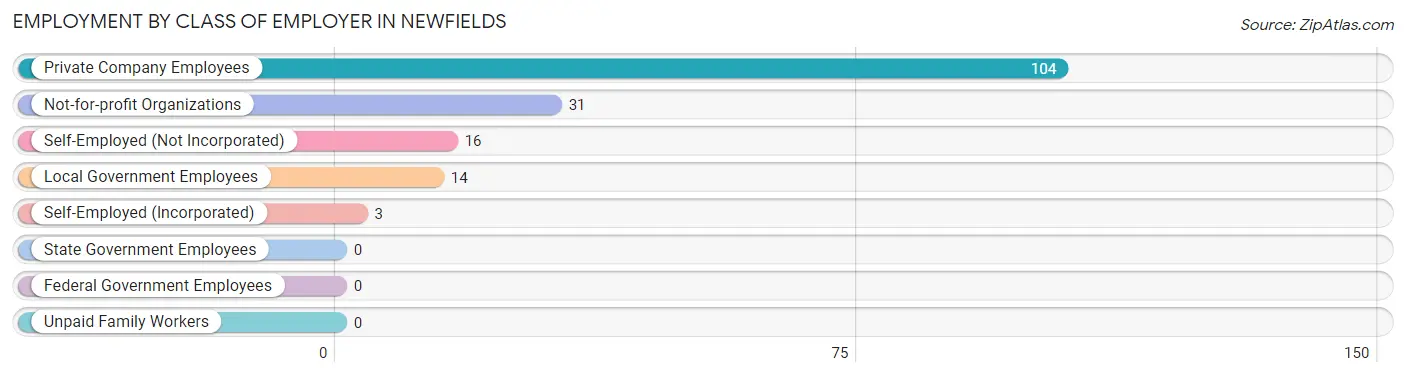
| Employer Class | # Employees | % Employees |
| Private Company Employees | 104 | 61.9% |
| Self-Employed (Incorporated) | 3 | 1.8% |
| Self-Employed (Not Incorporated) | 16 | 9.5% |
| Not-for-profit Organizations | 31 | 18.4% |
| Local Government Employees | 14 | 8.3% |
| State Government Employees | 0 | 0.0% |
| Federal Government Employees | 0 | 0.0% |
| Unpaid Family Workers | 0 | 0.0% |
| Total | 168 | 100.0% |
Employment Status by Age in Newfields
According to the labor force statistics for Newfields, out of the total population over 16 years of age (237), 73.4% or 174 individuals are in the labor force, with 1.7% or 3 of them unemployed. The age group with the highest labor force participation rate is 25 to 29 years, with 100.0% or 6 individuals in the labor force. Within the labor force, the 16 to 19 years age range has the highest percentage of unemployed individuals, with 100.0% or 3 of them being unemployed.
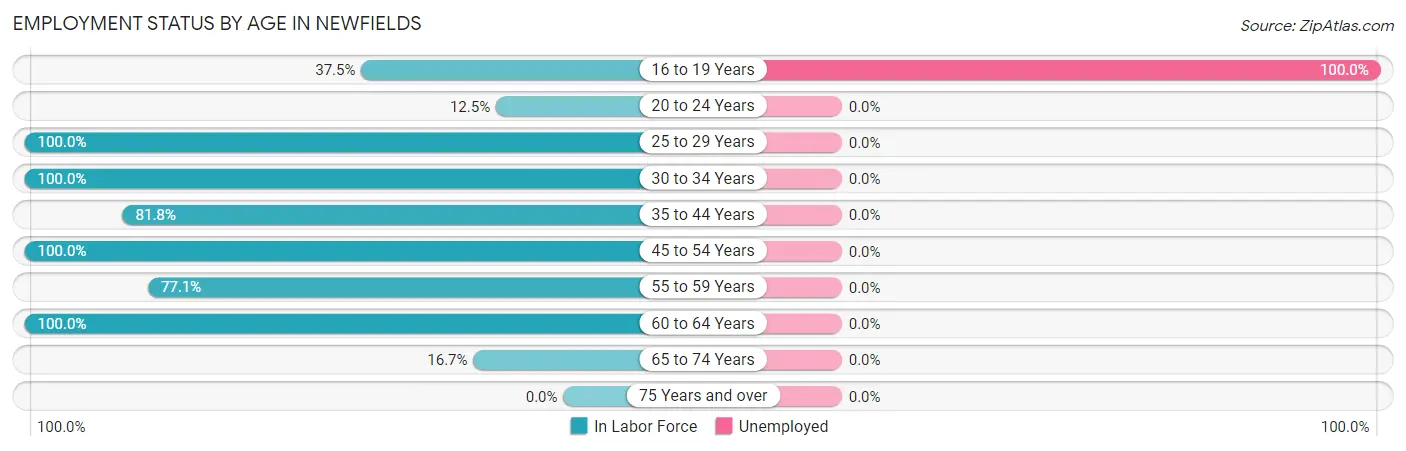
| Age Bracket | In Labor Force | Unemployed |
| 16 to 19 Years | 3 (37.5%) | 3 (100.0%) |
| 20 to 24 Years | 3 (12.5%) | 0 (0.0%) |
| 25 to 29 Years | 6 (100.0%) | 0 (0.0%) |
| 30 to 34 Years | 9 (100.0%) | 0 (0.0%) |
| 35 to 44 Years | 27 (81.8%) | 0 (0.0%) |
| 45 to 54 Years | 57 (100.0%) | 0 (0.0%) |
| 55 to 59 Years | 37 (77.1%) | 0 (0.0%) |
| 60 to 64 Years | 28 (100.0%) | 0 (0.0%) |
| 65 to 74 Years | 4 (16.7%) | 0 (0.0%) |
| 75 Years and over | 0 (0.0%) | 0 (0.0%) |
| Total | 174 (73.4%) | 3 (1.7%) |
Employment Status by Educational Attainment in Newfields
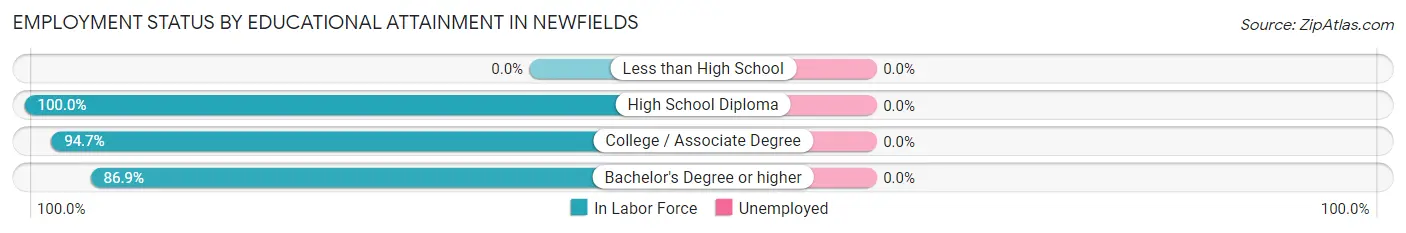
| Educational Attainment | In Labor Force | Unemployed |
| Less than High School | 0 (0.0%) | 0 (0.0%) |
| High School Diploma | 17 (100.0%) | 0 (0.0%) |
| College / Associate Degree | 54 (94.7%) | 0 (0.0%) |
| Bachelor's Degree or higher | 93 (86.9%) | 0 (0.0%) |
| Total | 164 (90.6%) | 0 (0.0%) |
Employment Occupations by Sex in Newfields
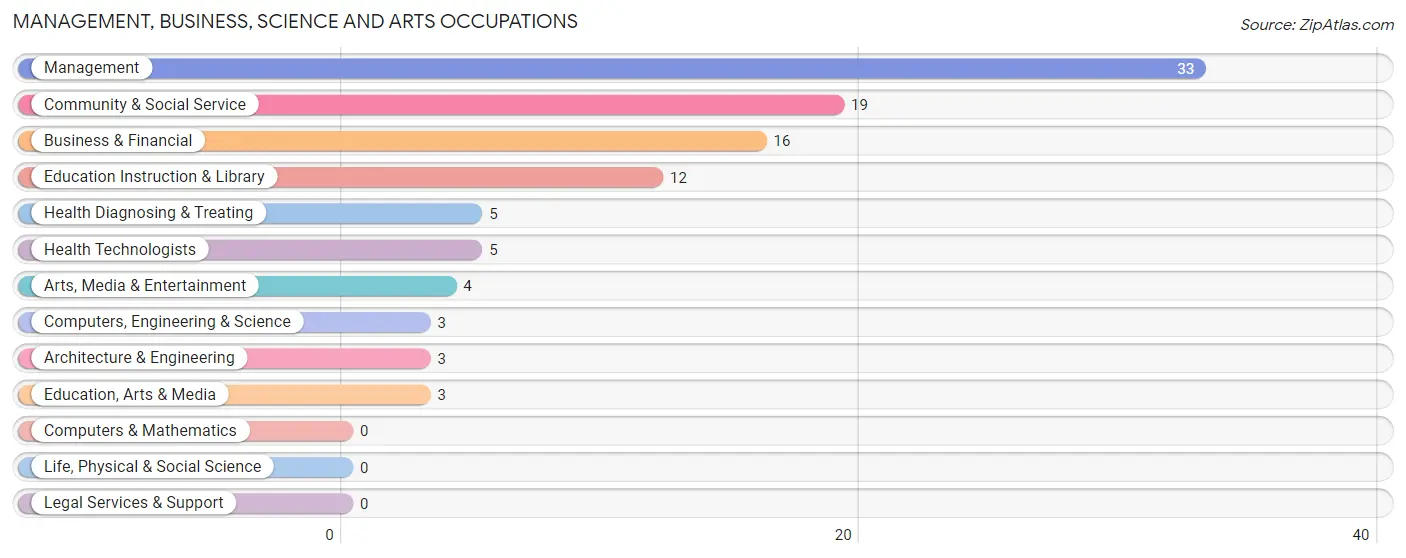
Management, Business, Science and Arts Occupations
The most common Management, Business, Science and Arts occupations in Newfields are Management (33 | 19.3%), Community & Social Service (19 | 11.1%), Business & Financial (16 | 9.4%), Education Instruction & Library (12 | 7.0%), and Health Diagnosing & Treating (5 | 2.9%).
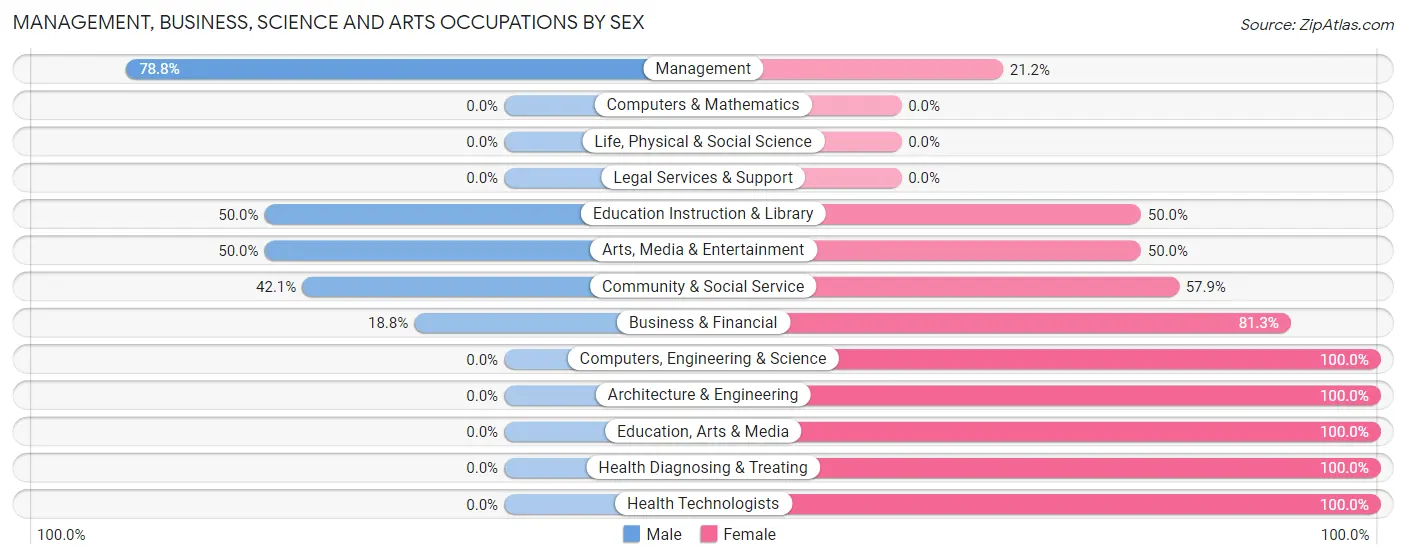
Management, Business, Science and Arts Occupations by Sex
Within the Management, Business, Science and Arts occupations in Newfields, the most male-oriented occupations are Management (78.8%), Education Instruction & Library (50.0%), and Arts, Media & Entertainment (50.0%), while the most female-oriented occupations are Computers, Engineering & Science (100.0%), Architecture & Engineering (100.0%), and Education, Arts & Media (100.0%).
| Occupation | Male | Female |
| Management | 26 (78.8%) | 7 (21.2%) |
| Business & Financial | 3 (18.8%) | 13 (81.2%) |
| Computers, Engineering & Science | 0 (0.0%) | 3 (100.0%) |
| Computers & Mathematics | 0 (0.0%) | 0 (0.0%) |
| Architecture & Engineering | 0 (0.0%) | 3 (100.0%) |
| Life, Physical & Social Science | 0 (0.0%) | 0 (0.0%) |
| Community & Social Service | 8 (42.1%) | 11 (57.9%) |
| Education, Arts & Media | 0 (0.0%) | 3 (100.0%) |
| Legal Services & Support | 0 (0.0%) | 0 (0.0%) |
| Education Instruction & Library | 6 (50.0%) | 6 (50.0%) |
| Arts, Media & Entertainment | 2 (50.0%) | 2 (50.0%) |
| Health Diagnosing & Treating | 0 (0.0%) | 5 (100.0%) |
| Health Technologists | 0 (0.0%) | 5 (100.0%) |
| Total (Category) | 37 (48.7%) | 39 (51.3%) |
| Total (Overall) | 88 (51.5%) | 83 (48.5%) |
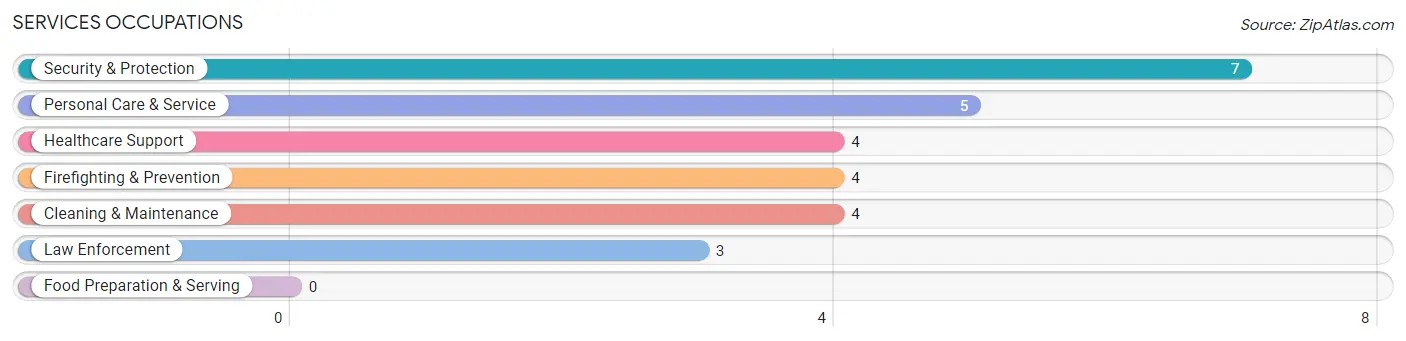
Services Occupations
The most common Services occupations in Newfields are Security & Protection (7 | 4.1%), Personal Care & Service (5 | 2.9%), Healthcare Support (4 | 2.3%), Firefighting & Prevention (4 | 2.3%), and Cleaning & Maintenance (4 | 2.3%).
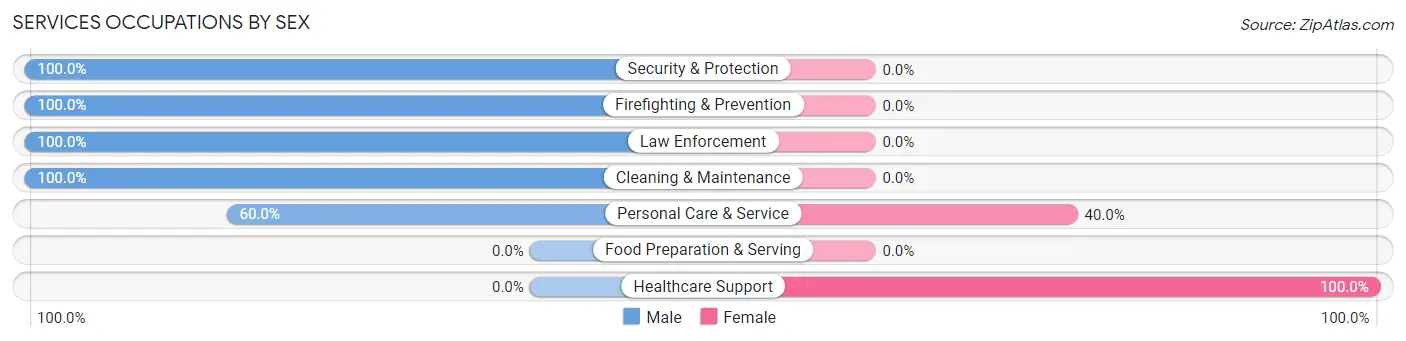
Services Occupations by Sex
Within the Services occupations in Newfields, the most male-oriented occupations are Security & Protection (100.0%), Firefighting & Prevention (100.0%), and Law Enforcement (100.0%), while the most female-oriented occupations are Healthcare Support (100.0%), and Personal Care & Service (40.0%).
| Occupation | Male | Female |
| Healthcare Support | 0 (0.0%) | 4 (100.0%) |
| Security & Protection | 7 (100.0%) | 0 (0.0%) |
| Firefighting & Prevention | 4 (100.0%) | 0 (0.0%) |
| Law Enforcement | 3 (100.0%) | 0 (0.0%) |
| Food Preparation & Serving | 0 (0.0%) | 0 (0.0%) |
| Cleaning & Maintenance | 4 (100.0%) | 0 (0.0%) |
| Personal Care & Service | 3 (60.0%) | 2 (40.0%) |
| Total (Category) | 14 (70.0%) | 6 (30.0%) |
| Total (Overall) | 88 (51.5%) | 83 (48.5%) |
Sales and Office Occupations
The most common Sales and Office occupations in Newfields are Sales & Related (37 | 21.6%), and Office & Administration (18 | 10.5%).
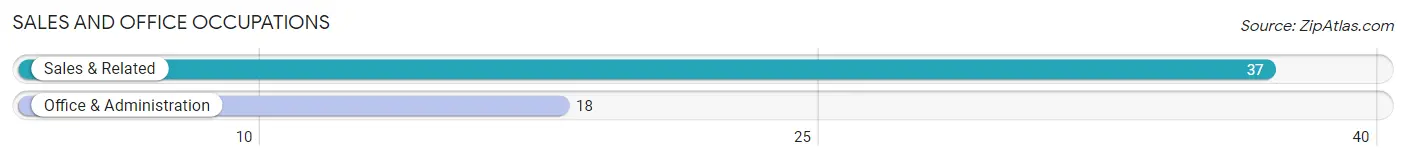
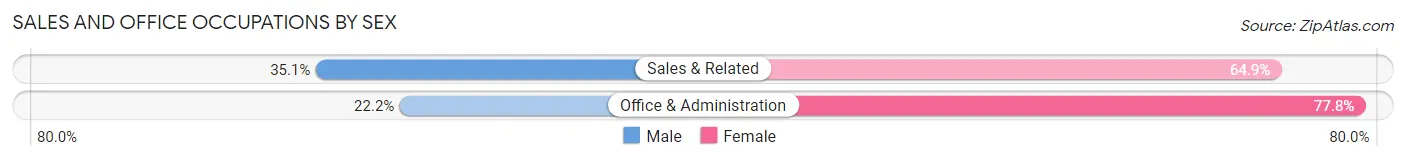
Sales and Office Occupations by Sex
| Occupation | Male | Female |
| Sales & Related | 13 (35.1%) | 24 (64.9%) |
| Office & Administration | 4 (22.2%) | 14 (77.8%) |
| Total (Category) | 17 (30.9%) | 38 (69.1%) |
| Total (Overall) | 88 (51.5%) | 83 (48.5%) |
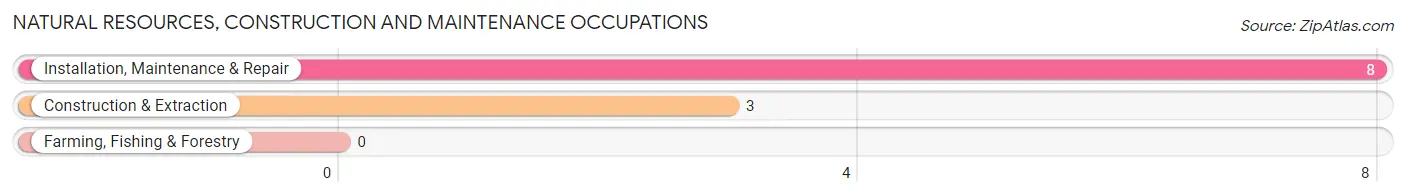
Natural Resources, Construction and Maintenance Occupations
The most common Natural Resources, Construction and Maintenance occupations in Newfields are Installation, Maintenance & Repair (8 | 4.7%), and Construction & Extraction (3 | 1.8%).
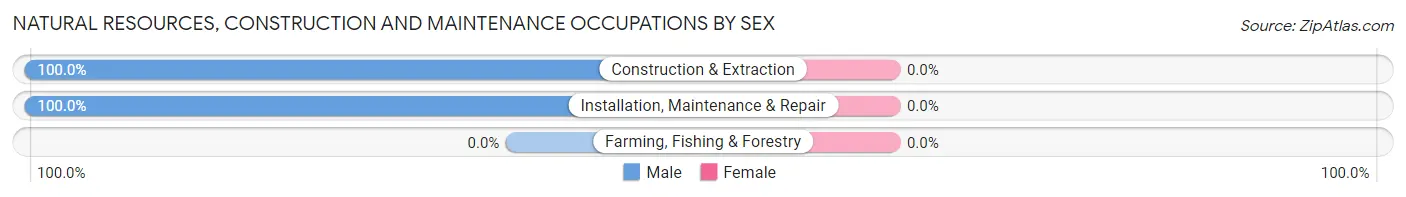
Natural Resources, Construction and Maintenance Occupations by Sex
| Occupation | Male | Female |
| Farming, Fishing & Forestry | 0 (0.0%) | 0 (0.0%) |
| Construction & Extraction | 3 (100.0%) | 0 (0.0%) |
| Installation, Maintenance & Repair | 8 (100.0%) | 0 (0.0%) |
| Total (Category) | 11 (100.0%) | 0 (0.0%) |
| Total (Overall) | 88 (51.5%) | 83 (48.5%) |
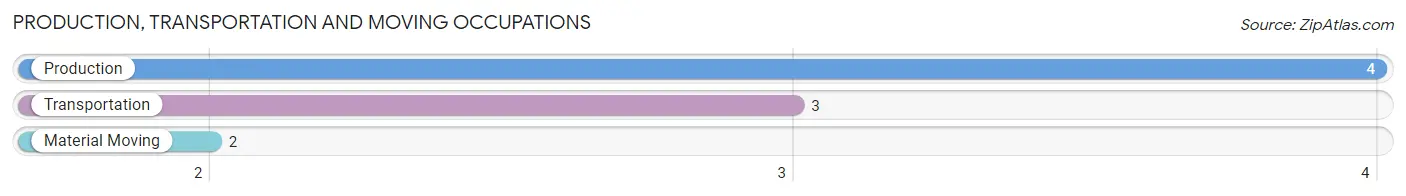
Production, Transportation and Moving Occupations
The most common Production, Transportation and Moving occupations in Newfields are Production (4 | 2.3%), Transportation (3 | 1.8%), and Material Moving (2 | 1.2%).
Production, Transportation and Moving Occupations by Sex
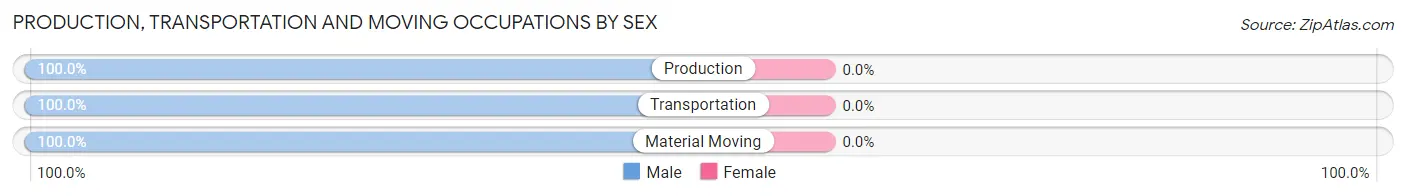
| Occupation | Male | Female |
| Production | 4 (100.0%) | 0 (0.0%) |
| Transportation | 3 (100.0%) | 0 (0.0%) |
| Material Moving | 2 (100.0%) | 0 (0.0%) |
| Total (Category) | 9 (100.0%) | 0 (0.0%) |
| Total (Overall) | 88 (51.5%) | 83 (48.5%) |
Employment Industries by Sex in Newfields
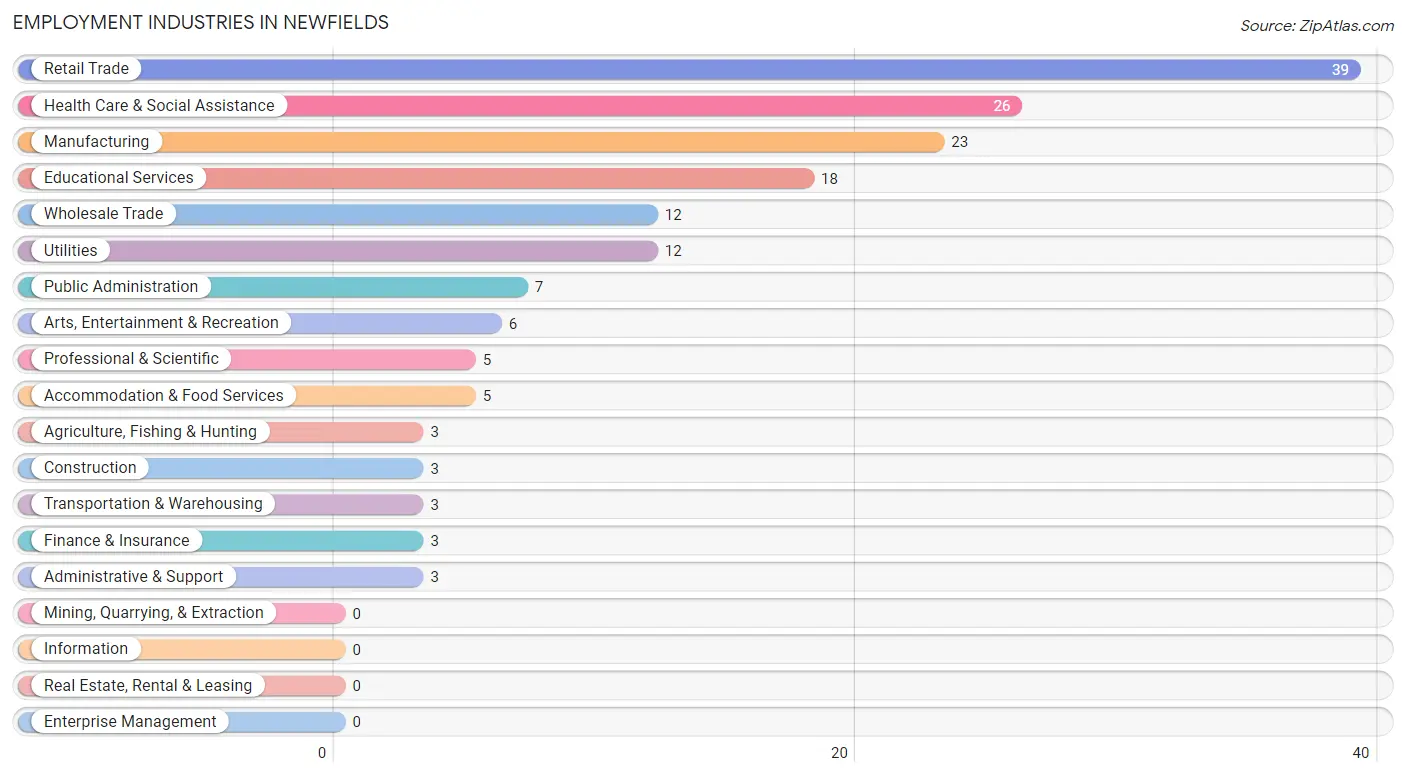
Employment Industries in Newfields
The major employment industries in Newfields include Retail Trade (39 | 22.8%), Health Care & Social Assistance (26 | 15.2%), Manufacturing (23 | 13.5%), Educational Services (18 | 10.5%), and Wholesale Trade (12 | 7.0%).
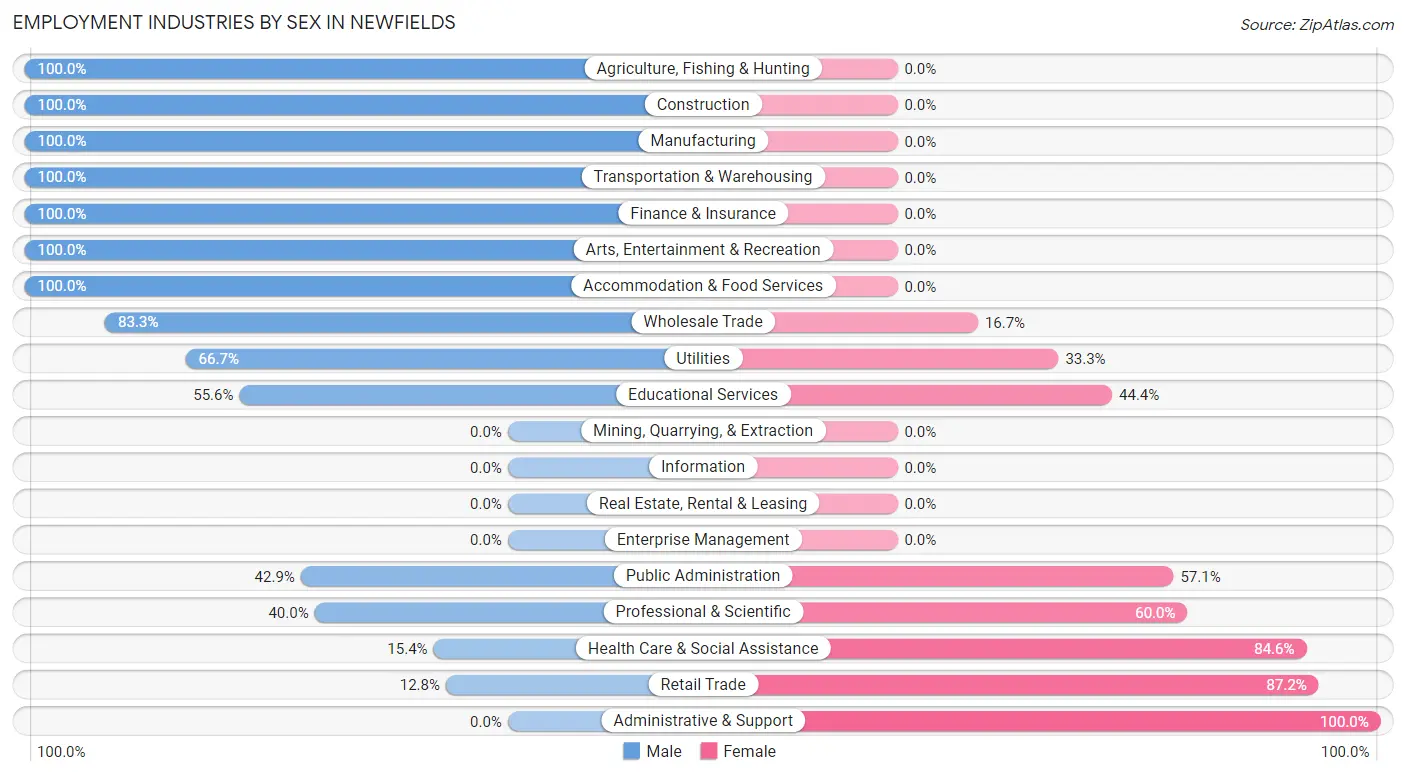
Employment Industries by Sex in Newfields
The Newfields industries that see more men than women are Agriculture, Fishing & Hunting (100.0%), Construction (100.0%), and Manufacturing (100.0%), whereas the industries that tend to have a higher number of women are Administrative & Support (100.0%), Retail Trade (87.2%), and Health Care & Social Assistance (84.6%).
| Industry | Male | Female |
| Agriculture, Fishing & Hunting | 3 (100.0%) | 0 (0.0%) |
| Mining, Quarrying, & Extraction | 0 (0.0%) | 0 (0.0%) |
| Construction | 3 (100.0%) | 0 (0.0%) |
| Manufacturing | 23 (100.0%) | 0 (0.0%) |
| Wholesale Trade | 10 (83.3%) | 2 (16.7%) |
| Retail Trade | 5 (12.8%) | 34 (87.2%) |
| Transportation & Warehousing | 3 (100.0%) | 0 (0.0%) |
| Utilities | 8 (66.7%) | 4 (33.3%) |
| Information | 0 (0.0%) | 0 (0.0%) |
| Finance & Insurance | 3 (100.0%) | 0 (0.0%) |
| Real Estate, Rental & Leasing | 0 (0.0%) | 0 (0.0%) |
| Professional & Scientific | 2 (40.0%) | 3 (60.0%) |
| Enterprise Management | 0 (0.0%) | 0 (0.0%) |
| Administrative & Support | 0 (0.0%) | 3 (100.0%) |
| Educational Services | 10 (55.6%) | 8 (44.4%) |
| Health Care & Social Assistance | 4 (15.4%) | 22 (84.6%) |
| Arts, Entertainment & Recreation | 6 (100.0%) | 0 (0.0%) |
| Accommodation & Food Services | 5 (100.0%) | 0 (0.0%) |
| Public Administration | 3 (42.9%) | 4 (57.1%) |
| Total | 88 (51.5%) | 83 (48.5%) |
Education in Newfields
School Enrollment in Newfields
The most common levels of schooling among the 57 students in Newfields are high school (24 | 42.1%), elementary school (17 | 29.8%), and middle school (13 | 22.8%).
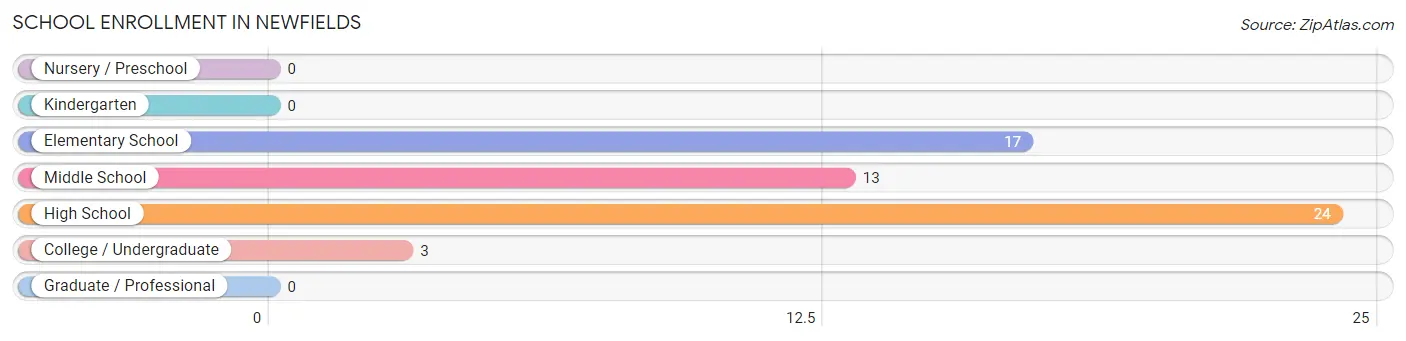
| School Level | # Students | % Students |
| Nursery / Preschool | 0 | 0.0% |
| Kindergarten | 0 | 0.0% |
| Elementary School | 17 | 29.8% |
| Middle School | 13 | 22.8% |
| High School | 24 | 42.1% |
| College / Undergraduate | 3 | 5.3% |
| Graduate / Professional | 0 | 0.0% |
| Total | 57 | 100.0% |
School Enrollment by Age by Funding Source in Newfields
Out of a total of 57 students who are enrolled in schools in Newfields, 23 (40.4%) attend a private institution, while the remaining 34 (59.6%) are enrolled in public schools. The age group of 18 to 19 year olds has the highest likelihood of being enrolled in private schools, with 3 (100.0% in the age bracket) enrolled. Conversely, the age group of 35 years and over has the lowest likelihood of being enrolled in a private school, with 3 (100.0% in the age bracket) attending a public institution.
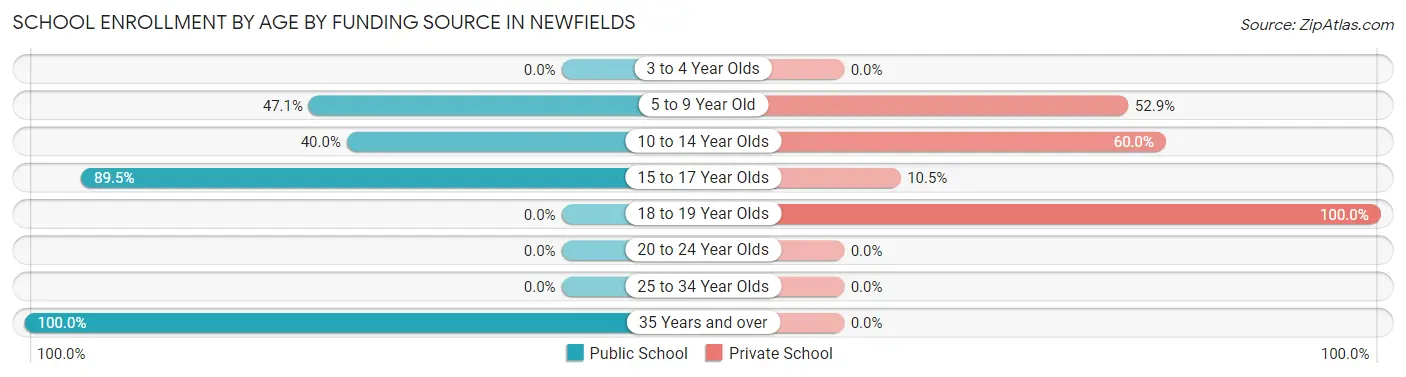
| Age Bracket | Public School | Private School |
| 3 to 4 Year Olds | 0 (0.0%) | 0 (0.0%) |
| 5 to 9 Year Old | 8 (47.1%) | 9 (52.9%) |
| 10 to 14 Year Olds | 6 (40.0%) | 9 (60.0%) |
| 15 to 17 Year Olds | 17 (89.5%) | 2 (10.5%) |
| 18 to 19 Year Olds | 0 (0.0%) | 3 (100.0%) |
| 20 to 24 Year Olds | 0 (0.0%) | 0 (0.0%) |
| 25 to 34 Year Olds | 0 (0.0%) | 0 (0.0%) |
| 35 Years and over | 3 (100.0%) | 0 (0.0%) |
| Total | 34 (59.6%) | 23 (40.4%) |
Educational Attainment by Field of Study in Newfields
Arts & humanities (28 | 20.6%), visual & performing arts (20 | 14.7%), communications (20 | 14.7%), social sciences (17 | 12.5%), and literature & languages (12 | 8.8%) are the most common fields of study among 136 individuals in Newfields who have obtained a bachelor's degree or higher.
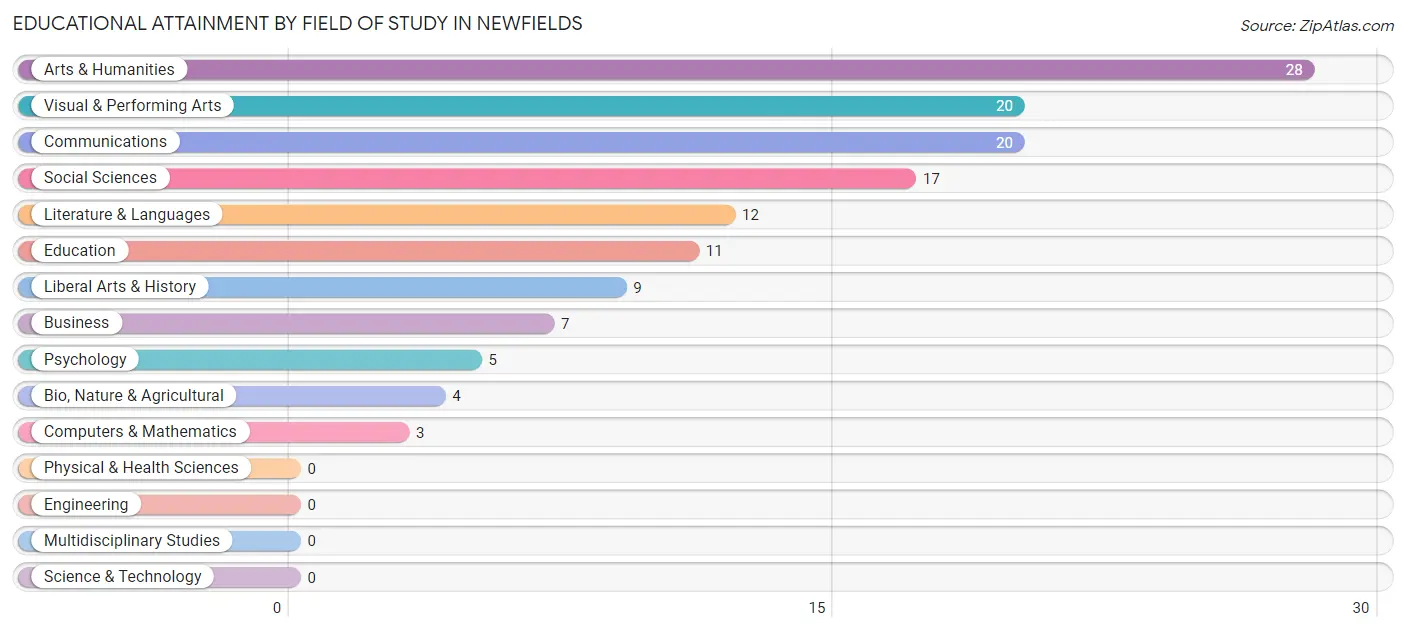
| Field of Study | # Graduates | % Graduates |
| Computers & Mathematics | 3 | 2.2% |
| Bio, Nature & Agricultural | 4 | 2.9% |
| Physical & Health Sciences | 0 | 0.0% |
| Psychology | 5 | 3.7% |
| Social Sciences | 17 | 12.5% |
| Engineering | 0 | 0.0% |
| Multidisciplinary Studies | 0 | 0.0% |
| Science & Technology | 0 | 0.0% |
| Business | 7 | 5.1% |
| Education | 11 | 8.1% |
| Literature & Languages | 12 | 8.8% |
| Liberal Arts & History | 9 | 6.6% |
| Visual & Performing Arts | 20 | 14.7% |
| Communications | 20 | 14.7% |
| Arts & Humanities | 28 | 20.6% |
| Total | 136 | 100.0% |
Transportation & Commute in Newfields
Vehicle Availability by Sex in Newfields
The most prevalent vehicle ownership categories in Newfields are males with 2 vehicles (59, accounting for 67.0%) and females with 2 vehicles (62, making up 73.8%).
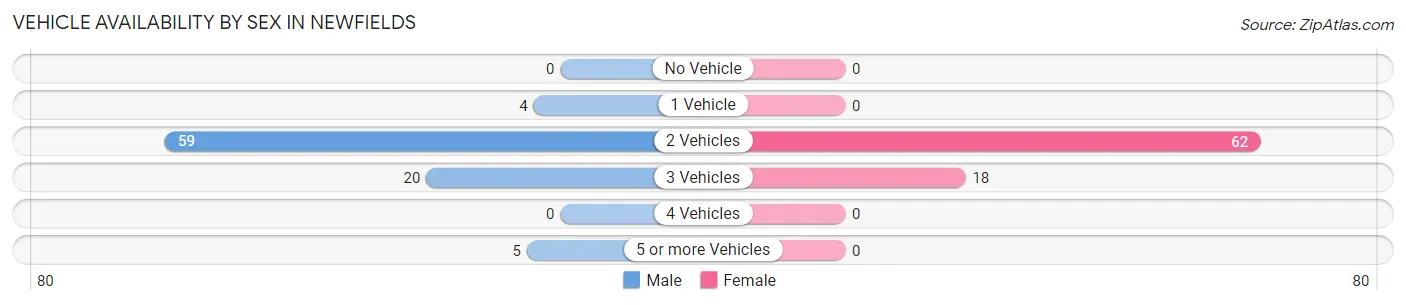
| Vehicles Available | Male | Female |
| No Vehicle | 0 (0.0%) | 0 (0.0%) |
| 1 Vehicle | 4 (4.5%) | 0 (0.0%) |
| 2 Vehicles | 59 (67.0%) | 62 (77.5%) |
| 3 Vehicles | 20 (22.7%) | 18 (22.5%) |
| 4 Vehicles | 0 (0.0%) | 0 (0.0%) |
| 5 or more Vehicles | 5 (5.7%) | 0 (0.0%) |
| Total | 88 (100.0%) | 80 (100.0%) |
Commute Time in Newfields
The most frequently occuring commute durations in Newfields are 20 to 24 minutes (38 commuters, 28.1%), 10 to 14 minutes (25 commuters, 18.5%), and 60 to 89 minutes (20 commuters, 14.8%).
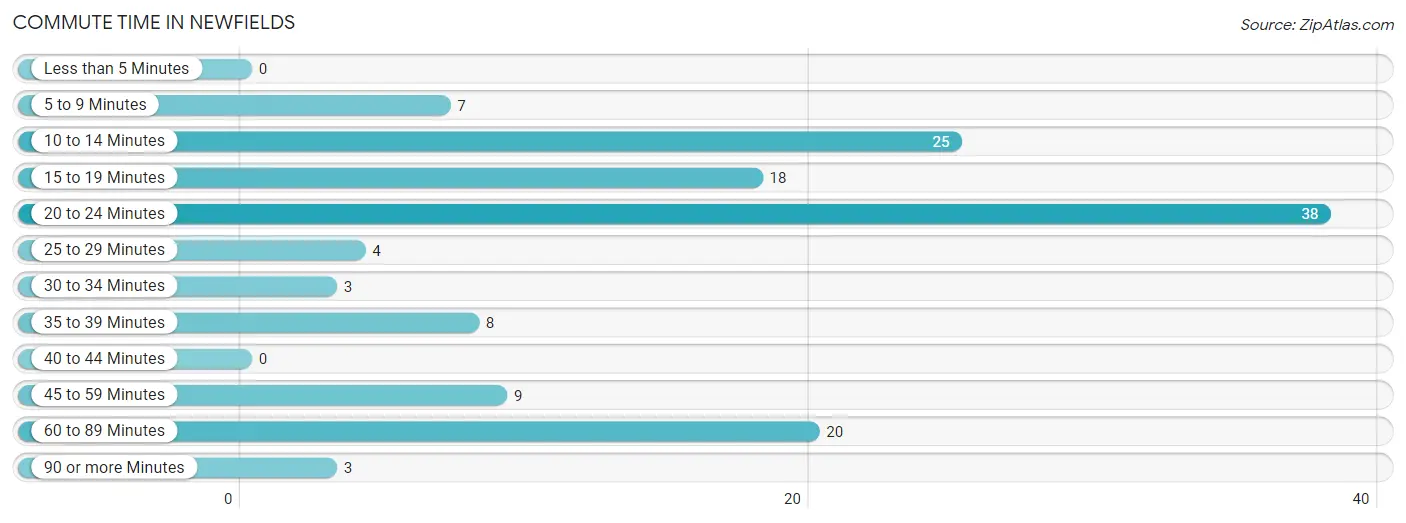
| Commute Time | # Commuters | % Commuters |
| Less than 5 Minutes | 0 | 0.0% |
| 5 to 9 Minutes | 7 | 5.2% |
| 10 to 14 Minutes | 25 | 18.5% |
| 15 to 19 Minutes | 18 | 13.3% |
| 20 to 24 Minutes | 38 | 28.1% |
| 25 to 29 Minutes | 4 | 3.0% |
| 30 to 34 Minutes | 3 | 2.2% |
| 35 to 39 Minutes | 8 | 5.9% |
| 40 to 44 Minutes | 0 | 0.0% |
| 45 to 59 Minutes | 9 | 6.7% |
| 60 to 89 Minutes | 20 | 14.8% |
| 90 or more Minutes | 3 | 2.2% |
Commute Time by Sex in Newfields
The most common commute times in Newfields are 20 to 24 minutes (18 commuters, 25.7%) for males and 20 to 24 minutes (20 commuters, 30.8%) for females.
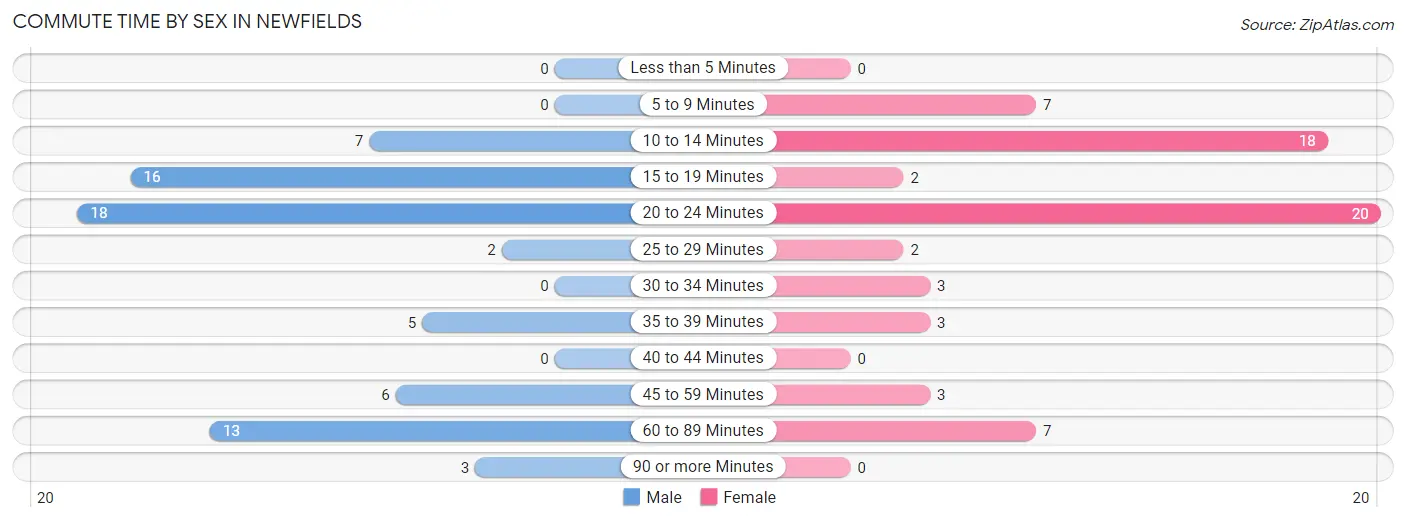
| Commute Time | Male | Female |
| Less than 5 Minutes | 0 (0.0%) | 0 (0.0%) |
| 5 to 9 Minutes | 0 (0.0%) | 7 (10.8%) |
| 10 to 14 Minutes | 7 (10.0%) | 18 (27.7%) |
| 15 to 19 Minutes | 16 (22.9%) | 2 (3.1%) |
| 20 to 24 Minutes | 18 (25.7%) | 20 (30.8%) |
| 25 to 29 Minutes | 2 (2.9%) | 2 (3.1%) |
| 30 to 34 Minutes | 0 (0.0%) | 3 (4.6%) |
| 35 to 39 Minutes | 5 (7.1%) | 3 (4.6%) |
| 40 to 44 Minutes | 0 (0.0%) | 0 (0.0%) |
| 45 to 59 Minutes | 6 (8.6%) | 3 (4.6%) |
| 60 to 89 Minutes | 13 (18.6%) | 7 (10.8%) |
| 90 or more Minutes | 3 (4.3%) | 0 (0.0%) |
Time of Departure to Work by Sex in Newfields
The most frequent times of departure to work in Newfields are 7:00 AM to 7:29 AM (16, 22.9%) for males and 7:00 AM to 7:29 AM (18, 27.7%) for females.
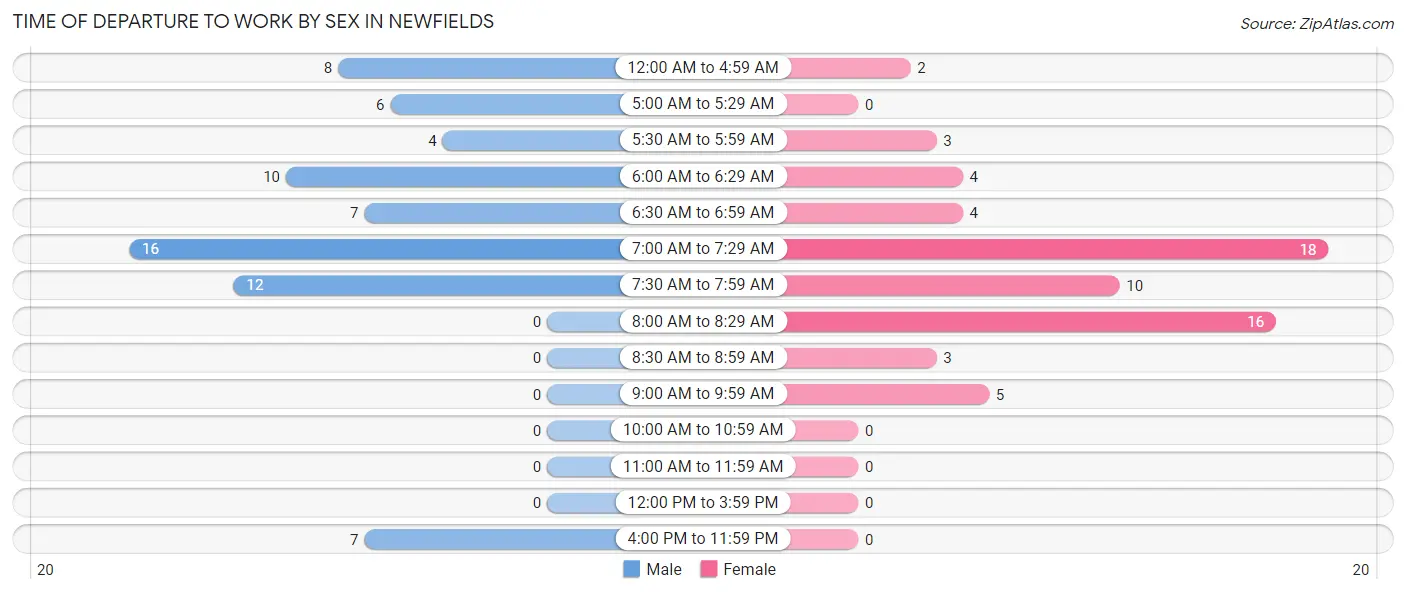
| Time of Departure | Male | Female |
| 12:00 AM to 4:59 AM | 8 (11.4%) | 2 (3.1%) |
| 5:00 AM to 5:29 AM | 6 (8.6%) | 0 (0.0%) |
| 5:30 AM to 5:59 AM | 4 (5.7%) | 3 (4.6%) |
| 6:00 AM to 6:29 AM | 10 (14.3%) | 4 (6.1%) |
| 6:30 AM to 6:59 AM | 7 (10.0%) | 4 (6.1%) |
| 7:00 AM to 7:29 AM | 16 (22.9%) | 18 (27.7%) |
| 7:30 AM to 7:59 AM | 12 (17.1%) | 10 (15.4%) |
| 8:00 AM to 8:29 AM | 0 (0.0%) | 16 (24.6%) |
| 8:30 AM to 8:59 AM | 0 (0.0%) | 3 (4.6%) |
| 9:00 AM to 9:59 AM | 0 (0.0%) | 5 (7.7%) |
| 10:00 AM to 10:59 AM | 0 (0.0%) | 0 (0.0%) |
| 11:00 AM to 11:59 AM | 0 (0.0%) | 0 (0.0%) |
| 12:00 PM to 3:59 PM | 0 (0.0%) | 0 (0.0%) |
| 4:00 PM to 11:59 PM | 7 (10.0%) | 0 (0.0%) |
| Total | 70 (100.0%) | 65 (100.0%) |
Housing Occupancy in Newfields
Occupancy by Ownership in Newfields
Of the total 107 dwellings in Newfields, owner-occupied units account for 94 (87.8%), while renter-occupied units make up 13 (12.1%).
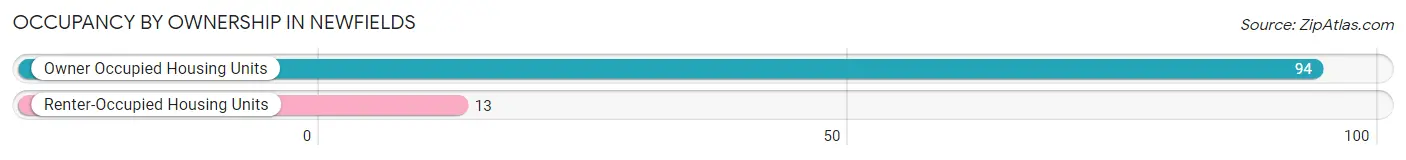
| Occupancy | # Housing Units | % Housing Units |
| Owner Occupied Housing Units | 94 | 87.8% |
| Renter-Occupied Housing Units | 13 | 12.1% |
| Total Occupied Housing Units | 107 | 100.0% |
Occupancy by Household Size in Newfields
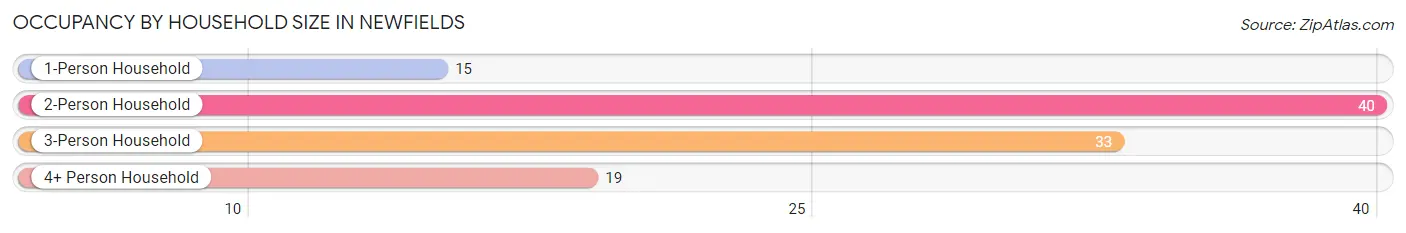
| Household Size | # Housing Units | % Housing Units |
| 1-Person Household | 15 | 14.0% |
| 2-Person Household | 40 | 37.4% |
| 3-Person Household | 33 | 30.8% |
| 4+ Person Household | 19 | 17.8% |
| Total Housing Units | 107 | 100.0% |
Occupancy by Ownership by Household Size in Newfields
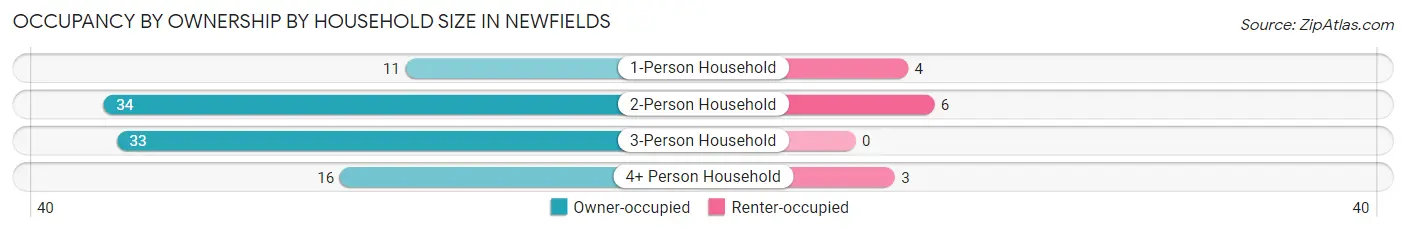
| Household Size | Owner-occupied | Renter-occupied |
| 1-Person Household | 11 (73.3%) | 4 (26.7%) |
| 2-Person Household | 34 (85.0%) | 6 (15.0%) |
| 3-Person Household | 33 (100.0%) | 0 (0.0%) |
| 4+ Person Household | 16 (84.2%) | 3 (15.8%) |
| Total Housing Units | 94 (87.8%) | 13 (12.1%) |
Occupancy by Educational Attainment in Newfields
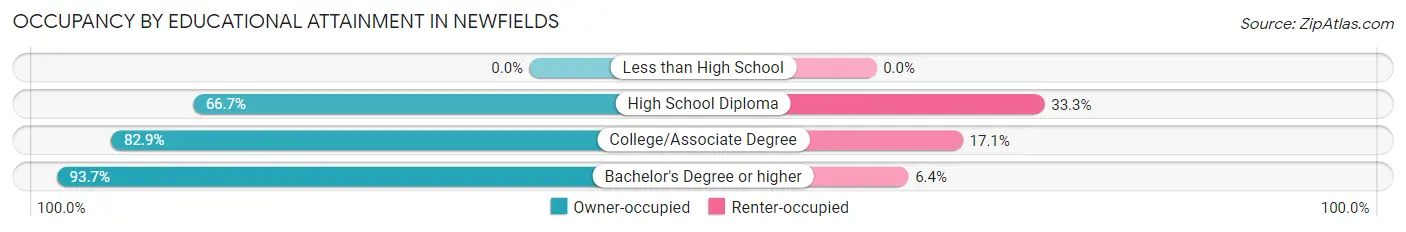
| Household Size | Owner-occupied | Renter-occupied |
| Less than High School | 0 (0.0%) | 0 (0.0%) |
| High School Diploma | 6 (66.7%) | 3 (33.3%) |
| College/Associate Degree | 29 (82.9%) | 6 (17.1%) |
| Bachelor's Degree or higher | 59 (93.6%) | 4 (6.4%) |
Occupancy by Age of Householder in Newfields
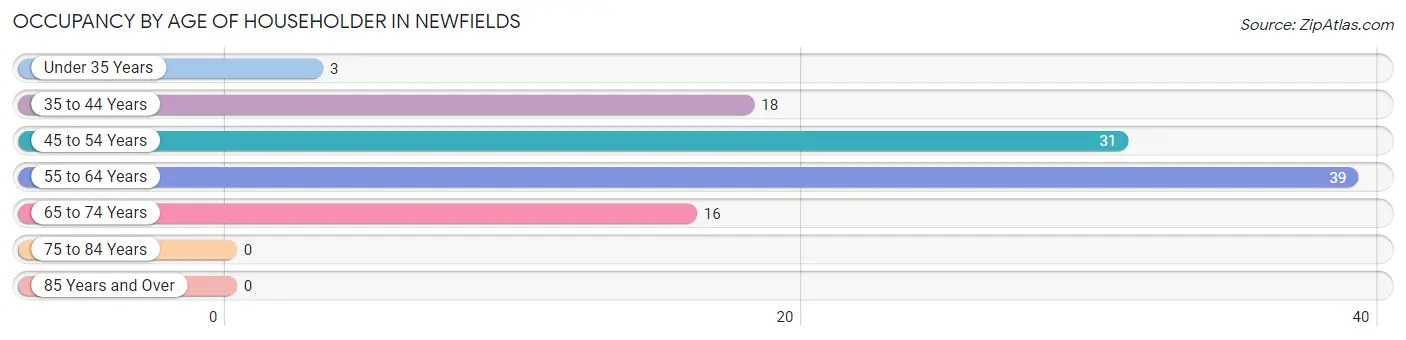
| Age Bracket | # Households | % Households |
| Under 35 Years | 3 | 2.8% |
| 35 to 44 Years | 18 | 16.8% |
| 45 to 54 Years | 31 | 29.0% |
| 55 to 64 Years | 39 | 36.4% |
| 65 to 74 Years | 16 | 14.9% |
| 75 to 84 Years | 0 | 0.0% |
| 85 Years and Over | 0 | 0.0% |
| Total | 107 | 100.0% |
Housing Finances in Newfields
Median Income by Occupancy in Newfields
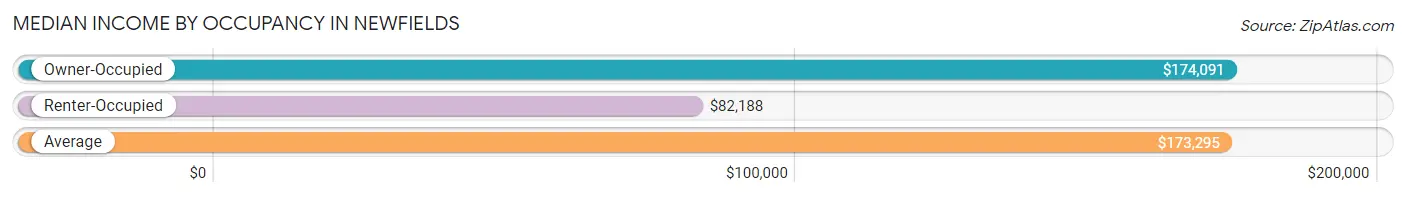
| Occupancy Type | # Households | Median Income |
| Owner-Occupied | 94 (87.8%) | $174,091 |
| Renter-Occupied | 13 (12.1%) | $82,188 |
| Average | 107 (100.0%) | $173,295 |
Occupancy by Householder Income Bracket in Newfields
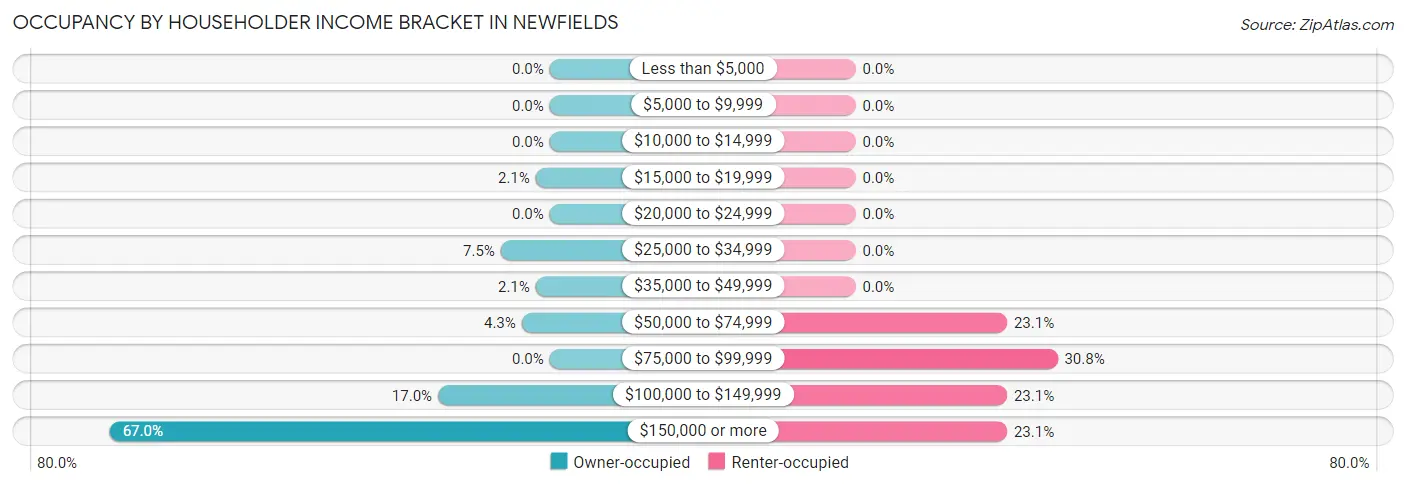
| Income Bracket | Owner-occupied | Renter-occupied |
| Less than $5,000 | 0 (0.0%) | 0 (0.0%) |
| $5,000 to $9,999 | 0 (0.0%) | 0 (0.0%) |
| $10,000 to $14,999 | 0 (0.0%) | 0 (0.0%) |
| $15,000 to $19,999 | 2 (2.1%) | 0 (0.0%) |
| $20,000 to $24,999 | 0 (0.0%) | 0 (0.0%) |
| $25,000 to $34,999 | 7 (7.4%) | 0 (0.0%) |
| $35,000 to $49,999 | 2 (2.1%) | 0 (0.0%) |
| $50,000 to $74,999 | 4 (4.3%) | 3 (23.1%) |
| $75,000 to $99,999 | 0 (0.0%) | 4 (30.8%) |
| $100,000 to $149,999 | 16 (17.0%) | 3 (23.1%) |
| $150,000 or more | 63 (67.0%) | 3 (23.1%) |
| Total | 94 (100.0%) | 13 (100.0%) |
Monthly Housing Cost Tiers in Newfields
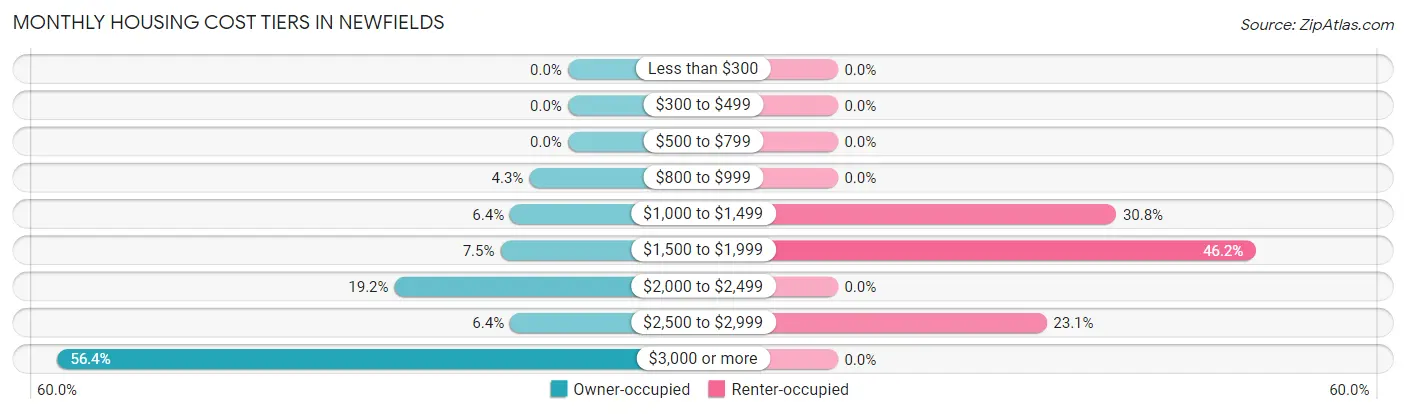
| Monthly Cost | Owner-occupied | Renter-occupied |
| Less than $300 | 0 (0.0%) | 0 (0.0%) |
| $300 to $499 | 0 (0.0%) | 0 (0.0%) |
| $500 to $799 | 0 (0.0%) | 0 (0.0%) |
| $800 to $999 | 4 (4.3%) | 0 (0.0%) |
| $1,000 to $1,499 | 6 (6.4%) | 4 (30.8%) |
| $1,500 to $1,999 | 7 (7.4%) | 6 (46.2%) |
| $2,000 to $2,499 | 18 (19.2%) | 0 (0.0%) |
| $2,500 to $2,999 | 6 (6.4%) | 3 (23.1%) |
| $3,000 or more | 53 (56.4%) | 0 (0.0%) |
| Total | 94 (100.0%) | 13 (100.0%) |
Physical Housing Characteristics in Newfields
Housing Structures in Newfields
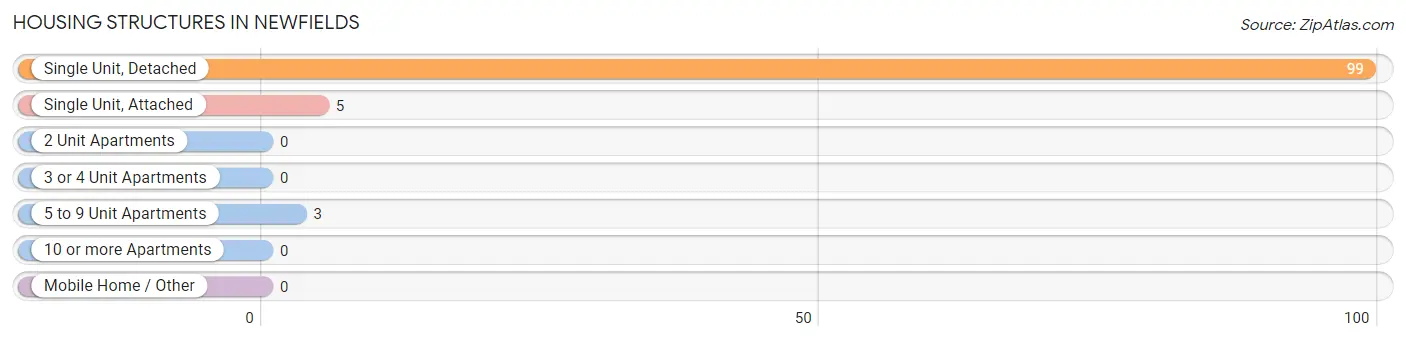
| Structure Type | # Housing Units | % Housing Units |
| Single Unit, Detached | 99 | 92.5% |
| Single Unit, Attached | 5 | 4.7% |
| 2 Unit Apartments | 0 | 0.0% |
| 3 or 4 Unit Apartments | 0 | 0.0% |
| 5 to 9 Unit Apartments | 3 | 2.8% |
| 10 or more Apartments | 0 | 0.0% |
| Mobile Home / Other | 0 | 0.0% |
| Total | 107 | 100.0% |
Housing Structures by Occupancy in Newfields
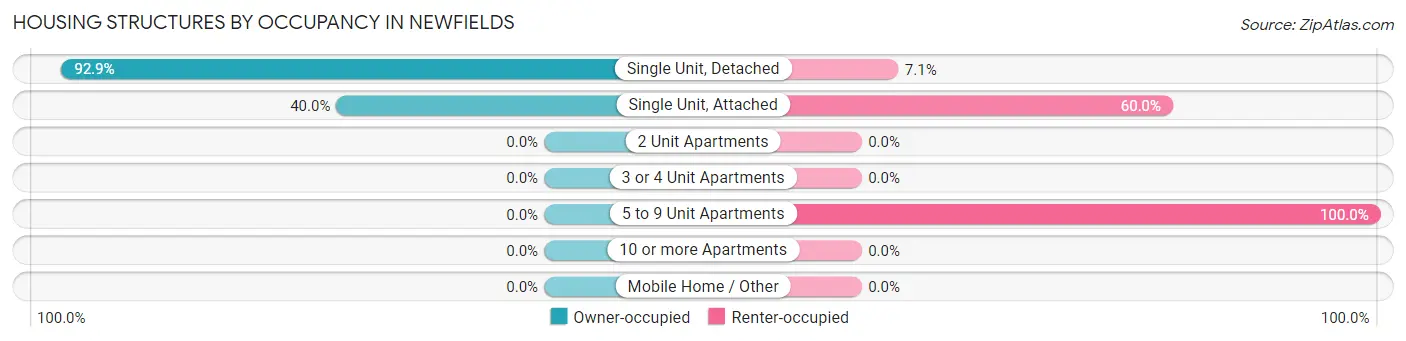
| Structure Type | Owner-occupied | Renter-occupied |
| Single Unit, Detached | 92 (92.9%) | 7 (7.1%) |
| Single Unit, Attached | 2 (40.0%) | 3 (60.0%) |
| 2 Unit Apartments | 0 (0.0%) | 0 (0.0%) |
| 3 or 4 Unit Apartments | 0 (0.0%) | 0 (0.0%) |
| 5 to 9 Unit Apartments | 0 (0.0%) | 3 (100.0%) |
| 10 or more Apartments | 0 (0.0%) | 0 (0.0%) |
| Mobile Home / Other | 0 (0.0%) | 0 (0.0%) |
| Total | 94 (87.8%) | 13 (12.1%) |
Housing Structures by Number of Rooms in Newfields
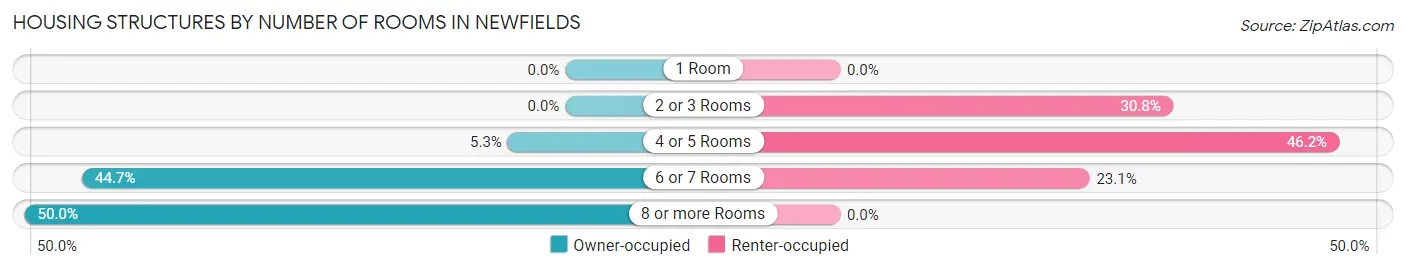
| Number of Rooms | Owner-occupied | Renter-occupied |
| 1 Room | 0 (0.0%) | 0 (0.0%) |
| 2 or 3 Rooms | 0 (0.0%) | 4 (30.8%) |
| 4 or 5 Rooms | 5 (5.3%) | 6 (46.2%) |
| 6 or 7 Rooms | 42 (44.7%) | 3 (23.1%) |
| 8 or more Rooms | 47 (50.0%) | 0 (0.0%) |
| Total | 94 (100.0%) | 13 (100.0%) |
Housing Structure by Heating Type in Newfields
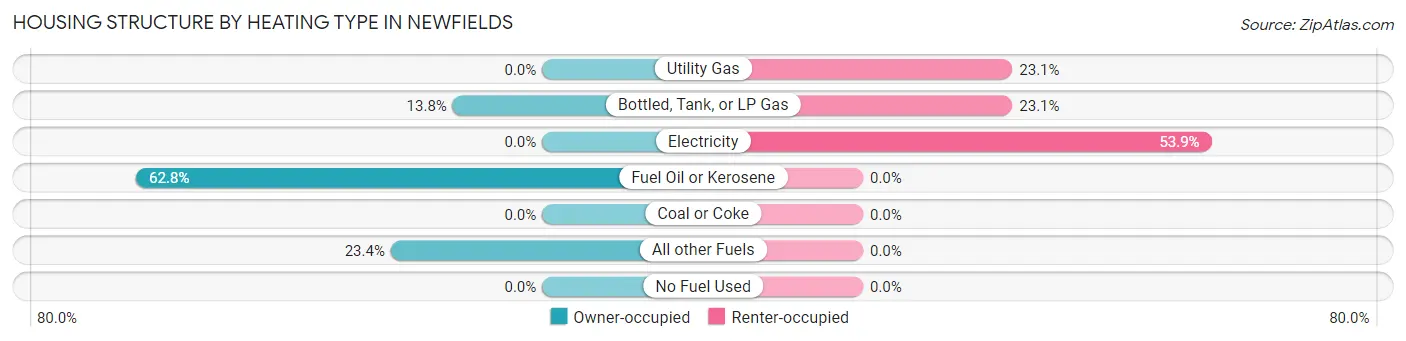
| Heating Type | Owner-occupied | Renter-occupied |
| Utility Gas | 0 (0.0%) | 3 (23.1%) |
| Bottled, Tank, or LP Gas | 13 (13.8%) | 3 (23.1%) |
| Electricity | 0 (0.0%) | 7 (53.8%) |
| Fuel Oil or Kerosene | 59 (62.8%) | 0 (0.0%) |
| Coal or Coke | 0 (0.0%) | 0 (0.0%) |
| All other Fuels | 22 (23.4%) | 0 (0.0%) |
| No Fuel Used | 0 (0.0%) | 0 (0.0%) |
| Total | 94 (100.0%) | 13 (100.0%) |
Household Vehicle Usage in Newfields
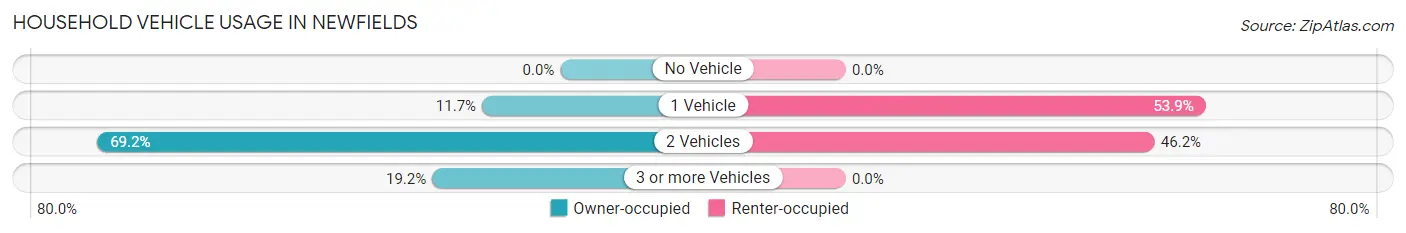
| Vehicles per Household | Owner-occupied | Renter-occupied |
| No Vehicle | 0 (0.0%) | 0 (0.0%) |
| 1 Vehicle | 11 (11.7%) | 7 (53.8%) |
| 2 Vehicles | 65 (69.2%) | 6 (46.2%) |
| 3 or more Vehicles | 18 (19.2%) | 0 (0.0%) |
| Total | 94 (100.0%) | 13 (100.0%) |
Real Estate & Mortgages in Newfields
Real Estate and Mortgage Overview in Newfields
| Characteristic | Without Mortgage | With Mortgage |
| Housing Units | 13 | 81 |
| Median Property Value | $427,800 | $485,400 |
| Median Household Income | - | - |
| Monthly Housing Costs | $1,501 | $53 |
| Real Estate Taxes | - | - |
Property Value by Mortgage Status in Newfields
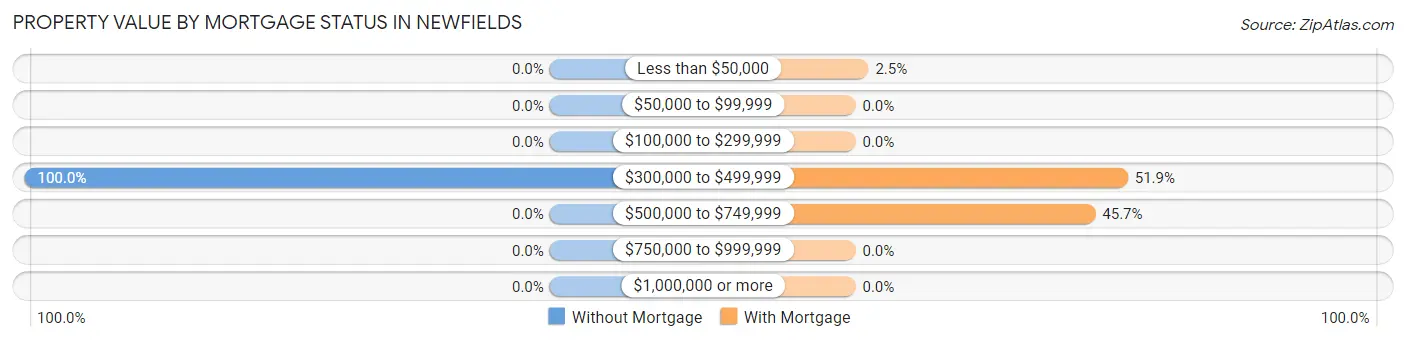
| Property Value | Without Mortgage | With Mortgage |
| Less than $50,000 | 0 (0.0%) | 2 (2.5%) |
| $50,000 to $99,999 | 0 (0.0%) | 0 (0.0%) |
| $100,000 to $299,999 | 0 (0.0%) | 0 (0.0%) |
| $300,000 to $499,999 | 13 (100.0%) | 42 (51.8%) |
| $500,000 to $749,999 | 0 (0.0%) | 37 (45.7%) |
| $750,000 to $999,999 | 0 (0.0%) | 0 (0.0%) |
| $1,000,000 or more | 0 (0.0%) | 0 (0.0%) |
| Total | 13 (100.0%) | 81 (100.0%) |
Household Income by Mortgage Status in Newfields
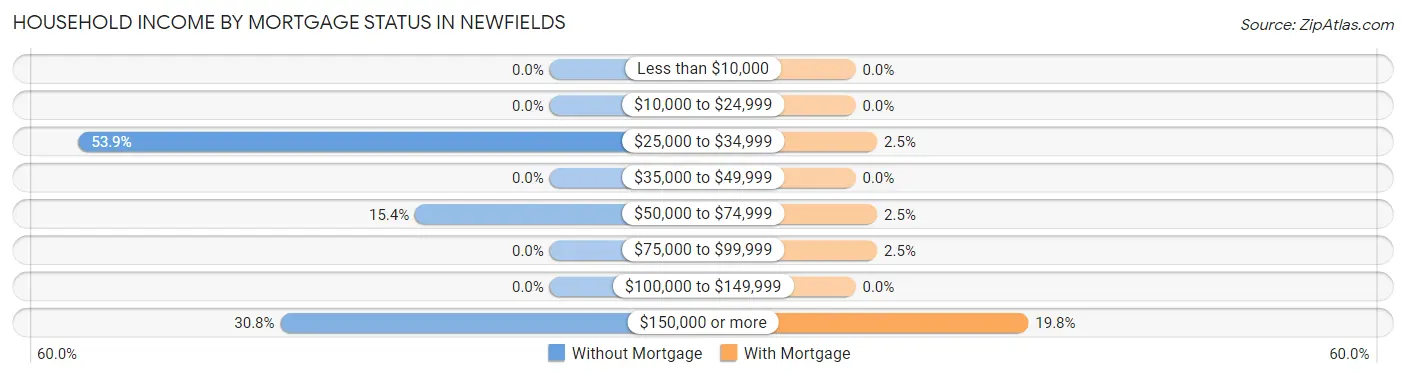
| Household Income | Without Mortgage | With Mortgage |
| Less than $10,000 | 0 (0.0%) | 0 (0.0%) |
| $10,000 to $24,999 | 0 (0.0%) | 0 (0.0%) |
| $25,000 to $34,999 | 7 (53.8%) | 2 (2.5%) |
| $35,000 to $49,999 | 0 (0.0%) | 0 (0.0%) |
| $50,000 to $74,999 | 2 (15.4%) | 2 (2.5%) |
| $75,000 to $99,999 | 0 (0.0%) | 2 (2.5%) |
| $100,000 to $149,999 | 0 (0.0%) | 0 (0.0%) |
| $150,000 or more | 4 (30.8%) | 16 (19.8%) |
| Total | 13 (100.0%) | 81 (100.0%) |
Property Value to Household Income Ratio in Newfields
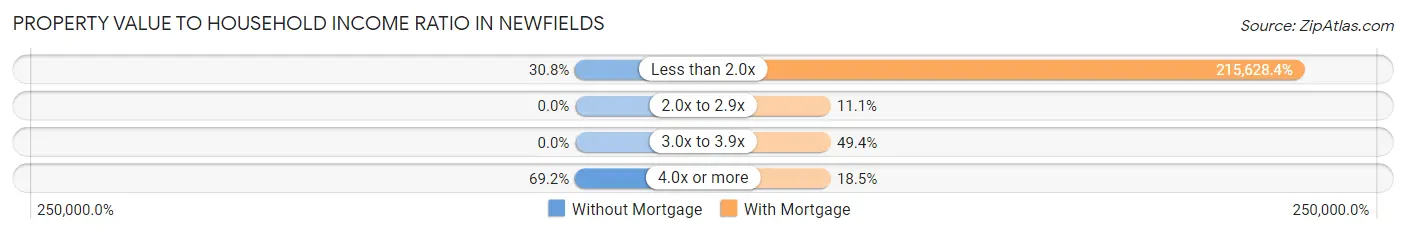
| Value-to-Income Ratio | Without Mortgage | With Mortgage |
| Less than 2.0x | 4 (30.8%) | 174,659 (215,628.4%) |
| 2.0x to 2.9x | 0 (0.0%) | 9 (11.1%) |
| 3.0x to 3.9x | 0 (0.0%) | 40 (49.4%) |
| 4.0x or more | 9 (69.2%) | 15 (18.5%) |
| Total | 13 (100.0%) | 81 (100.0%) |
Real Estate Taxes by Mortgage Status in Newfields
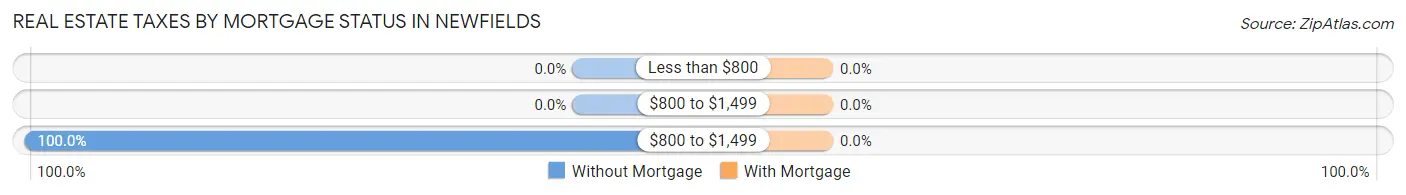
| Property Taxes | Without Mortgage | With Mortgage |
| Less than $800 | 0 (0.0%) | 0 (0.0%) |
| $800 to $1,499 | 0 (0.0%) | 0 (0.0%) |
| $800 to $1,499 | 13 (100.0%) | 0 (0.0%) |
| Total | 13 (100.0%) | 81 (100.0%) |
Health & Disability in Newfields
Health Insurance Coverage by Age in Newfields
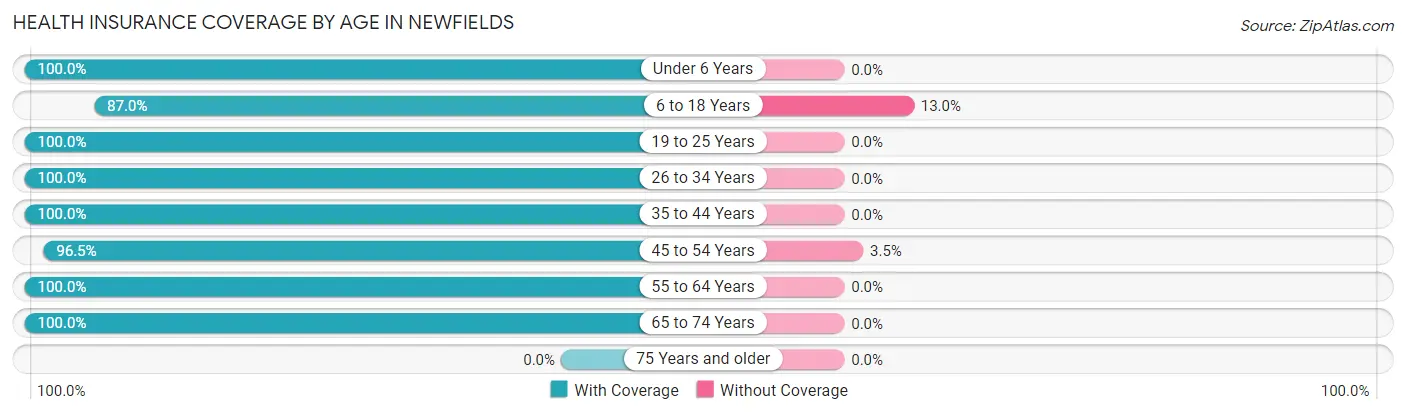
| Age Bracket | With Coverage | Without Coverage |
| Under 6 Years | 8 (100.0%) | 0 (0.0%) |
| 6 to 18 Years | 47 (87.0%) | 7 (13.0%) |
| 19 to 25 Years | 24 (100.0%) | 0 (0.0%) |
| 26 to 34 Years | 15 (100.0%) | 0 (0.0%) |
| 35 to 44 Years | 33 (100.0%) | 0 (0.0%) |
| 45 to 54 Years | 55 (96.5%) | 2 (3.5%) |
| 55 to 64 Years | 76 (100.0%) | 0 (0.0%) |
| 65 to 74 Years | 24 (100.0%) | 0 (0.0%) |
| 75 Years and older | 0 (0.0%) | 0 (0.0%) |
| Total | 282 (96.9%) | 9 (3.1%) |
Health Insurance Coverage by Citizenship Status in Newfields
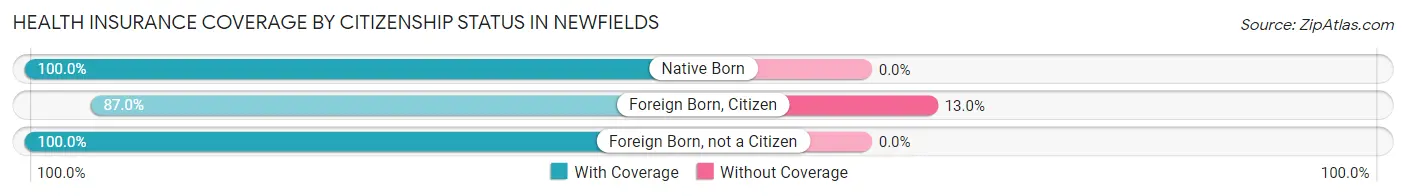
| Citizenship Status | With Coverage | Without Coverage |
| Native Born | 8 (100.0%) | 0 (0.0%) |
| Foreign Born, Citizen | 47 (87.0%) | 7 (13.0%) |
| Foreign Born, not a Citizen | 24 (100.0%) | 0 (0.0%) |
Health Insurance Coverage by Household Income in Newfields
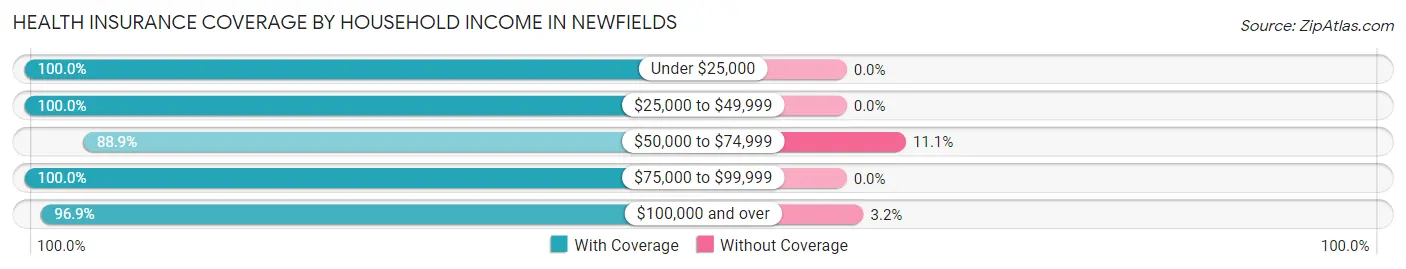
| Household Income | With Coverage | Without Coverage |
| Under $25,000 | 4 (100.0%) | 0 (0.0%) |
| $25,000 to $49,999 | 43 (100.0%) | 0 (0.0%) |
| $50,000 to $74,999 | 16 (88.9%) | 2 (11.1%) |
| $75,000 to $99,999 | 4 (100.0%) | 0 (0.0%) |
| $100,000 and over | 215 (96.9%) | 7 (3.2%) |
Public vs Private Health Insurance Coverage by Age in Newfields
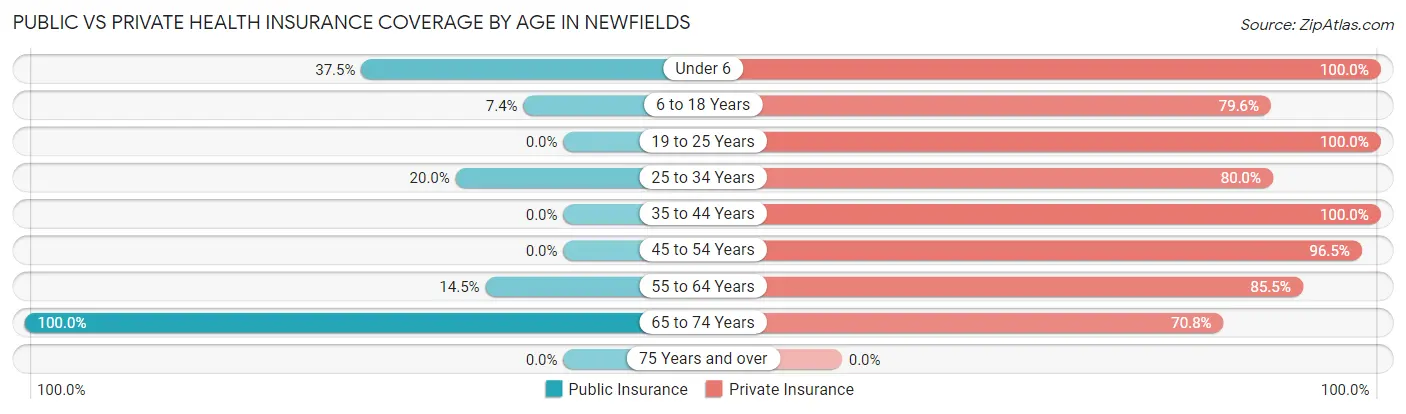
| Age Bracket | Public Insurance | Private Insurance |
| Under 6 | 3 (37.5%) | 8 (100.0%) |
| 6 to 18 Years | 4 (7.4%) | 43 (79.6%) |
| 19 to 25 Years | 0 (0.0%) | 24 (100.0%) |
| 25 to 34 Years | 3 (20.0%) | 12 (80.0%) |
| 35 to 44 Years | 0 (0.0%) | 33 (100.0%) |
| 45 to 54 Years | 0 (0.0%) | 55 (96.5%) |
| 55 to 64 Years | 11 (14.5%) | 65 (85.5%) |
| 65 to 74 Years | 24 (100.0%) | 17 (70.8%) |
| 75 Years and over | 0 (0.0%) | 0 (0.0%) |
| Total | 45 (15.5%) | 257 (88.3%) |
Disability Status by Sex by Age in Newfields
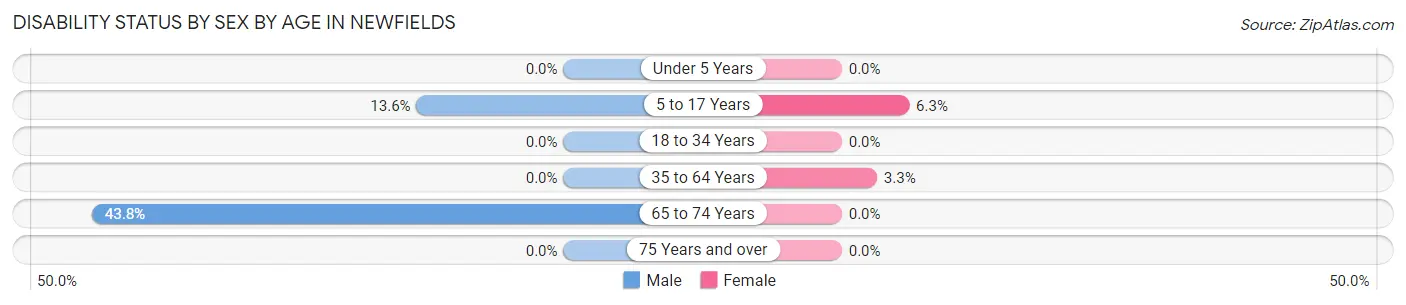
| Age Bracket | Male | Female |
| Under 5 Years | 0 (0.0%) | 0 (0.0%) |
| 5 to 17 Years | 3 (13.6%) | 2 (6.2%) |
| 18 to 34 Years | 0 (0.0%) | 0 (0.0%) |
| 35 to 64 Years | 0 (0.0%) | 3 (3.3%) |
| 65 to 74 Years | 7 (43.8%) | 0 (0.0%) |
| 75 Years and over | 0 (0.0%) | 0 (0.0%) |
Disability Class by Sex by Age in Newfields
Disability Class: Hearing Difficulty
| Age Bracket | Male | Female |
| Under 5 Years | 0 (0.0%) | 0 (0.0%) |
| 5 to 17 Years | 0 (0.0%) | 0 (0.0%) |
| 18 to 34 Years | 0 (0.0%) | 0 (0.0%) |
| 35 to 64 Years | 0 (0.0%) | 0 (0.0%) |
| 65 to 74 Years | 0 (0.0%) | 0 (0.0%) |
| 75 Years and over | 0 (0.0%) | 0 (0.0%) |
Disability Class: Vision Difficulty
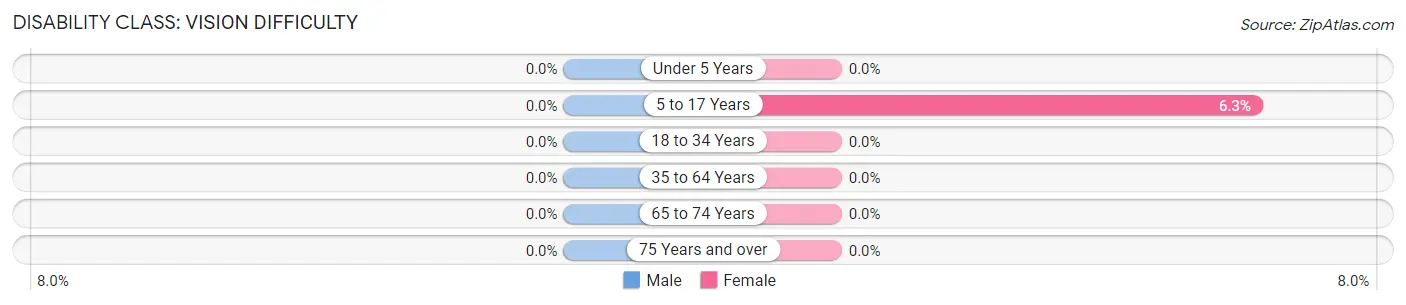
| Age Bracket | Male | Female |
| Under 5 Years | 0 (0.0%) | 0 (0.0%) |
| 5 to 17 Years | 0 (0.0%) | 2 (6.2%) |
| 18 to 34 Years | 0 (0.0%) | 0 (0.0%) |
| 35 to 64 Years | 0 (0.0%) | 0 (0.0%) |
| 65 to 74 Years | 0 (0.0%) | 0 (0.0%) |
| 75 Years and over | 0 (0.0%) | 0 (0.0%) |
Disability Class: Cognitive Difficulty
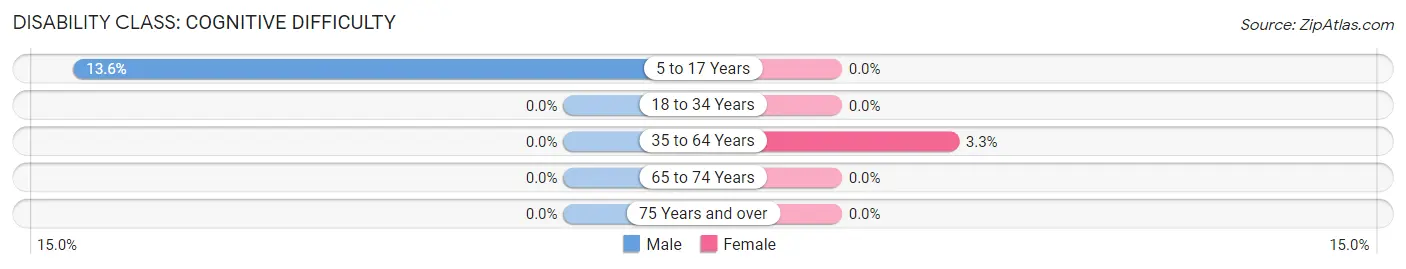
| Age Bracket | Male | Female |
| 5 to 17 Years | 3 (13.6%) | 0 (0.0%) |
| 18 to 34 Years | 0 (0.0%) | 0 (0.0%) |
| 35 to 64 Years | 0 (0.0%) | 3 (3.3%) |
| 65 to 74 Years | 0 (0.0%) | 0 (0.0%) |
| 75 Years and over | 0 (0.0%) | 0 (0.0%) |
Disability Class: Ambulatory Difficulty
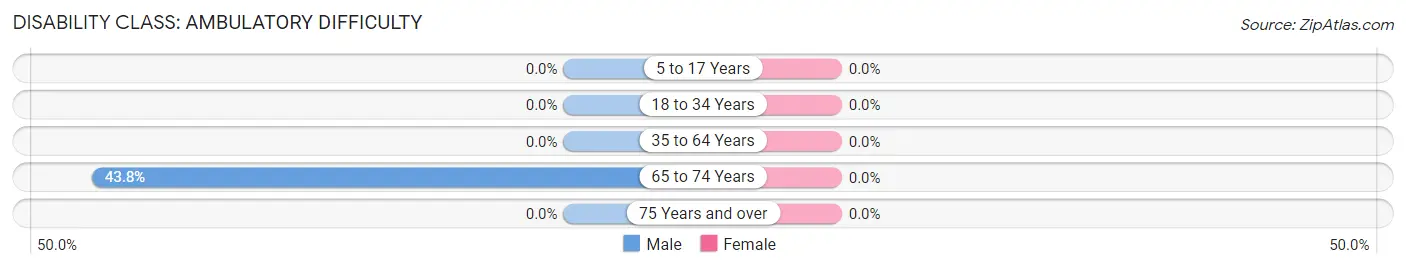
| Age Bracket | Male | Female |
| 5 to 17 Years | 0 (0.0%) | 0 (0.0%) |
| 18 to 34 Years | 0 (0.0%) | 0 (0.0%) |
| 35 to 64 Years | 0 (0.0%) | 0 (0.0%) |
| 65 to 74 Years | 7 (43.8%) | 0 (0.0%) |
| 75 Years and over | 0 (0.0%) | 0 (0.0%) |
Disability Class: Self-Care Difficulty
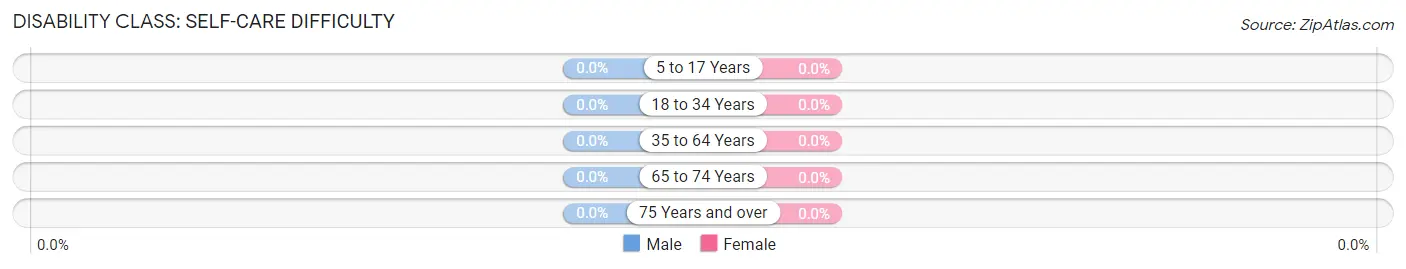
| Age Bracket | Male | Female |
| 5 to 17 Years | 0 (0.0%) | 0 (0.0%) |
| 18 to 34 Years | 0 (0.0%) | 0 (0.0%) |
| 35 to 64 Years | 0 (0.0%) | 0 (0.0%) |
| 65 to 74 Years | 0 (0.0%) | 0 (0.0%) |
| 75 Years and over | 0 (0.0%) | 0 (0.0%) |
Technology Access in Newfields
Computing Device Access in Newfields
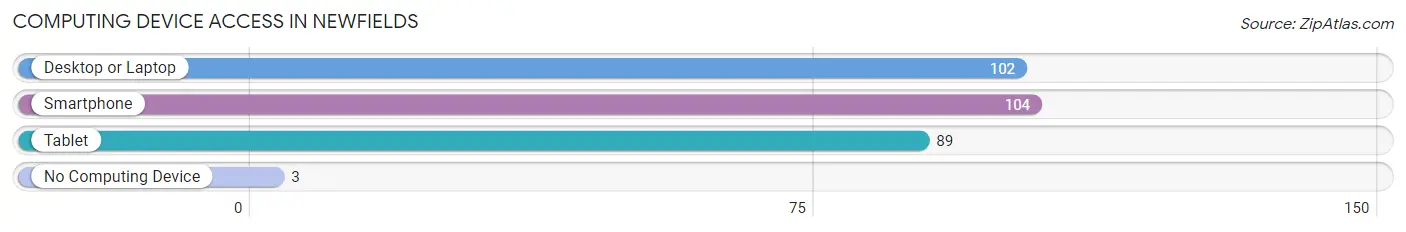
| Device Type | # Households | % Households |
| Desktop or Laptop | 102 | 95.3% |
| Smartphone | 104 | 97.2% |
| Tablet | 89 | 83.2% |
| No Computing Device | 3 | 2.8% |
| Total | 107 | 100.0% |
Internet Access in Newfields
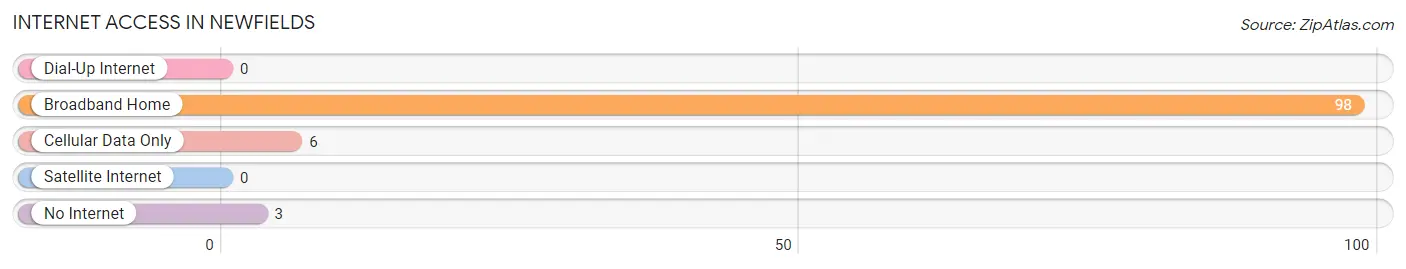
| Internet Type | # Households | % Households |
| Dial-Up Internet | 0 | 0.0% |
| Broadband Home | 98 | 91.6% |
| Cellular Data Only | 6 | 5.6% |
| Satellite Internet | 0 | 0.0% |
| No Internet | 3 | 2.8% |
| Total | 107 | 100.0% |
Newfields Summary
Newfields is a small town located in Rockingham County, New Hampshire, United States. It is situated in the southeastern corner of the state, about 10 miles from the Atlantic Ocean. The town was incorporated in 1727 and has a population of approximately 2,500 people.
History
The area that is now Newfields was originally inhabited by the Abenaki Native American tribe. The first European settlers arrived in the area in 1638 and the town was officially incorporated in 1727. The town was named after the Newfield family, who were among the first settlers.
The town was primarily an agricultural community for much of its history, with the main crops being corn, potatoes, and hay. In the late 19th century, the town began to develop a small manufacturing industry, with several small factories producing textiles, shoes, and other goods.
Geography
Newfields is located in southeastern New Hampshire, about 10 miles from the Atlantic Ocean. The town is situated in the Piscataqua River Valley, which is part of the larger Seacoast Region of New Hampshire. The town is bordered by Exeter to the north, Stratham to the east, Greenland to the south, and Newmarket to the west.
The town is mostly rural, with a few small villages scattered throughout. The town is home to several small lakes, including Great Bay, Little Bay, and Newfield Pond. The town is also home to several small streams, including the Lamprey River and the Squamscott River.
Economy
The economy of Newfields is largely based on agriculture and tourism. The town is home to several small farms, which produce a variety of crops, including corn, potatoes, hay, and apples. The town is also home to several small businesses, including restaurants, retail stores, and a few small manufacturing companies.
The town is also a popular tourist destination, with several attractions, including the Newfields Historical Society Museum, the Newfields Town Hall, and the Newfields Town Beach. The town is also home to several small parks, including the Newfields Town Common and the Newfields Town Forest.
Demographics
As of the 2010 census, the population of Newfields was 2,521. The racial makeup of the town was 97.2% White, 0.7% African American, 0.3% Native American, 0.4% Asian, 0.1% Pacific Islander, 0.3% from other races, and 1.0% from two or more races. Hispanic or Latino of any race were 1.2% of the population.
The median household income in Newfields was $68,750, and the median family income was $76,250. The per capita income for the town was $30,945. About 4.2% of families and 5.3% of the population were below the poverty line, including 6.2% of those under age 18 and 4.2% of those age 65 or over.
Common Questions
What is Per Capita Income in Newfields?
Per Capita income in Newfields is $58,664.
What is the Median Family Income in Newfields?
Median Family Income in Newfields is $178,750.
What is the Median Household income in Newfields?
Median Household Income in Newfields is $173,295.
What is Income or Wage Gap in Newfields?
Income or Wage Gap in Newfields is 54.9%.
Women in Newfields earn 45.1 cents for every dollar earned by a man.
What is Inequality or Gini Index in Newfields?
Inequality or Gini Index in Newfields is 0.24.
What is the Total Population of Newfields?
Total Population of Newfields is 291.
What is the Total Male Population of Newfields?
Total Male Population of Newfields is 145.
What is the Total Female Population of Newfields?
Total Female Population of Newfields is 146.
What is the Ratio of Males per 100 Females in Newfields?
There are 99.32 Males per 100 Females in Newfields.
What is the Ratio of Females per 100 Males in Newfields?
There are 100.69 Females per 100 Males in Newfields.
What is the Median Population Age in Newfields?
Median Population Age in Newfields is 46.8 Years.
What is the Average Family Size in Newfields
Average Family Size in Newfields is 3.0 People.
What is the Average Household Size in Newfields
Average Household Size in Newfields is 2.7 People.
How Large is the Labor Force in Newfields?
There are 174 People in the Labor Forcein in Newfields.
What is the Percentage of People in the Labor Force in Newfields?
73.4% of People are in the Labor Force in Newfields.
What is the Unemployment Rate in Newfields?
Unemployment Rate in Newfields is 1.7%.