Farmington, NH Map & Demographics
Farmington Map
Farmington Overview
$24,548
PER CAPITA INCOME
$44,693
AVG FAMILY INCOME
$44,664
AVG HOUSEHOLD INCOME
23.4%
WAGE / INCOME GAP [ % ]
76.6¢/ $1
WAGE / INCOME GAP [ $ ]
0.38
INEQUALITY / GINI INDEX
3,722
TOTAL POPULATION
1,774
MALE POPULATION
1,948
FEMALE POPULATION
91.07
MALES / 100 FEMALES
109.81
FEMALES / 100 MALES
37.7
MEDIAN AGE
2.8
AVG FAMILY SIZE
2.2
AVG HOUSEHOLD SIZE
2,094
LABOR FORCE [ PEOPLE ]
68.6%
PERCENT IN LABOR FORCE
4.3%
UNEMPLOYMENT RATE
Farmington Zip Codes
Farmington Area Codes
Income in Farmington
Income Overview in Farmington
Per Capita Income in Farmington is $24,548, while median incomes of families and households are $44,693 and $44,664 respectively.
| Characteristic | Number | Measure |
| Per Capita Income | 3,722 | $24,548 |
| Median Family Income | 997 | $44,693 |
| Mean Family Income | 997 | $60,465 |
| Median Household Income | 1,689 | $44,664 |
| Mean Household Income | 1,689 | $53,310 |
| Income Deficit | 997 | $0 |
| Wage / Income Gap (%) | 3,722 | 23.44% |
| Wage / Income Gap ($) | 3,722 | 76.56¢ per $1 |
| Gini / Inequality Index | 3,722 | 0.38 |
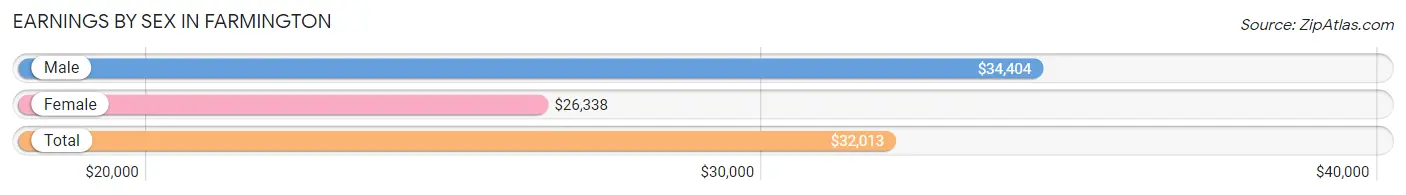
Earnings by Sex in Farmington
Average Earnings in Farmington are $32,013, $34,404 for men and $26,338 for women, a difference of 23.4%.
| Sex | Number | Average Earnings |
| Male | 1,111 (49.6%) | $34,404 |
| Female | 1,127 (50.4%) | $26,338 |
| Total | 2,238 (100.0%) | $32,013 |
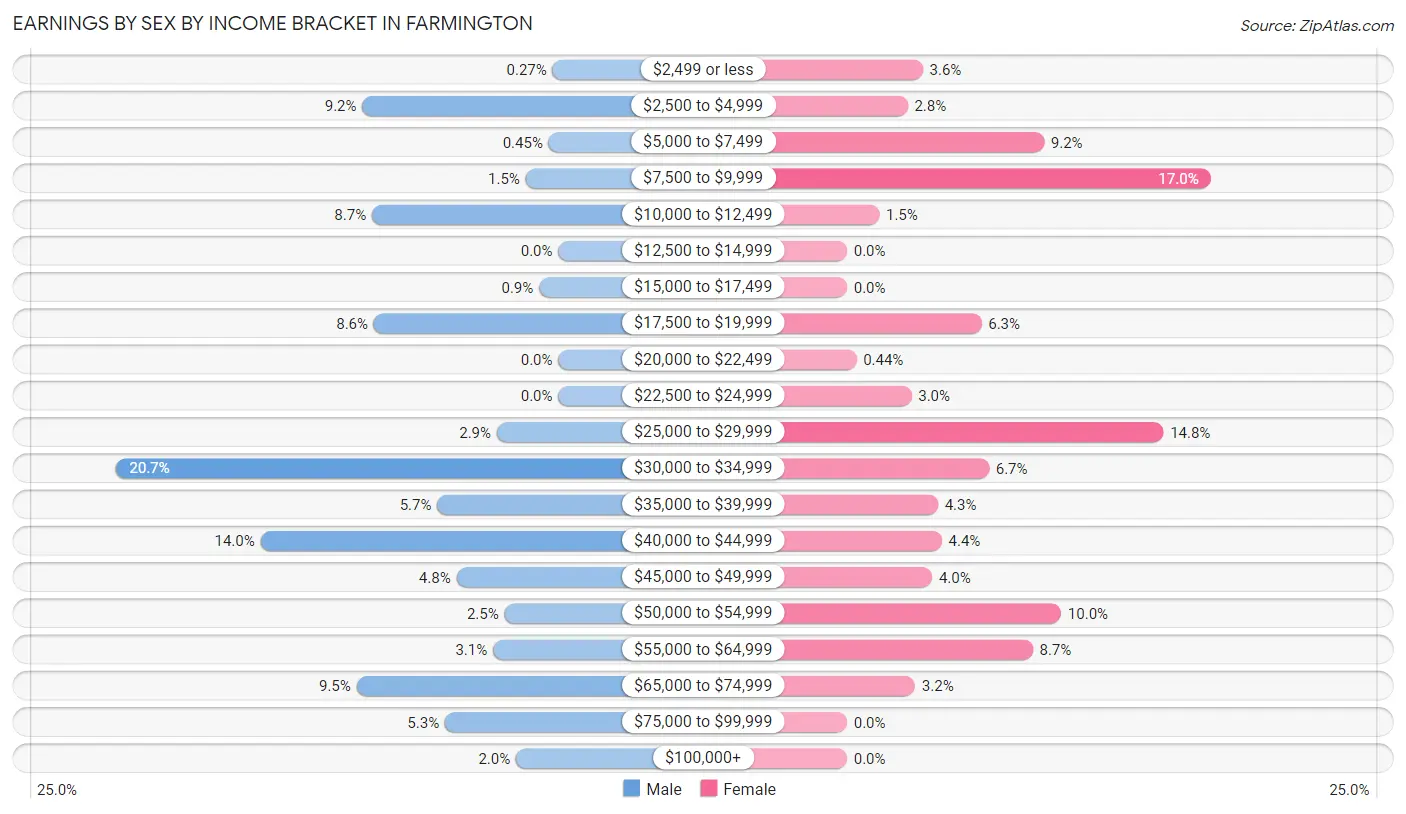
Earnings by Sex by Income Bracket in Farmington
The most common earnings brackets in Farmington are $30,000 to $34,999 for men (230 | 20.7%) and $7,500 to $9,999 for women (192 | 17.0%).
| Income | Male | Female |
| $2,499 or less | 3 (0.3%) | 40 (3.5%) |
| $2,500 to $4,999 | 102 (9.2%) | 32 (2.8%) |
| $5,000 to $7,499 | 5 (0.4%) | 104 (9.2%) |
| $7,500 to $9,999 | 17 (1.5%) | 192 (17.0%) |
| $10,000 to $12,499 | 97 (8.7%) | 17 (1.5%) |
| $12,500 to $14,999 | 0 (0.0%) | 0 (0.0%) |
| $15,000 to $17,499 | 10 (0.9%) | 0 (0.0%) |
| $17,500 to $19,999 | 96 (8.6%) | 71 (6.3%) |
| $20,000 to $22,499 | 0 (0.0%) | 5 (0.4%) |
| $22,500 to $24,999 | 0 (0.0%) | 34 (3.0%) |
| $25,000 to $29,999 | 32 (2.9%) | 167 (14.8%) |
| $30,000 to $34,999 | 230 (20.7%) | 75 (6.7%) |
| $35,000 to $39,999 | 63 (5.7%) | 48 (4.3%) |
| $40,000 to $44,999 | 155 (14.0%) | 50 (4.4%) |
| $45,000 to $49,999 | 53 (4.8%) | 45 (4.0%) |
| $50,000 to $54,999 | 28 (2.5%) | 113 (10.0%) |
| $55,000 to $64,999 | 34 (3.1%) | 98 (8.7%) |
| $65,000 to $74,999 | 105 (9.5%) | 36 (3.2%) |
| $75,000 to $99,999 | 59 (5.3%) | 0 (0.0%) |
| $100,000+ | 22 (2.0%) | 0 (0.0%) |
| Total | 1,111 (100.0%) | 1,127 (100.0%) |
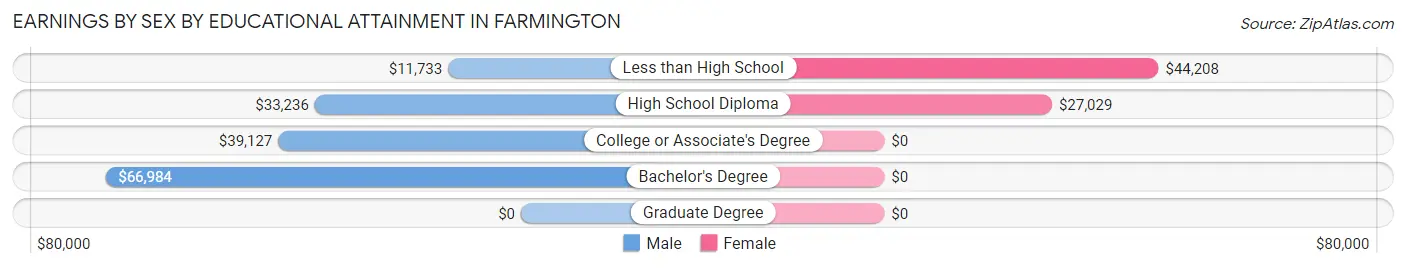
Earnings by Sex by Educational Attainment in Farmington
Average earnings in Farmington are $34,312 for men and $26,768 for women, a difference of 22.0%. Men with an educational attainment of bachelor's degree enjoy the highest average annual earnings of $66,984, while those with less than high school education earn the least with $11,733. Women with an educational attainment of less than high school earn the most with the average annual earnings of $44,208, while those with high school diploma education have the smallest earnings of $27,029.
| Educational Attainment | Male Income | Female Income |
| Less than High School | $11,733 | $44,208 |
| High School Diploma | $33,236 | $27,029 |
| College or Associate's Degree | $39,127 | $0 |
| Bachelor's Degree | $66,984 | $0 |
| Graduate Degree | - | - |
| Total | $34,312 | $26,768 |
Family Income in Farmington
Family Income Brackets in Farmington
According to the Farmington family income data, there are 233 families falling into the $25,000 to $34,999 income range, which is the most common income bracket and makes up 23.4% of all families.
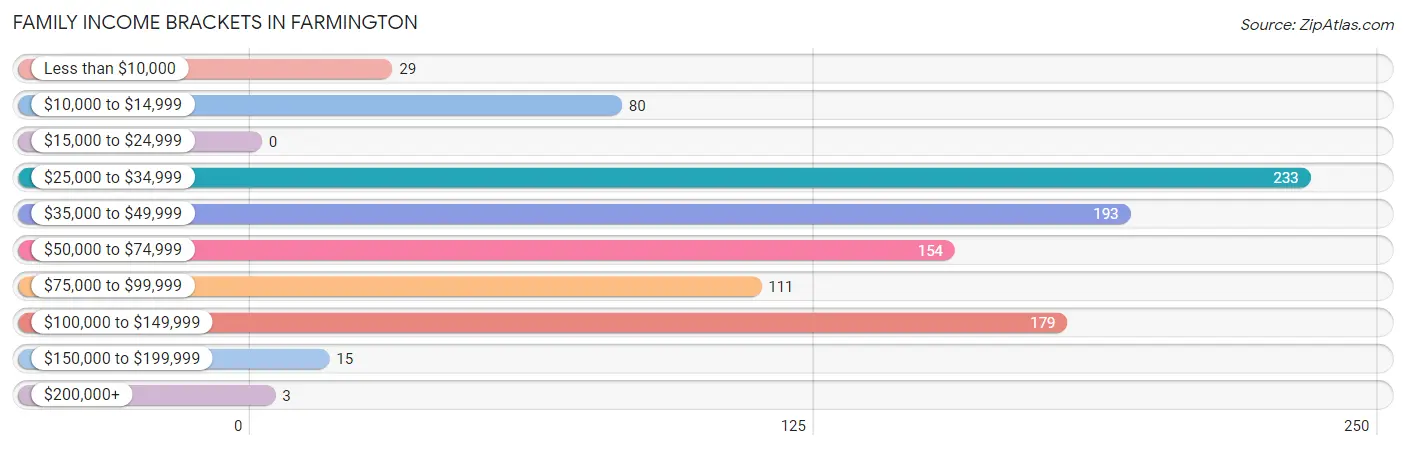
| Income Bracket | # Families | % Families |
| Less than $10,000 | 29 | 2.9% |
| $10,000 to $14,999 | 80 | 8.0% |
| $15,000 to $24,999 | 0 | 0.0% |
| $25,000 to $34,999 | 233 | 23.4% |
| $35,000 to $49,999 | 193 | 19.4% |
| $50,000 to $74,999 | 154 | 15.4% |
| $75,000 to $99,999 | 111 | 11.1% |
| $100,000 to $149,999 | 179 | 18.0% |
| $150,000 to $199,999 | 15 | 1.5% |
| $200,000+ | 3 | 0.3% |
Family Income by Famaliy Size in Farmington
3-person families (203 | 20.4%) account for the highest median family income in Farmington with $85,809 per family, while 3-person families (203 | 20.4%) have the highest median income of $28,603 per family member.
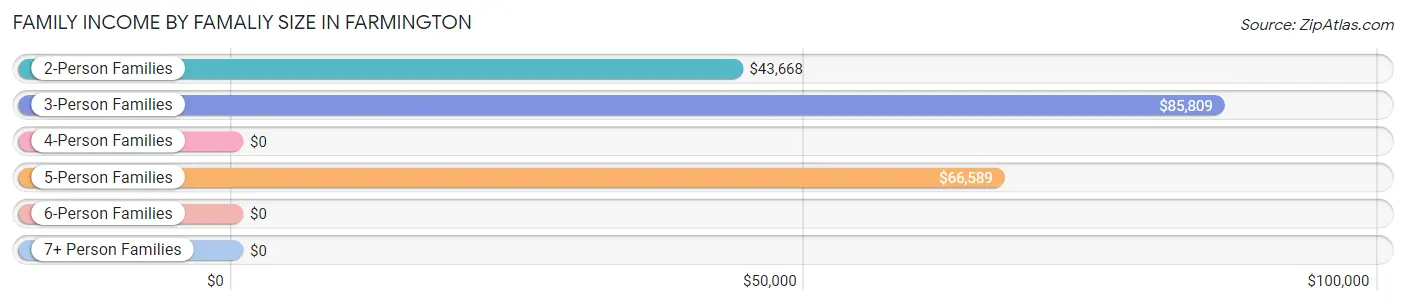
| Income Bracket | # Families | Median Income |
| 2-Person Families | 600 (60.2%) | $43,668 |
| 3-Person Families | 203 (20.4%) | $85,809 |
| 4-Person Families | 119 (11.9%) | $0 |
| 5-Person Families | 75 (7.5%) | $66,589 |
| 6-Person Families | 0 (0.0%) | $0 |
| 7+ Person Families | 0 (0.0%) | $0 |
| Total | 997 (100.0%) | $44,693 |
Family Income by Number of Earners in Farmington
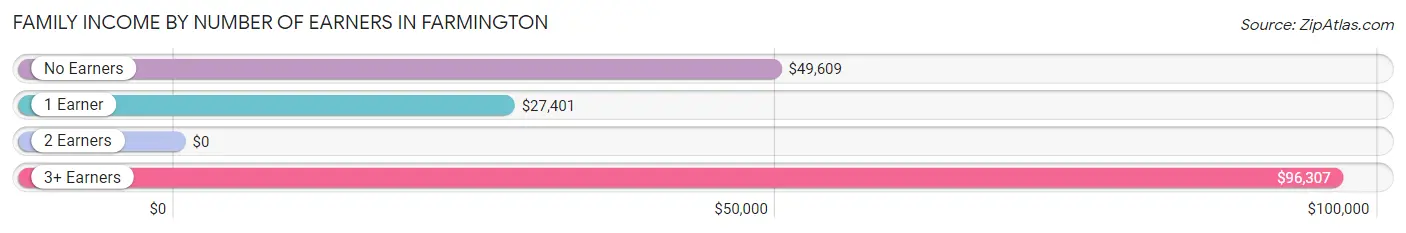
| Number of Earners | # Families | Median Income |
| No Earners | 37 (3.7%) | $49,609 |
| 1 Earner | 427 (42.8%) | $27,401 |
| 2 Earners | 392 (39.3%) | $0 |
| 3+ Earners | 141 (14.1%) | $96,307 |
| Total | 997 (100.0%) | $44,693 |
Household Income in Farmington
Household Income Brackets in Farmington
With 432 households falling in the category, the $35,000 to $49,999 income range is the most frequent in Farmington, accounting for 25.6% of all households. In contrast, only 3 households (0.2%) fall into the $200,000+ income bracket, making it the least populous group.
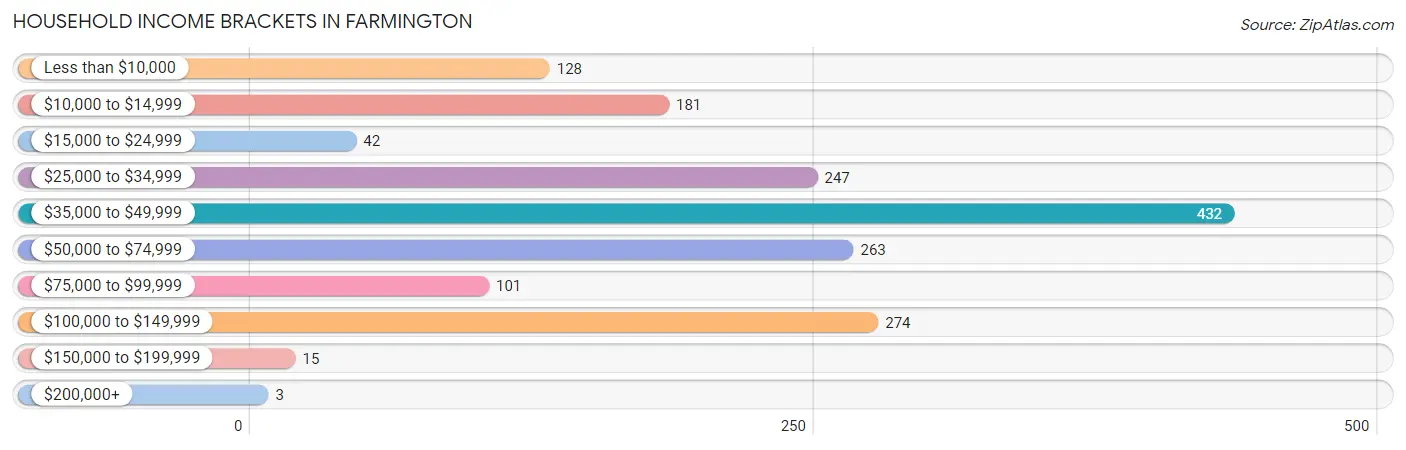
| Income Bracket | # Households | % Households |
| Less than $10,000 | 128 | 7.6% |
| $10,000 to $14,999 | 181 | 10.7% |
| $15,000 to $24,999 | 42 | 2.5% |
| $25,000 to $34,999 | 247 | 14.6% |
| $35,000 to $49,999 | 432 | 25.6% |
| $50,000 to $74,999 | 263 | 15.6% |
| $75,000 to $99,999 | 101 | 6.0% |
| $100,000 to $149,999 | 274 | 16.2% |
| $150,000 to $199,999 | 15 | 0.9% |
| $200,000+ | 3 | 0.2% |
Household Income by Householder Age in Farmington
The median household income in Farmington is $44,664, with the highest median household income of $66,377 found in the 45 to 64 years age bracket for the primary householder. A total of 765 households (45.3%) fall into this category. Meanwhile, the 15 to 24 years age bracket for the primary householder has the lowest median household income of $0, with 151 households (8.9%) in this group.
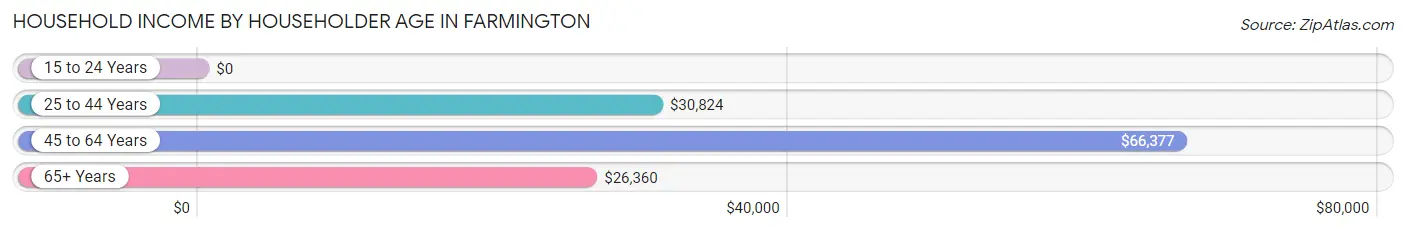
| Income Bracket | # Households | Median Income |
| 15 to 24 Years | 151 (8.9%) | $0 |
| 25 to 44 Years | 474 (28.1%) | $30,824 |
| 45 to 64 Years | 765 (45.3%) | $66,377 |
| 65+ Years | 299 (17.7%) | $26,360 |
| Total | 1,689 (100.0%) | $44,664 |
Poverty in Farmington
Income Below Poverty by Sex and Age in Farmington
With 9.6% poverty level for males and 17.2% for females among the residents of Farmington, 5 year old males and 6 to 11 year old females are the most vulnerable to poverty, with 22 males (100.0%) and 12 females (85.7%) in their respective age groups living below the poverty level.
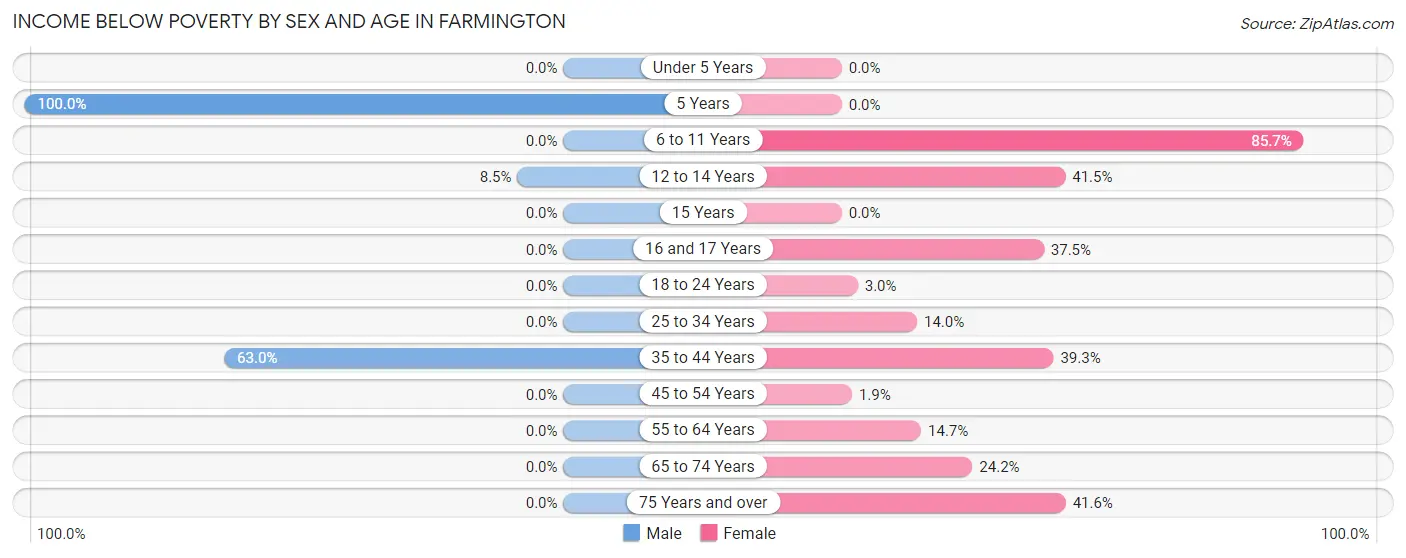
| Age Bracket | Male | Female |
| Under 5 Years | 0 (0.0%) | 0 (0.0%) |
| 5 Years | 22 (100.0%) | 0 (0.0%) |
| 6 to 11 Years | 0 (0.0%) | 12 (85.7%) |
| 12 to 14 Years | 7 (8.5%) | 78 (41.5%) |
| 15 Years | 0 (0.0%) | 0 (0.0%) |
| 16 and 17 Years | 0 (0.0%) | 6 (37.5%) |
| 18 to 24 Years | 0 (0.0%) | 6 (3.0%) |
| 25 to 34 Years | 0 (0.0%) | 51 (14.0%) |
| 35 to 44 Years | 141 (62.9%) | 22 (39.3%) |
| 45 to 54 Years | 0 (0.0%) | 5 (1.9%) |
| 55 to 64 Years | 0 (0.0%) | 68 (14.7%) |
| 65 to 74 Years | 0 (0.0%) | 24 (24.2%) |
| 75 Years and over | 0 (0.0%) | 64 (41.6%) |
| Total | 170 (9.6%) | 336 (17.2%) |
Income Above Poverty by Sex and Age in Farmington
According to the poverty statistics in Farmington, males aged under 5 years and females aged under 5 years are the age groups that are most secure financially, with 100.0% of males and 100.0% of females in these age groups living above the poverty line.
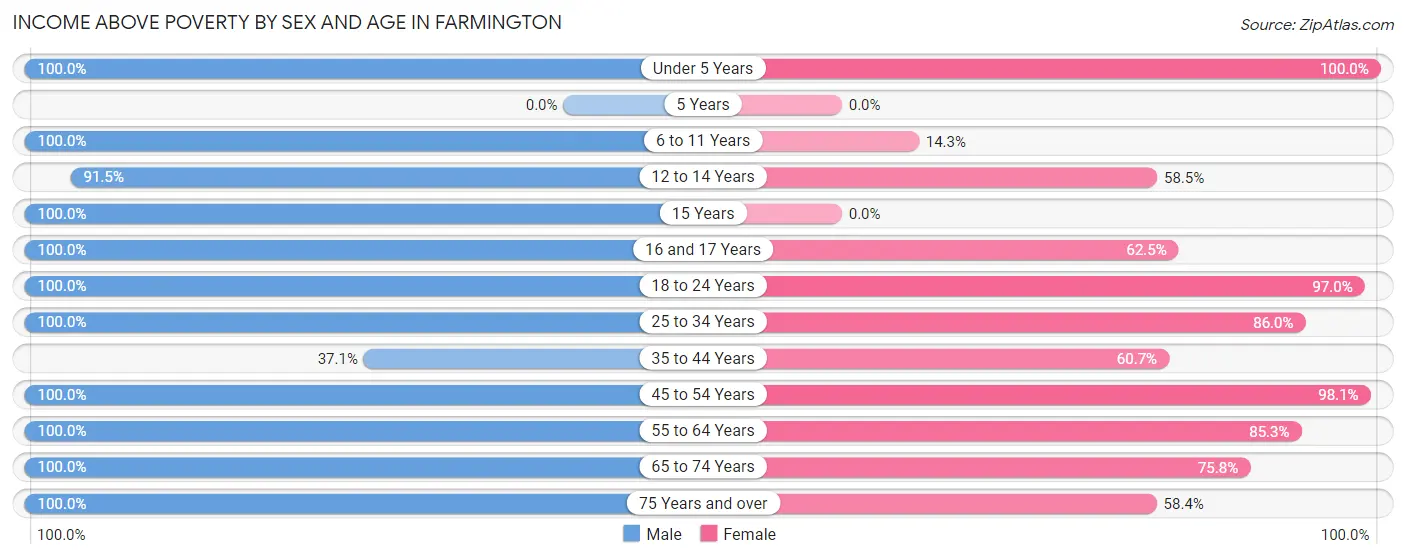
| Age Bracket | Male | Female |
| Under 5 Years | 144 (100.0%) | 128 (100.0%) |
| 5 Years | 0 (0.0%) | 0 (0.0%) |
| 6 to 11 Years | 66 (100.0%) | 2 (14.3%) |
| 12 to 14 Years | 75 (91.5%) | 110 (58.5%) |
| 15 Years | 25 (100.0%) | 0 (0.0%) |
| 16 and 17 Years | 32 (100.0%) | 10 (62.5%) |
| 18 to 24 Years | 122 (100.0%) | 196 (97.0%) |
| 25 to 34 Years | 362 (100.0%) | 314 (86.0%) |
| 35 to 44 Years | 83 (37.0%) | 34 (60.7%) |
| 45 to 54 Years | 80 (100.0%) | 259 (98.1%) |
| 55 to 64 Years | 498 (100.0%) | 394 (85.3%) |
| 65 to 74 Years | 34 (100.0%) | 75 (75.8%) |
| 75 Years and over | 75 (100.0%) | 90 (58.4%) |
| Total | 1,596 (90.4%) | 1,612 (82.8%) |
Income Below Poverty Among Married-Couple Families in Farmington
The poverty statistics for married-couple families in Farmington show that 3.1% or 22 of the total 702 families live below the poverty line. Families with 1 or 2 children have the highest poverty rate of 8.5%, comprising of 22 families. On the other hand, families with no children have the lowest poverty rate of 0.0%, which includes 0 families.
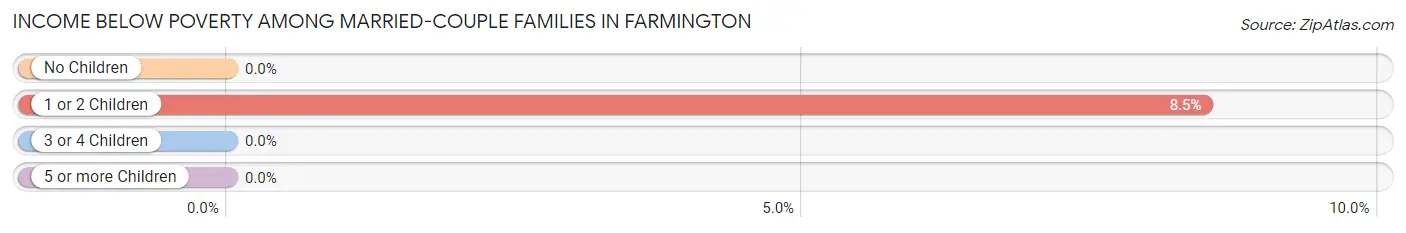
| Children | Above Poverty | Below Poverty |
| No Children | 443 (100.0%) | 0 (0.0%) |
| 1 or 2 Children | 237 (91.5%) | 22 (8.5%) |
| 3 or 4 Children | 0 (0.0%) | 0 (0.0%) |
| 5 or more Children | 0 (0.0%) | 0 (0.0%) |
| Total | 680 (96.9%) | 22 (3.1%) |
Income Below Poverty Among Single-Parent Households in Farmington
According to the poverty data in Farmington, 37.3% or 75 single-father households and 12.8% or 12 single-mother households are living below the poverty line. Among single-father households, those with 1 or 2 children have the highest poverty rate, with 75 households (40.5%) experiencing poverty. Likewise, among single-mother households, those with 1 or 2 children have the highest poverty rate, with 12 households (14.1%) falling below the poverty line.
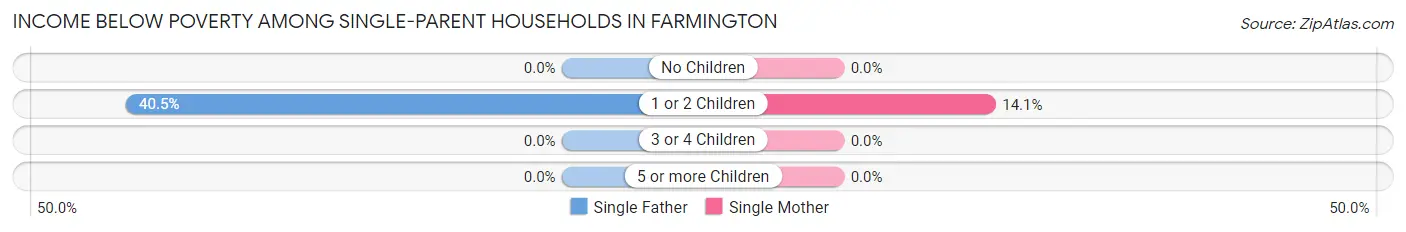
| Children | Single Father | Single Mother |
| No Children | 0 (0.0%) | 0 (0.0%) |
| 1 or 2 Children | 75 (40.5%) | 12 (14.1%) |
| 3 or 4 Children | 0 (0.0%) | 0 (0.0%) |
| 5 or more Children | 0 (0.0%) | 0 (0.0%) |
| Total | 75 (37.3%) | 12 (12.8%) |
Income Below Poverty Among Married-Couple vs Single-Parent Households in Farmington
The poverty data for Farmington shows that 22 of the married-couple family households (3.1%) and 87 of the single-parent households (29.5%) are living below the poverty level. Within the married-couple family households, those with 1 or 2 children have the highest poverty rate, with 22 households (8.5%) falling below the poverty line. Among the single-parent households, those with 1 or 2 children have the highest poverty rate, with 87 household (32.2%) living below poverty.
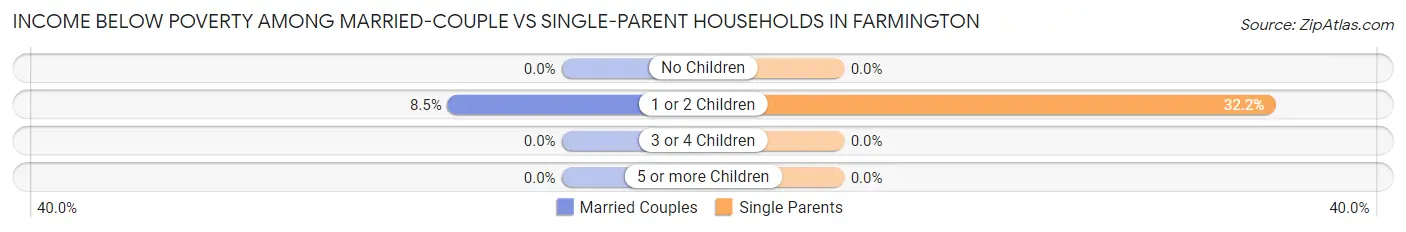
| Children | Married-Couple Families | Single-Parent Households |
| No Children | 0 (0.0%) | 0 (0.0%) |
| 1 or 2 Children | 22 (8.5%) | 87 (32.2%) |
| 3 or 4 Children | 0 (0.0%) | 0 (0.0%) |
| 5 or more Children | 0 (0.0%) | 0 (0.0%) |
| Total | 22 (3.1%) | 87 (29.5%) |
Race in Farmington
The most populous races in Farmington are White / Caucasian (3,386 | 91.0%), Some other Race (128 | 3.4%), and Black / African American (114 | 3.1%).
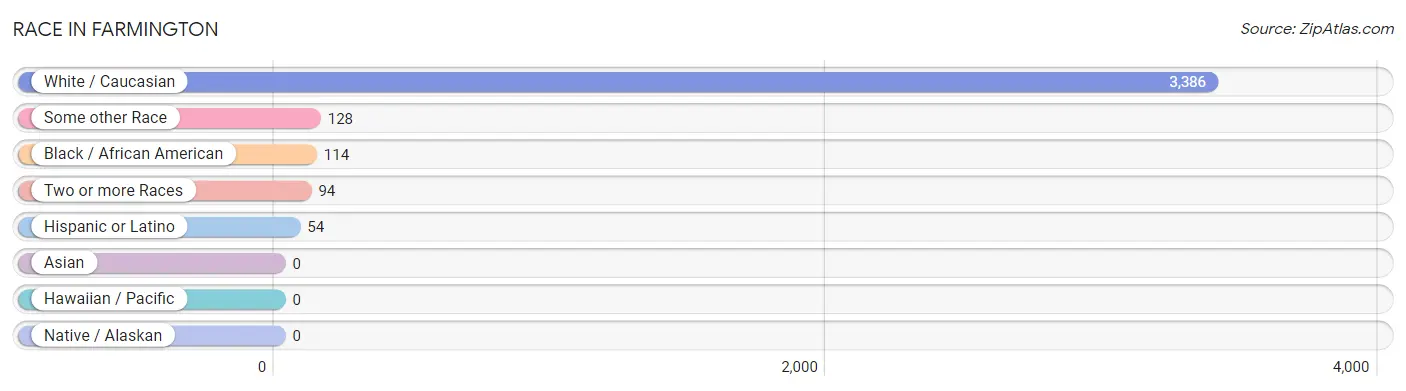
| Race | # Population | % Population |
| Asian | 0 | 0.0% |
| Black / African American | 114 | 3.1% |
| Hawaiian / Pacific | 0 | 0.0% |
| Hispanic or Latino | 54 | 1.5% |
| Native / Alaskan | 0 | 0.0% |
| White / Caucasian | 3,386 | 91.0% |
| Two or more Races | 94 | 2.5% |
| Some other Race | 128 | 3.4% |
| Total | 3,722 | 100.0% |
Ancestry in Farmington
The most populous ancestries reported in Farmington are English (610 | 16.4%), French (590 | 15.9%), Irish (567 | 15.2%), German (444 | 11.9%), and French Canadian (377 | 10.1%), together accounting for 69.5% of all Farmington residents.
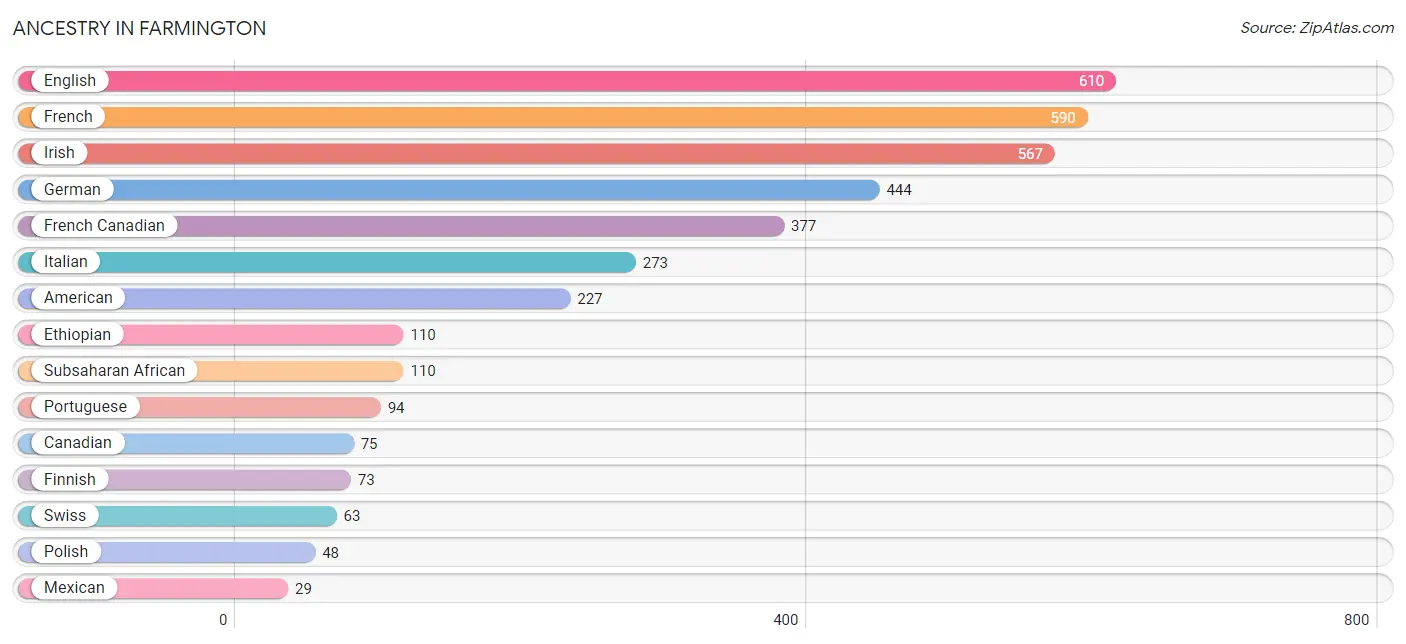
| Ancestry | # Population | % Population |
| American | 227 | 6.1% |
| Apache | 15 | 0.4% |
| Canadian | 75 | 2.0% |
| Dominican | 25 | 0.7% |
| Dutch | 25 | 0.7% |
| English | 610 | 16.4% |
| Ethiopian | 110 | 3.0% |
| European | 15 | 0.4% |
| Finnish | 73 | 2.0% |
| French | 590 | 15.9% |
| French American Indian | 22 | 0.6% |
| French Canadian | 377 | 10.1% |
| German | 444 | 11.9% |
| Irish | 567 | 15.2% |
| Italian | 273 | 7.3% |
| Mexican | 29 | 0.8% |
| Polish | 48 | 1.3% |
| Portuguese | 94 | 2.5% |
| Scottish | 15 | 0.4% |
| Subsaharan African | 110 | 3.0% |
| Swedish | 8 | 0.2% |
| Swiss | 63 | 1.7% | View All 22 Rows |
Immigrants in Farmington
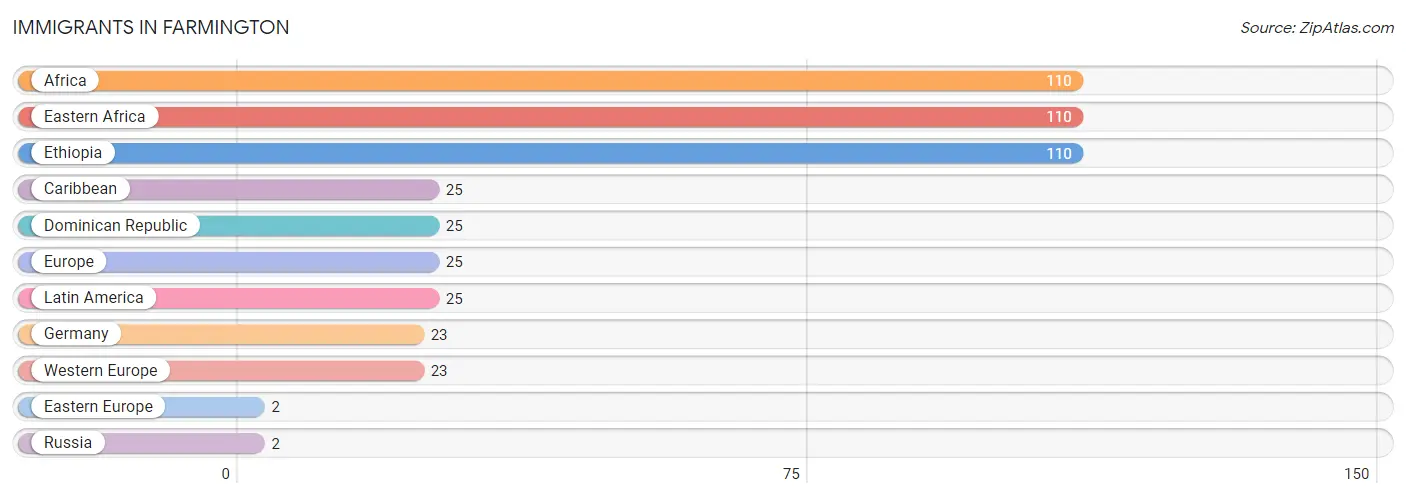
The most numerous immigrant groups reported in Farmington came from Africa (110 | 3.0%), Eastern Africa (110 | 3.0%), Ethiopia (110 | 3.0%), Caribbean (25 | 0.7%), and Dominican Republic (25 | 0.7%), together accounting for 10.2% of all Farmington residents.
| Immigration Origin | # Population | % Population |
| Africa | 110 | 3.0% |
| Caribbean | 25 | 0.7% |
| Dominican Republic | 25 | 0.7% |
| Eastern Africa | 110 | 3.0% |
| Eastern Europe | 2 | 0.1% |
| Ethiopia | 110 | 3.0% |
| Europe | 25 | 0.7% |
| Germany | 23 | 0.6% |
| Latin America | 25 | 0.7% |
| Russia | 2 | 0.1% |
| Western Europe | 23 | 0.6% | View All 11 Rows |
Sex and Age in Farmington
Sex and Age in Farmington
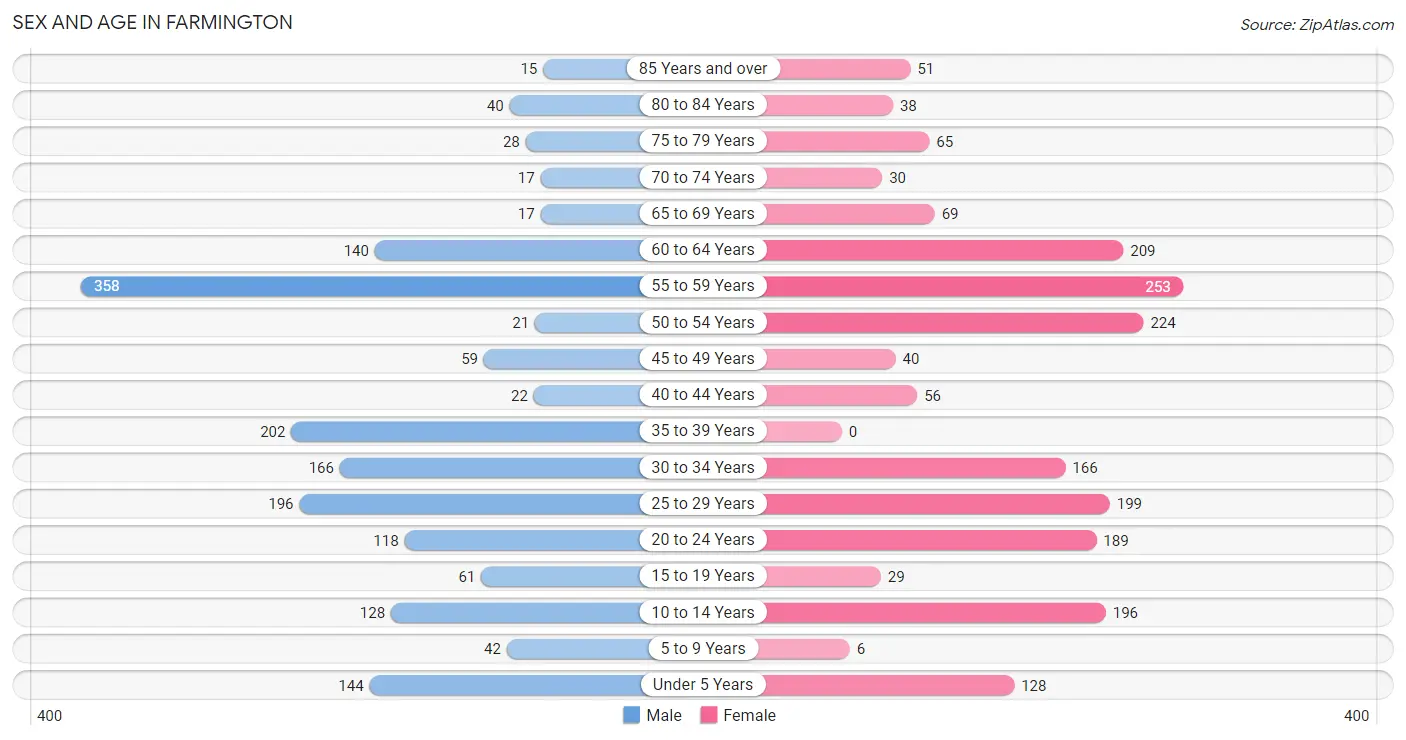
The most populous age groups in Farmington are 55 to 59 Years (358 | 20.2%) for men and 55 to 59 Years (253 | 13.0%) for women.
| Age Bracket | Male | Female |
| Under 5 Years | 144 (8.1%) | 128 (6.6%) |
| 5 to 9 Years | 42 (2.4%) | 6 (0.3%) |
| 10 to 14 Years | 128 (7.2%) | 196 (10.1%) |
| 15 to 19 Years | 61 (3.4%) | 29 (1.5%) |
| 20 to 24 Years | 118 (6.7%) | 189 (9.7%) |
| 25 to 29 Years | 196 (11.1%) | 199 (10.2%) |
| 30 to 34 Years | 166 (9.4%) | 166 (8.5%) |
| 35 to 39 Years | 202 (11.4%) | 0 (0.0%) |
| 40 to 44 Years | 22 (1.2%) | 56 (2.9%) |
| 45 to 49 Years | 59 (3.3%) | 40 (2.1%) |
| 50 to 54 Years | 21 (1.2%) | 224 (11.5%) |
| 55 to 59 Years | 358 (20.2%) | 253 (13.0%) |
| 60 to 64 Years | 140 (7.9%) | 209 (10.7%) |
| 65 to 69 Years | 17 (1.0%) | 69 (3.5%) |
| 70 to 74 Years | 17 (1.0%) | 30 (1.5%) |
| 75 to 79 Years | 28 (1.6%) | 65 (3.3%) |
| 80 to 84 Years | 40 (2.2%) | 38 (1.9%) |
| 85 Years and over | 15 (0.9%) | 51 (2.6%) |
| Total | 1,774 (100.0%) | 1,948 (100.0%) |
Families and Households in Farmington
Median Family Size in Farmington
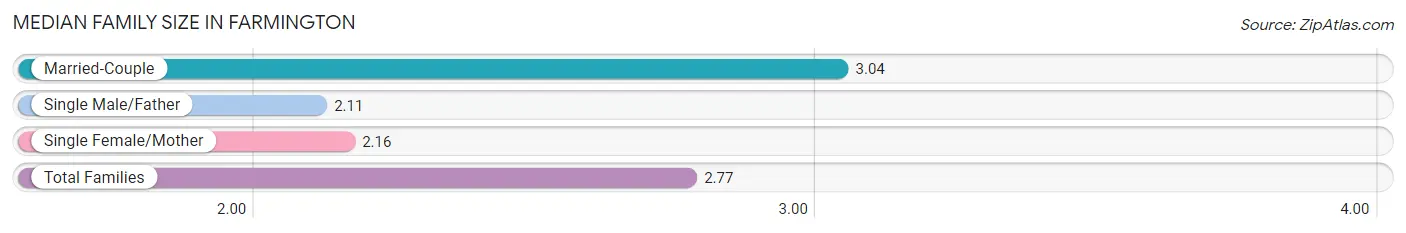
The median family size in Farmington is 2.77 persons per family, with married-couple families (702 | 70.4%) accounting for the largest median family size of 3.04 persons per family. On the other hand, single male/father families (201 | 20.2%) represent the smallest median family size with 2.11 persons per family.
| Family Type | # Families | Family Size |
| Married-Couple | 702 (70.4%) | 3.04 |
| Single Male/Father | 201 (20.2%) | 2.11 |
| Single Female/Mother | 94 (9.4%) | 2.16 |
| Total Families | 997 (100.0%) | 2.77 |
Median Household Size in Farmington
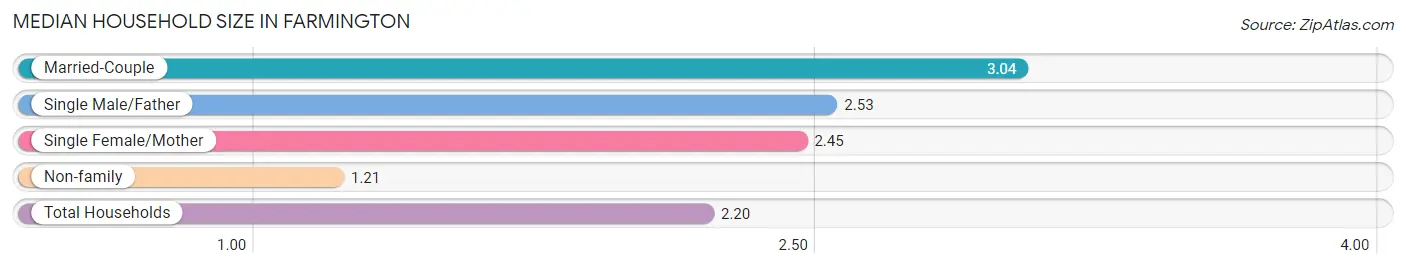
The median household size in Farmington is 2.20 persons per household, with married-couple households (702 | 41.6%) accounting for the largest median household size of 3.04 persons per household. non-family households (692 | 41.0%) represent the smallest median household size with 1.21 persons per household.
| Household Type | # Households | Household Size |
| Married-Couple | 702 (41.6%) | 3.04 |
| Single Male/Father | 201 (11.9%) | 2.53 |
| Single Female/Mother | 94 (5.6%) | 2.45 |
| Non-family | 692 (41.0%) | 1.21 |
| Total Households | 1,689 (100.0%) | 2.20 |
Household Size by Marriage Status in Farmington
Out of a total of 1,689 households in Farmington, 997 (59.0%) are family households, while 692 (41.0%) are nonfamily households. The most numerous type of family households are 2-person households, comprising 505, and the most common type of nonfamily households are 1-person households, comprising 555.
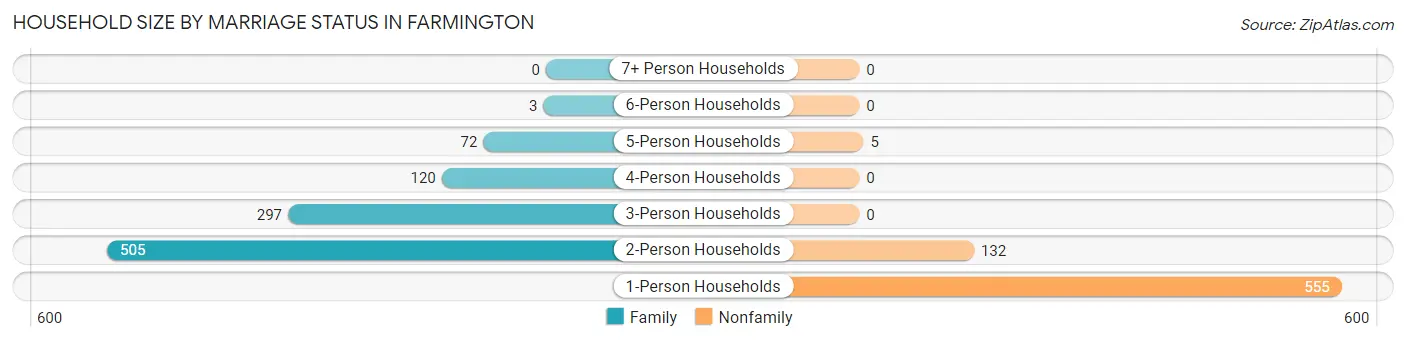
| Household Size | Family Households | Nonfamily Households |
| 1-Person Households | - | 555 (32.9%) |
| 2-Person Households | 505 (29.9%) | 132 (7.8%) |
| 3-Person Households | 297 (17.6%) | 0 (0.0%) |
| 4-Person Households | 120 (7.1%) | 0 (0.0%) |
| 5-Person Households | 72 (4.3%) | 5 (0.3%) |
| 6-Person Households | 3 (0.2%) | 0 (0.0%) |
| 7+ Person Households | 0 (0.0%) | 0 (0.0%) |
| Total | 997 (59.0%) | 692 (41.0%) |
Female Fertility in Farmington
Fertility by Age in Farmington
Average fertility rate in Farmington is 20.0 births per 1,000 women. Women in the age bracket of 20 to 34 years have the highest fertility rate with 29.0 births per 1,000 women. Women in the age bracket of 20 to 34 years acount for 100.0% of all women with births.
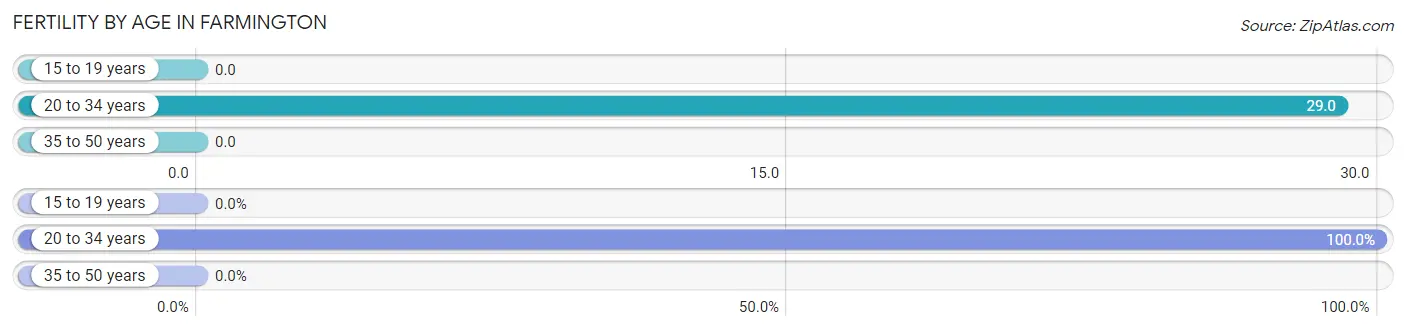
| Age Bracket | Women with Births | Births / 1,000 Women |
| 15 to 19 years | 0 (0.0%) | 0.0 |
| 20 to 34 years | 16 (100.0%) | 29.0 |
| 35 to 50 years | 0 (0.0%) | 0.0 |
| Total | 16 (100.0%) | 20.0 |
Fertility by Age by Marriage Status in Farmington
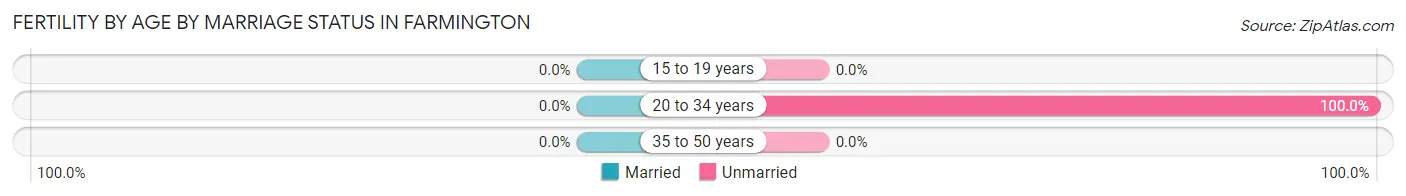
| Age Bracket | Married | Unmarried |
| 15 to 19 years | 0 (0.0%) | 0 (0.0%) |
| 20 to 34 years | 0 (0.0%) | 16 (100.0%) |
| 35 to 50 years | 0 (0.0%) | 0 (0.0%) |
| Total | 0 (0.0%) | 16 (100.0%) |
Fertility by Education in Farmington
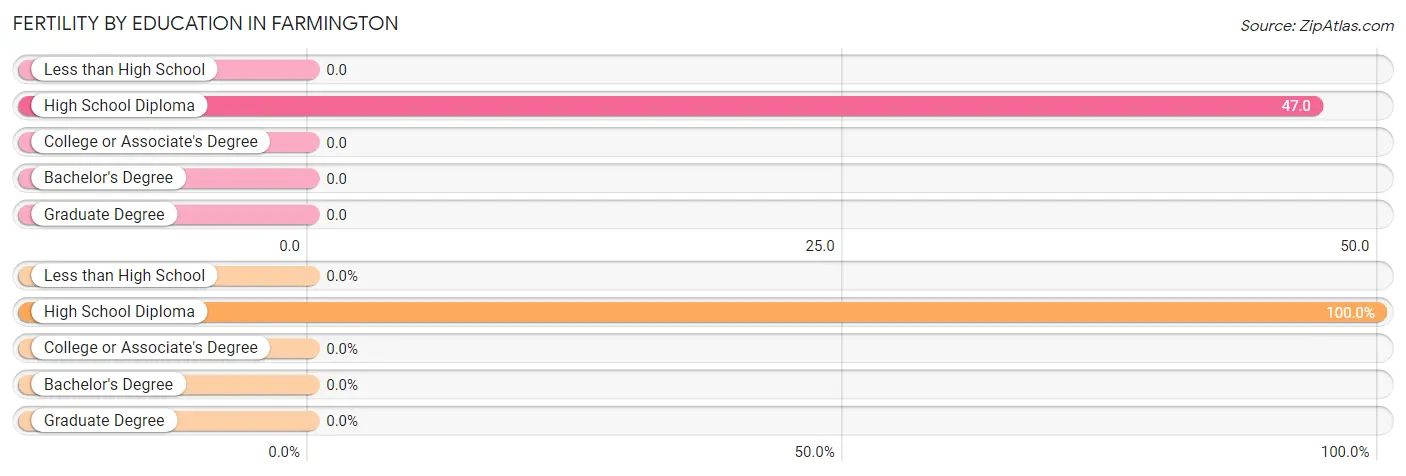
| Educational Attainment | Women with Births | Births / 1,000 Women |
| Less than High School | 0 (0.0%) | 0.0 |
| High School Diploma | 16 (100.0%) | 47.0 |
| College or Associate's Degree | 0 (0.0%) | 0.0 |
| Bachelor's Degree | 0 (0.0%) | 0.0 |
| Graduate Degree | 0 (0.0%) | 0.0 |
| Total | 16 (100.0%) | 20.0 |
Fertility by Education by Marriage Status in Farmington
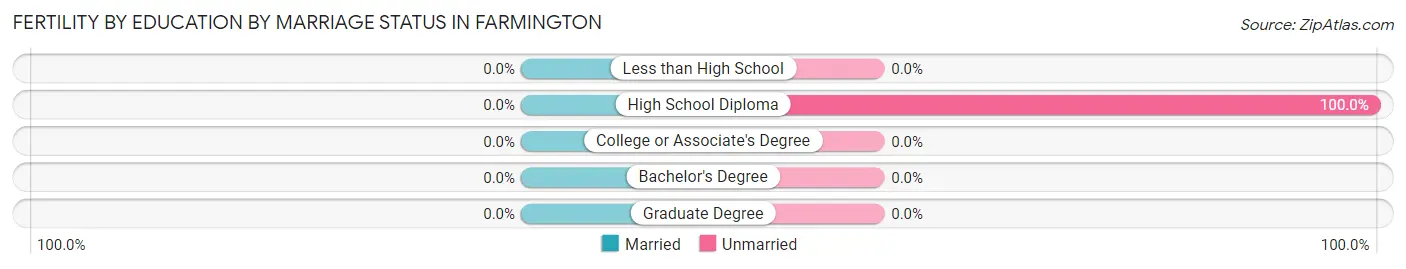
| Educational Attainment | Married | Unmarried |
| Less than High School | 0 (0.0%) | 0 (0.0%) |
| High School Diploma | 0 (0.0%) | 16 (100.0%) |
| College or Associate's Degree | 0 (0.0%) | 0 (0.0%) |
| Bachelor's Degree | 0 (0.0%) | 0 (0.0%) |
| Graduate Degree | 0 (0.0%) | 0 (0.0%) |
| Total | 0 (0.0%) | 16 (100.0%) |
Employment Characteristics in Farmington
Employment by Class of Employer in Farmington
Among the 1,952 employed individuals in Farmington, private company employees (1,348 | 69.1%), self-employed (not incorporated) (191 | 9.8%), and local government employees (188 | 9.6%) make up the most common classes of employment.
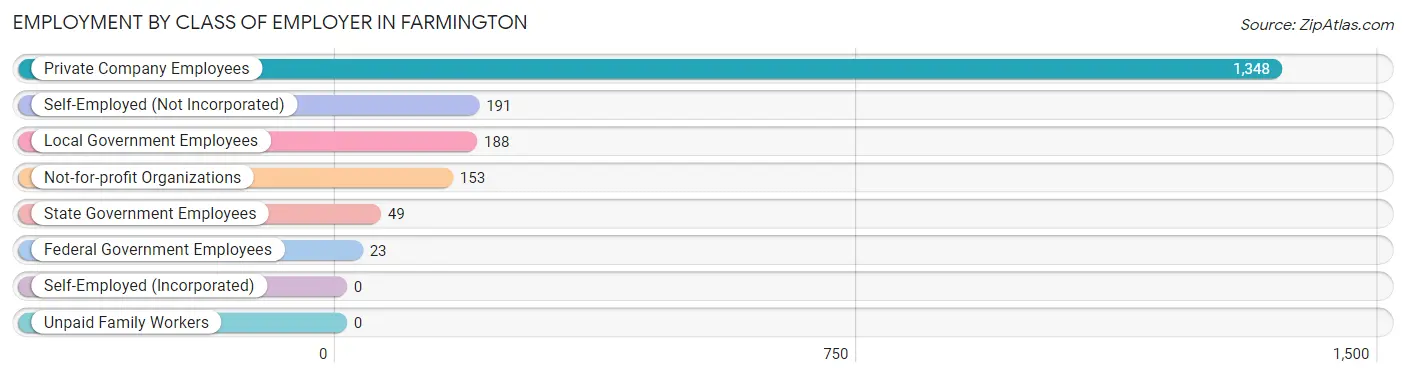
| Employer Class | # Employees | % Employees |
| Private Company Employees | 1,348 | 69.1% |
| Self-Employed (Incorporated) | 0 | 0.0% |
| Self-Employed (Not Incorporated) | 191 | 9.8% |
| Not-for-profit Organizations | 153 | 7.8% |
| Local Government Employees | 188 | 9.6% |
| State Government Employees | 49 | 2.5% |
| Federal Government Employees | 23 | 1.2% |
| Unpaid Family Workers | 0 | 0.0% |
| Total | 1,952 | 100.0% |
Employment Status by Age in Farmington
According to the labor force statistics for Farmington, out of the total population over 16 years of age (3,053), 68.6% or 2,094 individuals are in the labor force, with 4.3% or 90 of them unemployed. The age group with the highest labor force participation rate is 20 to 24 years, with 97.4% or 299 individuals in the labor force. Within the labor force, the 25 to 29 years age range has the highest percentage of unemployed individuals, with 11.6% or 32 of them being unemployed.
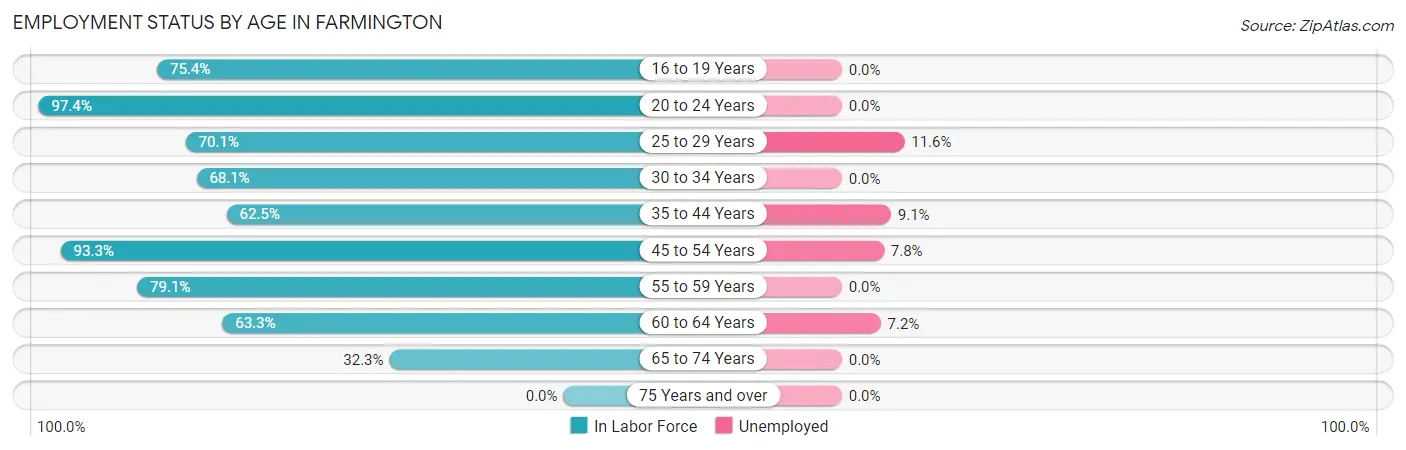
| Age Bracket | In Labor Force | Unemployed |
| 16 to 19 Years | 49 (75.4%) | 0 (0.0%) |
| 20 to 24 Years | 299 (97.4%) | 0 (0.0%) |
| 25 to 29 Years | 277 (70.1%) | 32 (11.6%) |
| 30 to 34 Years | 226 (68.1%) | 0 (0.0%) |
| 35 to 44 Years | 175 (62.5%) | 16 (9.1%) |
| 45 to 54 Years | 321 (93.3%) | 25 (7.8%) |
| 55 to 59 Years | 483 (79.1%) | 0 (0.0%) |
| 60 to 64 Years | 221 (63.3%) | 16 (7.2%) |
| 65 to 74 Years | 43 (32.3%) | 0 (0.0%) |
| 75 Years and over | 0 (0.0%) | 0 (0.0%) |
| Total | 2,094 (68.6%) | 90 (4.3%) |
Employment Status by Educational Attainment in Farmington
According to labor force statistics for Farmington, 73.7% of individuals (1,703) out of the total population between 25 and 64 years of age (2,311) are in the labor force, with 5.2% or 89 of them being unemployed. The group with the highest labor force participation rate are those with the educational attainment of bachelor's degree or higher, with 79.5% or 198 individuals in the labor force. Within the labor force, individuals with less than high school education have the highest percentage of unemployment, with 9.4% or 16 of them being unemployed.
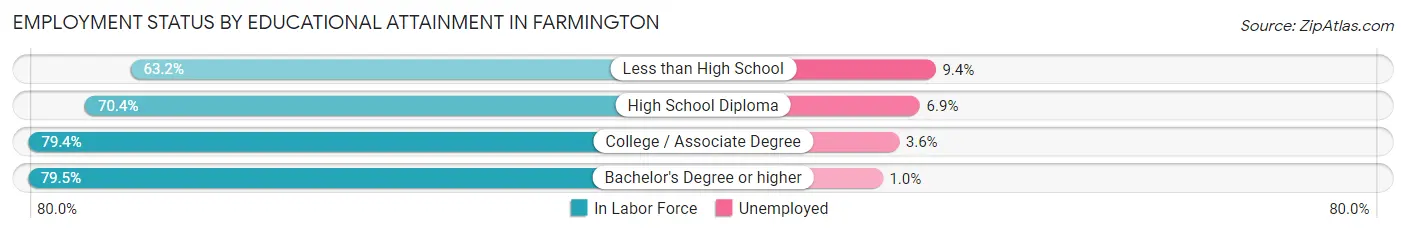
| Educational Attainment | In Labor Force | Unemployed |
| Less than High School | 170 (63.2%) | 25 (9.4%) |
| High School Diploma | 694 (70.4%) | 68 (6.9%) |
| College / Associate Degree | 641 (79.4%) | 29 (3.6%) |
| Bachelor's Degree or higher | 198 (79.5%) | 2 (1.0%) |
| Total | 1,703 (73.7%) | 120 (5.2%) |
Employment Occupations by Sex in Farmington
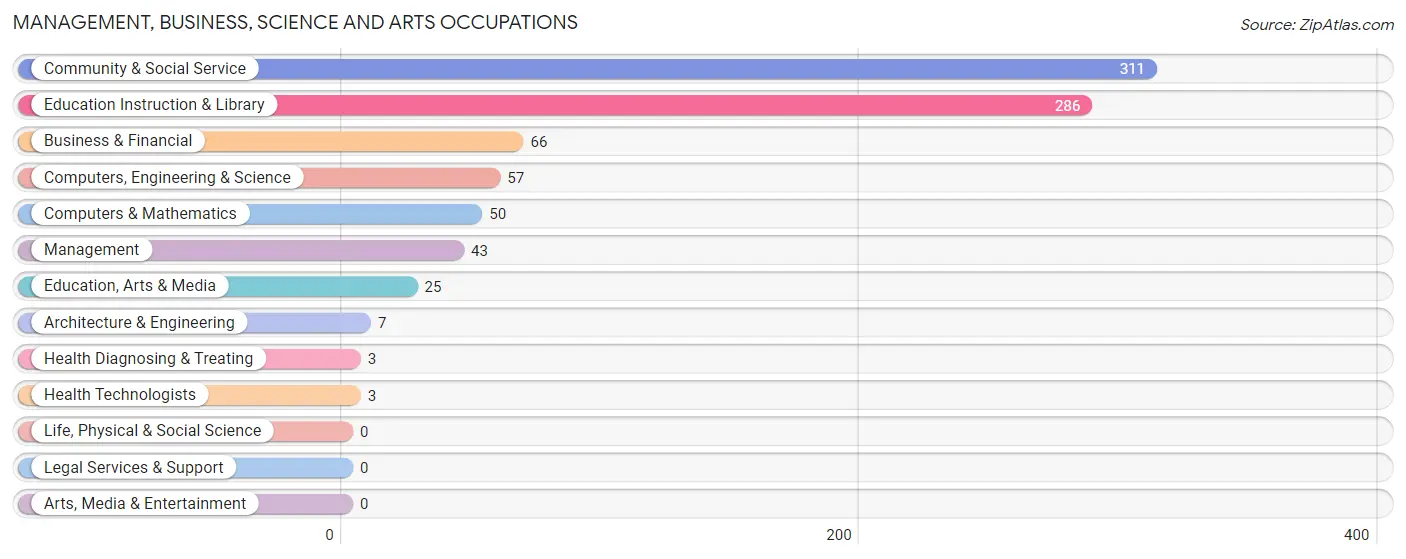
Management, Business, Science and Arts Occupations
The most common Management, Business, Science and Arts occupations in Farmington are Community & Social Service (311 | 15.5%), Education Instruction & Library (286 | 14.3%), Business & Financial (66 | 3.3%), Computers, Engineering & Science (57 | 2.8%), and Computers & Mathematics (50 | 2.5%).
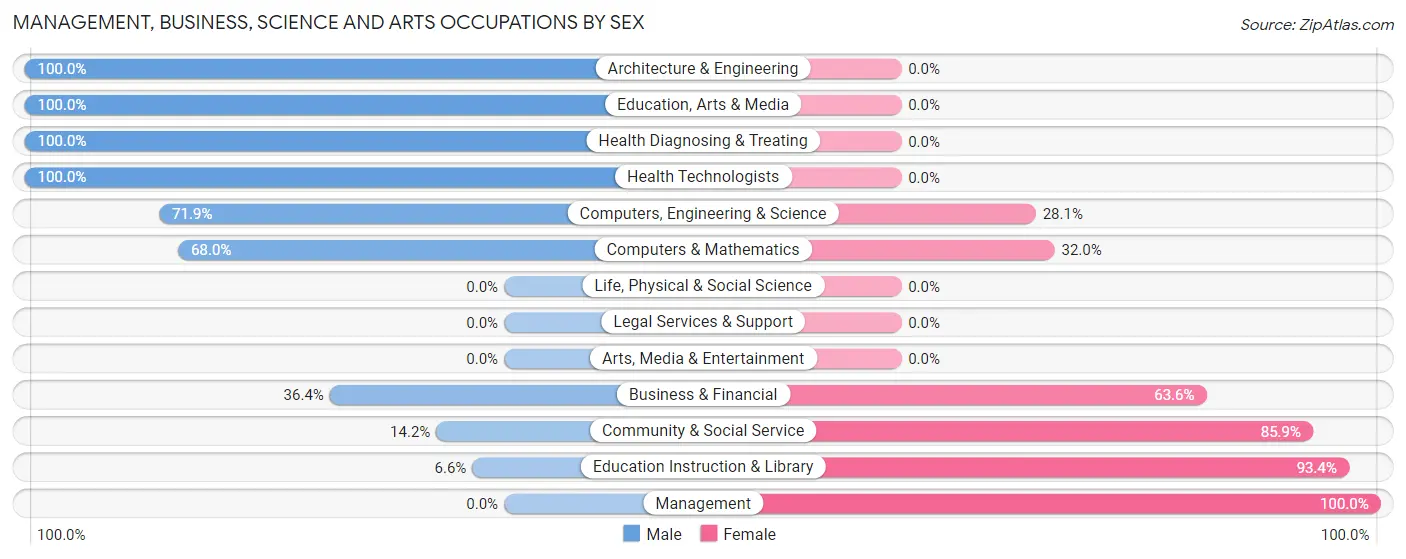
Management, Business, Science and Arts Occupations by Sex
Within the Management, Business, Science and Arts occupations in Farmington, the most male-oriented occupations are Architecture & Engineering (100.0%), Education, Arts & Media (100.0%), and Health Diagnosing & Treating (100.0%), while the most female-oriented occupations are Management (100.0%), Education Instruction & Library (93.4%), and Community & Social Service (85.9%).
| Occupation | Male | Female |
| Management | 0 (0.0%) | 43 (100.0%) |
| Business & Financial | 24 (36.4%) | 42 (63.6%) |
| Computers, Engineering & Science | 41 (71.9%) | 16 (28.1%) |
| Computers & Mathematics | 34 (68.0%) | 16 (32.0%) |
| Architecture & Engineering | 7 (100.0%) | 0 (0.0%) |
| Life, Physical & Social Science | 0 (0.0%) | 0 (0.0%) |
| Community & Social Service | 44 (14.1%) | 267 (85.9%) |
| Education, Arts & Media | 25 (100.0%) | 0 (0.0%) |
| Legal Services & Support | 0 (0.0%) | 0 (0.0%) |
| Education Instruction & Library | 19 (6.6%) | 267 (93.4%) |
| Arts, Media & Entertainment | 0 (0.0%) | 0 (0.0%) |
| Health Diagnosing & Treating | 3 (100.0%) | 0 (0.0%) |
| Health Technologists | 3 (100.0%) | 0 (0.0%) |
| Total (Category) | 112 (23.3%) | 368 (76.7%) |
| Total (Overall) | 1,023 (51.0%) | 982 (49.0%) |
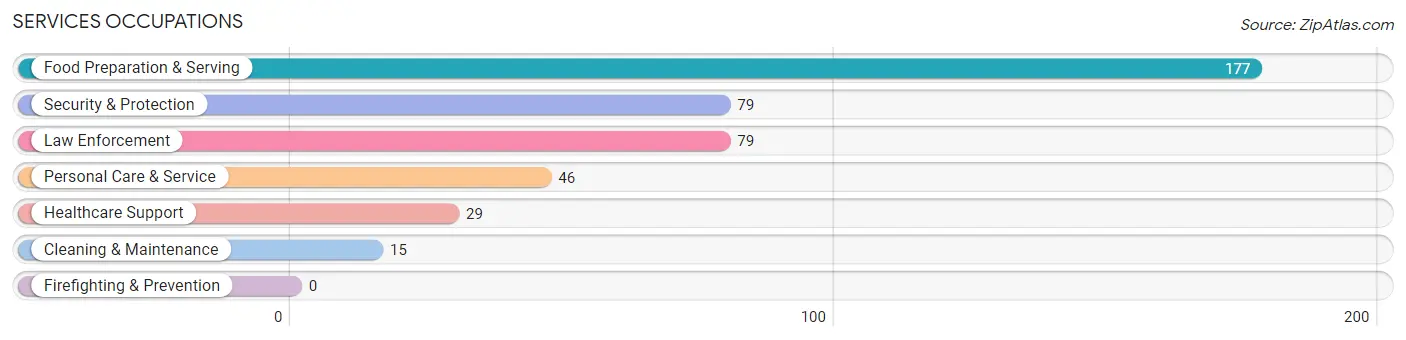
Services Occupations
The most common Services occupations in Farmington are Food Preparation & Serving (177 | 8.8%), Security & Protection (79 | 3.9%), Law Enforcement (79 | 3.9%), Personal Care & Service (46 | 2.3%), and Healthcare Support (29 | 1.5%).
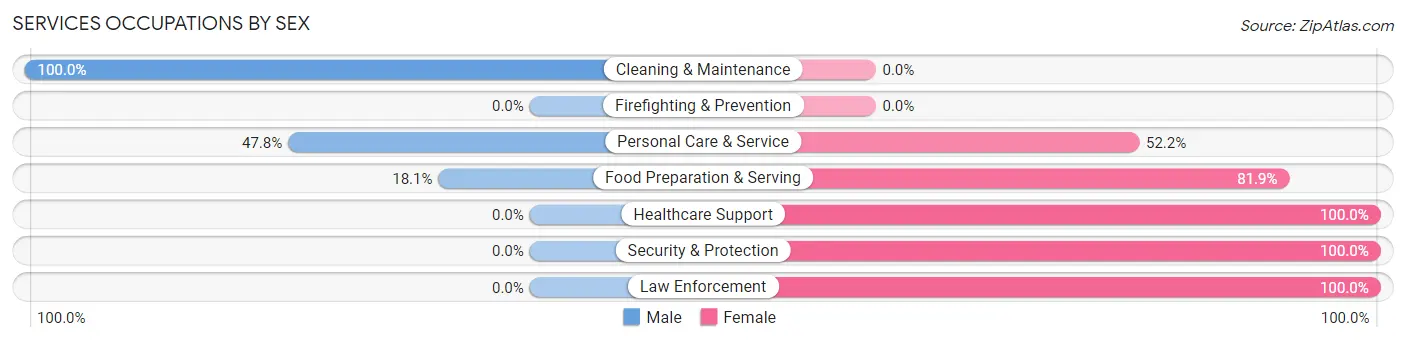
Services Occupations by Sex
Within the Services occupations in Farmington, the most male-oriented occupations are Cleaning & Maintenance (100.0%), Personal Care & Service (47.8%), and Food Preparation & Serving (18.1%), while the most female-oriented occupations are Healthcare Support (100.0%), Security & Protection (100.0%), and Law Enforcement (100.0%).
| Occupation | Male | Female |
| Healthcare Support | 0 (0.0%) | 29 (100.0%) |
| Security & Protection | 0 (0.0%) | 79 (100.0%) |
| Firefighting & Prevention | 0 (0.0%) | 0 (0.0%) |
| Law Enforcement | 0 (0.0%) | 79 (100.0%) |
| Food Preparation & Serving | 32 (18.1%) | 145 (81.9%) |
| Cleaning & Maintenance | 15 (100.0%) | 0 (0.0%) |
| Personal Care & Service | 22 (47.8%) | 24 (52.2%) |
| Total (Category) | 69 (19.9%) | 277 (80.1%) |
| Total (Overall) | 1,023 (51.0%) | 982 (49.0%) |
Sales and Office Occupations
The most common Sales and Office occupations in Farmington are Office & Administration (206 | 10.3%), and Sales & Related (148 | 7.4%).
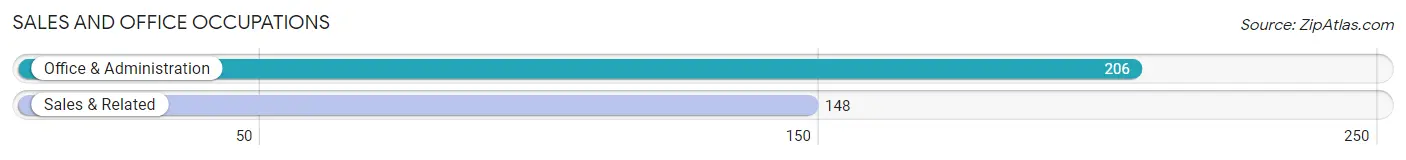
Sales and Office Occupations by Sex
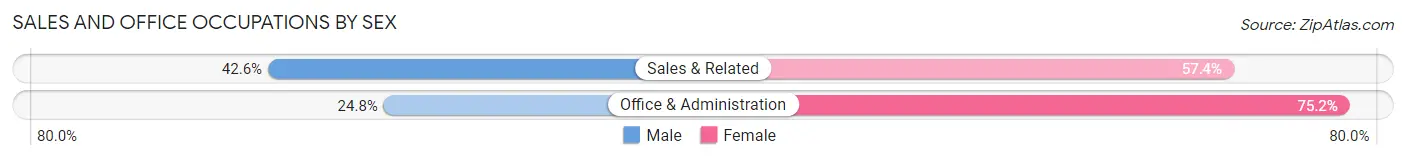
| Occupation | Male | Female |
| Sales & Related | 63 (42.6%) | 85 (57.4%) |
| Office & Administration | 51 (24.8%) | 155 (75.2%) |
| Total (Category) | 114 (32.2%) | 240 (67.8%) |
| Total (Overall) | 1,023 (51.0%) | 982 (49.0%) |
Natural Resources, Construction and Maintenance Occupations
The most common Natural Resources, Construction and Maintenance occupations in Farmington are Construction & Extraction (257 | 12.8%), and Installation, Maintenance & Repair (34 | 1.7%).
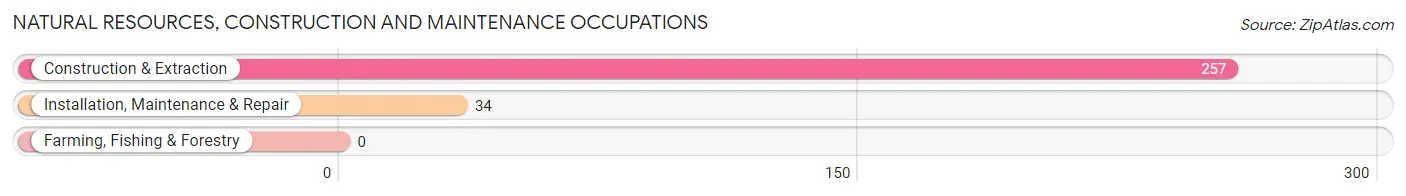
Natural Resources, Construction and Maintenance Occupations by Sex

| Occupation | Male | Female |
| Farming, Fishing & Forestry | 0 (0.0%) | 0 (0.0%) |
| Construction & Extraction | 257 (100.0%) | 0 (0.0%) |
| Installation, Maintenance & Repair | 34 (100.0%) | 0 (0.0%) |
| Total (Category) | 291 (100.0%) | 0 (0.0%) |
| Total (Overall) | 1,023 (51.0%) | 982 (49.0%) |
Production, Transportation and Moving Occupations
The most common Production, Transportation and Moving occupations in Farmington are Production (286 | 14.3%), Material Moving (132 | 6.6%), and Transportation (116 | 5.8%).
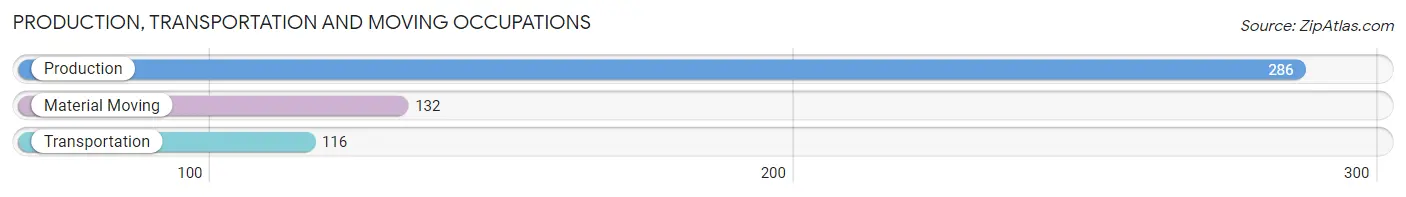
Production, Transportation and Moving Occupations by Sex
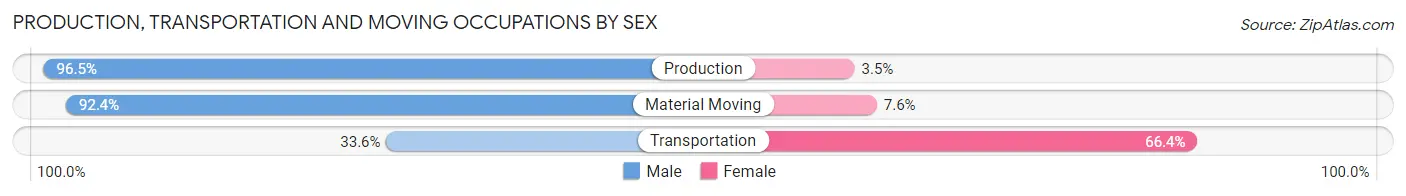
| Occupation | Male | Female |
| Production | 276 (96.5%) | 10 (3.5%) |
| Transportation | 39 (33.6%) | 77 (66.4%) |
| Material Moving | 122 (92.4%) | 10 (7.6%) |
| Total (Category) | 437 (81.8%) | 97 (18.2%) |
| Total (Overall) | 1,023 (51.0%) | 982 (49.0%) |
Employment Industries by Sex in Farmington
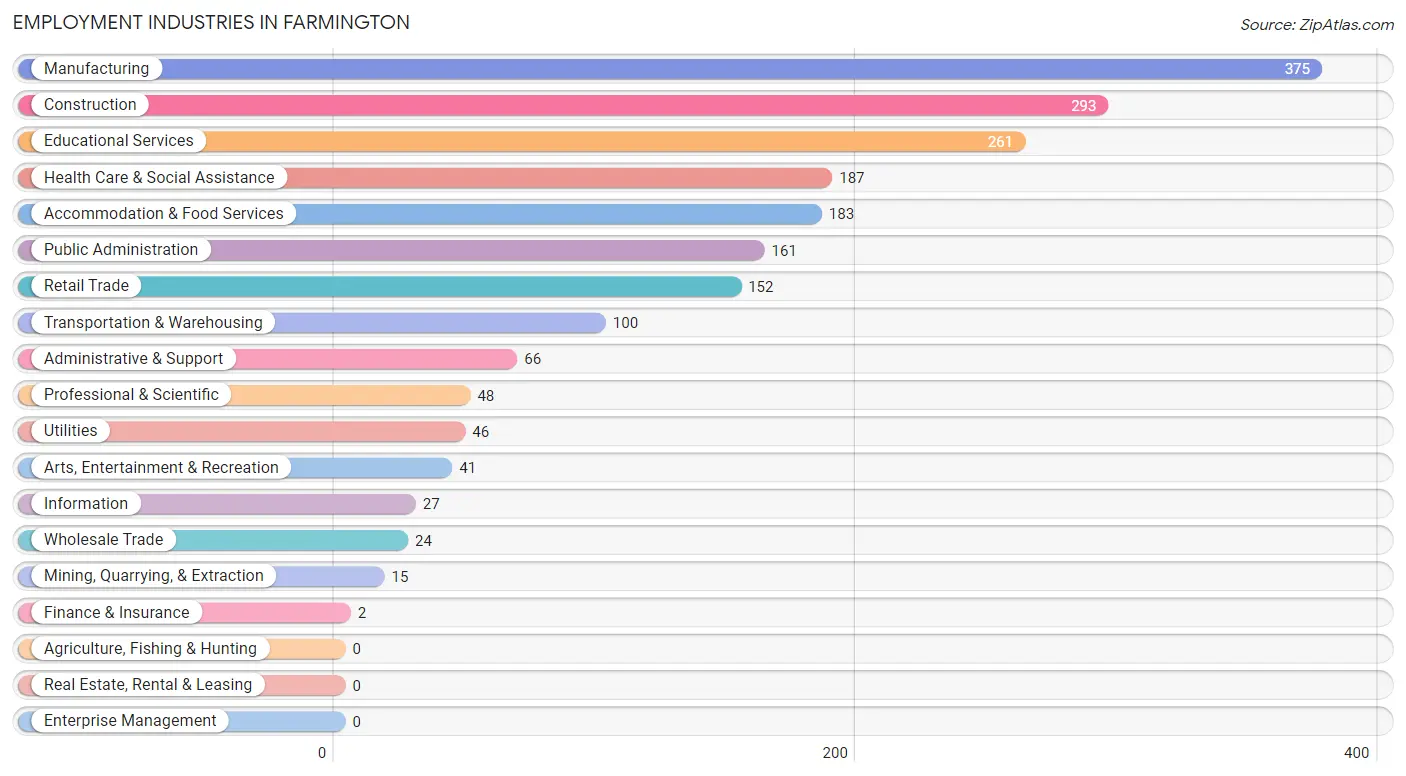
Employment Industries in Farmington
The major employment industries in Farmington include Manufacturing (375 | 18.7%), Construction (293 | 14.6%), Educational Services (261 | 13.0%), Health Care & Social Assistance (187 | 9.3%), and Accommodation & Food Services (183 | 9.1%).
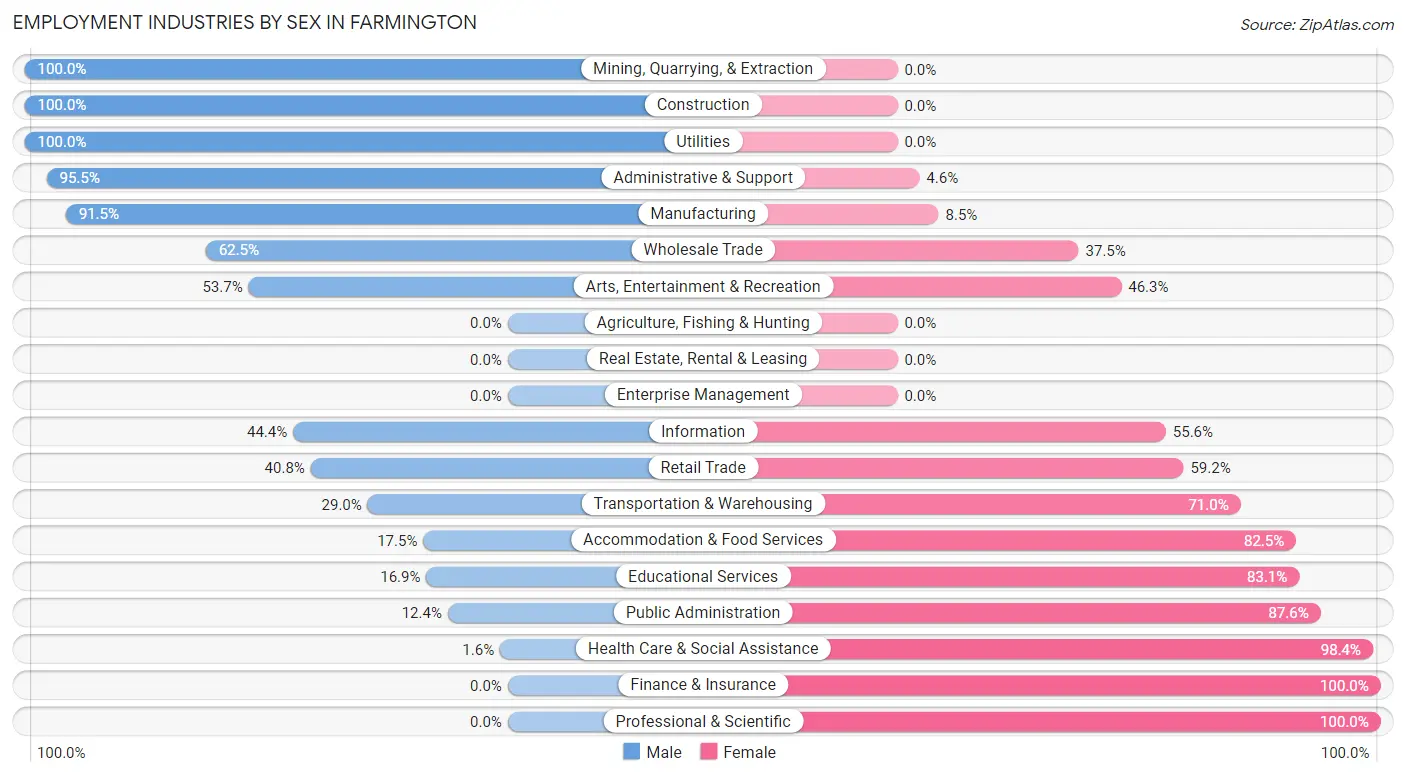
Employment Industries by Sex in Farmington
The Farmington industries that see more men than women are Mining, Quarrying, & Extraction (100.0%), Construction (100.0%), and Utilities (100.0%), whereas the industries that tend to have a higher number of women are Finance & Insurance (100.0%), Professional & Scientific (100.0%), and Health Care & Social Assistance (98.4%).
| Industry | Male | Female |
| Agriculture, Fishing & Hunting | 0 (0.0%) | 0 (0.0%) |
| Mining, Quarrying, & Extraction | 15 (100.0%) | 0 (0.0%) |
| Construction | 293 (100.0%) | 0 (0.0%) |
| Manufacturing | 343 (91.5%) | 32 (8.5%) |
| Wholesale Trade | 15 (62.5%) | 9 (37.5%) |
| Retail Trade | 62 (40.8%) | 90 (59.2%) |
| Transportation & Warehousing | 29 (29.0%) | 71 (71.0%) |
| Utilities | 46 (100.0%) | 0 (0.0%) |
| Information | 12 (44.4%) | 15 (55.6%) |
| Finance & Insurance | 0 (0.0%) | 2 (100.0%) |
| Real Estate, Rental & Leasing | 0 (0.0%) | 0 (0.0%) |
| Professional & Scientific | 0 (0.0%) | 48 (100.0%) |
| Enterprise Management | 0 (0.0%) | 0 (0.0%) |
| Administrative & Support | 63 (95.5%) | 3 (4.5%) |
| Educational Services | 44 (16.9%) | 217 (83.1%) |
| Health Care & Social Assistance | 3 (1.6%) | 184 (98.4%) |
| Arts, Entertainment & Recreation | 22 (53.7%) | 19 (46.3%) |
| Accommodation & Food Services | 32 (17.5%) | 151 (82.5%) |
| Public Administration | 20 (12.4%) | 141 (87.6%) |
| Total | 1,023 (51.0%) | 982 (49.0%) |
Education in Farmington
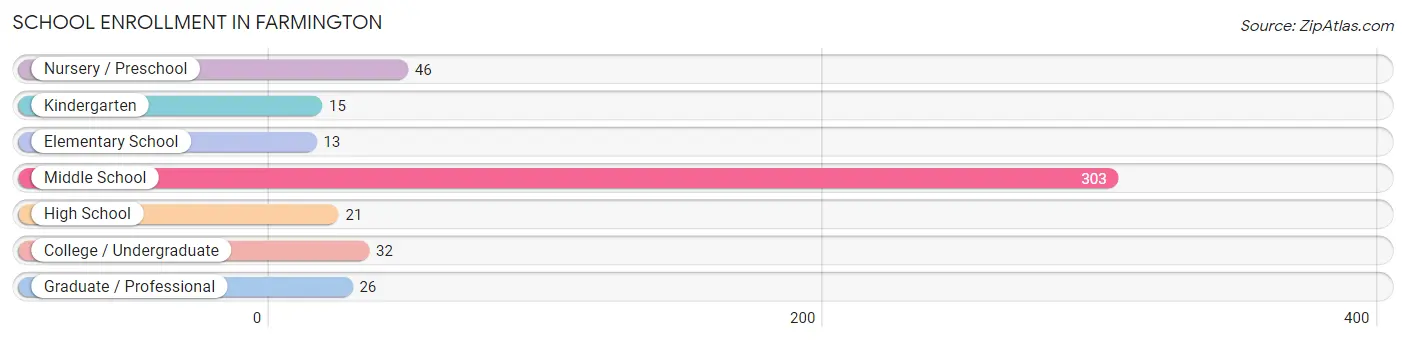
School Enrollment in Farmington
The most common levels of schooling among the 456 students in Farmington are middle school (303 | 66.4%), nursery / preschool (46 | 10.1%), and college / undergraduate (32 | 7.0%).
| School Level | # Students | % Students |
| Nursery / Preschool | 46 | 10.1% |
| Kindergarten | 15 | 3.3% |
| Elementary School | 13 | 2.9% |
| Middle School | 303 | 66.4% |
| High School | 21 | 4.6% |
| College / Undergraduate | 32 | 7.0% |
| Graduate / Professional | 26 | 5.7% |
| Total | 456 | 100.0% |
School Enrollment by Age by Funding Source in Farmington
Out of a total of 456 students who are enrolled in schools in Farmington, 22 (4.8%) attend a private institution, while the remaining 434 (95.2%) are enrolled in public schools. The age group of 5 to 9 year old has the highest likelihood of being enrolled in private schools, with 22 (45.8% in the age bracket) enrolled. Conversely, the age group of 3 to 4 year olds has the lowest likelihood of being enrolled in a private school, with 24 (100.0% in the age bracket) attending a public institution.
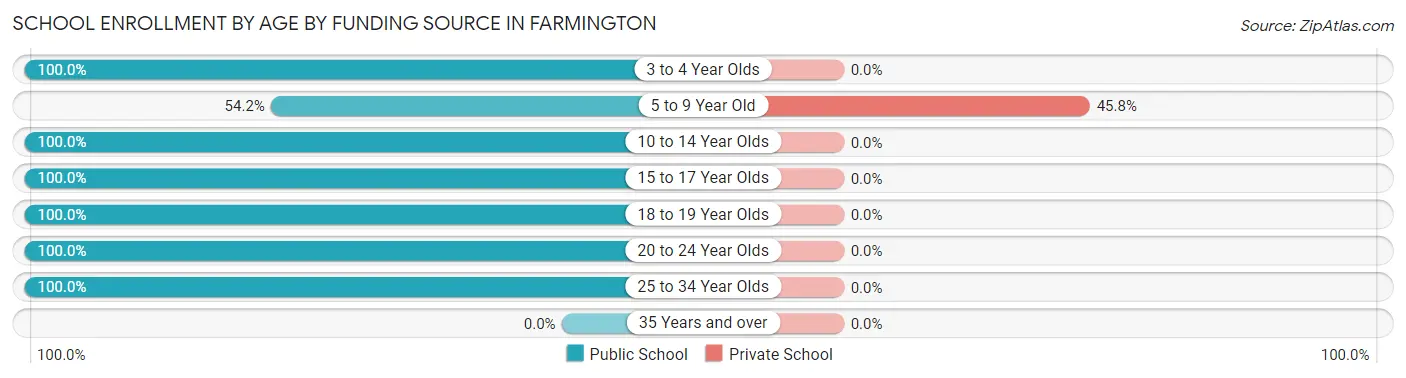
| Age Bracket | Public School | Private School |
| 3 to 4 Year Olds | 24 (100.0%) | 0 (0.0%) |
| 5 to 9 Year Old | 26 (54.2%) | 22 (45.8%) |
| 10 to 14 Year Olds | 305 (100.0%) | 0 (0.0%) |
| 15 to 17 Year Olds | 21 (100.0%) | 0 (0.0%) |
| 18 to 19 Year Olds | 10 (100.0%) | 0 (0.0%) |
| 20 to 24 Year Olds | 22 (100.0%) | 0 (0.0%) |
| 25 to 34 Year Olds | 26 (100.0%) | 0 (0.0%) |
| 35 Years and over | 0 (0.0%) | 0 (0.0%) |
| Total | 434 (95.2%) | 22 (4.8%) |
Educational Attainment by Field of Study in Farmington
Visual & performing arts (72 | 22.2%), literature & languages (57 | 17.6%), social sciences (56 | 17.3%), psychology (26 | 8.0%), and education (22 | 6.8%) are the most common fields of study among 324 individuals in Farmington who have obtained a bachelor's degree or higher.
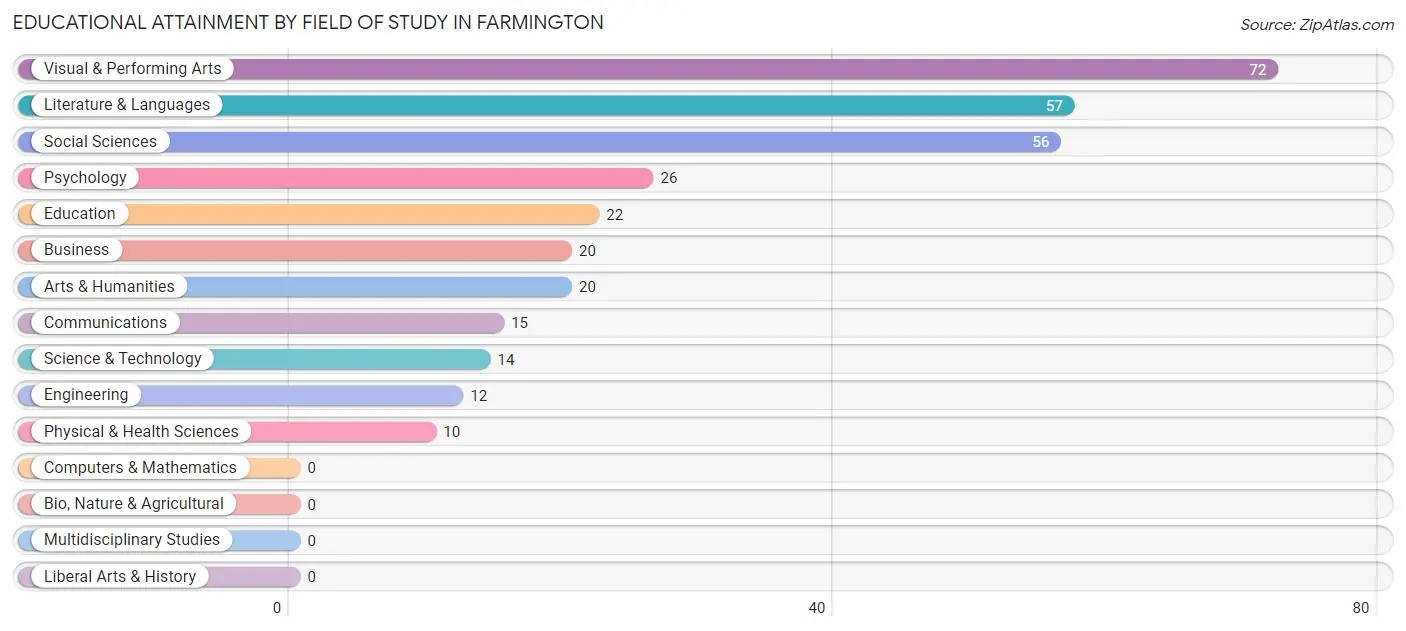
| Field of Study | # Graduates | % Graduates |
| Computers & Mathematics | 0 | 0.0% |
| Bio, Nature & Agricultural | 0 | 0.0% |
| Physical & Health Sciences | 10 | 3.1% |
| Psychology | 26 | 8.0% |
| Social Sciences | 56 | 17.3% |
| Engineering | 12 | 3.7% |
| Multidisciplinary Studies | 0 | 0.0% |
| Science & Technology | 14 | 4.3% |
| Business | 20 | 6.2% |
| Education | 22 | 6.8% |
| Literature & Languages | 57 | 17.6% |
| Liberal Arts & History | 0 | 0.0% |
| Visual & Performing Arts | 72 | 22.2% |
| Communications | 15 | 4.6% |
| Arts & Humanities | 20 | 6.2% |
| Total | 324 | 100.0% |
Transportation & Commute in Farmington
Vehicle Availability by Sex in Farmington
The most prevalent vehicle ownership categories in Farmington are males with 3 vehicles (387, accounting for 38.9%) and females with 3 vehicles (290, making up 40.4%).
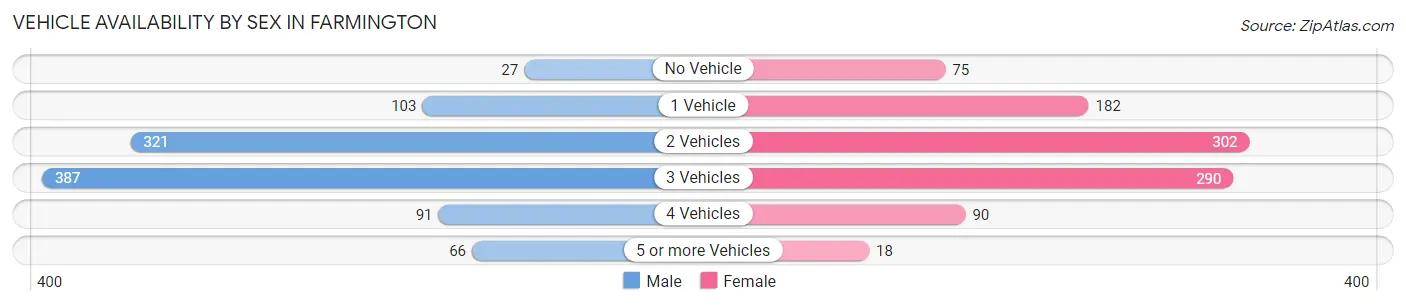
| Vehicles Available | Male | Female |
| No Vehicle | 27 (2.7%) | 75 (7.8%) |
| 1 Vehicle | 103 (10.3%) | 182 (19.0%) |
| 2 Vehicles | 321 (32.3%) | 302 (31.6%) |
| 3 Vehicles | 387 (38.9%) | 290 (30.3%) |
| 4 Vehicles | 91 (9.1%) | 90 (9.4%) |
| 5 or more Vehicles | 66 (6.6%) | 18 (1.9%) |
| Total | 995 (100.0%) | 957 (100.0%) |
Commute Time in Farmington
The most frequently occuring commute durations in Farmington are 30 to 34 minutes (354 commuters, 19.2%), 60 to 89 minutes (270 commuters, 14.6%), and 5 to 9 minutes (263 commuters, 14.3%).
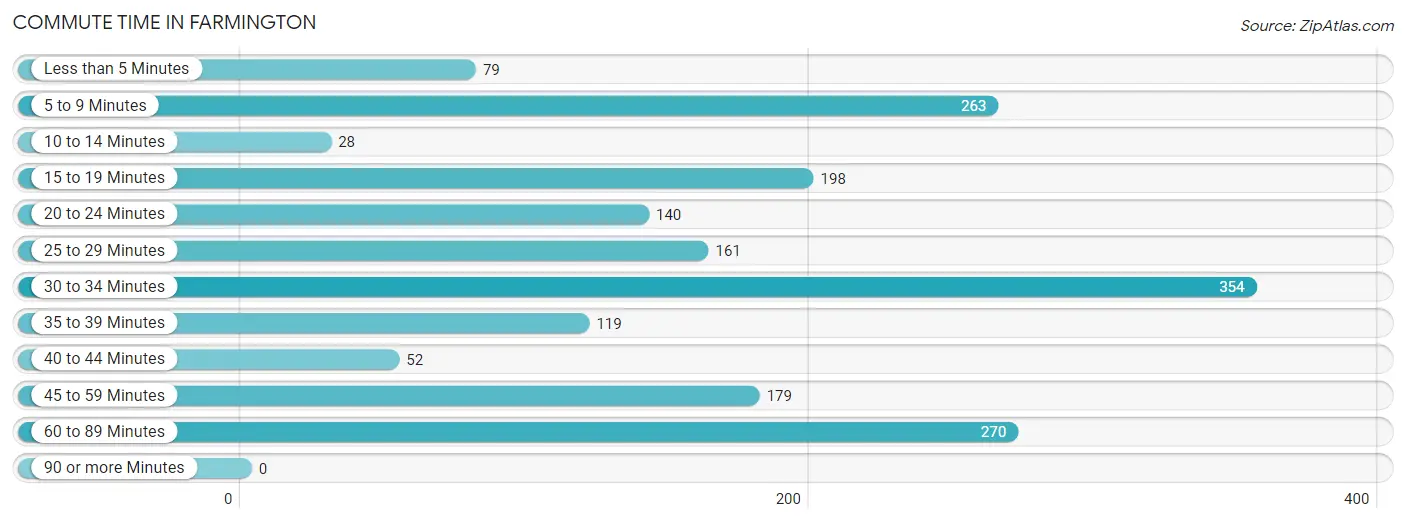
| Commute Time | # Commuters | % Commuters |
| Less than 5 Minutes | 79 | 4.3% |
| 5 to 9 Minutes | 263 | 14.3% |
| 10 to 14 Minutes | 28 | 1.5% |
| 15 to 19 Minutes | 198 | 10.7% |
| 20 to 24 Minutes | 140 | 7.6% |
| 25 to 29 Minutes | 161 | 8.7% |
| 30 to 34 Minutes | 354 | 19.2% |
| 35 to 39 Minutes | 119 | 6.5% |
| 40 to 44 Minutes | 52 | 2.8% |
| 45 to 59 Minutes | 179 | 9.7% |
| 60 to 89 Minutes | 270 | 14.6% |
| 90 or more Minutes | 0 | 0.0% |
Commute Time by Sex in Farmington
The most common commute times in Farmington are 30 to 34 minutes (334 commuters, 36.1%) for males and 5 to 9 minutes (246 commuters, 26.8%) for females.
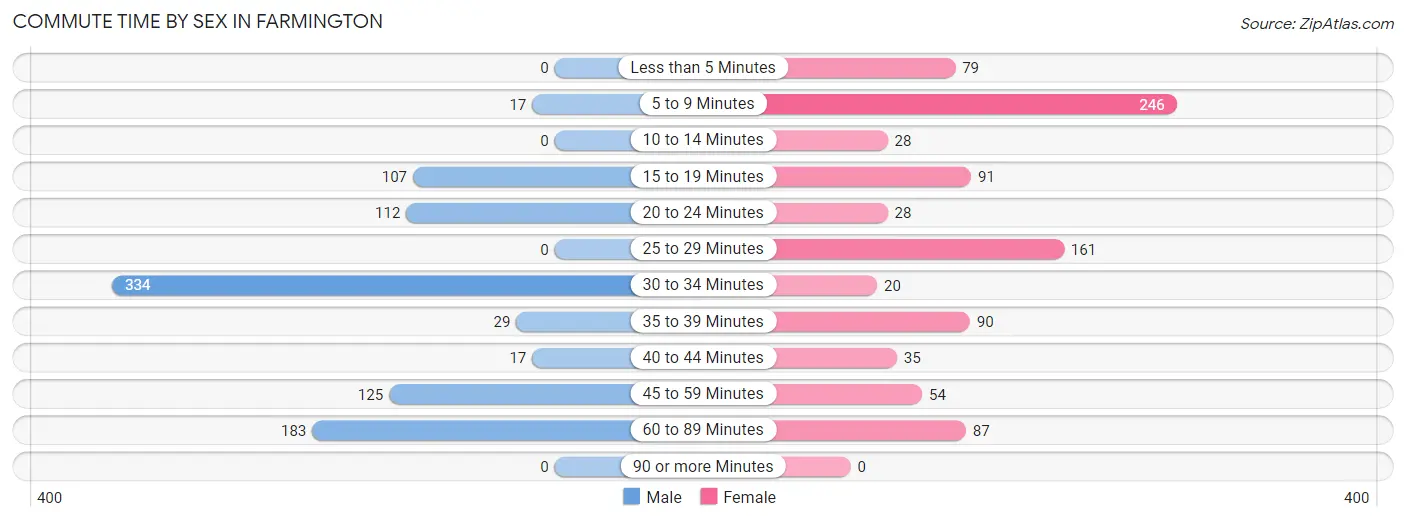
| Commute Time | Male | Female |
| Less than 5 Minutes | 0 (0.0%) | 79 (8.6%) |
| 5 to 9 Minutes | 17 (1.8%) | 246 (26.8%) |
| 10 to 14 Minutes | 0 (0.0%) | 28 (3.0%) |
| 15 to 19 Minutes | 107 (11.6%) | 91 (9.9%) |
| 20 to 24 Minutes | 112 (12.1%) | 28 (3.0%) |
| 25 to 29 Minutes | 0 (0.0%) | 161 (17.5%) |
| 30 to 34 Minutes | 334 (36.1%) | 20 (2.2%) |
| 35 to 39 Minutes | 29 (3.1%) | 90 (9.8%) |
| 40 to 44 Minutes | 17 (1.8%) | 35 (3.8%) |
| 45 to 59 Minutes | 125 (13.5%) | 54 (5.9%) |
| 60 to 89 Minutes | 183 (19.8%) | 87 (9.5%) |
| 90 or more Minutes | 0 (0.0%) | 0 (0.0%) |
Time of Departure to Work by Sex in Farmington
The most frequent times of departure to work in Farmington are 7:00 AM to 7:29 AM (187, 20.2%) for males and 8:00 AM to 8:29 AM (263, 28.6%) for females.
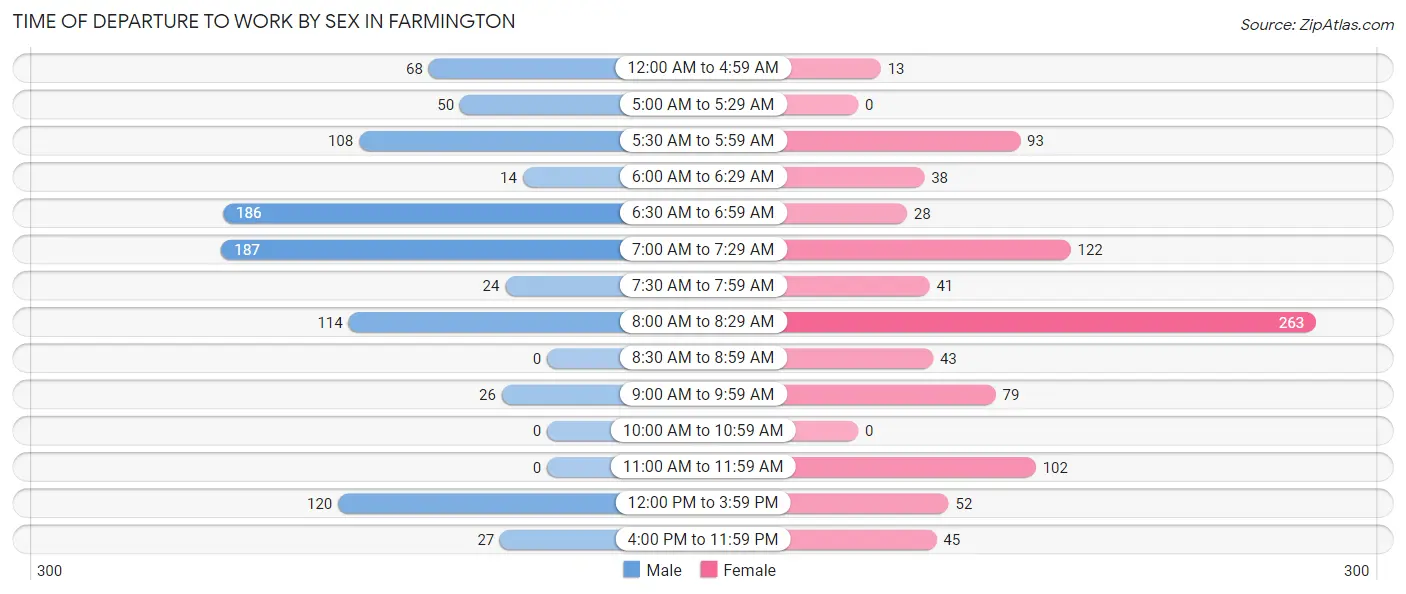
| Time of Departure | Male | Female |
| 12:00 AM to 4:59 AM | 68 (7.4%) | 13 (1.4%) |
| 5:00 AM to 5:29 AM | 50 (5.4%) | 0 (0.0%) |
| 5:30 AM to 5:59 AM | 108 (11.7%) | 93 (10.1%) |
| 6:00 AM to 6:29 AM | 14 (1.5%) | 38 (4.1%) |
| 6:30 AM to 6:59 AM | 186 (20.1%) | 28 (3.0%) |
| 7:00 AM to 7:29 AM | 187 (20.2%) | 122 (13.3%) |
| 7:30 AM to 7:59 AM | 24 (2.6%) | 41 (4.5%) |
| 8:00 AM to 8:29 AM | 114 (12.3%) | 263 (28.6%) |
| 8:30 AM to 8:59 AM | 0 (0.0%) | 43 (4.7%) |
| 9:00 AM to 9:59 AM | 26 (2.8%) | 79 (8.6%) |
| 10:00 AM to 10:59 AM | 0 (0.0%) | 0 (0.0%) |
| 11:00 AM to 11:59 AM | 0 (0.0%) | 102 (11.1%) |
| 12:00 PM to 3:59 PM | 120 (13.0%) | 52 (5.7%) |
| 4:00 PM to 11:59 PM | 27 (2.9%) | 45 (4.9%) |
| Total | 924 (100.0%) | 919 (100.0%) |
Housing Occupancy in Farmington
Occupancy by Ownership in Farmington
Of the total 1,689 dwellings in Farmington, owner-occupied units account for 892 (52.8%), while renter-occupied units make up 797 (47.2%).
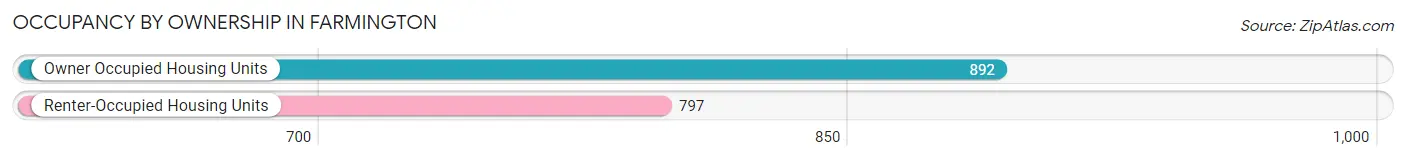
| Occupancy | # Housing Units | % Housing Units |
| Owner Occupied Housing Units | 892 | 52.8% |
| Renter-Occupied Housing Units | 797 | 47.2% |
| Total Occupied Housing Units | 1,689 | 100.0% |
Occupancy by Household Size in Farmington
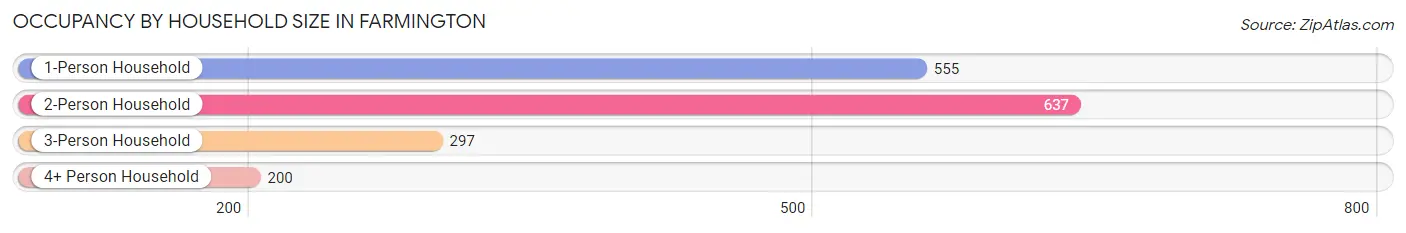
| Household Size | # Housing Units | % Housing Units |
| 1-Person Household | 555 | 32.9% |
| 2-Person Household | 637 | 37.7% |
| 3-Person Household | 297 | 17.6% |
| 4+ Person Household | 200 | 11.8% |
| Total Housing Units | 1,689 | 100.0% |
Occupancy by Ownership by Household Size in Farmington
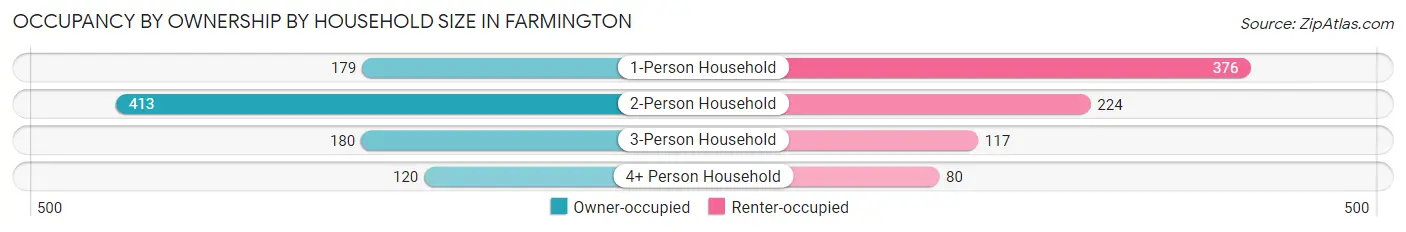
| Household Size | Owner-occupied | Renter-occupied |
| 1-Person Household | 179 (32.3%) | 376 (67.7%) |
| 2-Person Household | 413 (64.8%) | 224 (35.2%) |
| 3-Person Household | 180 (60.6%) | 117 (39.4%) |
| 4+ Person Household | 120 (60.0%) | 80 (40.0%) |
| Total Housing Units | 892 (52.8%) | 797 (47.2%) |
Occupancy by Educational Attainment in Farmington
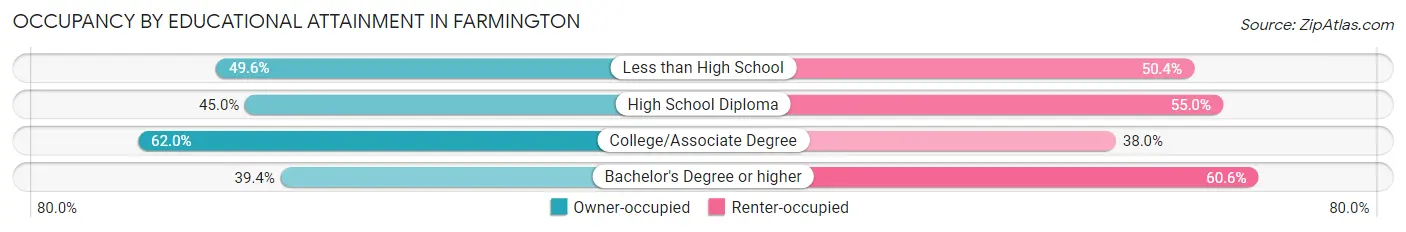
| Household Size | Owner-occupied | Renter-occupied |
| Less than High School | 133 (49.6%) | 135 (50.4%) |
| High School Diploma | 244 (45.0%) | 298 (55.0%) |
| College/Associate Degree | 463 (62.0%) | 284 (38.0%) |
| Bachelor's Degree or higher | 52 (39.4%) | 80 (60.6%) |
Occupancy by Age of Householder in Farmington
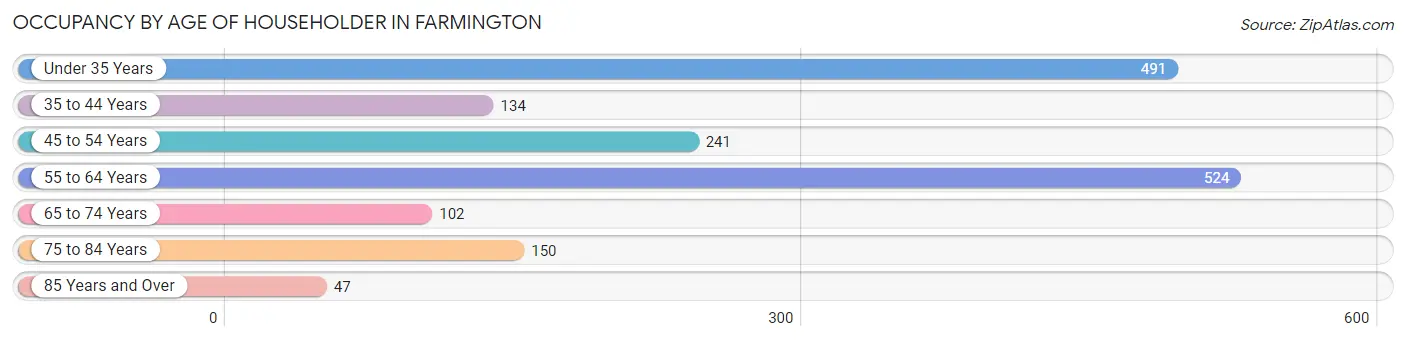
| Age Bracket | # Households | % Households |
| Under 35 Years | 491 | 29.1% |
| 35 to 44 Years | 134 | 7.9% |
| 45 to 54 Years | 241 | 14.3% |
| 55 to 64 Years | 524 | 31.0% |
| 65 to 74 Years | 102 | 6.0% |
| 75 to 84 Years | 150 | 8.9% |
| 85 Years and Over | 47 | 2.8% |
| Total | 1,689 | 100.0% |
Housing Finances in Farmington
Median Income by Occupancy in Farmington
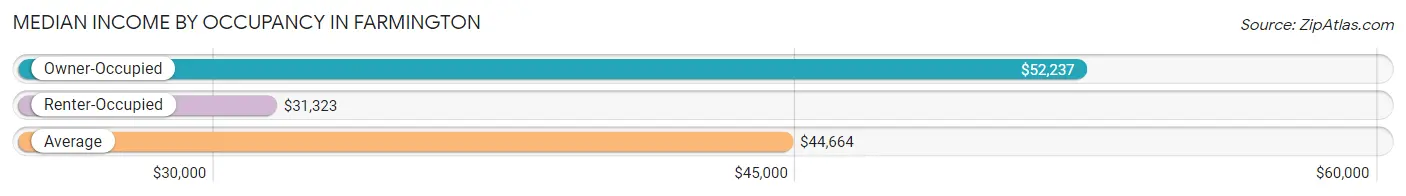
| Occupancy Type | # Households | Median Income |
| Owner-Occupied | 892 (52.8%) | $52,237 |
| Renter-Occupied | 797 (47.2%) | $31,323 |
| Average | 1,689 (100.0%) | $44,664 |
Occupancy by Householder Income Bracket in Farmington
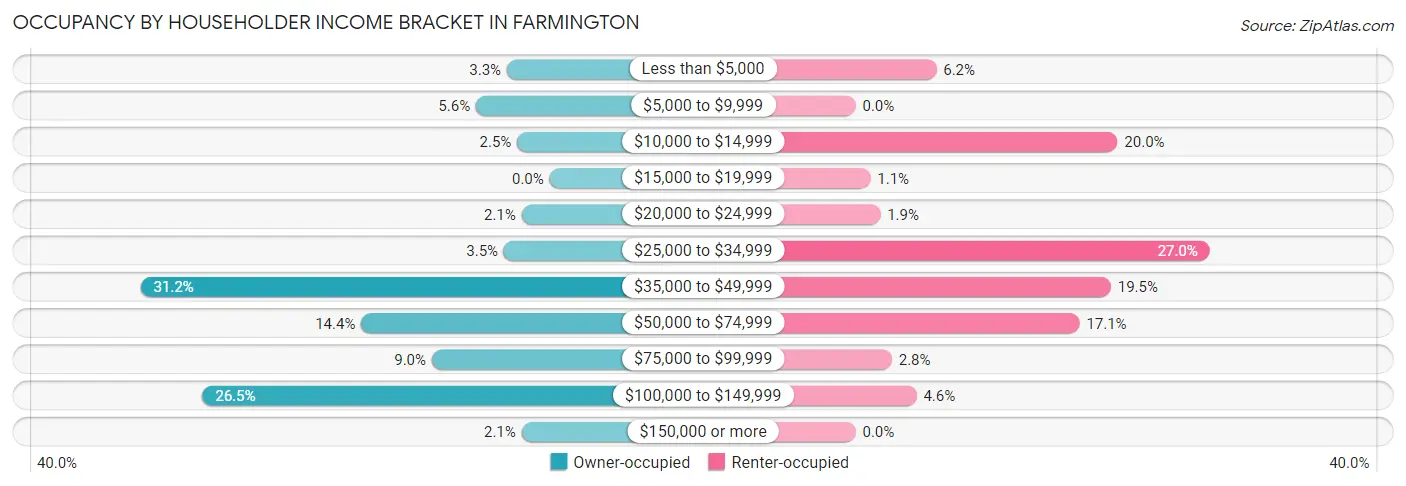
| Income Bracket | Owner-occupied | Renter-occupied |
| Less than $5,000 | 29 (3.3%) | 49 (6.1%) |
| $5,000 to $9,999 | 50 (5.6%) | 0 (0.0%) |
| $10,000 to $14,999 | 22 (2.5%) | 159 (20.0%) |
| $15,000 to $19,999 | 0 (0.0%) | 9 (1.1%) |
| $20,000 to $24,999 | 19 (2.1%) | 15 (1.9%) |
| $25,000 to $34,999 | 31 (3.5%) | 215 (27.0%) |
| $35,000 to $49,999 | 278 (31.2%) | 155 (19.5%) |
| $50,000 to $74,999 | 128 (14.3%) | 136 (17.1%) |
| $75,000 to $99,999 | 80 (9.0%) | 22 (2.8%) |
| $100,000 to $149,999 | 236 (26.5%) | 37 (4.6%) |
| $150,000 or more | 19 (2.1%) | 0 (0.0%) |
| Total | 892 (100.0%) | 797 (100.0%) |
Monthly Housing Cost Tiers in Farmington
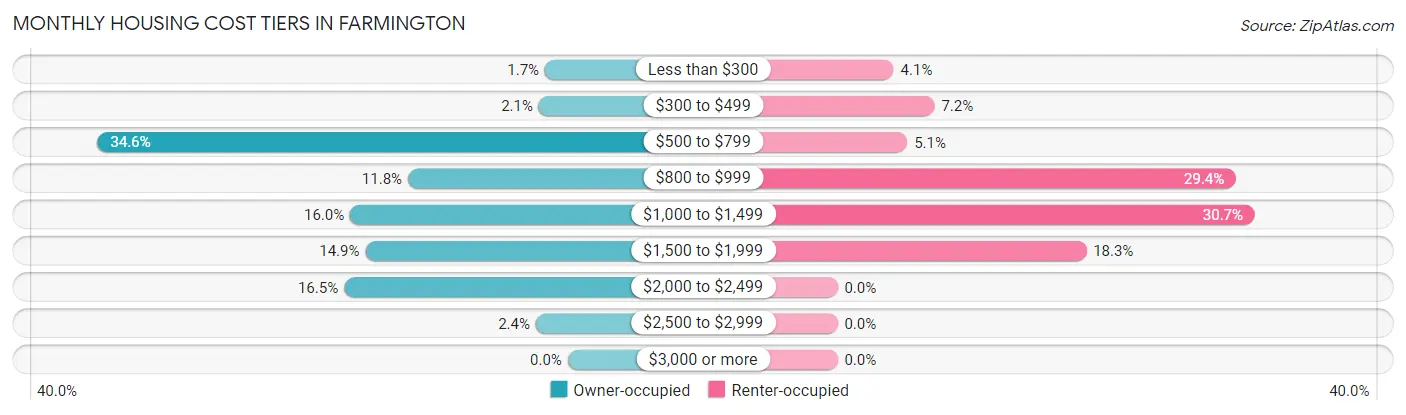
| Monthly Cost | Owner-occupied | Renter-occupied |
| Less than $300 | 15 (1.7%) | 33 (4.1%) |
| $300 to $499 | 19 (2.1%) | 57 (7.1%) |
| $500 to $799 | 309 (34.6%) | 41 (5.1%) |
| $800 to $999 | 105 (11.8%) | 234 (29.4%) |
| $1,000 to $1,499 | 143 (16.0%) | 245 (30.7%) |
| $1,500 to $1,999 | 133 (14.9%) | 146 (18.3%) |
| $2,000 to $2,499 | 147 (16.5%) | 0 (0.0%) |
| $2,500 to $2,999 | 21 (2.4%) | 0 (0.0%) |
| $3,000 or more | 0 (0.0%) | 0 (0.0%) |
| Total | 892 (100.0%) | 797 (100.0%) |
Physical Housing Characteristics in Farmington
Housing Structures in Farmington
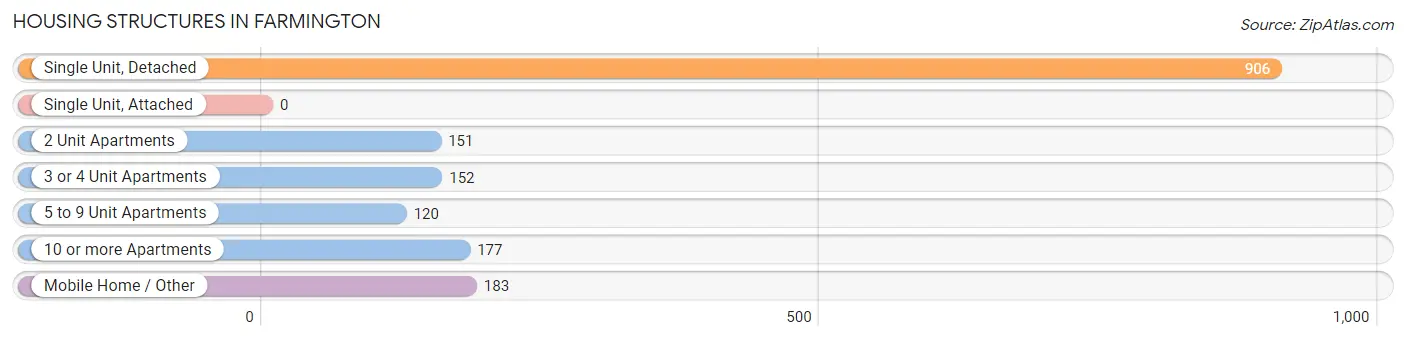
| Structure Type | # Housing Units | % Housing Units |
| Single Unit, Detached | 906 | 53.6% |
| Single Unit, Attached | 0 | 0.0% |
| 2 Unit Apartments | 151 | 8.9% |
| 3 or 4 Unit Apartments | 152 | 9.0% |
| 5 to 9 Unit Apartments | 120 | 7.1% |
| 10 or more Apartments | 177 | 10.5% |
| Mobile Home / Other | 183 | 10.8% |
| Total | 1,689 | 100.0% |
Housing Structures by Occupancy in Farmington
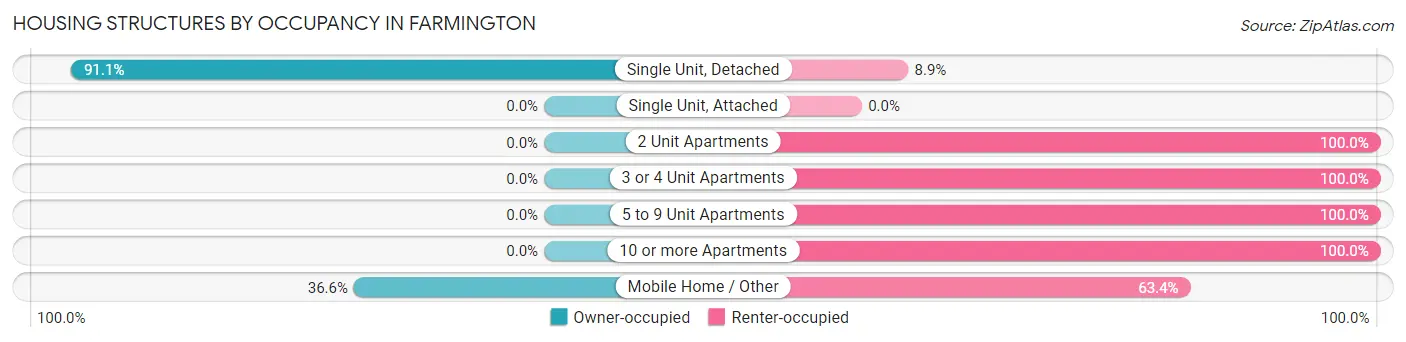
| Structure Type | Owner-occupied | Renter-occupied |
| Single Unit, Detached | 825 (91.1%) | 81 (8.9%) |
| Single Unit, Attached | 0 (0.0%) | 0 (0.0%) |
| 2 Unit Apartments | 0 (0.0%) | 151 (100.0%) |
| 3 or 4 Unit Apartments | 0 (0.0%) | 152 (100.0%) |
| 5 to 9 Unit Apartments | 0 (0.0%) | 120 (100.0%) |
| 10 or more Apartments | 0 (0.0%) | 177 (100.0%) |
| Mobile Home / Other | 67 (36.6%) | 116 (63.4%) |
| Total | 892 (52.8%) | 797 (47.2%) |
Housing Structures by Number of Rooms in Farmington
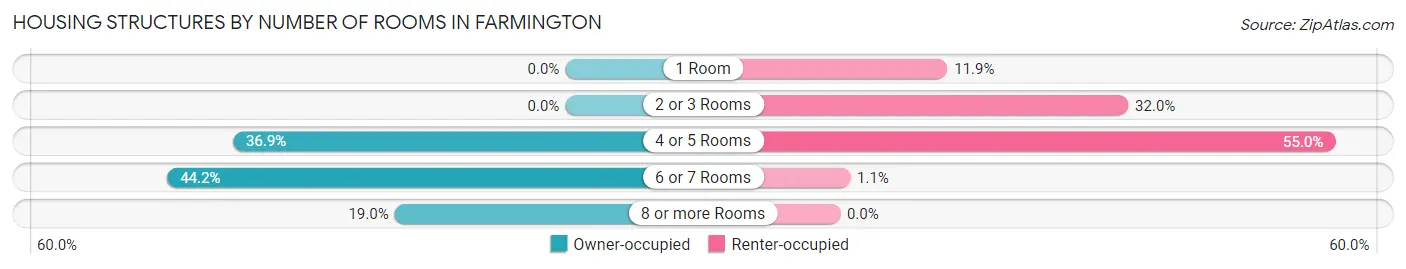
| Number of Rooms | Owner-occupied | Renter-occupied |
| 1 Room | 0 (0.0%) | 95 (11.9%) |
| 2 or 3 Rooms | 0 (0.0%) | 255 (32.0%) |
| 4 or 5 Rooms | 329 (36.9%) | 438 (55.0%) |
| 6 or 7 Rooms | 394 (44.2%) | 9 (1.1%) |
| 8 or more Rooms | 169 (19.0%) | 0 (0.0%) |
| Total | 892 (100.0%) | 797 (100.0%) |
Housing Structure by Heating Type in Farmington
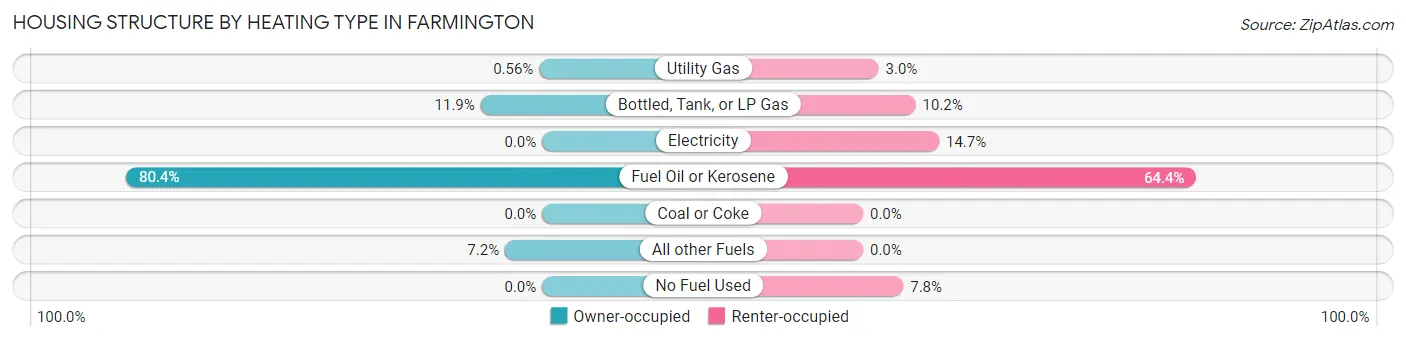
| Heating Type | Owner-occupied | Renter-occupied |
| Utility Gas | 5 (0.6%) | 24 (3.0%) |
| Bottled, Tank, or LP Gas | 106 (11.9%) | 81 (10.2%) |
| Electricity | 0 (0.0%) | 117 (14.7%) |
| Fuel Oil or Kerosene | 717 (80.4%) | 513 (64.4%) |
| Coal or Coke | 0 (0.0%) | 0 (0.0%) |
| All other Fuels | 64 (7.2%) | 0 (0.0%) |
| No Fuel Used | 0 (0.0%) | 62 (7.8%) |
| Total | 892 (100.0%) | 797 (100.0%) |
Household Vehicle Usage in Farmington
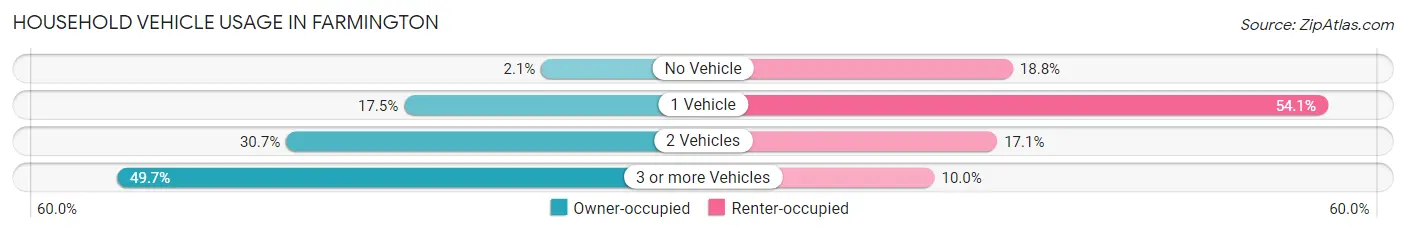
| Vehicles per Household | Owner-occupied | Renter-occupied |
| No Vehicle | 19 (2.1%) | 150 (18.8%) |
| 1 Vehicle | 156 (17.5%) | 431 (54.1%) |
| 2 Vehicles | 274 (30.7%) | 136 (17.1%) |
| 3 or more Vehicles | 443 (49.7%) | 80 (10.0%) |
| Total | 892 (100.0%) | 797 (100.0%) |
Real Estate & Mortgages in Farmington
Real Estate and Mortgage Overview in Farmington
| Characteristic | Without Mortgage | With Mortgage |
| Housing Units | 444 | 448 |
| Median Property Value | $207,300 | $193,900 |
| Median Household Income | $44,386 | $19 |
| Monthly Housing Costs | $746 | $0 |
| Real Estate Taxes | $4,281 | $0 |
Property Value by Mortgage Status in Farmington
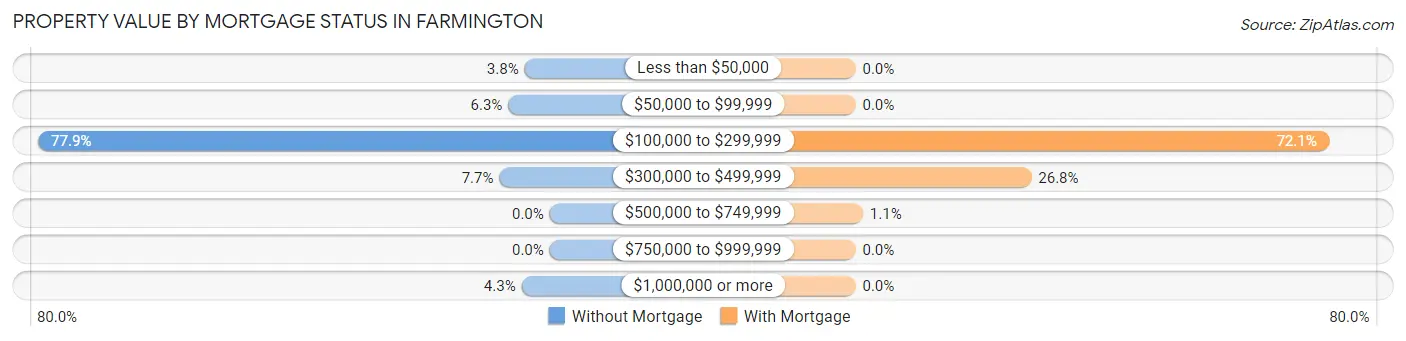
| Property Value | Without Mortgage | With Mortgage |
| Less than $50,000 | 17 (3.8%) | 0 (0.0%) |
| $50,000 to $99,999 | 28 (6.3%) | 0 (0.0%) |
| $100,000 to $299,999 | 346 (77.9%) | 323 (72.1%) |
| $300,000 to $499,999 | 34 (7.7%) | 120 (26.8%) |
| $500,000 to $749,999 | 0 (0.0%) | 5 (1.1%) |
| $750,000 to $999,999 | 0 (0.0%) | 0 (0.0%) |
| $1,000,000 or more | 19 (4.3%) | 0 (0.0%) |
| Total | 444 (100.0%) | 448 (100.0%) |
Household Income by Mortgage Status in Farmington
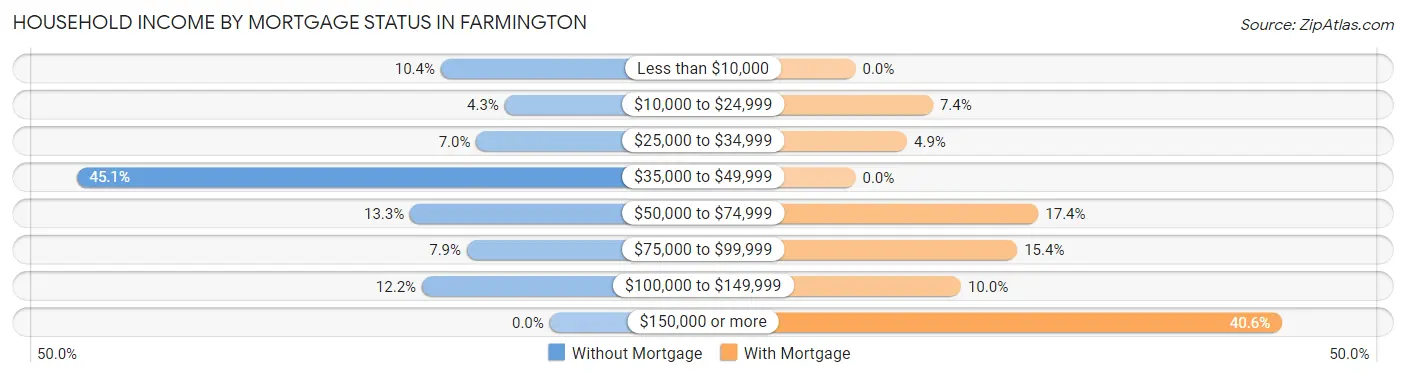
| Household Income | Without Mortgage | With Mortgage |
| Less than $10,000 | 46 (10.4%) | 0 (0.0%) |
| $10,000 to $24,999 | 19 (4.3%) | 33 (7.4%) |
| $25,000 to $34,999 | 31 (7.0%) | 22 (4.9%) |
| $35,000 to $49,999 | 200 (45.1%) | 0 (0.0%) |
| $50,000 to $74,999 | 59 (13.3%) | 78 (17.4%) |
| $75,000 to $99,999 | 35 (7.9%) | 69 (15.4%) |
| $100,000 to $149,999 | 54 (12.2%) | 45 (10.0%) |
| $150,000 or more | 0 (0.0%) | 182 (40.6%) |
| Total | 444 (100.0%) | 448 (100.0%) |
Property Value to Household Income Ratio in Farmington
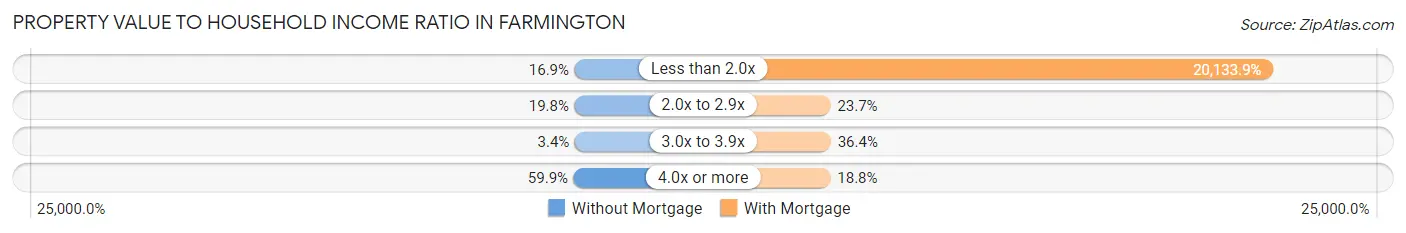
| Value-to-Income Ratio | Without Mortgage | With Mortgage |
| Less than 2.0x | 75 (16.9%) | 90,200 (20,133.9%) |
| 2.0x to 2.9x | 88 (19.8%) | 106 (23.7%) |
| 3.0x to 3.9x | 15 (3.4%) | 163 (36.4%) |
| 4.0x or more | 266 (59.9%) | 84 (18.8%) |
| Total | 444 (100.0%) | 448 (100.0%) |
Real Estate Taxes by Mortgage Status in Farmington
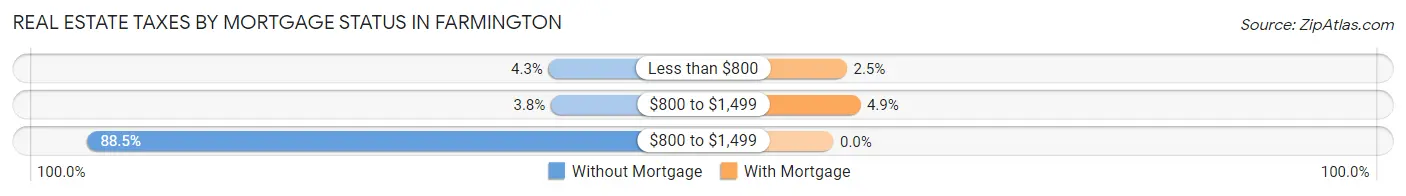
| Property Taxes | Without Mortgage | With Mortgage |
| Less than $800 | 19 (4.3%) | 11 (2.5%) |
| $800 to $1,499 | 17 (3.8%) | 22 (4.9%) |
| $800 to $1,499 | 393 (88.5%) | 0 (0.0%) |
| Total | 444 (100.0%) | 448 (100.0%) |
Health & Disability in Farmington
Health Insurance Coverage by Age in Farmington
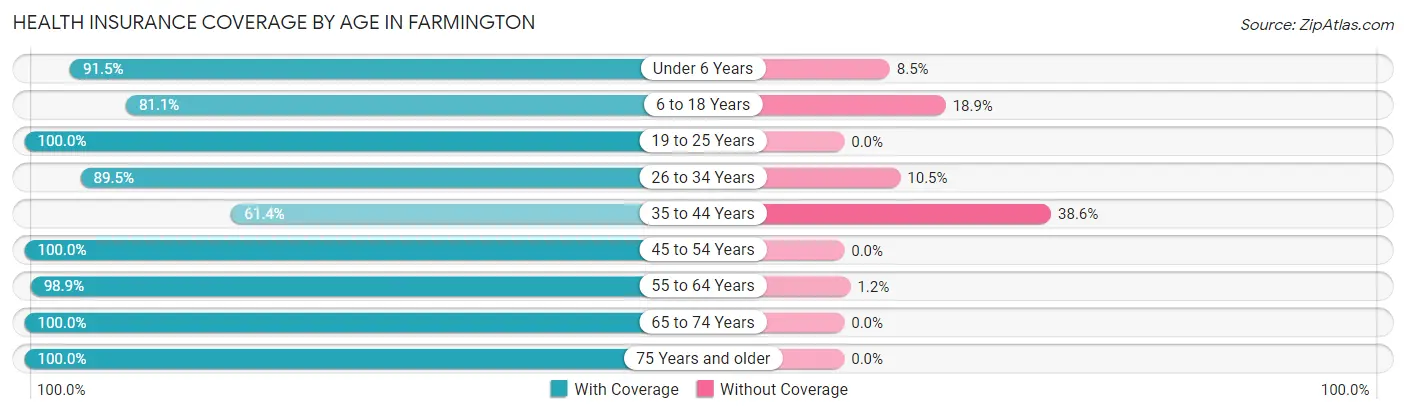
| Age Bracket | With Coverage | Without Coverage |
| Under 6 Years | 269 (91.5%) | 25 (8.5%) |
| 6 to 18 Years | 343 (81.1%) | 80 (18.9%) |
| 19 to 25 Years | 353 (100.0%) | 0 (0.0%) |
| 26 to 34 Years | 625 (89.5%) | 73 (10.5%) |
| 35 to 44 Years | 172 (61.4%) | 108 (38.6%) |
| 45 to 54 Years | 344 (100.0%) | 0 (0.0%) |
| 55 to 64 Years | 949 (98.9%) | 11 (1.1%) |
| 65 to 74 Years | 133 (100.0%) | 0 (0.0%) |
| 75 Years and older | 229 (100.0%) | 0 (0.0%) |
| Total | 3,417 (92.0%) | 297 (8.0%) |
Health Insurance Coverage by Citizenship Status in Farmington
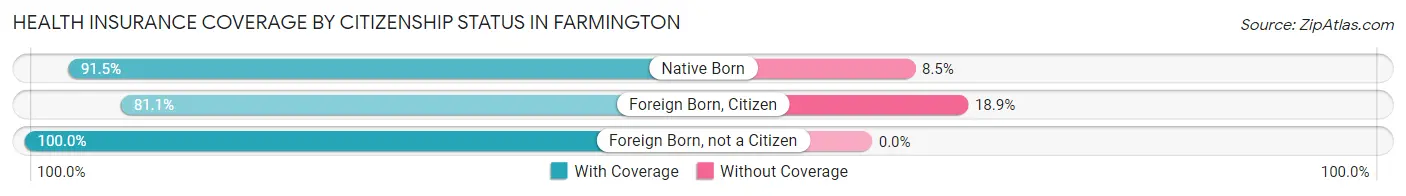
| Citizenship Status | With Coverage | Without Coverage |
| Native Born | 269 (91.5%) | 25 (8.5%) |
| Foreign Born, Citizen | 343 (81.1%) | 80 (18.9%) |
| Foreign Born, not a Citizen | 353 (100.0%) | 0 (0.0%) |
Health Insurance Coverage by Household Income in Farmington
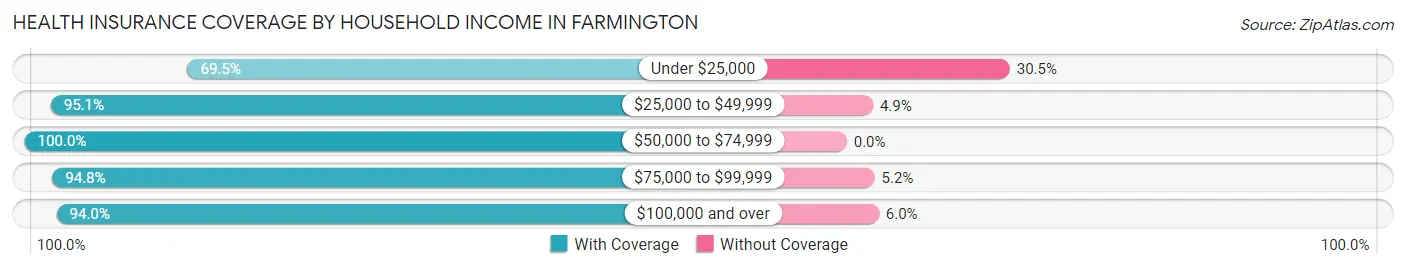
| Household Income | With Coverage | Without Coverage |
| Under $25,000 | 373 (69.5%) | 164 (30.5%) |
| $25,000 to $49,999 | 1,201 (95.1%) | 62 (4.9%) |
| $50,000 to $74,999 | 683 (100.0%) | 0 (0.0%) |
| $75,000 to $99,999 | 309 (94.8%) | 17 (5.2%) |
| $100,000 and over | 846 (94.0%) | 54 (6.0%) |
Public vs Private Health Insurance Coverage by Age in Farmington
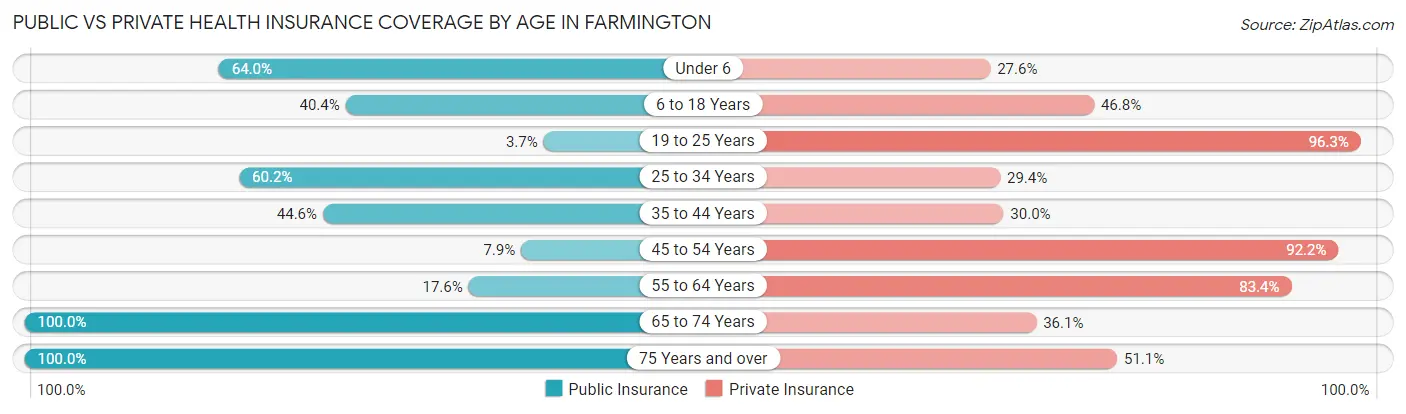
| Age Bracket | Public Insurance | Private Insurance |
| Under 6 | 188 (63.9%) | 81 (27.6%) |
| 6 to 18 Years | 171 (40.4%) | 198 (46.8%) |
| 19 to 25 Years | 13 (3.7%) | 340 (96.3%) |
| 25 to 34 Years | 420 (60.2%) | 205 (29.4%) |
| 35 to 44 Years | 125 (44.6%) | 84 (30.0%) |
| 45 to 54 Years | 27 (7.9%) | 317 (92.1%) |
| 55 to 64 Years | 169 (17.6%) | 801 (83.4%) |
| 65 to 74 Years | 133 (100.0%) | 48 (36.1%) |
| 75 Years and over | 229 (100.0%) | 117 (51.1%) |
| Total | 1,475 (39.7%) | 2,191 (59.0%) |
Disability Status by Sex by Age in Farmington
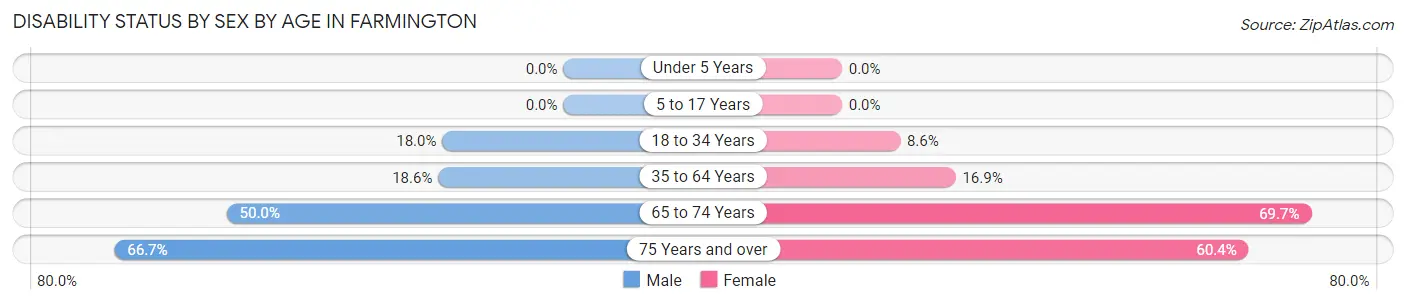
| Age Bracket | Male | Female |
| Under 5 Years | 0 (0.0%) | 0 (0.0%) |
| 5 to 17 Years | 0 (0.0%) | 0 (0.0%) |
| 18 to 34 Years | 87 (18.0%) | 49 (8.6%) |
| 35 to 64 Years | 149 (18.6%) | 132 (16.9%) |
| 65 to 74 Years | 17 (50.0%) | 69 (69.7%) |
| 75 Years and over | 50 (66.7%) | 93 (60.4%) |
Disability Class by Sex by Age in Farmington
Disability Class: Hearing Difficulty
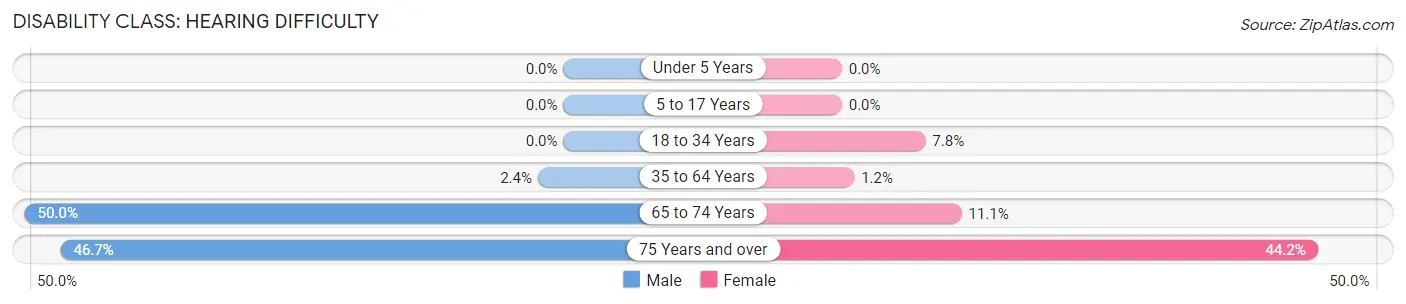
| Age Bracket | Male | Female |
| Under 5 Years | 0 (0.0%) | 0 (0.0%) |
| 5 to 17 Years | 0 (0.0%) | 0 (0.0%) |
| 18 to 34 Years | 0 (0.0%) | 44 (7.8%) |
| 35 to 64 Years | 19 (2.4%) | 9 (1.1%) |
| 65 to 74 Years | 17 (50.0%) | 11 (11.1%) |
| 75 Years and over | 35 (46.7%) | 68 (44.2%) |
Disability Class: Vision Difficulty
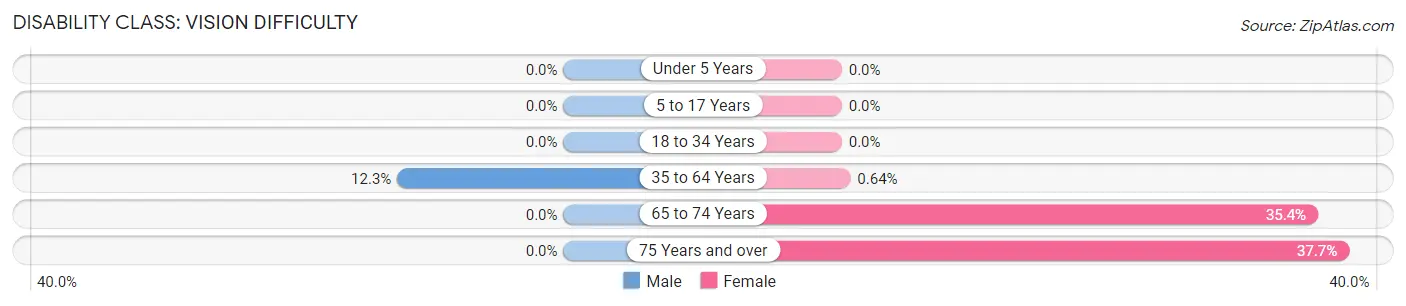
| Age Bracket | Male | Female |
| Under 5 Years | 0 (0.0%) | 0 (0.0%) |
| 5 to 17 Years | 0 (0.0%) | 0 (0.0%) |
| 18 to 34 Years | 0 (0.0%) | 0 (0.0%) |
| 35 to 64 Years | 99 (12.3%) | 5 (0.6%) |
| 65 to 74 Years | 0 (0.0%) | 35 (35.3%) |
| 75 Years and over | 0 (0.0%) | 58 (37.7%) |
Disability Class: Cognitive Difficulty
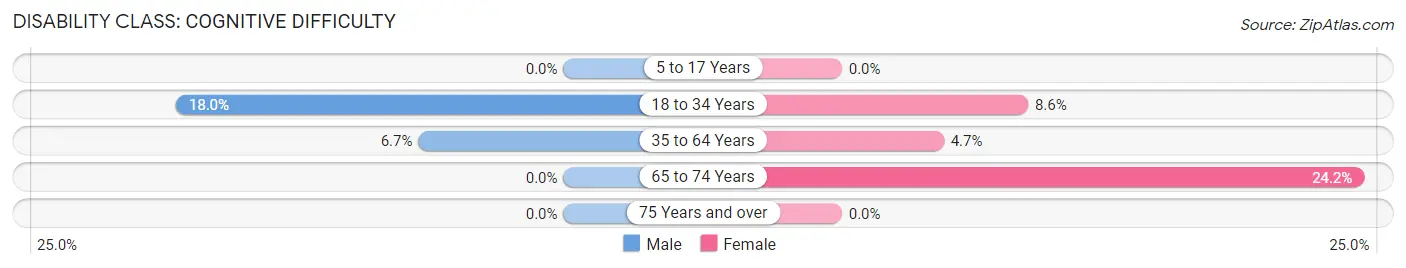
| Age Bracket | Male | Female |
| 5 to 17 Years | 0 (0.0%) | 0 (0.0%) |
| 18 to 34 Years | 87 (18.0%) | 49 (8.6%) |
| 35 to 64 Years | 54 (6.7%) | 37 (4.7%) |
| 65 to 74 Years | 0 (0.0%) | 24 (24.2%) |
| 75 Years and over | 0 (0.0%) | 0 (0.0%) |
Disability Class: Ambulatory Difficulty
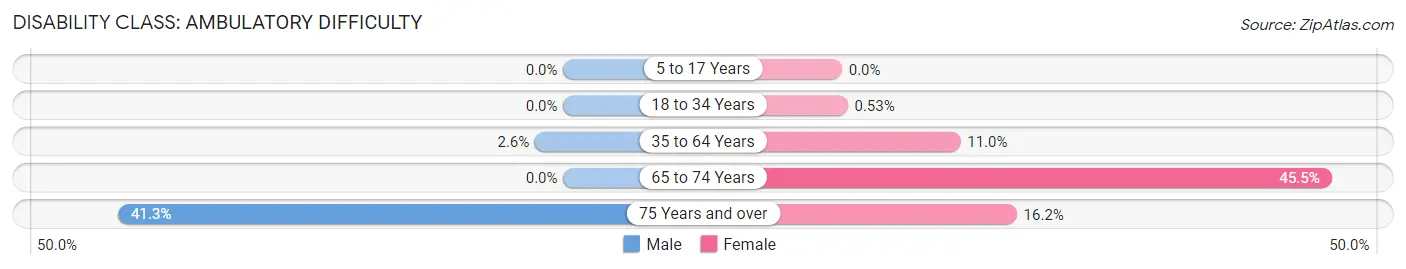
| Age Bracket | Male | Female |
| 5 to 17 Years | 0 (0.0%) | 0 (0.0%) |
| 18 to 34 Years | 0 (0.0%) | 3 (0.5%) |
| 35 to 64 Years | 21 (2.6%) | 86 (11.0%) |
| 65 to 74 Years | 0 (0.0%) | 45 (45.5%) |
| 75 Years and over | 31 (41.3%) | 25 (16.2%) |
Disability Class: Self-Care Difficulty
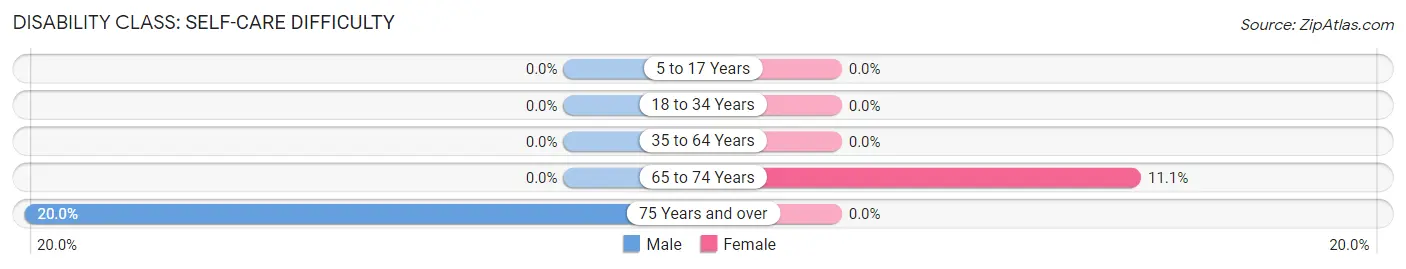
| Age Bracket | Male | Female |
| 5 to 17 Years | 0 (0.0%) | 0 (0.0%) |
| 18 to 34 Years | 0 (0.0%) | 0 (0.0%) |
| 35 to 64 Years | 0 (0.0%) | 0 (0.0%) |
| 65 to 74 Years | 0 (0.0%) | 11 (11.1%) |
| 75 Years and over | 15 (20.0%) | 0 (0.0%) |
Technology Access in Farmington
Computing Device Access in Farmington
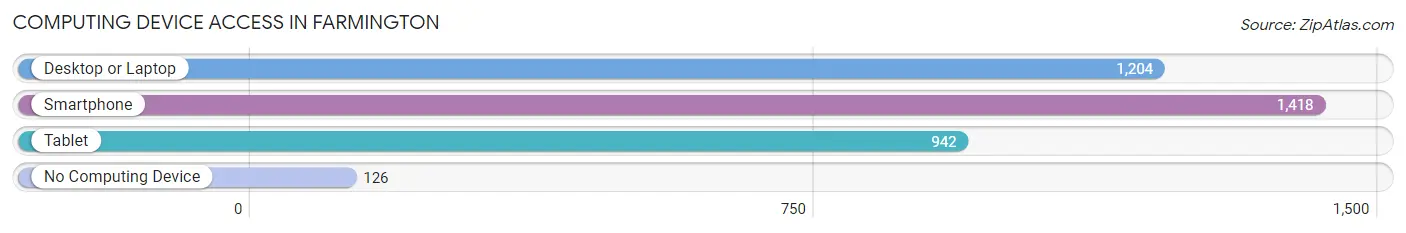
| Device Type | # Households | % Households |
| Desktop or Laptop | 1,204 | 71.3% |
| Smartphone | 1,418 | 84.0% |
| Tablet | 942 | 55.8% |
| No Computing Device | 126 | 7.5% |
| Total | 1,689 | 100.0% |
Internet Access in Farmington
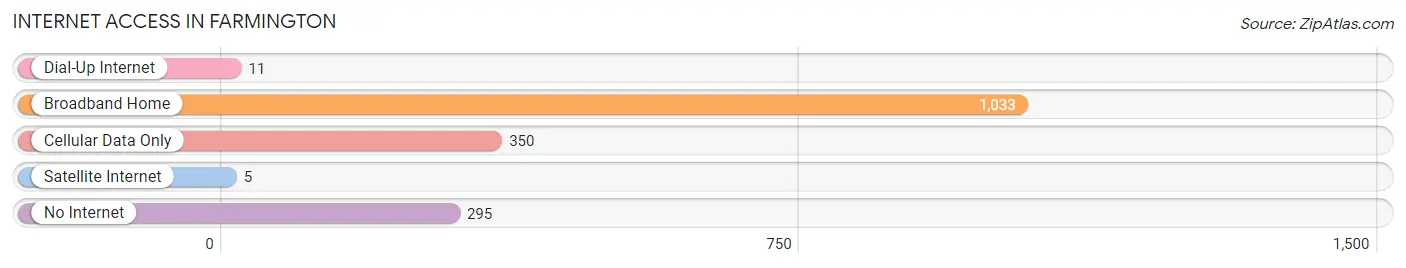
| Internet Type | # Households | % Households |
| Dial-Up Internet | 11 | 0.6% |
| Broadband Home | 1,033 | 61.2% |
| Cellular Data Only | 350 | 20.7% |
| Satellite Internet | 5 | 0.3% |
| No Internet | 295 | 17.5% |
| Total | 1,689 | 100.0% |
Farmington Summary
History
The town of Farmington, New Hampshire is located in Strafford County and is part of the Seacoast Region of the state. It was first settled in 1768 by a group of settlers from Massachusetts and was originally known as “New Goshen”. The town was officially incorporated in 1790 and was named after Farmington, Connecticut.
The town of Farmington has a rich history of industry and agriculture. In the early 19th century, the town was home to several mills, including a sawmill, gristmill, and a woolen mill. The town was also home to several farms, which produced a variety of crops, including corn, potatoes, and hay.
In the late 19th century, the town began to experience a period of growth and development. The town was home to several factories, including a shoe factory, a paper mill, and a brickyard. The town also had a thriving business district, which included several stores, a bank, and a post office.
Geography
Farmington is located in the southeastern corner of New Hampshire, approximately 30 miles from the state capital of Concord. The town is situated in the foothills of the White Mountains and is bordered by the towns of Rochester, Milton, and New Durham. The town is located on the banks of the Cocheco River and is home to several small lakes, including Lake Winnipesaukee and Lake Winnisquam.
The town of Farmington covers an area of approximately 25 square miles and has a population of approximately 6,000 people. The town is primarily rural, with a few small villages scattered throughout the area. The town is home to several parks and recreational areas, including the Farmington State Forest and the Farmington River.
Economy
The economy of Farmington is largely based on agriculture and manufacturing. The town is home to several farms, which produce a variety of crops, including corn, potatoes, and hay. The town is also home to several factories, including a shoe factory, a paper mill, and a brickyard.
The town is also home to several small businesses, including restaurants, retail stores, and service providers. The town is also home to several educational institutions, including the University of New Hampshire and the University of New England.
Demographics
As of the 2010 census, the town of Farmington had a population of 6,073 people. The racial makeup of the town was 97.3% White, 0.7% African American, 0.3% Native American, 0.4% Asian, 0.1% Pacific Islander, 0.3% from other races, and 0.9% from two or more races. Hispanic or Latino of any race were 1.2% of the population.
The median household income in Farmington was $50,945, and the median family income was $60,917. The per capita income for the town was $25,945. About 6.3% of families and 8.2% of the population were below the poverty line, including 10.2% of those under age 18 and 5.2% of those age 65 or over.
Common Questions
What is Per Capita Income in Farmington?
Per Capita income in Farmington is $24,548.
What is the Median Family Income in Farmington?
Median Family Income in Farmington is $44,693.
What is the Median Household income in Farmington?
Median Household Income in Farmington is $44,664.
What is Income or Wage Gap in Farmington?
Income or Wage Gap in Farmington is 23.4%.
Women in Farmington earn 76.6 cents for every dollar earned by a man.
What is Inequality or Gini Index in Farmington?
Inequality or Gini Index in Farmington is 0.38.
What is the Total Population of Farmington?
Total Population of Farmington is 3,722.
What is the Total Male Population of Farmington?
Total Male Population of Farmington is 1,774.
What is the Total Female Population of Farmington?
Total Female Population of Farmington is 1,948.
What is the Ratio of Males per 100 Females in Farmington?
There are 91.07 Males per 100 Females in Farmington.
What is the Ratio of Females per 100 Males in Farmington?
There are 109.81 Females per 100 Males in Farmington.
What is the Median Population Age in Farmington?
Median Population Age in Farmington is 37.7 Years.
What is the Average Family Size in Farmington
Average Family Size in Farmington is 2.8 People.
What is the Average Household Size in Farmington
Average Household Size in Farmington is 2.2 People.
How Large is the Labor Force in Farmington?
There are 2,094 People in the Labor Forcein in Farmington.
What is the Percentage of People in the Labor Force in Farmington?
68.6% of People are in the Labor Force in Farmington.
What is the Unemployment Rate in Farmington?
Unemployment Rate in Farmington is 4.3%.