Hinsdale, NH Map & Demographics
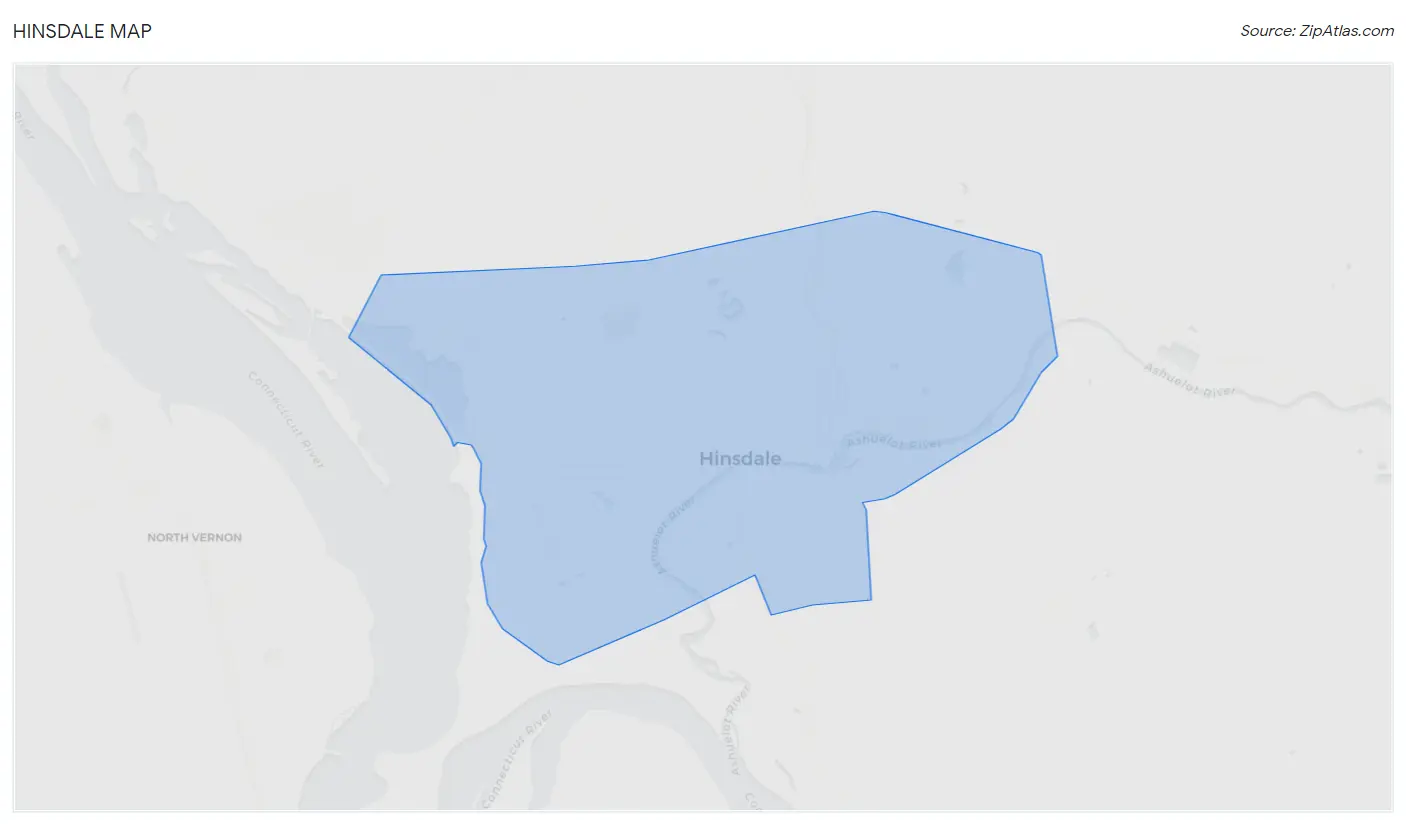
Hinsdale Map
Hinsdale Overview
$42,438
PER CAPITA INCOME
$104,844
AVG FAMILY INCOME
$96,161
AVG HOUSEHOLD INCOME
34.4%
WAGE / INCOME GAP [ % ]
65.6¢/ $1
WAGE / INCOME GAP [ $ ]
0.33
INEQUALITY / GINI INDEX
1,432
TOTAL POPULATION
702
MALE POPULATION
730
FEMALE POPULATION
96.16
MALES / 100 FEMALES
103.99
FEMALES / 100 MALES
55.0
MEDIAN AGE
2.7
AVG FAMILY SIZE
2.5
AVG HOUSEHOLD SIZE
794
LABOR FORCE [ PEOPLE ]
62.4%
PERCENT IN LABOR FORCE
1.8%
UNEMPLOYMENT RATE
Hinsdale Zip Codes
Hinsdale Area Codes
Income in Hinsdale
Income Overview in Hinsdale
Per Capita Income in Hinsdale is $42,438, while median incomes of families and households are $104,844 and $96,161 respectively.
| Characteristic | Number | Measure |
| Per Capita Income | 1,432 | $42,438 |
| Median Family Income | 465 | $104,844 |
| Mean Family Income | 465 | $115,989 |
| Median Household Income | 567 | $96,161 |
| Mean Household Income | 567 | $105,629 |
| Income Deficit | 465 | $0 |
| Wage / Income Gap (%) | 1,432 | 34.37% |
| Wage / Income Gap ($) | 1,432 | 65.63¢ per $1 |
| Gini / Inequality Index | 1,432 | 0.33 |
Earnings by Sex in Hinsdale
Average Earnings in Hinsdale are $53,179, $59,102 for men and $38,790 for women, a difference of 34.4%.
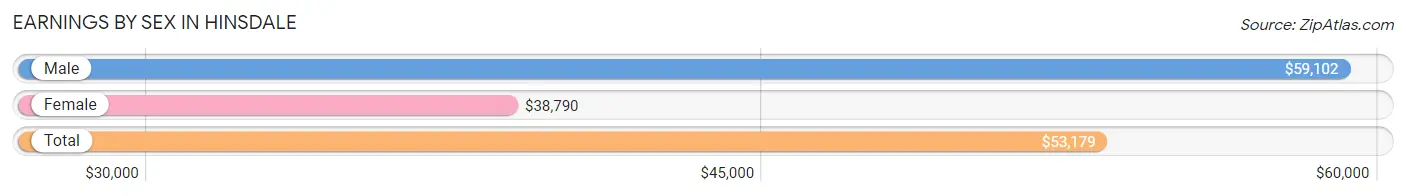
| Sex | Number | Average Earnings |
| Male | 495 (56.6%) | $59,102 |
| Female | 380 (43.4%) | $38,790 |
| Total | 875 (100.0%) | $53,179 |
Earnings by Sex by Income Bracket in Hinsdale
The most common earnings brackets in Hinsdale are $55,000 to $64,999 for men (133 | 26.9%) and $25,000 to $29,999 for women (73 | 19.2%).
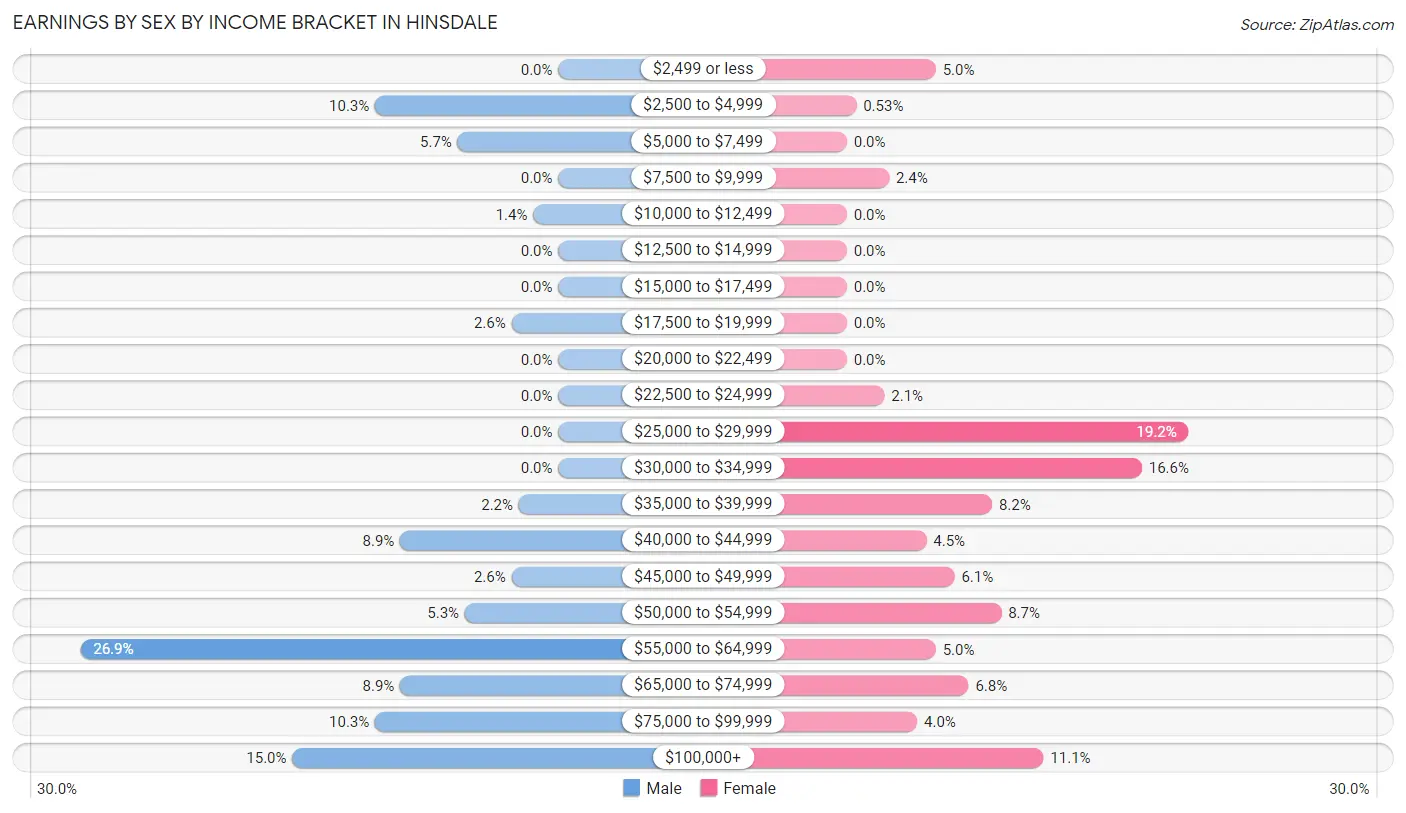
| Income | Male | Female |
| $2,499 or less | 0 (0.0%) | 19 (5.0%) |
| $2,500 to $4,999 | 51 (10.3%) | 2 (0.5%) |
| $5,000 to $7,499 | 28 (5.7%) | 0 (0.0%) |
| $7,500 to $9,999 | 0 (0.0%) | 9 (2.4%) |
| $10,000 to $12,499 | 7 (1.4%) | 0 (0.0%) |
| $12,500 to $14,999 | 0 (0.0%) | 0 (0.0%) |
| $15,000 to $17,499 | 0 (0.0%) | 0 (0.0%) |
| $17,500 to $19,999 | 13 (2.6%) | 0 (0.0%) |
| $20,000 to $22,499 | 0 (0.0%) | 0 (0.0%) |
| $22,500 to $24,999 | 0 (0.0%) | 8 (2.1%) |
| $25,000 to $29,999 | 0 (0.0%) | 73 (19.2%) |
| $30,000 to $34,999 | 0 (0.0%) | 63 (16.6%) |
| $35,000 to $39,999 | 11 (2.2%) | 31 (8.2%) |
| $40,000 to $44,999 | 44 (8.9%) | 17 (4.5%) |
| $45,000 to $49,999 | 13 (2.6%) | 23 (6.0%) |
| $50,000 to $54,999 | 26 (5.2%) | 33 (8.7%) |
| $55,000 to $64,999 | 133 (26.9%) | 19 (5.0%) |
| $65,000 to $74,999 | 44 (8.9%) | 26 (6.8%) |
| $75,000 to $99,999 | 51 (10.3%) | 15 (4.0%) |
| $100,000+ | 74 (14.9%) | 42 (11.1%) |
| Total | 495 (100.0%) | 380 (100.0%) |
Earnings by Sex by Educational Attainment in Hinsdale
Average earnings in Hinsdale are $61,991 for men and $48,043 for women, a difference of 22.5%. Men with an educational attainment of bachelor's degree enjoy the highest average annual earnings of $90,781, while those with college or associate's degree education earn the least with $58,009. Women with an educational attainment of bachelor's degree earn the most with the average annual earnings of $53,485, while those with high school diploma education have the smallest earnings of $31,791.
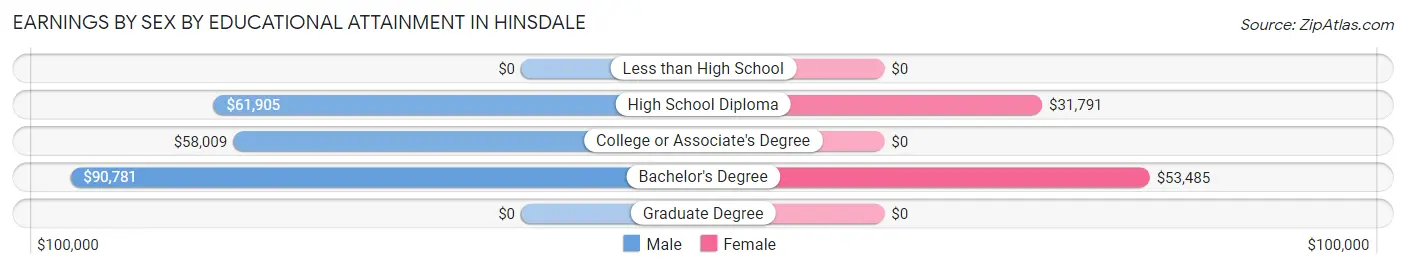
| Educational Attainment | Male Income | Female Income |
| Less than High School | - | - |
| High School Diploma | $61,905 | $31,791 |
| College or Associate's Degree | $58,009 | $0 |
| Bachelor's Degree | $90,781 | $53,485 |
| Graduate Degree | - | - |
| Total | $61,991 | $48,043 |
Family Income in Hinsdale
Family Income Brackets in Hinsdale
According to the Hinsdale family income data, there are 159 families falling into the $50,000 to $74,999 income range, which is the most common income bracket and makes up 34.2% of all families.
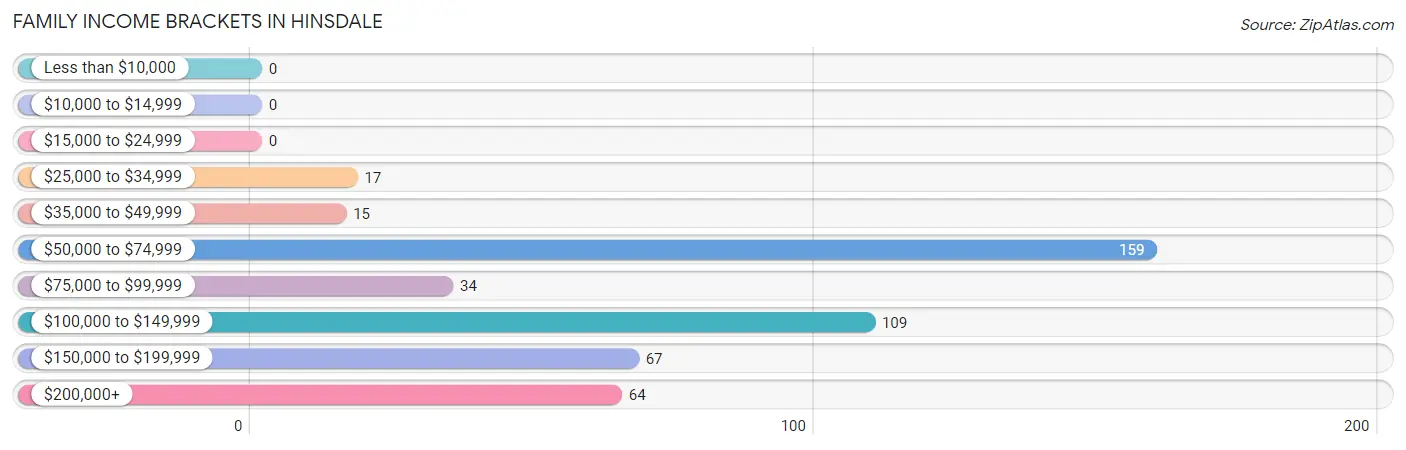
| Income Bracket | # Families | % Families |
| Less than $10,000 | 0 | 0.0% |
| $10,000 to $14,999 | 0 | 0.0% |
| $15,000 to $24,999 | 0 | 0.0% |
| $25,000 to $34,999 | 17 | 3.7% |
| $35,000 to $49,999 | 15 | 3.2% |
| $50,000 to $74,999 | 159 | 34.2% |
| $75,000 to $99,999 | 34 | 7.3% |
| $100,000 to $149,999 | 109 | 23.4% |
| $150,000 to $199,999 | 67 | 14.4% |
| $200,000+ | 64 | 13.8% |
Family Income by Famaliy Size in Hinsdale
4-person families (68 | 14.6%) account for the highest median family income in Hinsdale with $190,375 per family, while 3-person families (146 | 31.4%) have the highest median income of $51,218 per family member.
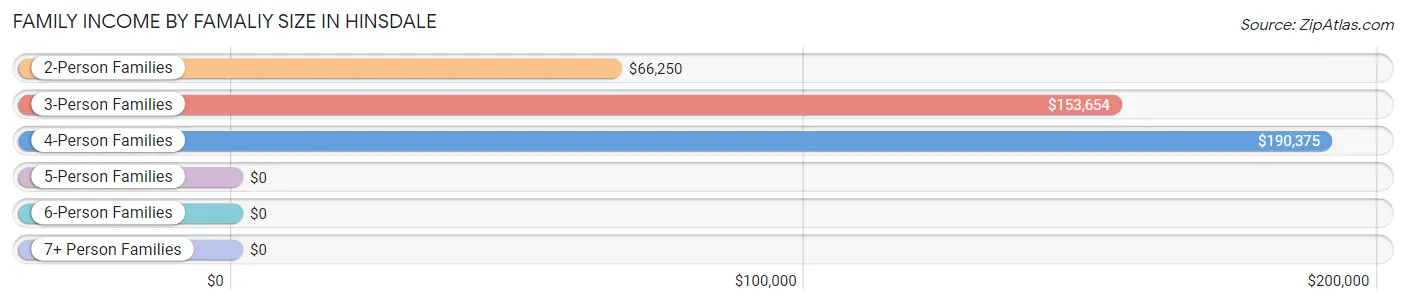
| Income Bracket | # Families | Median Income |
| 2-Person Families | 238 (51.2%) | $66,250 |
| 3-Person Families | 146 (31.4%) | $153,654 |
| 4-Person Families | 68 (14.6%) | $190,375 |
| 5-Person Families | 13 (2.8%) | $0 |
| 6-Person Families | 0 (0.0%) | $0 |
| 7+ Person Families | 0 (0.0%) | $0 |
| Total | 465 (100.0%) | $104,844 |
Family Income by Number of Earners in Hinsdale
The median family income in Hinsdale is $104,844, with families comprising 3+ earners (142) having the highest median family income of $191,438, while families with 1 earner (64) have the lowest median family income of $63,942, accounting for 30.5% and 13.8% of families, respectively.
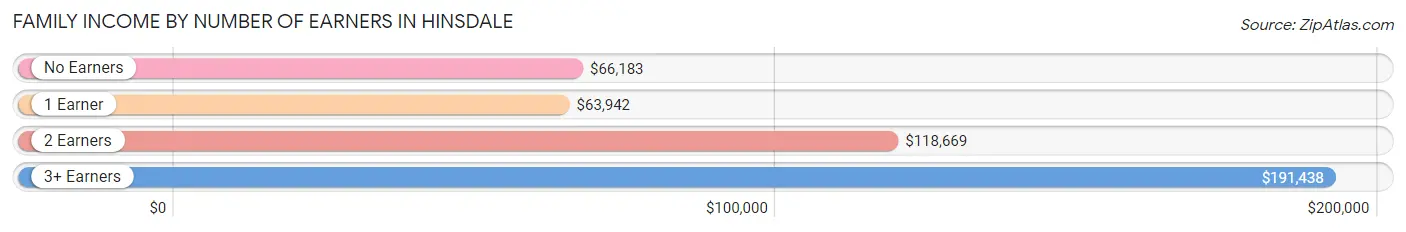
| Number of Earners | # Families | Median Income |
| No Earners | 146 (31.4%) | $66,183 |
| 1 Earner | 64 (13.8%) | $63,942 |
| 2 Earners | 113 (24.3%) | $118,669 |
| 3+ Earners | 142 (30.5%) | $191,438 |
| Total | 465 (100.0%) | $104,844 |
Household Income in Hinsdale
Household Income Brackets in Hinsdale
With 168 households falling in the category, the $50,000 to $74,999 income range is the most frequent in Hinsdale, accounting for 29.6% of all households.
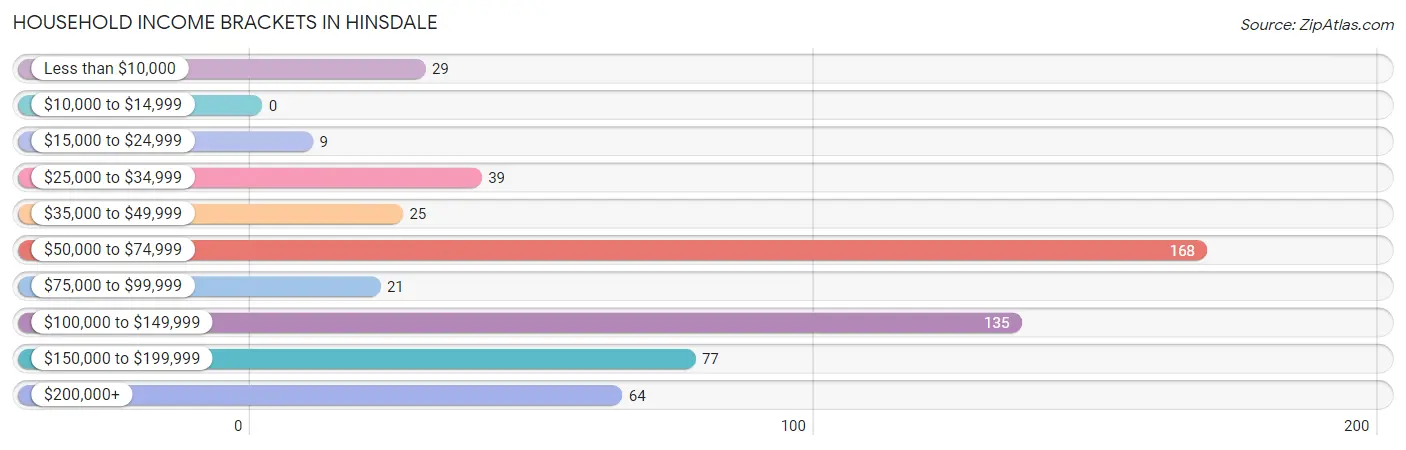
| Income Bracket | # Households | % Households |
| Less than $10,000 | 29 | 5.1% |
| $10,000 to $14,999 | 0 | 0.0% |
| $15,000 to $24,999 | 9 | 1.6% |
| $25,000 to $34,999 | 39 | 6.9% |
| $35,000 to $49,999 | 25 | 4.4% |
| $50,000 to $74,999 | 168 | 29.6% |
| $75,000 to $99,999 | 21 | 3.7% |
| $100,000 to $149,999 | 135 | 23.8% |
| $150,000 to $199,999 | 77 | 13.6% |
| $200,000+ | 64 | 11.3% |
Household Income by Householder Age in Hinsdale
The median household income in Hinsdale is $96,161, with the highest median household income of $154,327 found in the 45 to 64 years age bracket for the primary householder. A total of 263 households (46.4%) fall into this category.
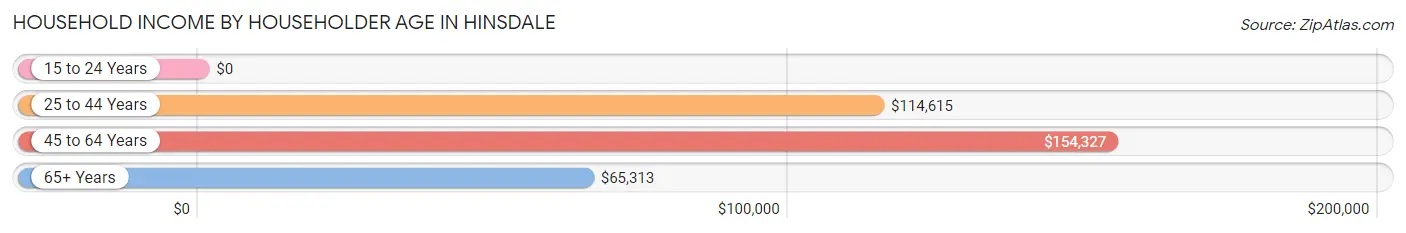
| Income Bracket | # Households | Median Income |
| 15 to 24 Years | 0 (0.0%) | $0 |
| 25 to 44 Years | 80 (14.1%) | $114,615 |
| 45 to 64 Years | 263 (46.4%) | $154,327 |
| 65+ Years | 224 (39.5%) | $65,313 |
| Total | 567 (100.0%) | $96,161 |
Poverty in Hinsdale
Income Below Poverty by Sex and Age in Hinsdale
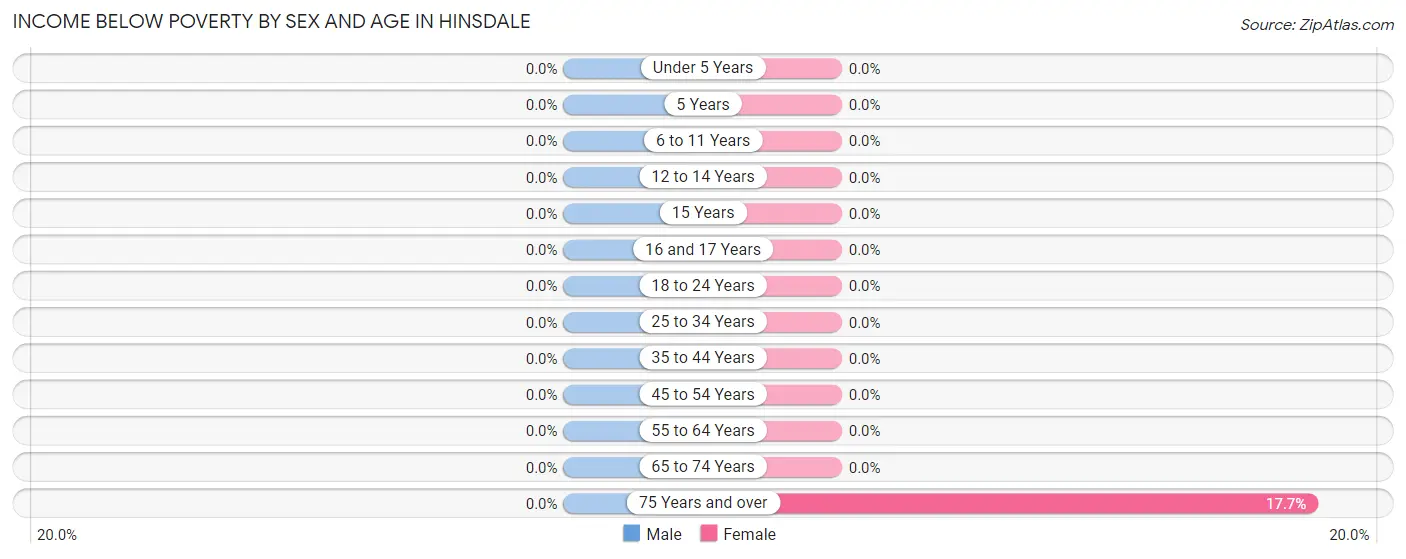
| Age Bracket | Male | Female |
| Under 5 Years | 0 (0.0%) | 0 (0.0%) |
| 5 Years | 0 (0.0%) | 0 (0.0%) |
| 6 to 11 Years | 0 (0.0%) | 0 (0.0%) |
| 12 to 14 Years | 0 (0.0%) | 0 (0.0%) |
| 15 Years | 0 (0.0%) | 0 (0.0%) |
| 16 and 17 Years | 0 (0.0%) | 0 (0.0%) |
| 18 to 24 Years | 0 (0.0%) | 0 (0.0%) |
| 25 to 34 Years | 0 (0.0%) | 0 (0.0%) |
| 35 to 44 Years | 0 (0.0%) | 0 (0.0%) |
| 45 to 54 Years | 0 (0.0%) | 0 (0.0%) |
| 55 to 64 Years | 0 (0.0%) | 0 (0.0%) |
| 65 to 74 Years | 0 (0.0%) | 0 (0.0%) |
| 75 Years and over | 0 (0.0%) | 29 (17.7%) |
| Total | 0 (0.0%) | 29 (4.0%) |
Income Above Poverty by Sex and Age in Hinsdale
According to the poverty statistics in Hinsdale, males aged 5 years and females aged under 5 years are the age groups that are most secure financially, with 100.0% of males and 100.0% of females in these age groups living above the poverty line.
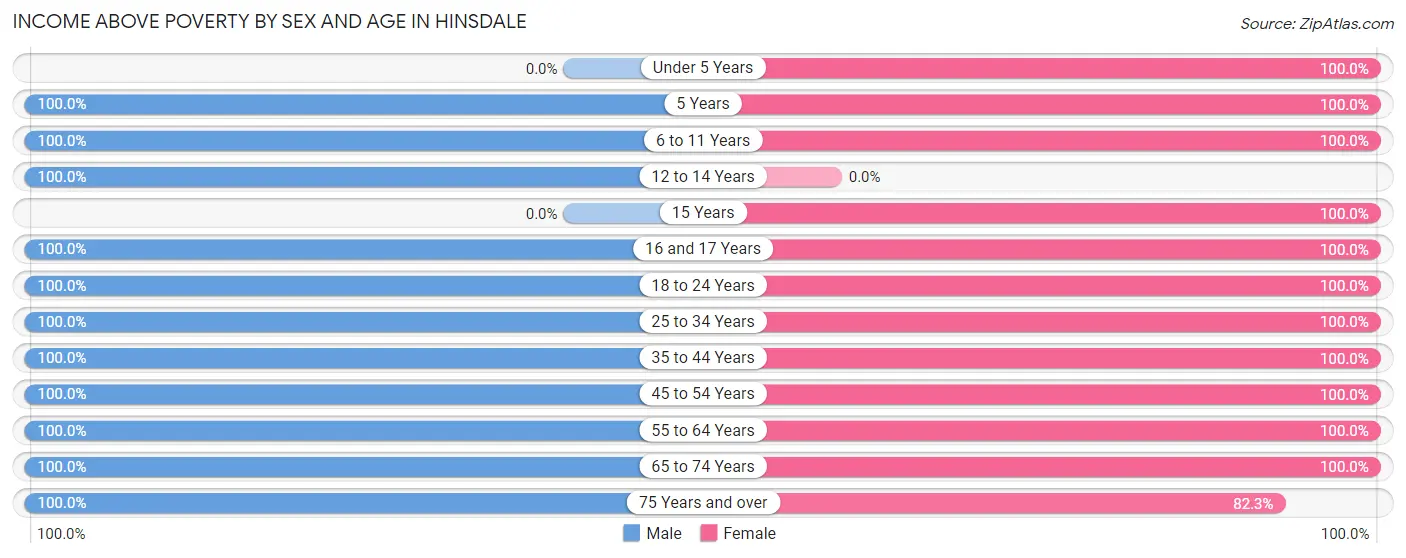
| Age Bracket | Male | Female |
| Under 5 Years | 0 (0.0%) | 10 (100.0%) |
| 5 Years | 35 (100.0%) | 31 (100.0%) |
| 6 to 11 Years | 15 (100.0%) | 61 (100.0%) |
| 12 to 14 Years | 6 (100.0%) | 0 (0.0%) |
| 15 Years | 0 (0.0%) | 2 (100.0%) |
| 16 and 17 Years | 51 (100.0%) | 2 (100.0%) |
| 18 to 24 Years | 58 (100.0%) | 72 (100.0%) |
| 25 to 34 Years | 60 (100.0%) | 48 (100.0%) |
| 35 to 44 Years | 45 (100.0%) | 109 (100.0%) |
| 45 to 54 Years | 97 (100.0%) | 12 (100.0%) |
| 55 to 64 Years | 178 (100.0%) | 164 (100.0%) |
| 65 to 74 Years | 51 (100.0%) | 55 (100.0%) |
| 75 Years and over | 106 (100.0%) | 135 (82.3%) |
| Total | 702 (100.0%) | 701 (96.0%) |
Income Below Poverty Among Married-Couple Families in Hinsdale
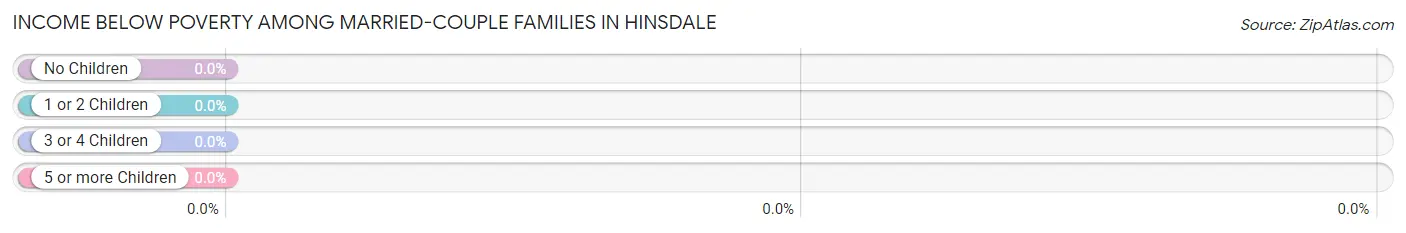
| Children | Above Poverty | Below Poverty |
| No Children | 330 (100.0%) | 0 (0.0%) |
| 1 or 2 Children | 101 (100.0%) | 0 (0.0%) |
| 3 or 4 Children | 13 (100.0%) | 0 (0.0%) |
| 5 or more Children | 0 (0.0%) | 0 (0.0%) |
| Total | 444 (100.0%) | 0 (0.0%) |
Income Below Poverty Among Single-Parent Households in Hinsdale
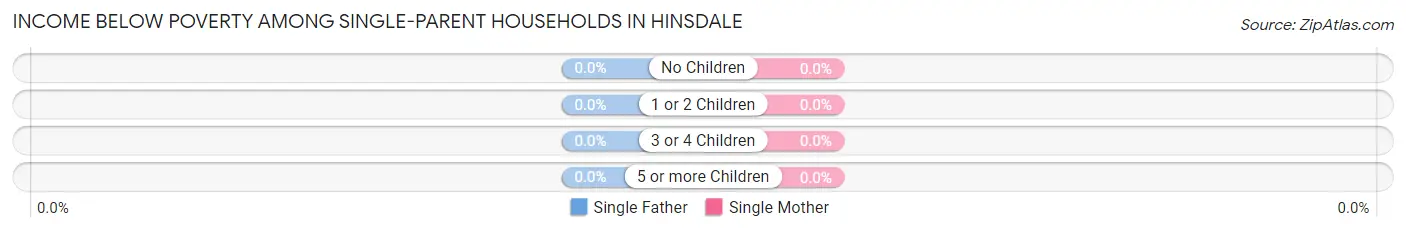
| Children | Single Father | Single Mother |
| No Children | 0 (0.0%) | 0 (0.0%) |
| 1 or 2 Children | 0 (0.0%) | 0 (0.0%) |
| 3 or 4 Children | 0 (0.0%) | 0 (0.0%) |
| 5 or more Children | 0 (0.0%) | 0 (0.0%) |
| Total | 0 (0.0%) | 0 (0.0%) |
Income Below Poverty Among Married-Couple vs Single-Parent Households in Hinsdale
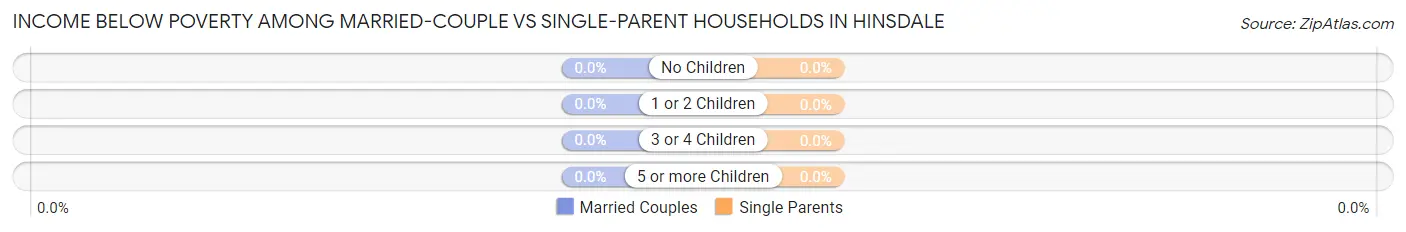
| Children | Married-Couple Families | Single-Parent Households |
| No Children | 0 (0.0%) | 0 (0.0%) |
| 1 or 2 Children | 0 (0.0%) | 0 (0.0%) |
| 3 or 4 Children | 0 (0.0%) | 0 (0.0%) |
| 5 or more Children | 0 (0.0%) | 0 (0.0%) |
| Total | 0 (0.0%) | 0 (0.0%) |
Race in Hinsdale
The most populous races in Hinsdale are White / Caucasian (1,351 | 94.3%), Two or more Races (74 | 5.2%), and Hawaiian / Pacific (7 | 0.5%).
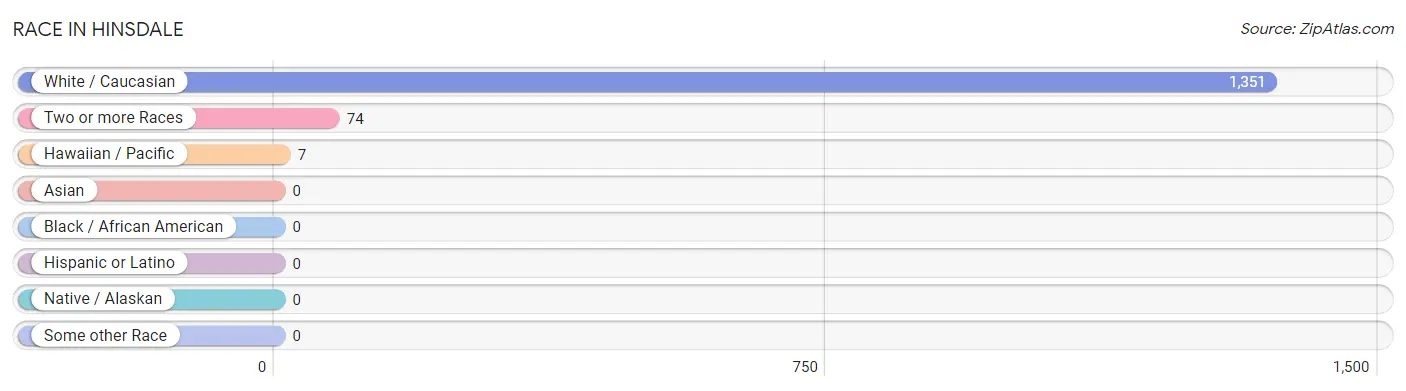
| Race | # Population | % Population |
| Asian | 0 | 0.0% |
| Black / African American | 0 | 0.0% |
| Hawaiian / Pacific | 7 | 0.5% |
| Hispanic or Latino | 0 | 0.0% |
| Native / Alaskan | 0 | 0.0% |
| White / Caucasian | 1,351 | 94.3% |
| Two or more Races | 74 | 5.2% |
| Some other Race | 0 | 0.0% |
| Total | 1,432 | 100.0% |
Ancestry in Hinsdale
The most populous ancestries reported in Hinsdale are French (275 | 19.2%), Irish (271 | 18.9%), English (248 | 17.3%), Ukrainian (147 | 10.3%), and Russian (112 | 7.8%), together accounting for 73.5% of all Hinsdale residents.
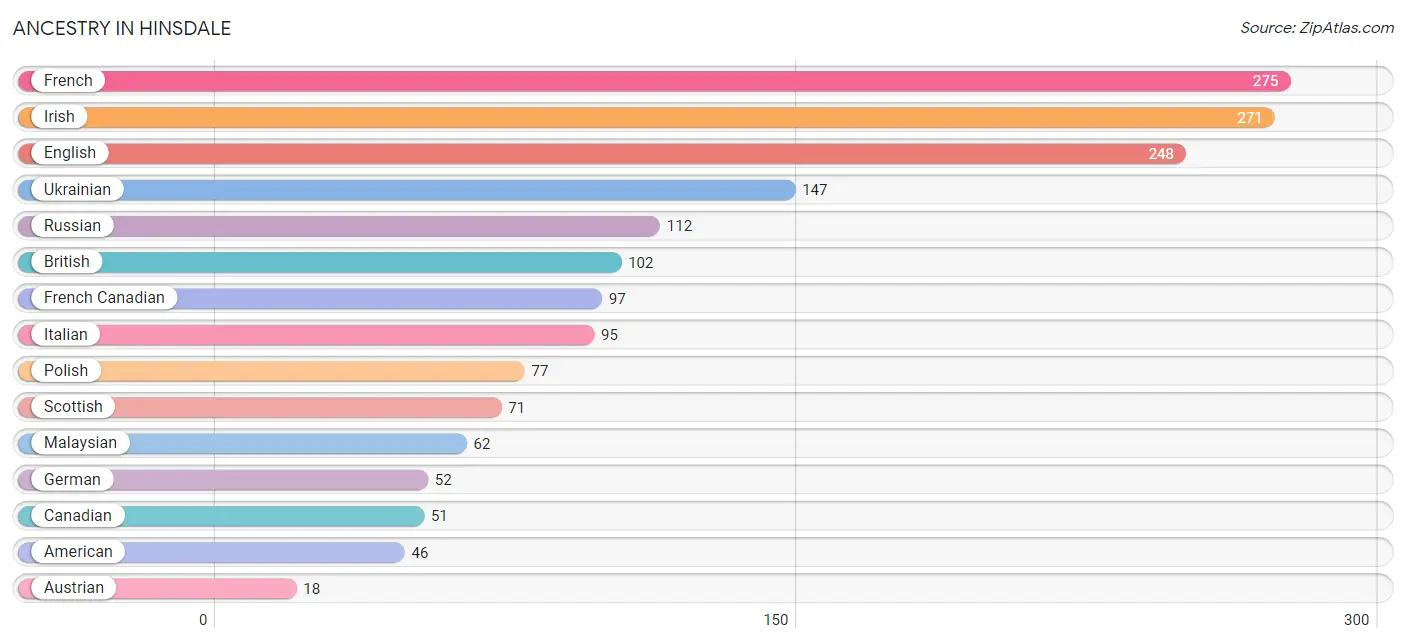
| Ancestry | # Population | % Population |
| American | 46 | 3.2% |
| Austrian | 18 | 1.3% |
| British | 102 | 7.1% |
| Cajun | 13 | 0.9% |
| Canadian | 51 | 3.6% |
| Dutch | 6 | 0.4% |
| English | 248 | 17.3% |
| European | 13 | 0.9% |
| French | 275 | 19.2% |
| French Canadian | 97 | 6.8% |
| German | 52 | 3.6% |
| Irish | 271 | 18.9% |
| Italian | 95 | 6.6% |
| Malaysian | 62 | 4.3% |
| Polish | 77 | 5.4% |
| Russian | 112 | 7.8% |
| Scottish | 71 | 5.0% |
| Swedish | 11 | 0.8% |
| Ukrainian | 147 | 10.3% | View All 19 Rows |
Immigrants in Hinsdale

| Immigration Origin | # Population | % Population | View All 0 Rows |
Sex and Age in Hinsdale
Sex and Age in Hinsdale
The most populous age groups in Hinsdale are 60 to 64 Years (100 | 14.2%) for men and 80 to 84 Years (149 | 20.4%) for women.
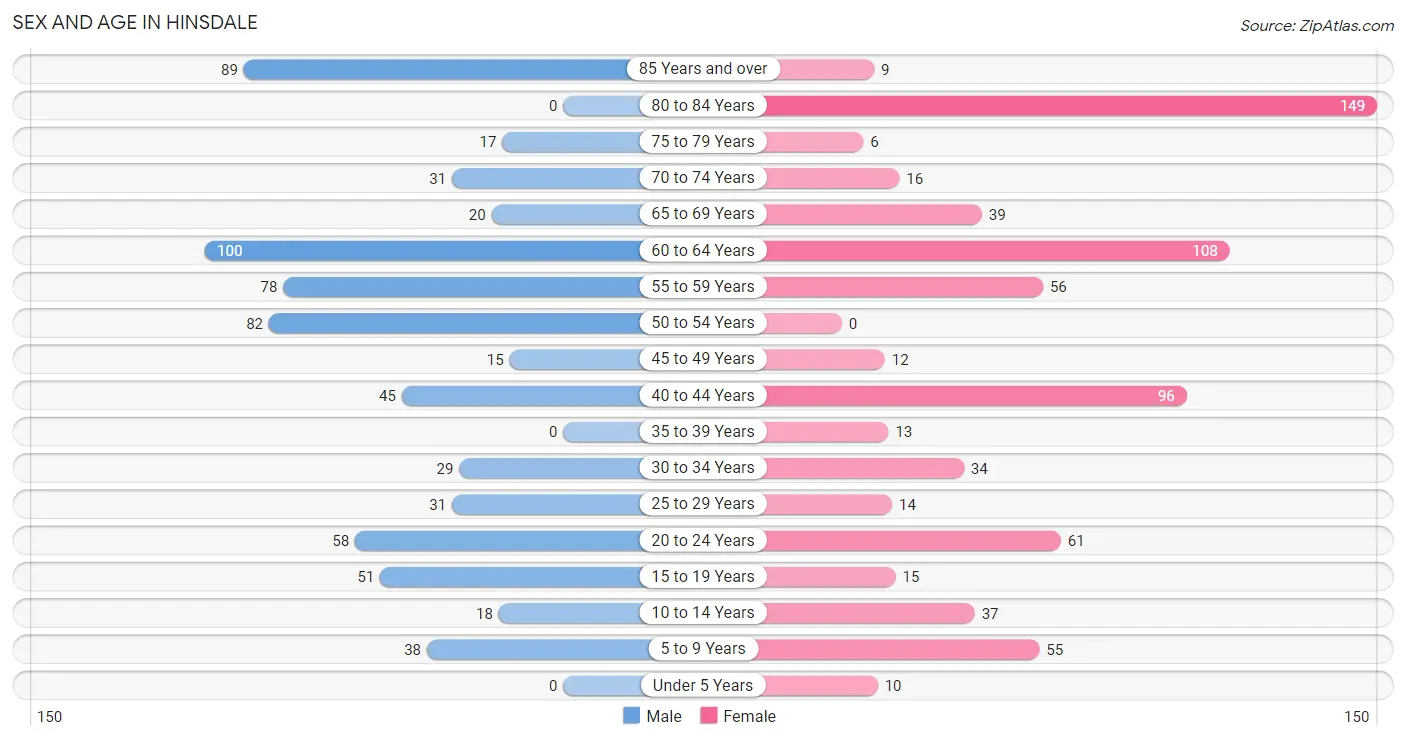
| Age Bracket | Male | Female |
| Under 5 Years | 0 (0.0%) | 10 (1.4%) |
| 5 to 9 Years | 38 (5.4%) | 55 (7.5%) |
| 10 to 14 Years | 18 (2.6%) | 37 (5.1%) |
| 15 to 19 Years | 51 (7.3%) | 15 (2.1%) |
| 20 to 24 Years | 58 (8.3%) | 61 (8.4%) |
| 25 to 29 Years | 31 (4.4%) | 14 (1.9%) |
| 30 to 34 Years | 29 (4.1%) | 34 (4.7%) |
| 35 to 39 Years | 0 (0.0%) | 13 (1.8%) |
| 40 to 44 Years | 45 (6.4%) | 96 (13.2%) |
| 45 to 49 Years | 15 (2.1%) | 12 (1.6%) |
| 50 to 54 Years | 82 (11.7%) | 0 (0.0%) |
| 55 to 59 Years | 78 (11.1%) | 56 (7.7%) |
| 60 to 64 Years | 100 (14.2%) | 108 (14.8%) |
| 65 to 69 Years | 20 (2.9%) | 39 (5.3%) |
| 70 to 74 Years | 31 (4.4%) | 16 (2.2%) |
| 75 to 79 Years | 17 (2.4%) | 6 (0.8%) |
| 80 to 84 Years | 0 (0.0%) | 149 (20.4%) |
| 85 Years and over | 89 (12.7%) | 9 (1.2%) |
| Total | 702 (100.0%) | 730 (100.0%) |
Families and Households in Hinsdale
Median Family Size in Hinsdale
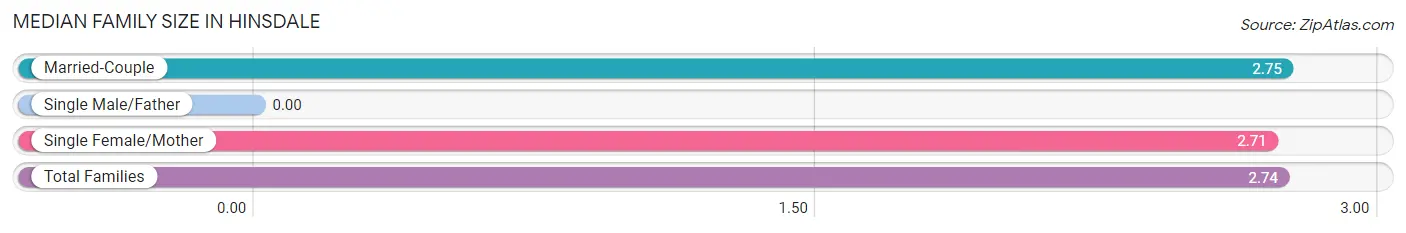
| Family Type | # Families | Family Size |
| Married-Couple | 444 (95.5%) | 2.75 |
| Single Male/Father | 0 (0.0%) | - |
| Single Female/Mother | 21 (4.5%) | 2.71 |
| Total Families | 465 (100.0%) | 2.74 |
Median Household Size in Hinsdale
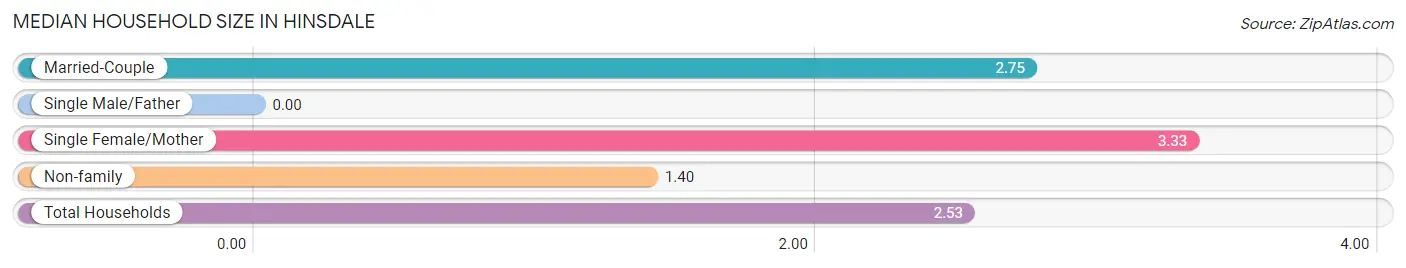
| Household Type | # Households | Household Size |
| Married-Couple | 444 (78.3%) | 2.75 |
| Single Male/Father | 0 (0.0%) | - |
| Single Female/Mother | 21 (3.7%) | 3.33 |
| Non-family | 102 (18.0%) | 1.40 |
| Total Households | 567 (100.0%) | 2.53 |
Household Size by Marriage Status in Hinsdale
Out of a total of 567 households in Hinsdale, 465 (82.0%) are family households, while 102 (18.0%) are nonfamily households. The most numerous type of family households are 2-person households, comprising 238, and the most common type of nonfamily households are 1-person households, comprising 79.
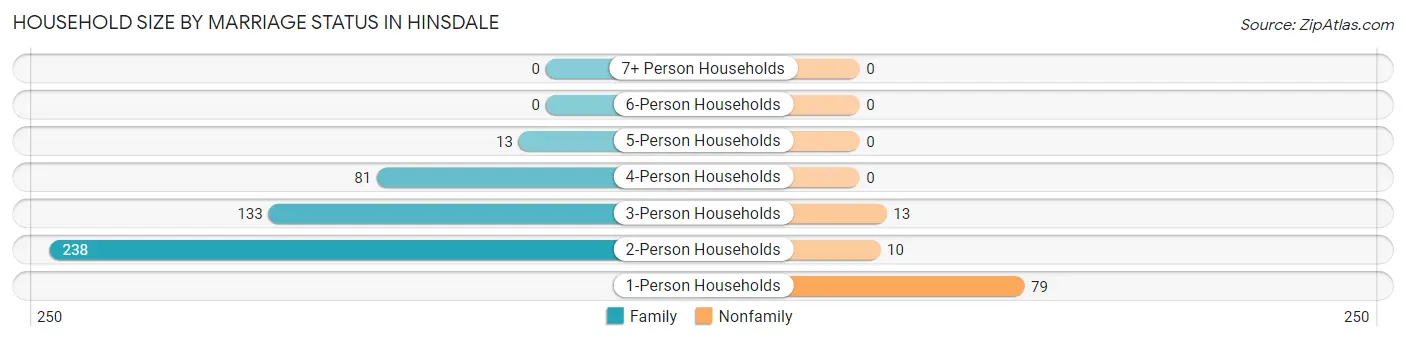
| Household Size | Family Households | Nonfamily Households |
| 1-Person Households | - | 79 (13.9%) |
| 2-Person Households | 238 (42.0%) | 10 (1.8%) |
| 3-Person Households | 133 (23.5%) | 13 (2.3%) |
| 4-Person Households | 81 (14.3%) | 0 (0.0%) |
| 5-Person Households | 13 (2.3%) | 0 (0.0%) |
| 6-Person Households | 0 (0.0%) | 0 (0.0%) |
| 7+ Person Households | 0 (0.0%) | 0 (0.0%) |
| Total | 465 (82.0%) | 102 (18.0%) |
Female Fertility in Hinsdale
Fertility by Age in Hinsdale
| Age Bracket | Women with Births | Births / 1,000 Women |
| 15 to 19 years | 0 (0.0%) | 0.0 |
| 20 to 34 years | 0 (0.0%) | 0.0 |
| 35 to 50 years | 0 (0.0%) | 0.0 |
| Total | 0 (0.0%) | 0.0 |
Fertility by Age by Marriage Status in Hinsdale
| Age Bracket | Married | Unmarried |
| 15 to 19 years | 0 (0.0%) | 0 (0.0%) |
| 20 to 34 years | 0 (0.0%) | 0 (0.0%) |
| 35 to 50 years | 0 (0.0%) | 0 (0.0%) |
| Total | 0 (0.0%) | 0 (0.0%) |
Fertility by Education in Hinsdale
| Educational Attainment | Women with Births | Births / 1,000 Women |
| Less than High School | 0 (0.0%) | 0.0 |
| High School Diploma | 0 (0.0%) | 0.0 |
| College or Associate's Degree | 0 (0.0%) | 0.0 |
| Bachelor's Degree | 0 (0.0%) | 0.0 |
| Graduate Degree | 0 (0.0%) | 0.0 |
| Total | 0 (0.0%) | 0.0 |
Fertility by Education by Marriage Status in Hinsdale
| Educational Attainment | Married | Unmarried |
| Less than High School | 0 (0.0%) | 0 (0.0%) |
| High School Diploma | 0 (0.0%) | 0 (0.0%) |
| College or Associate's Degree | 0 (0.0%) | 0 (0.0%) |
| Bachelor's Degree | 0 (0.0%) | 0 (0.0%) |
| Graduate Degree | 0 (0.0%) | 0 (0.0%) |
| Total | 0 (0.0%) | 0 (0.0%) |
Employment Characteristics in Hinsdale
Employment by Class of Employer in Hinsdale
Among the 736 employed individuals in Hinsdale, private company employees (467 | 63.4%), local government employees (103 | 14.0%), and not-for-profit organizations (95 | 12.9%) make up the most common classes of employment.
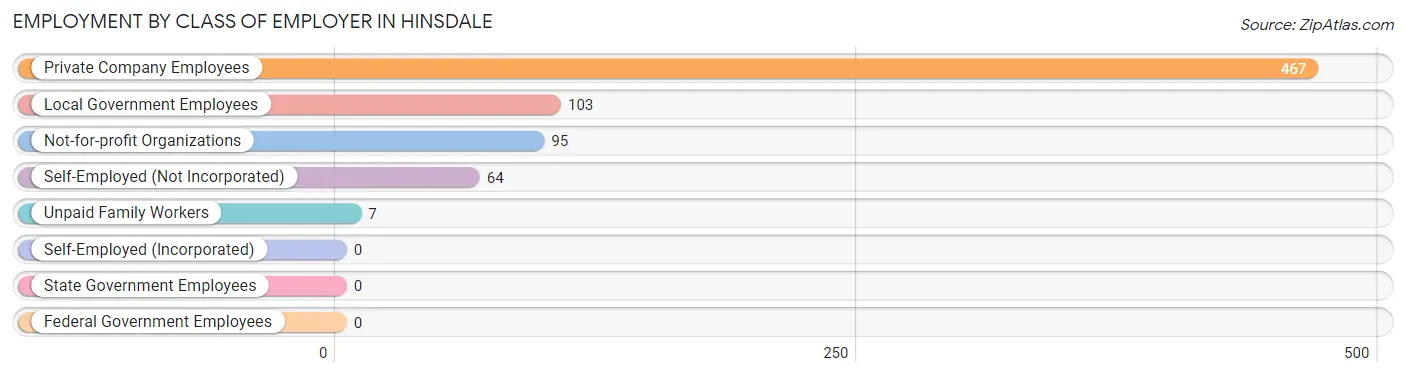
| Employer Class | # Employees | % Employees |
| Private Company Employees | 467 | 63.4% |
| Self-Employed (Incorporated) | 0 | 0.0% |
| Self-Employed (Not Incorporated) | 64 | 8.7% |
| Not-for-profit Organizations | 95 | 12.9% |
| Local Government Employees | 103 | 14.0% |
| State Government Employees | 0 | 0.0% |
| Federal Government Employees | 0 | 0.0% |
| Unpaid Family Workers | 7 | 0.9% |
| Total | 736 | 100.0% |
Employment Status by Age in Hinsdale
According to the labor force statistics for Hinsdale, out of the total population over 16 years of age (1,272), 62.4% or 794 individuals are in the labor force, with 1.8% or 14 of them unemployed. The age group with the highest labor force participation rate is 20 to 24 years, with 100.0% or 119 individuals in the labor force. Within the labor force, the 20 to 24 years age range has the highest percentage of unemployed individuals, with 11.8% or 14 of them being unemployed.
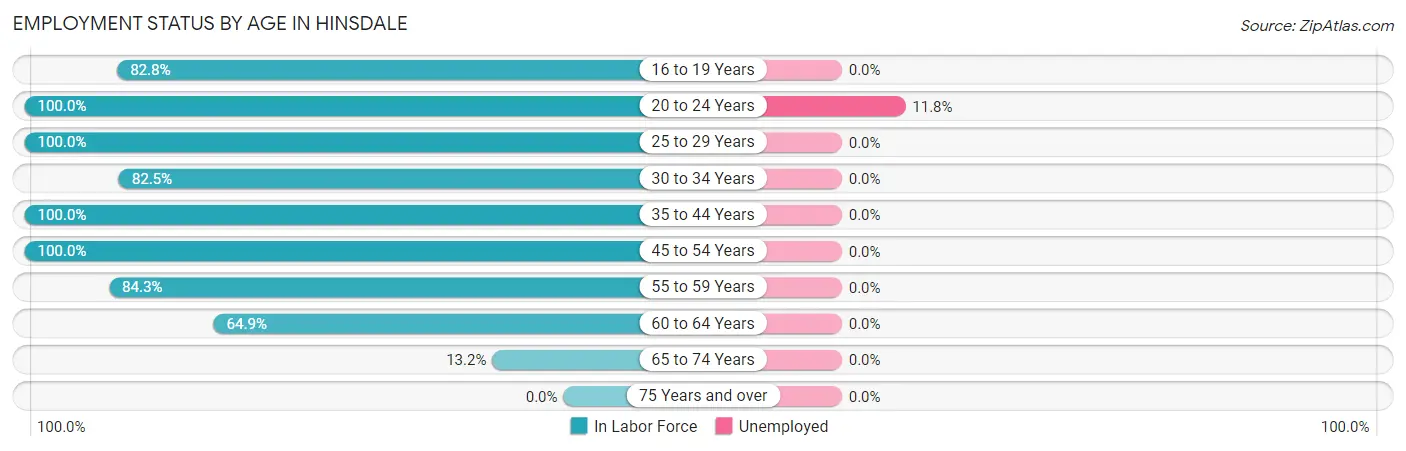
| Age Bracket | In Labor Force | Unemployed |
| 16 to 19 Years | 53 (82.8%) | 0 (0.0%) |
| 20 to 24 Years | 119 (100.0%) | 14 (11.8%) |
| 25 to 29 Years | 45 (100.0%) | 0 (0.0%) |
| 30 to 34 Years | 52 (82.5%) | 0 (0.0%) |
| 35 to 44 Years | 154 (100.0%) | 0 (0.0%) |
| 45 to 54 Years | 109 (100.0%) | 0 (0.0%) |
| 55 to 59 Years | 113 (84.3%) | 0 (0.0%) |
| 60 to 64 Years | 135 (64.9%) | 0 (0.0%) |
| 65 to 74 Years | 14 (13.2%) | 0 (0.0%) |
| 75 Years and over | 0 (0.0%) | 0 (0.0%) |
| Total | 794 (62.4%) | 14 (1.8%) |
Employment Status by Educational Attainment in Hinsdale
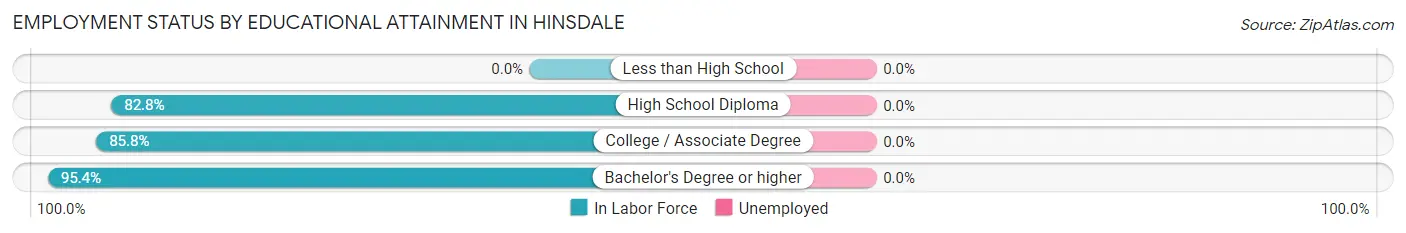
| Educational Attainment | In Labor Force | Unemployed |
| Less than High School | 0 (0.0%) | 0 (0.0%) |
| High School Diploma | 231 (82.8%) | 0 (0.0%) |
| College / Associate Degree | 212 (85.8%) | 0 (0.0%) |
| Bachelor's Degree or higher | 165 (95.4%) | 0 (0.0%) |
| Total | 608 (85.3%) | 0 (0.0%) |
Employment Occupations by Sex in Hinsdale
Management, Business, Science and Arts Occupations
The most common Management, Business, Science and Arts occupations in Hinsdale are Business & Financial (80 | 10.3%), Community & Social Service (74 | 9.5%), Education Instruction & Library (61 | 7.8%), Management (26 | 3.3%), and Health Diagnosing & Treating (26 | 3.3%).
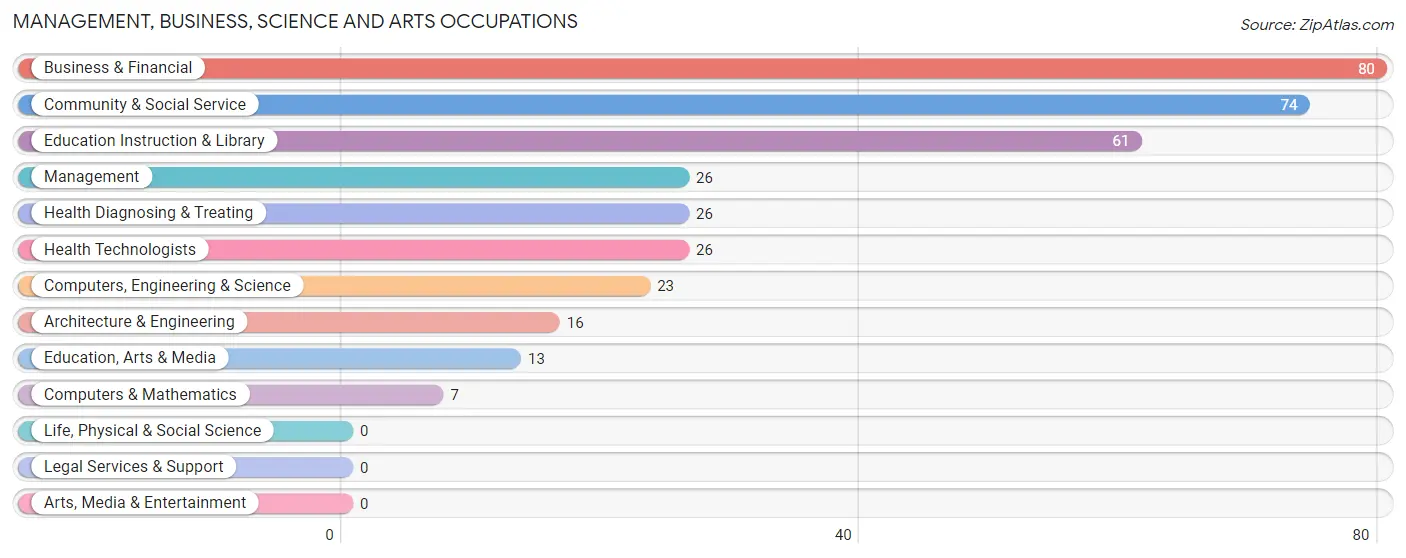
Management, Business, Science and Arts Occupations by Sex
Within the Management, Business, Science and Arts occupations in Hinsdale, the most male-oriented occupations are Computers, Engineering & Science (100.0%), Computers & Mathematics (100.0%), and Architecture & Engineering (100.0%), while the most female-oriented occupations are Business & Financial (100.0%), Education, Arts & Media (100.0%), and Community & Social Service (55.4%).
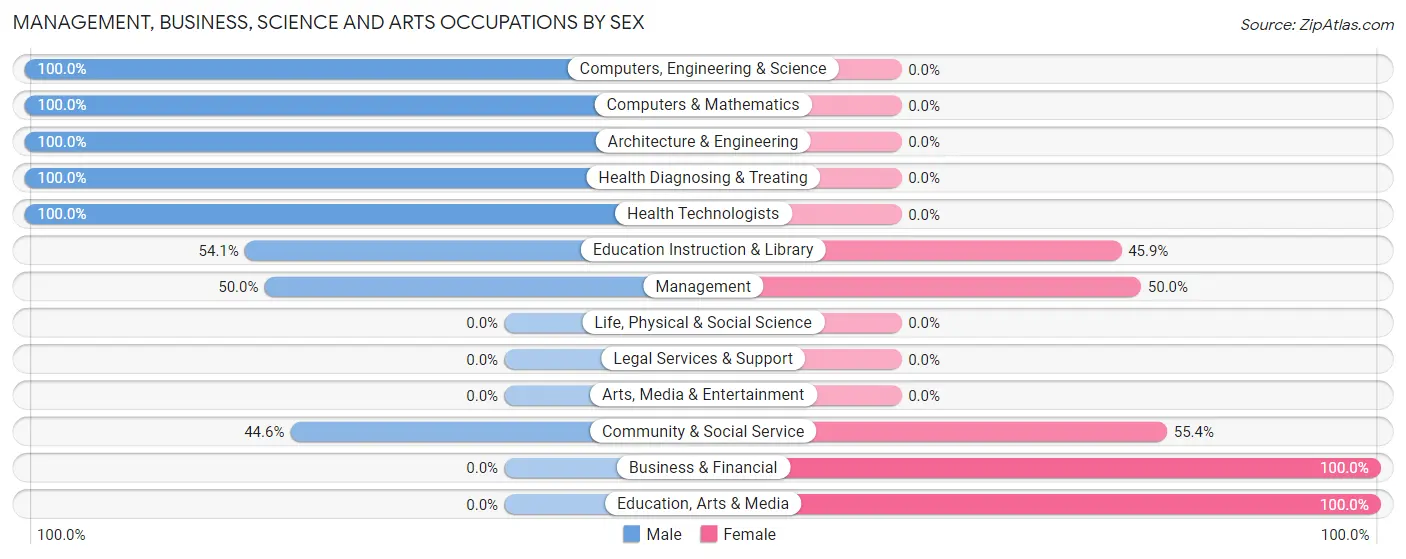
| Occupation | Male | Female |
| Management | 13 (50.0%) | 13 (50.0%) |
| Business & Financial | 0 (0.0%) | 80 (100.0%) |
| Computers, Engineering & Science | 23 (100.0%) | 0 (0.0%) |
| Computers & Mathematics | 7 (100.0%) | 0 (0.0%) |
| Architecture & Engineering | 16 (100.0%) | 0 (0.0%) |
| Life, Physical & Social Science | 0 (0.0%) | 0 (0.0%) |
| Community & Social Service | 33 (44.6%) | 41 (55.4%) |
| Education, Arts & Media | 0 (0.0%) | 13 (100.0%) |
| Legal Services & Support | 0 (0.0%) | 0 (0.0%) |
| Education Instruction & Library | 33 (54.1%) | 28 (45.9%) |
| Arts, Media & Entertainment | 0 (0.0%) | 0 (0.0%) |
| Health Diagnosing & Treating | 26 (100.0%) | 0 (0.0%) |
| Health Technologists | 26 (100.0%) | 0 (0.0%) |
| Total (Category) | 95 (41.5%) | 134 (58.5%) |
| Total (Overall) | 440 (56.4%) | 340 (43.6%) |
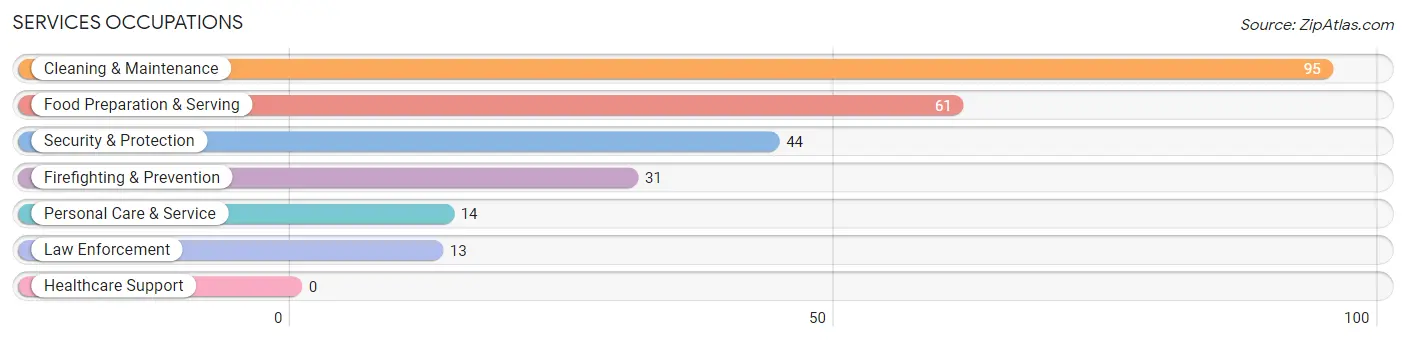
Services Occupations
The most common Services occupations in Hinsdale are Cleaning & Maintenance (95 | 12.2%), Food Preparation & Serving (61 | 7.8%), Security & Protection (44 | 5.6%), Firefighting & Prevention (31 | 4.0%), and Personal Care & Service (14 | 1.8%).
Services Occupations by Sex
Within the Services occupations in Hinsdale, the most male-oriented occupations are Law Enforcement (100.0%), Cleaning & Maintenance (100.0%), and Security & Protection (29.5%), while the most female-oriented occupations are Firefighting & Prevention (100.0%), Food Preparation & Serving (100.0%), and Personal Care & Service (100.0%).
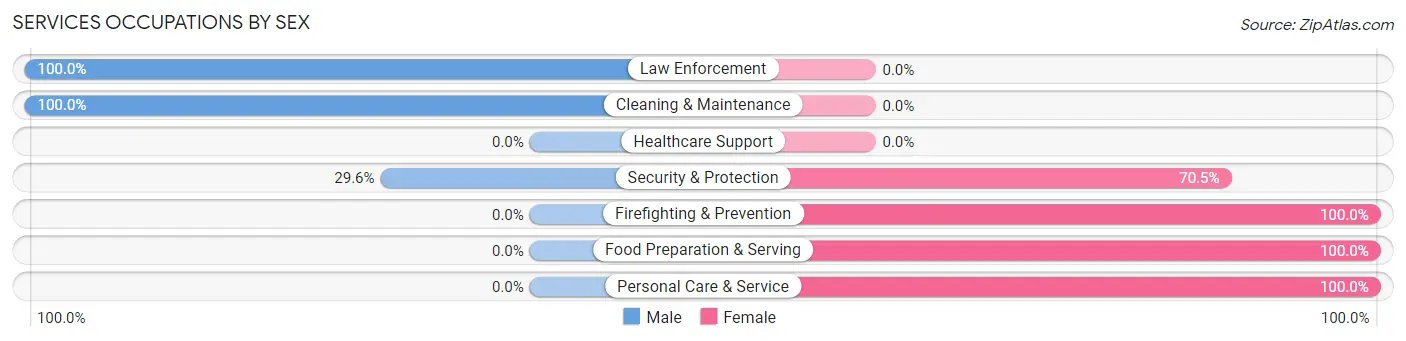
| Occupation | Male | Female |
| Healthcare Support | 0 (0.0%) | 0 (0.0%) |
| Security & Protection | 13 (29.5%) | 31 (70.5%) |
| Firefighting & Prevention | 0 (0.0%) | 31 (100.0%) |
| Law Enforcement | 13 (100.0%) | 0 (0.0%) |
| Food Preparation & Serving | 0 (0.0%) | 61 (100.0%) |
| Cleaning & Maintenance | 95 (100.0%) | 0 (0.0%) |
| Personal Care & Service | 0 (0.0%) | 14 (100.0%) |
| Total (Category) | 108 (50.5%) | 106 (49.5%) |
| Total (Overall) | 440 (56.4%) | 340 (43.6%) |
Sales and Office Occupations
The most common Sales and Office occupations in Hinsdale are Sales & Related (107 | 13.7%), and Office & Administration (21 | 2.7%).
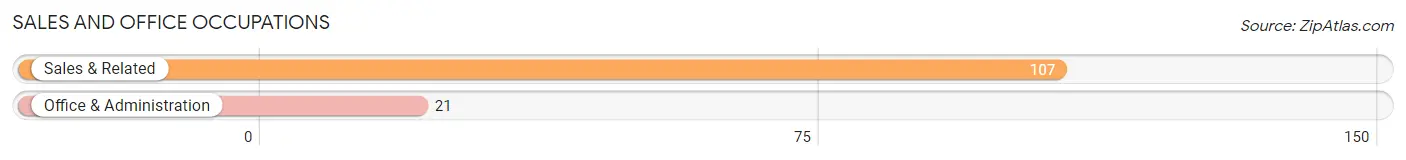
Sales and Office Occupations by Sex
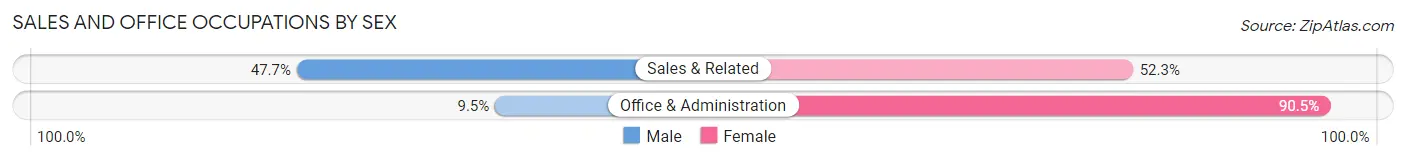
| Occupation | Male | Female |
| Sales & Related | 51 (47.7%) | 56 (52.3%) |
| Office & Administration | 2 (9.5%) | 19 (90.5%) |
| Total (Category) | 53 (41.4%) | 75 (58.6%) |
| Total (Overall) | 440 (56.4%) | 340 (43.6%) |
Natural Resources, Construction and Maintenance Occupations
The most common Natural Resources, Construction and Maintenance occupations in Hinsdale are Construction & Extraction (59 | 7.6%), Installation, Maintenance & Repair (34 | 4.4%), and Farming, Fishing & Forestry (2 | 0.3%).
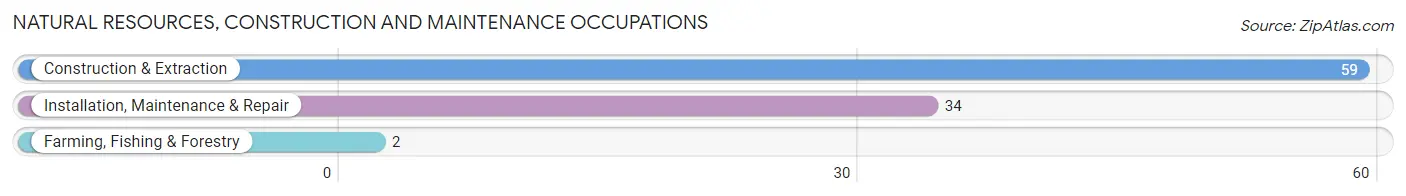
Natural Resources, Construction and Maintenance Occupations by Sex

| Occupation | Male | Female |
| Farming, Fishing & Forestry | 0 (0.0%) | 2 (100.0%) |
| Construction & Extraction | 59 (100.0%) | 0 (0.0%) |
| Installation, Maintenance & Repair | 34 (100.0%) | 0 (0.0%) |
| Total (Category) | 93 (97.9%) | 2 (2.1%) |
| Total (Overall) | 440 (56.4%) | 340 (43.6%) |
Production, Transportation and Moving Occupations
The most common Production, Transportation and Moving occupations in Hinsdale are Production (88 | 11.3%), and Transportation (26 | 3.3%).
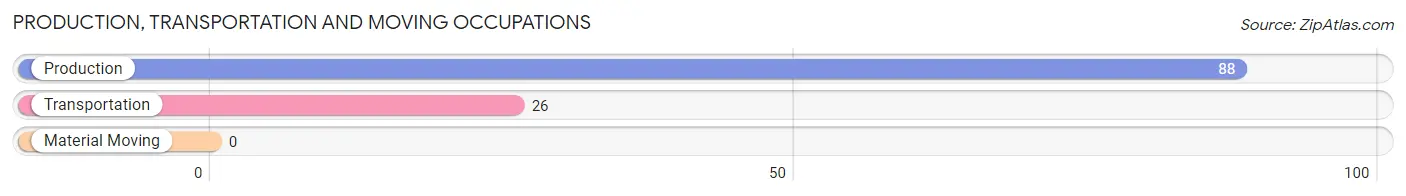
Production, Transportation and Moving Occupations by Sex
| Occupation | Male | Female |
| Production | 65 (73.9%) | 23 (26.1%) |
| Transportation | 26 (100.0%) | 0 (0.0%) |
| Material Moving | 0 (0.0%) | 0 (0.0%) |
| Total (Category) | 91 (79.8%) | 23 (20.2%) |
| Total (Overall) | 440 (56.4%) | 340 (43.6%) |
Employment Industries by Sex in Hinsdale
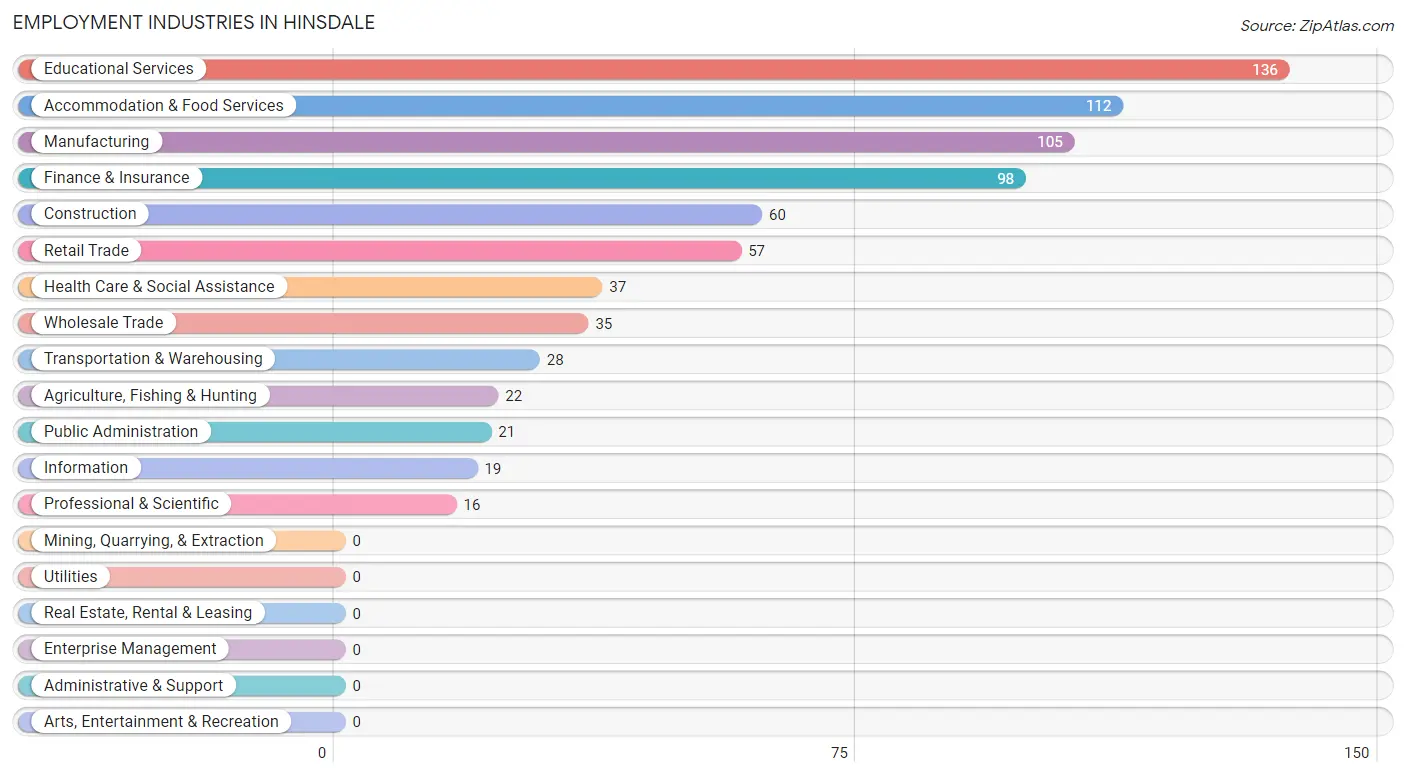
Employment Industries in Hinsdale
The major employment industries in Hinsdale include Educational Services (136 | 17.4%), Accommodation & Food Services (112 | 14.4%), Manufacturing (105 | 13.5%), Finance & Insurance (98 | 12.6%), and Construction (60 | 7.7%).
Employment Industries by Sex in Hinsdale
The Hinsdale industries that see more men than women are Wholesale Trade (100.0%), Transportation & Warehousing (100.0%), and Professional & Scientific (100.0%), whereas the industries that tend to have a higher number of women are Agriculture, Fishing & Hunting (100.0%), Information (100.0%), and Finance & Insurance (100.0%).
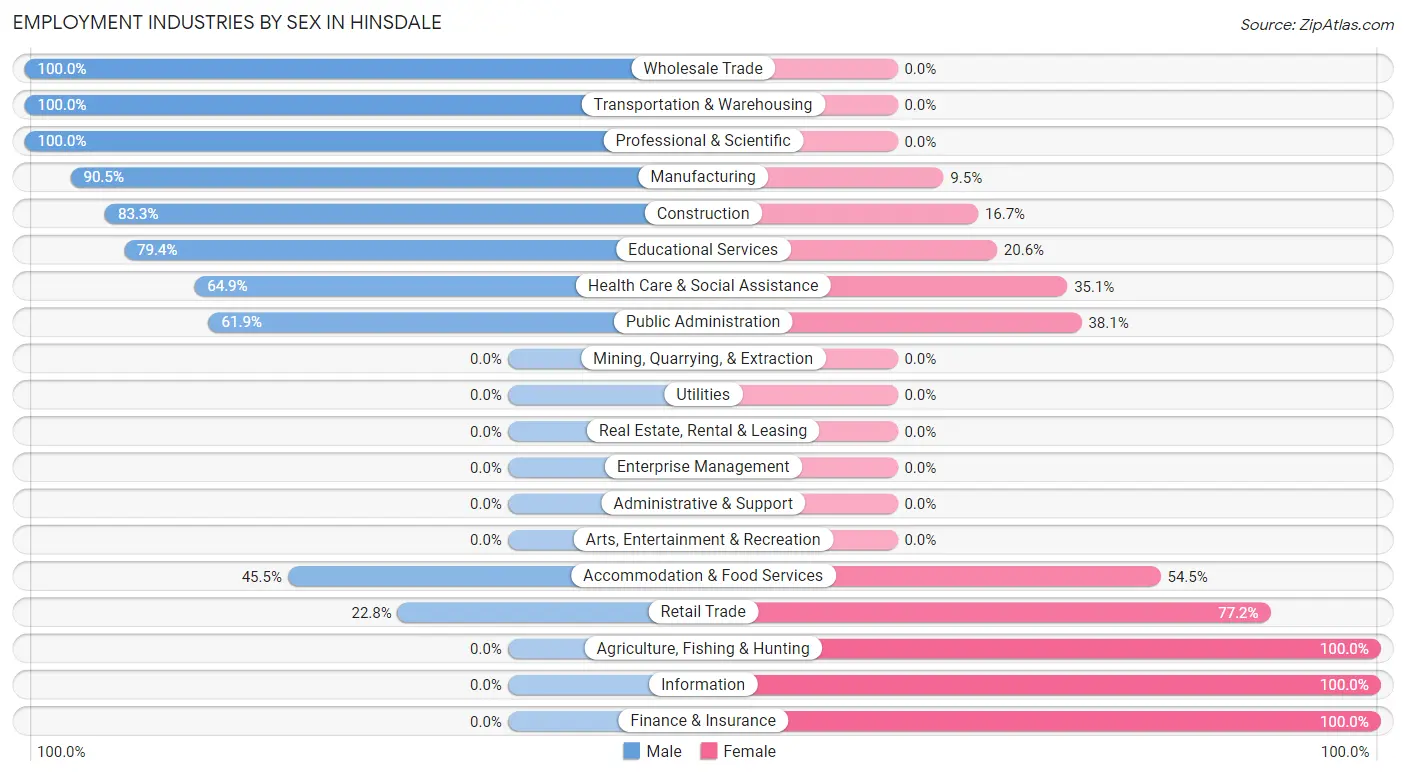
| Industry | Male | Female |
| Agriculture, Fishing & Hunting | 0 (0.0%) | 22 (100.0%) |
| Mining, Quarrying, & Extraction | 0 (0.0%) | 0 (0.0%) |
| Construction | 50 (83.3%) | 10 (16.7%) |
| Manufacturing | 95 (90.5%) | 10 (9.5%) |
| Wholesale Trade | 35 (100.0%) | 0 (0.0%) |
| Retail Trade | 13 (22.8%) | 44 (77.2%) |
| Transportation & Warehousing | 28 (100.0%) | 0 (0.0%) |
| Utilities | 0 (0.0%) | 0 (0.0%) |
| Information | 0 (0.0%) | 19 (100.0%) |
| Finance & Insurance | 0 (0.0%) | 98 (100.0%) |
| Real Estate, Rental & Leasing | 0 (0.0%) | 0 (0.0%) |
| Professional & Scientific | 16 (100.0%) | 0 (0.0%) |
| Enterprise Management | 0 (0.0%) | 0 (0.0%) |
| Administrative & Support | 0 (0.0%) | 0 (0.0%) |
| Educational Services | 108 (79.4%) | 28 (20.6%) |
| Health Care & Social Assistance | 24 (64.9%) | 13 (35.1%) |
| Arts, Entertainment & Recreation | 0 (0.0%) | 0 (0.0%) |
| Accommodation & Food Services | 51 (45.5%) | 61 (54.5%) |
| Public Administration | 13 (61.9%) | 8 (38.1%) |
| Total | 440 (56.4%) | 340 (43.6%) |
Education in Hinsdale
School Enrollment in Hinsdale
The most common levels of schooling among the 155 students in Hinsdale are nursery / preschool (36 | 23.2%), elementary school (36 | 23.2%), and middle school (30 | 19.4%).
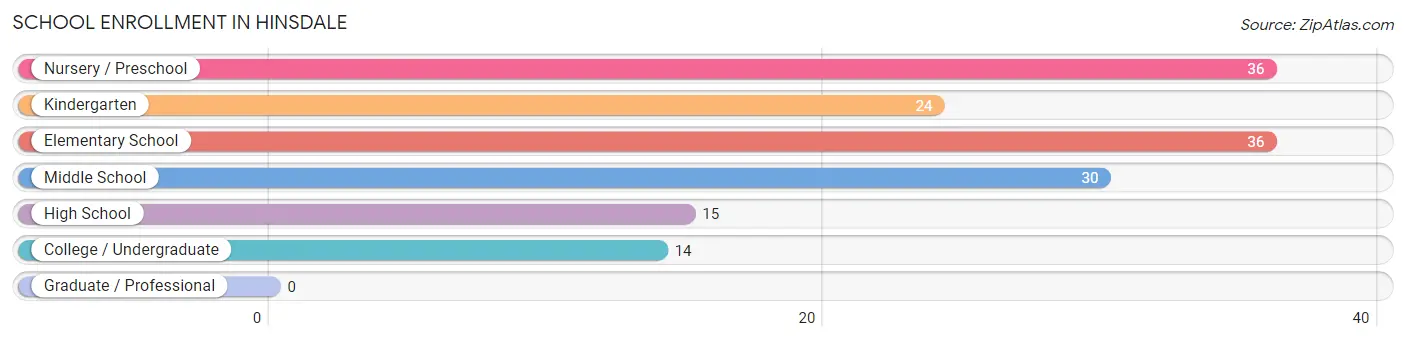
| School Level | # Students | % Students |
| Nursery / Preschool | 36 | 23.2% |
| Kindergarten | 24 | 15.5% |
| Elementary School | 36 | 23.2% |
| Middle School | 30 | 19.4% |
| High School | 15 | 9.7% |
| College / Undergraduate | 14 | 9.0% |
| Graduate / Professional | 0 | 0.0% |
| Total | 155 | 100.0% |
School Enrollment by Age by Funding Source in Hinsdale
Out of a total of 155 students who are enrolled in schools in Hinsdale, 27 (17.4%) attend a private institution, while the remaining 128 (82.6%) are enrolled in public schools. The age group of 20 to 24 year olds has the highest likelihood of being enrolled in private schools, with 14 (100.0% in the age bracket) enrolled. Conversely, the age group of 10 to 14 year olds has the lowest likelihood of being enrolled in a private school, with 42 (100.0% in the age bracket) attending a public institution.
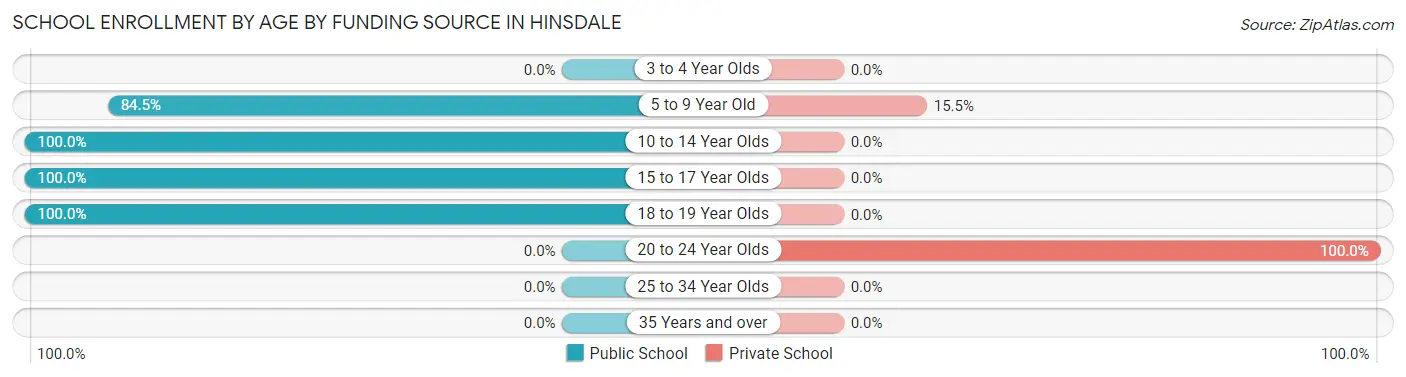
| Age Bracket | Public School | Private School |
| 3 to 4 Year Olds | 0 (0.0%) | 0 (0.0%) |
| 5 to 9 Year Old | 71 (84.5%) | 13 (15.5%) |
| 10 to 14 Year Olds | 42 (100.0%) | 0 (0.0%) |
| 15 to 17 Year Olds | 4 (100.0%) | 0 (0.0%) |
| 18 to 19 Year Olds | 11 (100.0%) | 0 (0.0%) |
| 20 to 24 Year Olds | 0 (0.0%) | 14 (100.0%) |
| 25 to 34 Year Olds | 0 (0.0%) | 0 (0.0%) |
| 35 Years and over | 0 (0.0%) | 0 (0.0%) |
| Total | 128 (82.6%) | 27 (17.4%) |
Educational Attainment by Field of Study in Hinsdale
Education (89 | 44.3%), bio, nature & agricultural (28 | 13.9%), computers & mathematics (23 | 11.4%), arts & humanities (21 | 10.4%), and social sciences (20 | 10.0%) are the most common fields of study among 201 individuals in Hinsdale who have obtained a bachelor's degree or higher.
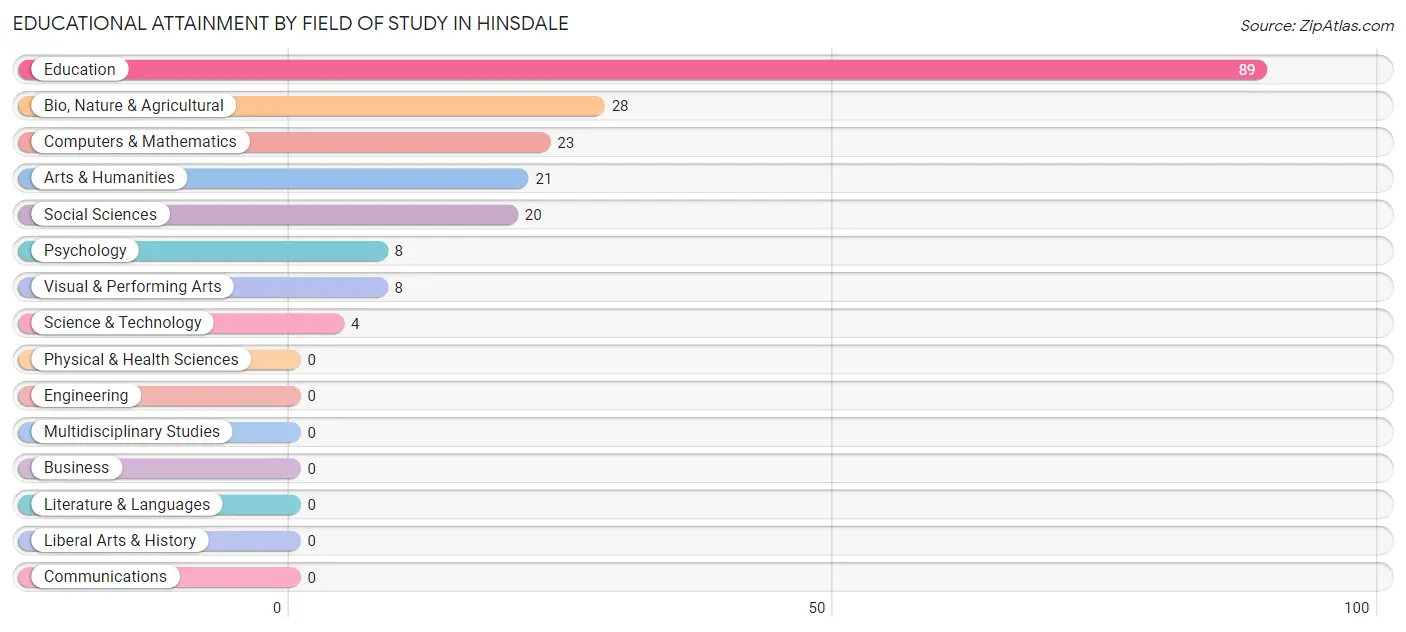
| Field of Study | # Graduates | % Graduates |
| Computers & Mathematics | 23 | 11.4% |
| Bio, Nature & Agricultural | 28 | 13.9% |
| Physical & Health Sciences | 0 | 0.0% |
| Psychology | 8 | 4.0% |
| Social Sciences | 20 | 10.0% |
| Engineering | 0 | 0.0% |
| Multidisciplinary Studies | 0 | 0.0% |
| Science & Technology | 4 | 2.0% |
| Business | 0 | 0.0% |
| Education | 89 | 44.3% |
| Literature & Languages | 0 | 0.0% |
| Liberal Arts & History | 0 | 0.0% |
| Visual & Performing Arts | 8 | 4.0% |
| Communications | 0 | 0.0% |
| Arts & Humanities | 21 | 10.4% |
| Total | 201 | 100.0% |
Transportation & Commute in Hinsdale
Vehicle Availability by Sex in Hinsdale
The most prevalent vehicle ownership categories in Hinsdale are males with 3 vehicles (167, accounting for 38.9%) and females with 3 vehicles (198, making up 54.4%).
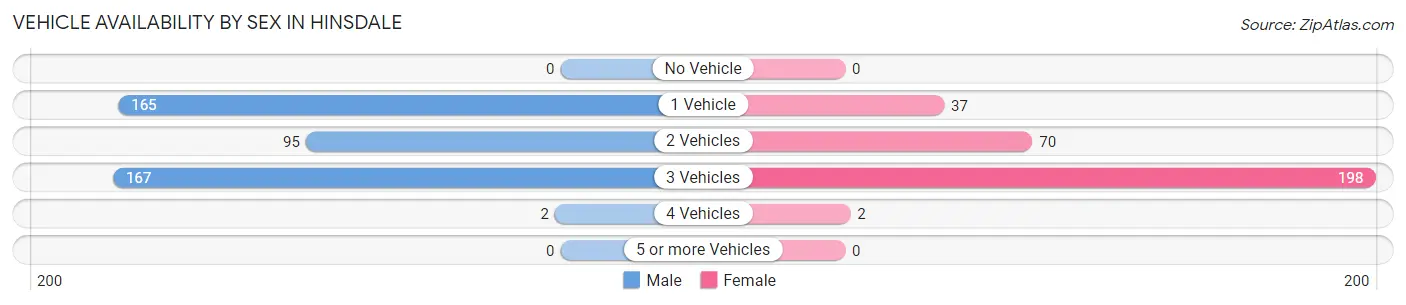
| Vehicles Available | Male | Female |
| No Vehicle | 0 (0.0%) | 0 (0.0%) |
| 1 Vehicle | 165 (38.5%) | 37 (12.0%) |
| 2 Vehicles | 95 (22.1%) | 70 (22.8%) |
| 3 Vehicles | 167 (38.9%) | 198 (64.5%) |
| 4 Vehicles | 2 (0.5%) | 2 (0.6%) |
| 5 or more Vehicles | 0 (0.0%) | 0 (0.0%) |
| Total | 429 (100.0%) | 307 (100.0%) |
Commute Time in Hinsdale
The most frequently occuring commute durations in Hinsdale are 15 to 19 minutes (152 commuters, 23.1%), less than 5 minutes (141 commuters, 21.4%), and 40 to 44 minutes (61 commuters, 9.3%).
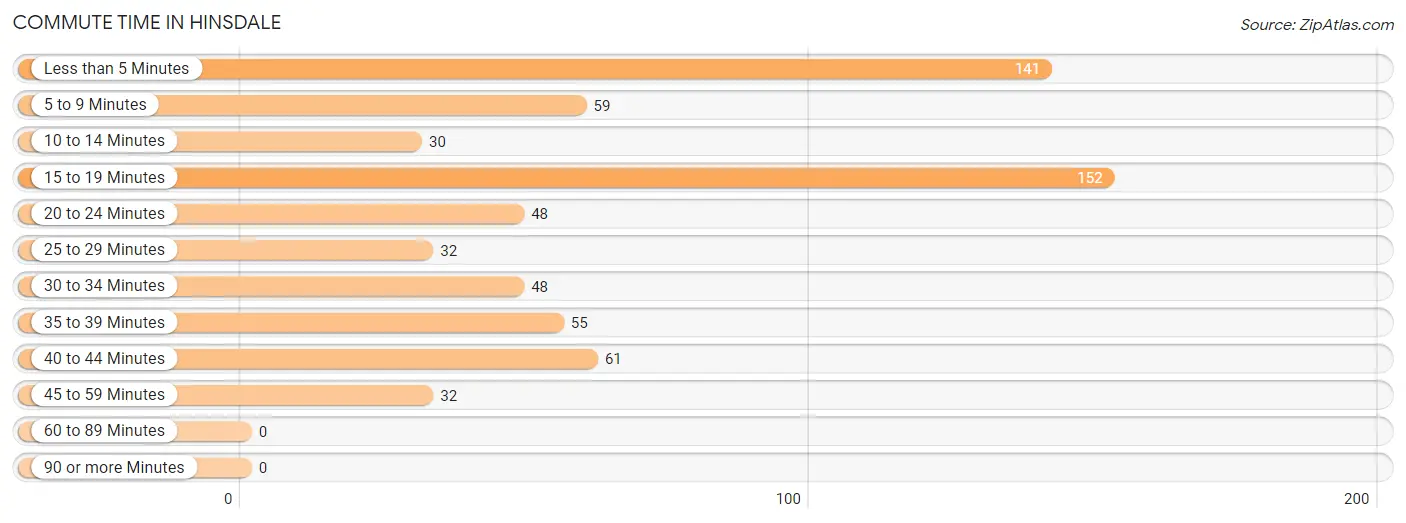
| Commute Time | # Commuters | % Commuters |
| Less than 5 Minutes | 141 | 21.4% |
| 5 to 9 Minutes | 59 | 9.0% |
| 10 to 14 Minutes | 30 | 4.6% |
| 15 to 19 Minutes | 152 | 23.1% |
| 20 to 24 Minutes | 48 | 7.3% |
| 25 to 29 Minutes | 32 | 4.9% |
| 30 to 34 Minutes | 48 | 7.3% |
| 35 to 39 Minutes | 55 | 8.4% |
| 40 to 44 Minutes | 61 | 9.3% |
| 45 to 59 Minutes | 32 | 4.9% |
| 60 to 89 Minutes | 0 | 0.0% |
| 90 or more Minutes | 0 | 0.0% |
Commute Time by Sex in Hinsdale
The most common commute times in Hinsdale are less than 5 minutes (104 commuters, 25.6%) for males and 15 to 19 minutes (89 commuters, 35.3%) for females.
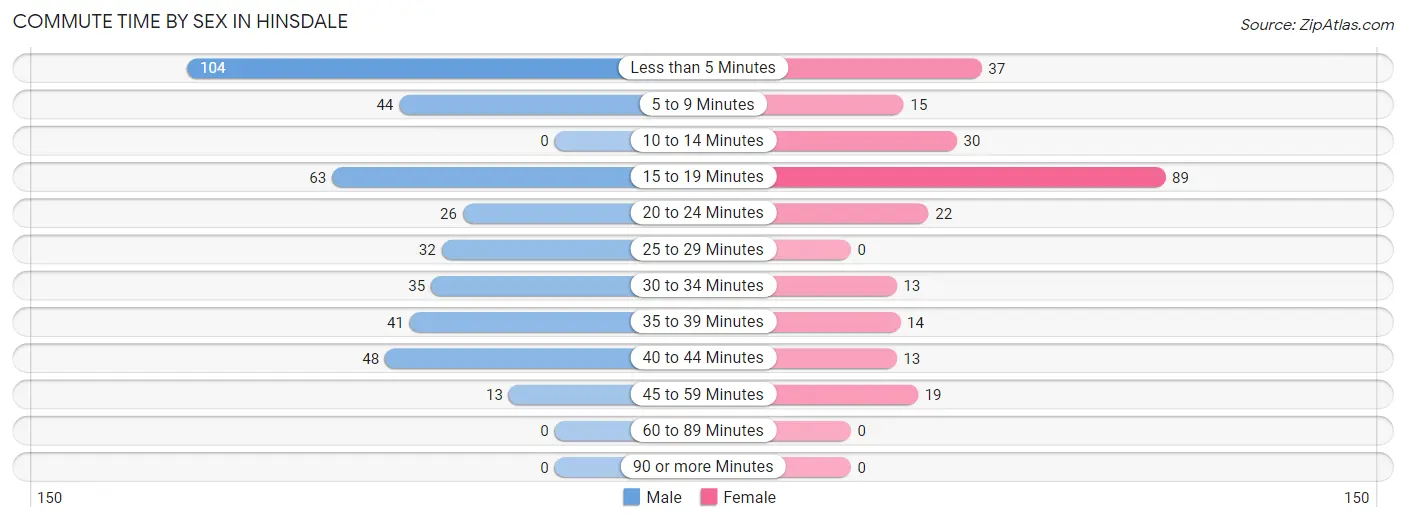
| Commute Time | Male | Female |
| Less than 5 Minutes | 104 (25.6%) | 37 (14.7%) |
| 5 to 9 Minutes | 44 (10.8%) | 15 (5.9%) |
| 10 to 14 Minutes | 0 (0.0%) | 30 (11.9%) |
| 15 to 19 Minutes | 63 (15.5%) | 89 (35.3%) |
| 20 to 24 Minutes | 26 (6.4%) | 22 (8.7%) |
| 25 to 29 Minutes | 32 (7.9%) | 0 (0.0%) |
| 30 to 34 Minutes | 35 (8.6%) | 13 (5.2%) |
| 35 to 39 Minutes | 41 (10.1%) | 14 (5.6%) |
| 40 to 44 Minutes | 48 (11.8%) | 13 (5.2%) |
| 45 to 59 Minutes | 13 (3.2%) | 19 (7.5%) |
| 60 to 89 Minutes | 0 (0.0%) | 0 (0.0%) |
| 90 or more Minutes | 0 (0.0%) | 0 (0.0%) |
Time of Departure to Work by Sex in Hinsdale
The most frequent times of departure to work in Hinsdale are 6:30 AM to 6:59 AM (78, 19.2%) for males and 12:00 PM to 3:59 PM (61, 24.2%) for females.
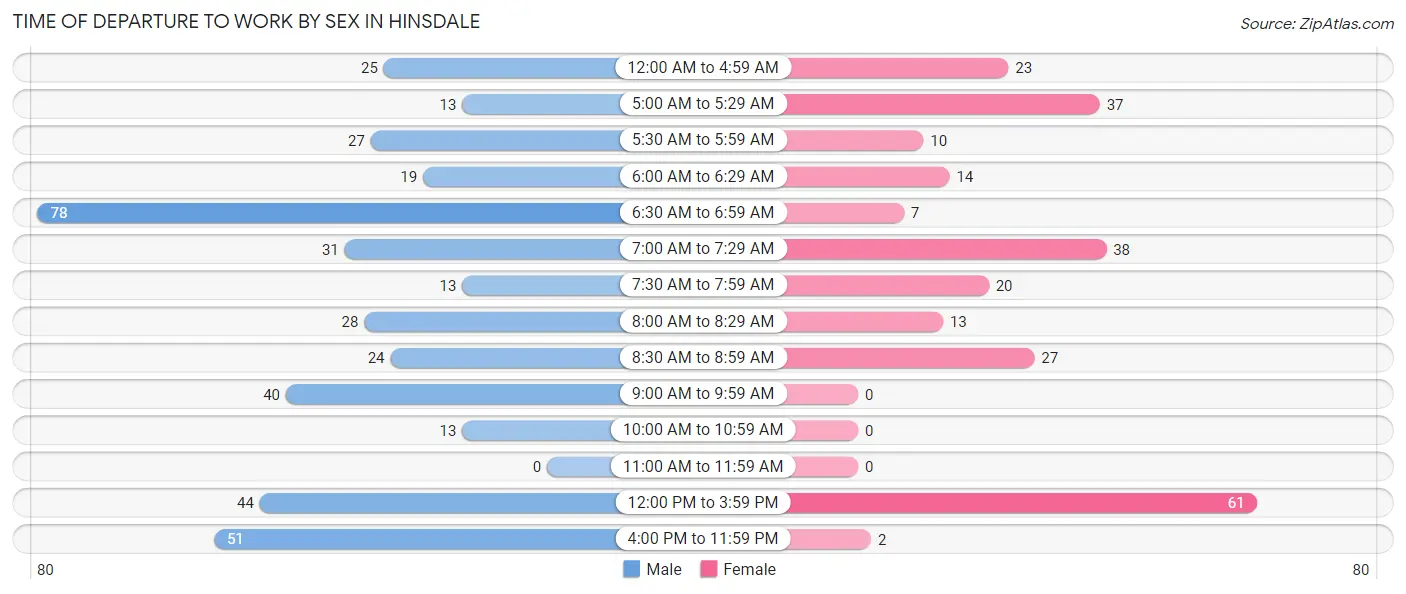
| Time of Departure | Male | Female |
| 12:00 AM to 4:59 AM | 25 (6.2%) | 23 (9.1%) |
| 5:00 AM to 5:29 AM | 13 (3.2%) | 37 (14.7%) |
| 5:30 AM to 5:59 AM | 27 (6.7%) | 10 (4.0%) |
| 6:00 AM to 6:29 AM | 19 (4.7%) | 14 (5.6%) |
| 6:30 AM to 6:59 AM | 78 (19.2%) | 7 (2.8%) |
| 7:00 AM to 7:29 AM | 31 (7.6%) | 38 (15.1%) |
| 7:30 AM to 7:59 AM | 13 (3.2%) | 20 (7.9%) |
| 8:00 AM to 8:29 AM | 28 (6.9%) | 13 (5.2%) |
| 8:30 AM to 8:59 AM | 24 (5.9%) | 27 (10.7%) |
| 9:00 AM to 9:59 AM | 40 (9.9%) | 0 (0.0%) |
| 10:00 AM to 10:59 AM | 13 (3.2%) | 0 (0.0%) |
| 11:00 AM to 11:59 AM | 0 (0.0%) | 0 (0.0%) |
| 12:00 PM to 3:59 PM | 44 (10.8%) | 61 (24.2%) |
| 4:00 PM to 11:59 PM | 51 (12.6%) | 2 (0.8%) |
| Total | 406 (100.0%) | 252 (100.0%) |
Housing Occupancy in Hinsdale
Occupancy by Ownership in Hinsdale
Of the total 567 dwellings in Hinsdale, owner-occupied units account for 456 (80.4%), while renter-occupied units make up 111 (19.6%).
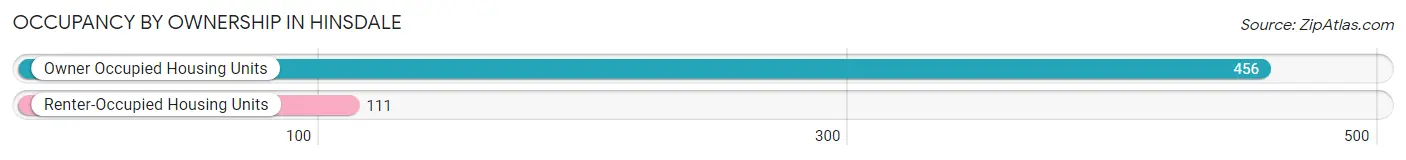
| Occupancy | # Housing Units | % Housing Units |
| Owner Occupied Housing Units | 456 | 80.4% |
| Renter-Occupied Housing Units | 111 | 19.6% |
| Total Occupied Housing Units | 567 | 100.0% |
Occupancy by Household Size in Hinsdale
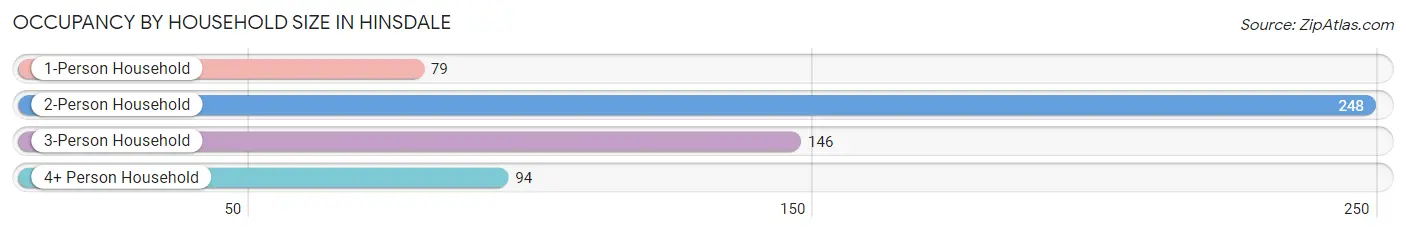
| Household Size | # Housing Units | % Housing Units |
| 1-Person Household | 79 | 13.9% |
| 2-Person Household | 248 | 43.7% |
| 3-Person Household | 146 | 25.8% |
| 4+ Person Household | 94 | 16.6% |
| Total Housing Units | 567 | 100.0% |
Occupancy by Ownership by Household Size in Hinsdale
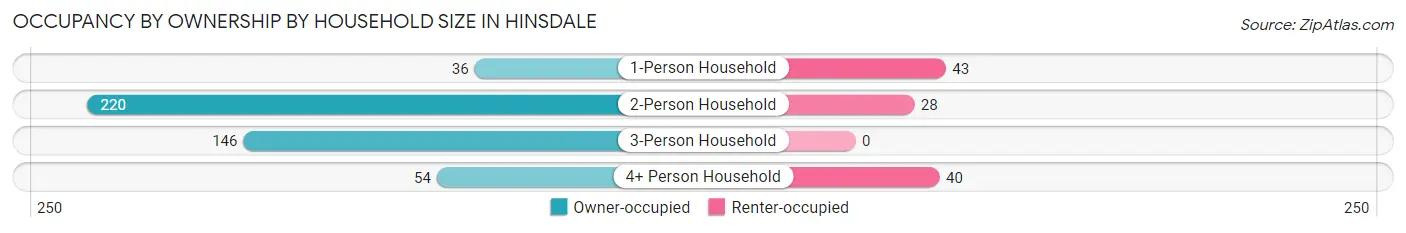
| Household Size | Owner-occupied | Renter-occupied |
| 1-Person Household | 36 (45.6%) | 43 (54.4%) |
| 2-Person Household | 220 (88.7%) | 28 (11.3%) |
| 3-Person Household | 146 (100.0%) | 0 (0.0%) |
| 4+ Person Household | 54 (57.5%) | 40 (42.5%) |
| Total Housing Units | 456 (80.4%) | 111 (19.6%) |
Occupancy by Educational Attainment in Hinsdale
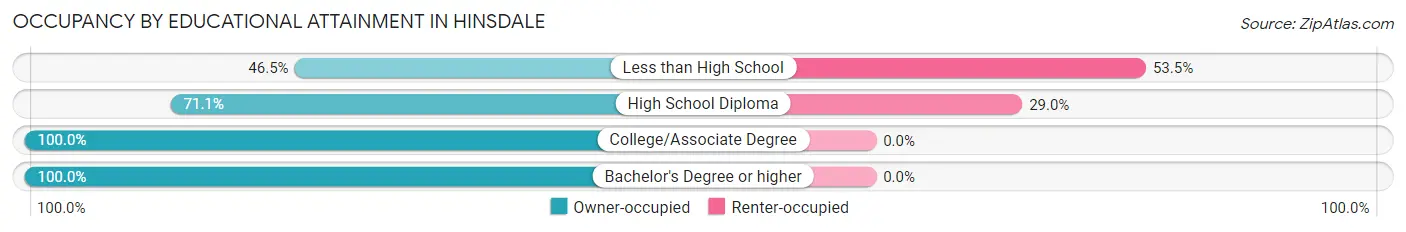
| Household Size | Owner-occupied | Renter-occupied |
| Less than High School | 20 (46.5%) | 23 (53.5%) |
| High School Diploma | 216 (71.1%) | 88 (28.9%) |
| College/Associate Degree | 156 (100.0%) | 0 (0.0%) |
| Bachelor's Degree or higher | 64 (100.0%) | 0 (0.0%) |
Occupancy by Age of Householder in Hinsdale
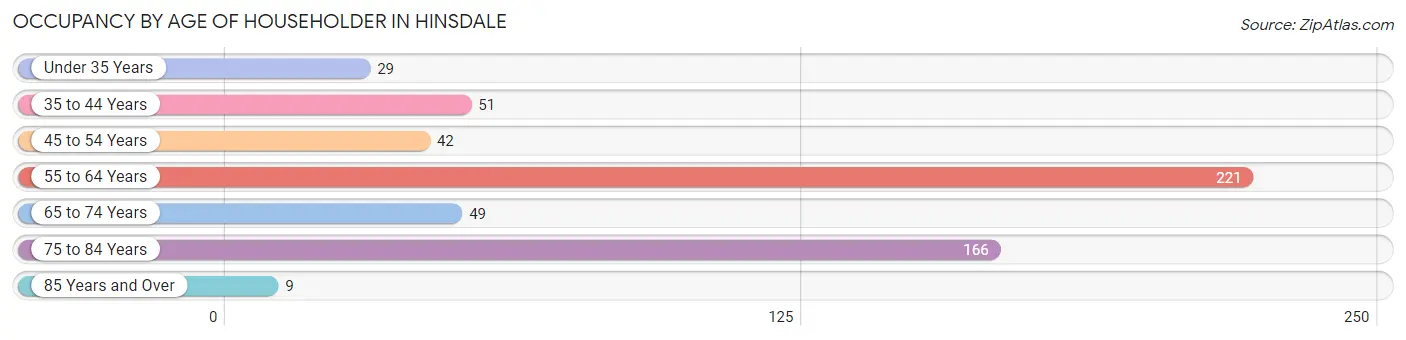
| Age Bracket | # Households | % Households |
| Under 35 Years | 29 | 5.1% |
| 35 to 44 Years | 51 | 9.0% |
| 45 to 54 Years | 42 | 7.4% |
| 55 to 64 Years | 221 | 39.0% |
| 65 to 74 Years | 49 | 8.6% |
| 75 to 84 Years | 166 | 29.3% |
| 85 Years and Over | 9 | 1.6% |
| Total | 567 | 100.0% |
Housing Finances in Hinsdale
Median Income by Occupancy in Hinsdale
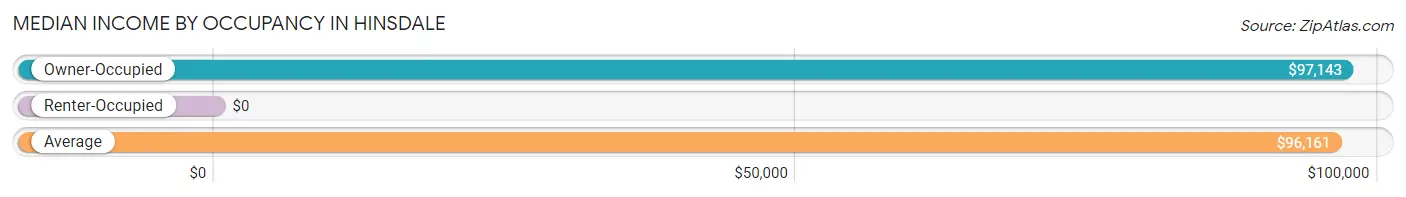
| Occupancy Type | # Households | Median Income |
| Owner-Occupied | 456 (80.4%) | $97,143 |
| Renter-Occupied | 111 (19.6%) | $0 |
| Average | 567 (100.0%) | $96,161 |
Occupancy by Householder Income Bracket in Hinsdale
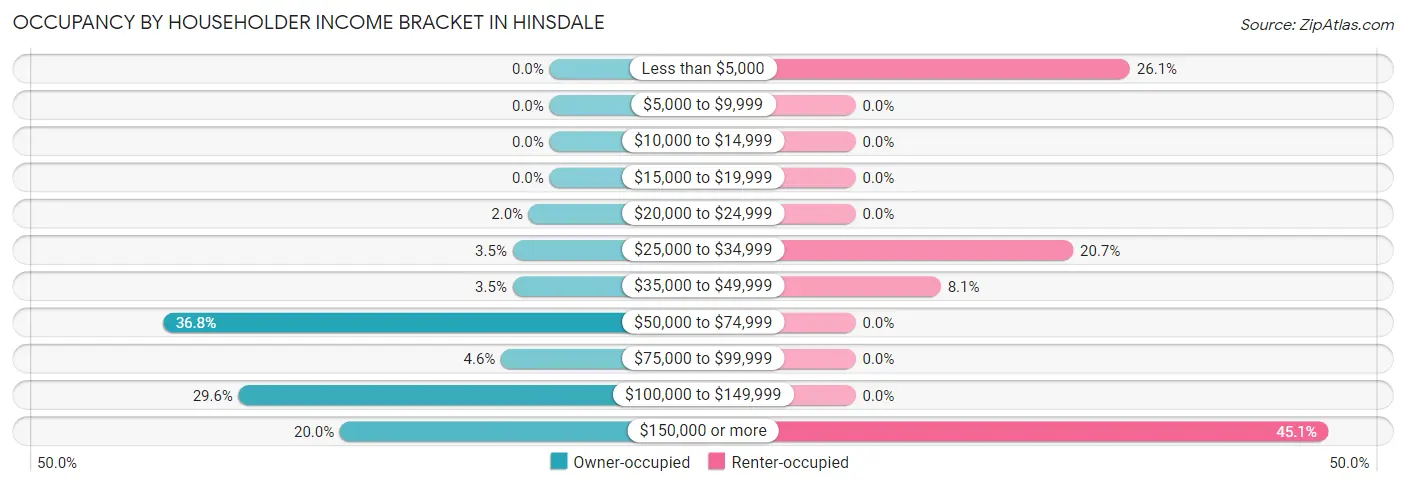
| Income Bracket | Owner-occupied | Renter-occupied |
| Less than $5,000 | 0 (0.0%) | 29 (26.1%) |
| $5,000 to $9,999 | 0 (0.0%) | 0 (0.0%) |
| $10,000 to $14,999 | 0 (0.0%) | 0 (0.0%) |
| $15,000 to $19,999 | 0 (0.0%) | 0 (0.0%) |
| $20,000 to $24,999 | 9 (2.0%) | 0 (0.0%) |
| $25,000 to $34,999 | 16 (3.5%) | 23 (20.7%) |
| $35,000 to $49,999 | 16 (3.5%) | 9 (8.1%) |
| $50,000 to $74,999 | 168 (36.8%) | 0 (0.0%) |
| $75,000 to $99,999 | 21 (4.6%) | 0 (0.0%) |
| $100,000 to $149,999 | 135 (29.6%) | 0 (0.0%) |
| $150,000 or more | 91 (20.0%) | 50 (45.1%) |
| Total | 456 (100.0%) | 111 (100.0%) |
Monthly Housing Cost Tiers in Hinsdale
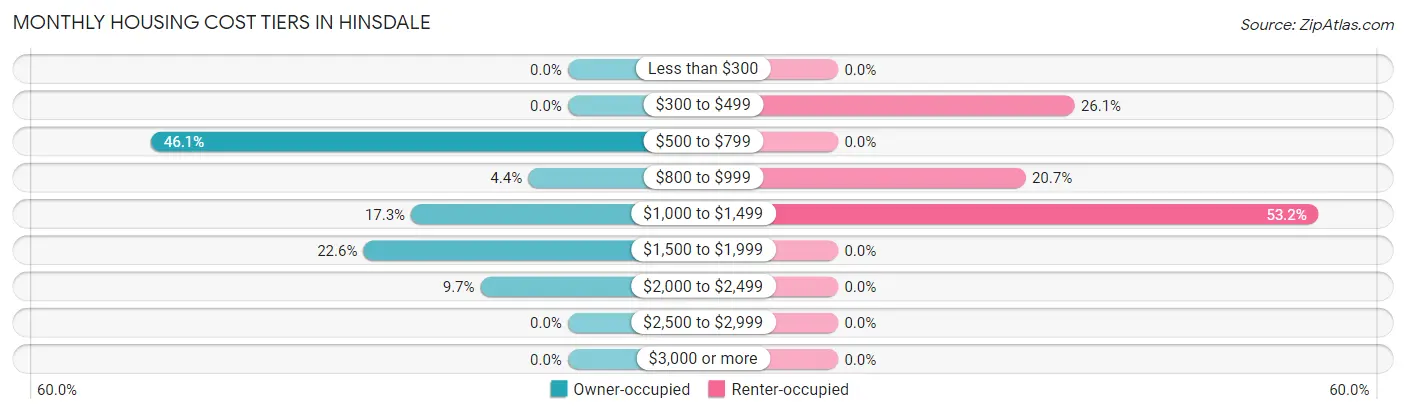
| Monthly Cost | Owner-occupied | Renter-occupied |
| Less than $300 | 0 (0.0%) | 0 (0.0%) |
| $300 to $499 | 0 (0.0%) | 29 (26.1%) |
| $500 to $799 | 210 (46.1%) | 0 (0.0%) |
| $800 to $999 | 20 (4.4%) | 23 (20.7%) |
| $1,000 to $1,499 | 79 (17.3%) | 59 (53.1%) |
| $1,500 to $1,999 | 103 (22.6%) | 0 (0.0%) |
| $2,000 to $2,499 | 44 (9.7%) | 0 (0.0%) |
| $2,500 to $2,999 | 0 (0.0%) | 0 (0.0%) |
| $3,000 or more | 0 (0.0%) | 0 (0.0%) |
| Total | 456 (100.0%) | 111 (100.0%) |
Physical Housing Characteristics in Hinsdale
Housing Structures in Hinsdale
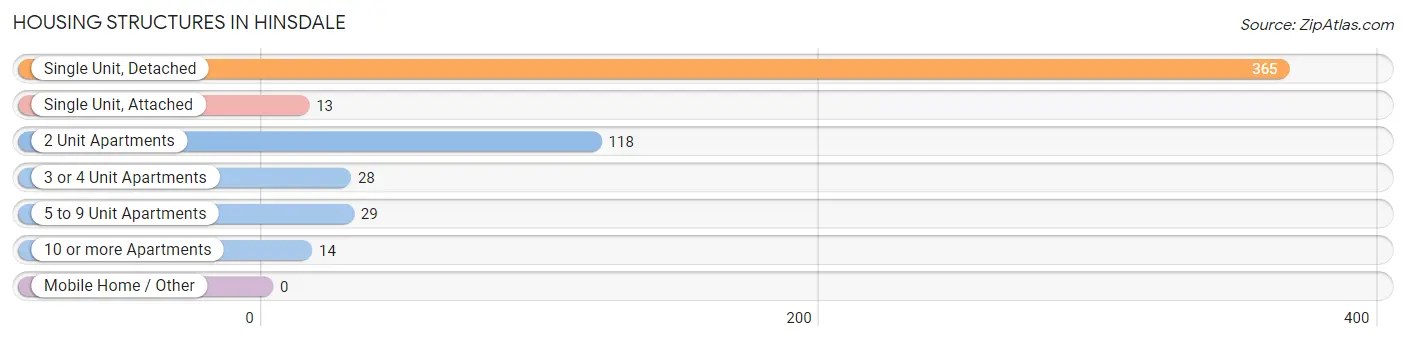
| Structure Type | # Housing Units | % Housing Units |
| Single Unit, Detached | 365 | 64.4% |
| Single Unit, Attached | 13 | 2.3% |
| 2 Unit Apartments | 118 | 20.8% |
| 3 or 4 Unit Apartments | 28 | 4.9% |
| 5 to 9 Unit Apartments | 29 | 5.1% |
| 10 or more Apartments | 14 | 2.5% |
| Mobile Home / Other | 0 | 0.0% |
| Total | 567 | 100.0% |
Housing Structures by Occupancy in Hinsdale
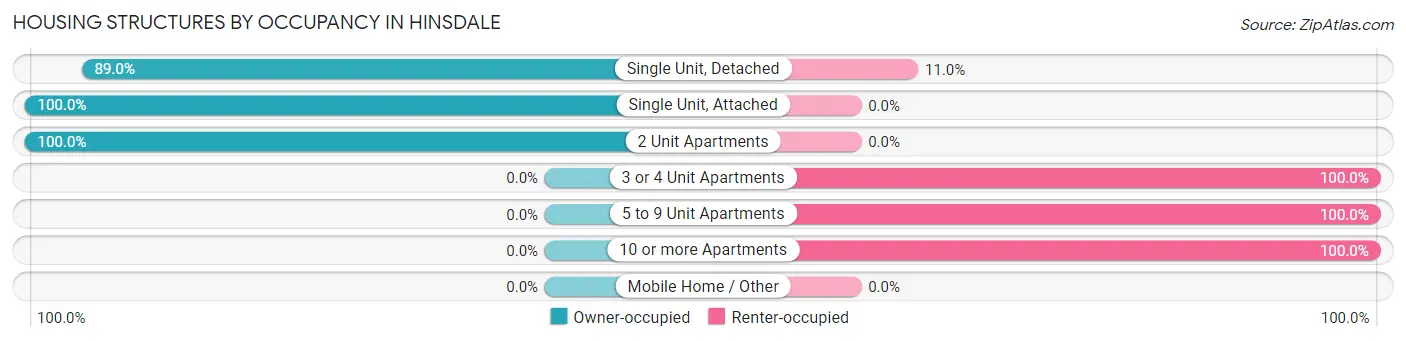
| Structure Type | Owner-occupied | Renter-occupied |
| Single Unit, Detached | 325 (89.0%) | 40 (11.0%) |
| Single Unit, Attached | 13 (100.0%) | 0 (0.0%) |
| 2 Unit Apartments | 118 (100.0%) | 0 (0.0%) |
| 3 or 4 Unit Apartments | 0 (0.0%) | 28 (100.0%) |
| 5 to 9 Unit Apartments | 0 (0.0%) | 29 (100.0%) |
| 10 or more Apartments | 0 (0.0%) | 14 (100.0%) |
| Mobile Home / Other | 0 (0.0%) | 0 (0.0%) |
| Total | 456 (80.4%) | 111 (19.6%) |
Housing Structures by Number of Rooms in Hinsdale
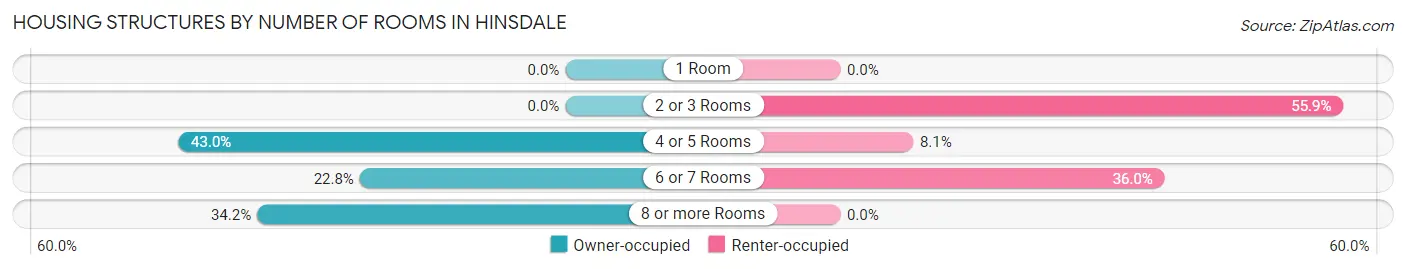
| Number of Rooms | Owner-occupied | Renter-occupied |
| 1 Room | 0 (0.0%) | 0 (0.0%) |
| 2 or 3 Rooms | 0 (0.0%) | 62 (55.9%) |
| 4 or 5 Rooms | 196 (43.0%) | 9 (8.1%) |
| 6 or 7 Rooms | 104 (22.8%) | 40 (36.0%) |
| 8 or more Rooms | 156 (34.2%) | 0 (0.0%) |
| Total | 456 (100.0%) | 111 (100.0%) |
Housing Structure by Heating Type in Hinsdale
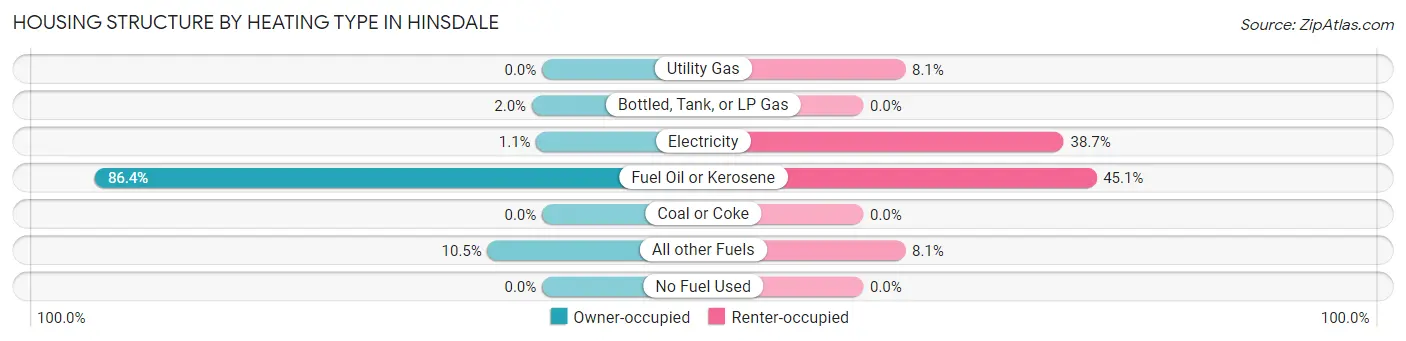
| Heating Type | Owner-occupied | Renter-occupied |
| Utility Gas | 0 (0.0%) | 9 (8.1%) |
| Bottled, Tank, or LP Gas | 9 (2.0%) | 0 (0.0%) |
| Electricity | 5 (1.1%) | 43 (38.7%) |
| Fuel Oil or Kerosene | 394 (86.4%) | 50 (45.1%) |
| Coal or Coke | 0 (0.0%) | 0 (0.0%) |
| All other Fuels | 48 (10.5%) | 9 (8.1%) |
| No Fuel Used | 0 (0.0%) | 0 (0.0%) |
| Total | 456 (100.0%) | 111 (100.0%) |
Household Vehicle Usage in Hinsdale
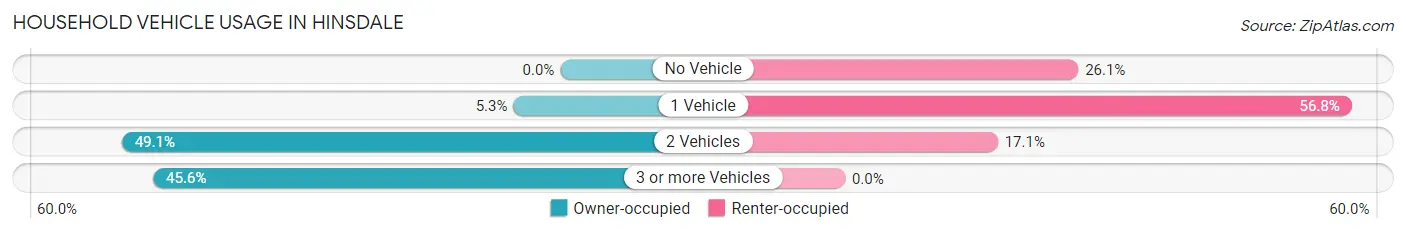
| Vehicles per Household | Owner-occupied | Renter-occupied |
| No Vehicle | 0 (0.0%) | 29 (26.1%) |
| 1 Vehicle | 24 (5.3%) | 63 (56.8%) |
| 2 Vehicles | 224 (49.1%) | 19 (17.1%) |
| 3 or more Vehicles | 208 (45.6%) | 0 (0.0%) |
| Total | 456 (100.0%) | 111 (100.0%) |
Real Estate & Mortgages in Hinsdale
Real Estate and Mortgage Overview in Hinsdale
| Characteristic | Without Mortgage | With Mortgage |
| Housing Units | 262 | 194 |
| Median Property Value | $217,500 | $155,600 |
| Median Household Income | $67,098 | $69 |
| Monthly Housing Costs | $762 | $0 |
| Real Estate Taxes | $3,932 | $0 |
Property Value by Mortgage Status in Hinsdale
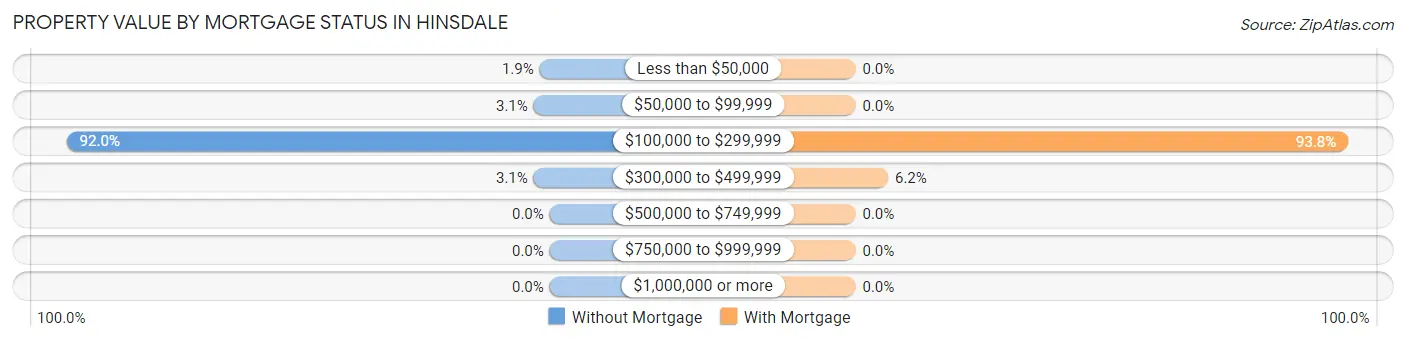
| Property Value | Without Mortgage | With Mortgage |
| Less than $50,000 | 5 (1.9%) | 0 (0.0%) |
| $50,000 to $99,999 | 8 (3.0%) | 0 (0.0%) |
| $100,000 to $299,999 | 241 (92.0%) | 182 (93.8%) |
| $300,000 to $499,999 | 8 (3.0%) | 12 (6.2%) |
| $500,000 to $749,999 | 0 (0.0%) | 0 (0.0%) |
| $750,000 to $999,999 | 0 (0.0%) | 0 (0.0%) |
| $1,000,000 or more | 0 (0.0%) | 0 (0.0%) |
| Total | 262 (100.0%) | 194 (100.0%) |
Household Income by Mortgage Status in Hinsdale
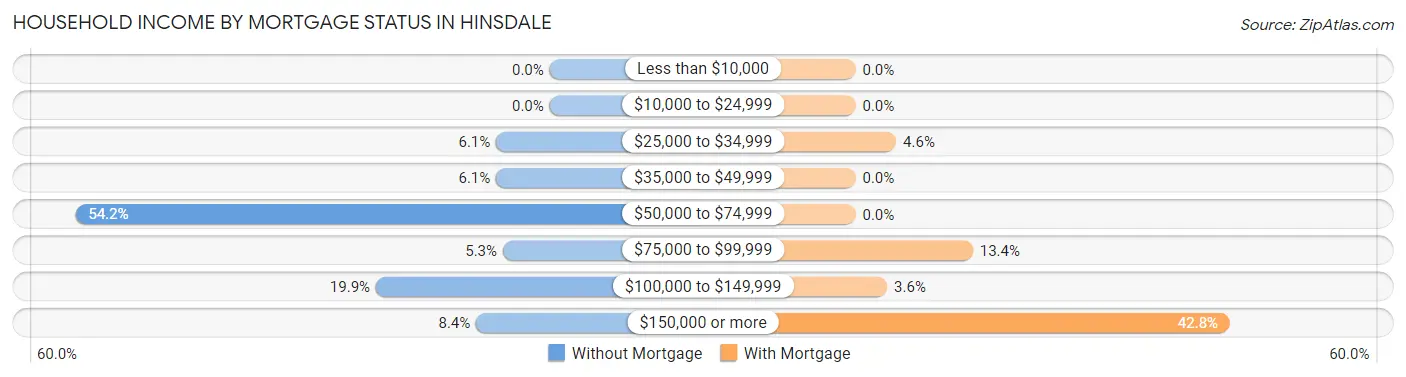
| Household Income | Without Mortgage | With Mortgage |
| Less than $10,000 | 0 (0.0%) | 0 (0.0%) |
| $10,000 to $24,999 | 0 (0.0%) | 0 (0.0%) |
| $25,000 to $34,999 | 16 (6.1%) | 9 (4.6%) |
| $35,000 to $49,999 | 16 (6.1%) | 0 (0.0%) |
| $50,000 to $74,999 | 142 (54.2%) | 0 (0.0%) |
| $75,000 to $99,999 | 14 (5.3%) | 26 (13.4%) |
| $100,000 to $149,999 | 52 (19.9%) | 7 (3.6%) |
| $150,000 or more | 22 (8.4%) | 83 (42.8%) |
| Total | 262 (100.0%) | 194 (100.0%) |
Property Value to Household Income Ratio in Hinsdale
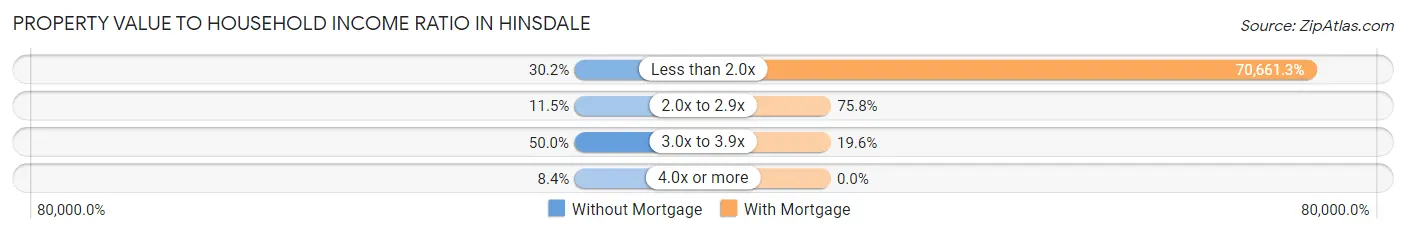
| Value-to-Income Ratio | Without Mortgage | With Mortgage |
| Less than 2.0x | 79 (30.1%) | 137,083 (70,661.3%) |
| 2.0x to 2.9x | 30 (11.5%) | 147 (75.8%) |
| 3.0x to 3.9x | 131 (50.0%) | 38 (19.6%) |
| 4.0x or more | 22 (8.4%) | 0 (0.0%) |
| Total | 262 (100.0%) | 194 (100.0%) |
Real Estate Taxes by Mortgage Status in Hinsdale
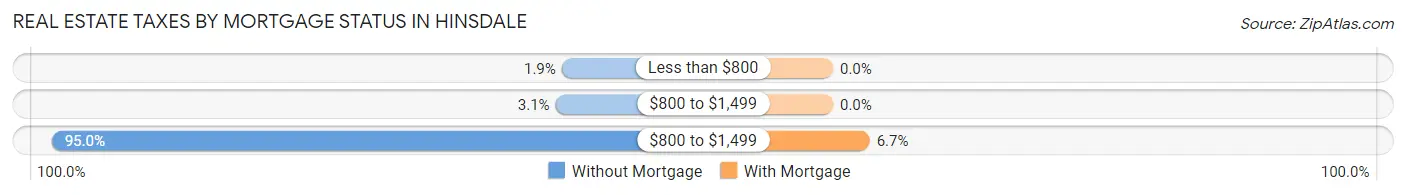
| Property Taxes | Without Mortgage | With Mortgage |
| Less than $800 | 5 (1.9%) | 0 (0.0%) |
| $800 to $1,499 | 8 (3.0%) | 0 (0.0%) |
| $800 to $1,499 | 249 (95.0%) | 13 (6.7%) |
| Total | 262 (100.0%) | 194 (100.0%) |
Health & Disability in Hinsdale
Health Insurance Coverage by Age in Hinsdale
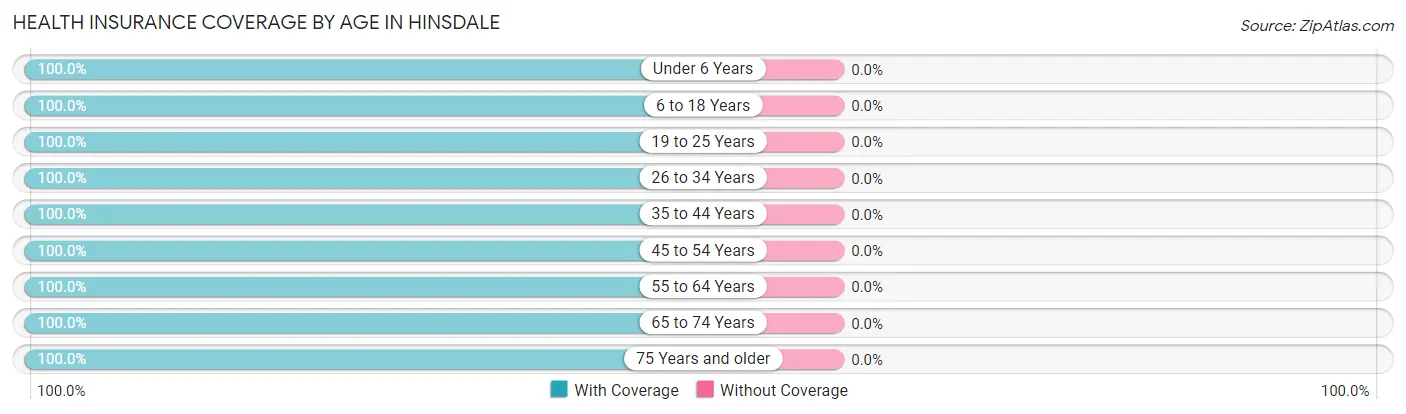
| Age Bracket | With Coverage | Without Coverage |
| Under 6 Years | 76 (100.0%) | 0 (0.0%) |
| 6 to 18 Years | 148 (100.0%) | 0 (0.0%) |
| 19 to 25 Years | 135 (100.0%) | 0 (0.0%) |
| 26 to 34 Years | 92 (100.0%) | 0 (0.0%) |
| 35 to 44 Years | 154 (100.0%) | 0 (0.0%) |
| 45 to 54 Years | 109 (100.0%) | 0 (0.0%) |
| 55 to 64 Years | 342 (100.0%) | 0 (0.0%) |
| 65 to 74 Years | 106 (100.0%) | 0 (0.0%) |
| 75 Years and older | 270 (100.0%) | 0 (0.0%) |
| Total | 1,432 (100.0%) | 0 (0.0%) |
Health Insurance Coverage by Citizenship Status in Hinsdale
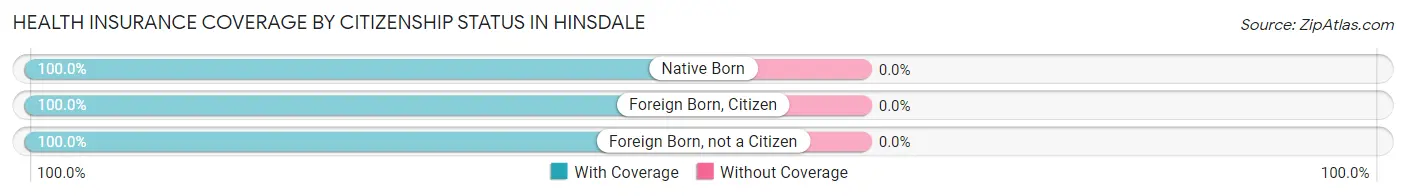
| Citizenship Status | With Coverage | Without Coverage |
| Native Born | 76 (100.0%) | 0 (0.0%) |
| Foreign Born, Citizen | 148 (100.0%) | 0 (0.0%) |
| Foreign Born, not a Citizen | 135 (100.0%) | 0 (0.0%) |
Health Insurance Coverage by Household Income in Hinsdale
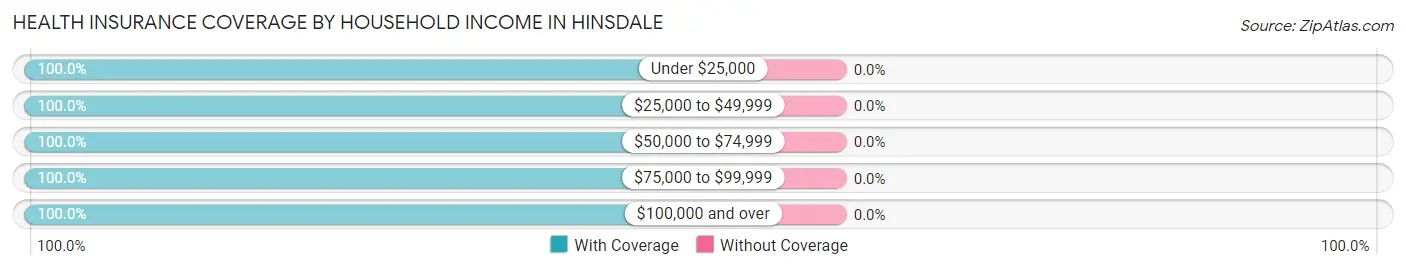
| Household Income | With Coverage | Without Coverage |
| Under $25,000 | 38 (100.0%) | 0 (0.0%) |
| $25,000 to $49,999 | 98 (100.0%) | 0 (0.0%) |
| $50,000 to $74,999 | 310 (100.0%) | 0 (0.0%) |
| $75,000 to $99,999 | 103 (100.0%) | 0 (0.0%) |
| $100,000 and over | 883 (100.0%) | 0 (0.0%) |
Public vs Private Health Insurance Coverage by Age in Hinsdale
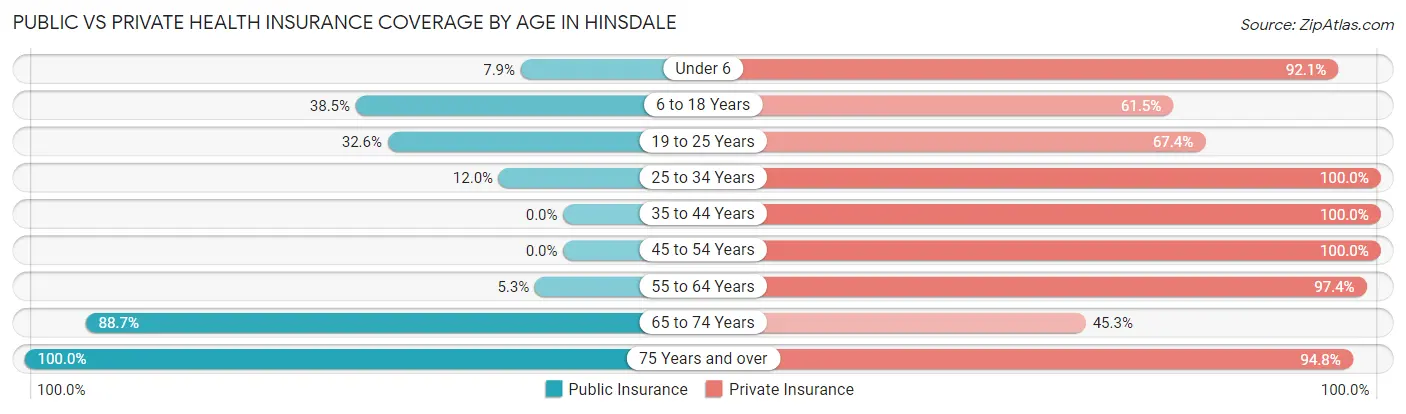
| Age Bracket | Public Insurance | Private Insurance |
| Under 6 | 6 (7.9%) | 70 (92.1%) |
| 6 to 18 Years | 57 (38.5%) | 91 (61.5%) |
| 19 to 25 Years | 44 (32.6%) | 91 (67.4%) |
| 25 to 34 Years | 11 (12.0%) | 92 (100.0%) |
| 35 to 44 Years | 0 (0.0%) | 154 (100.0%) |
| 45 to 54 Years | 0 (0.0%) | 109 (100.0%) |
| 55 to 64 Years | 18 (5.3%) | 333 (97.4%) |
| 65 to 74 Years | 94 (88.7%) | 48 (45.3%) |
| 75 Years and over | 270 (100.0%) | 256 (94.8%) |
| Total | 500 (34.9%) | 1,244 (86.9%) |
Disability Status by Sex by Age in Hinsdale
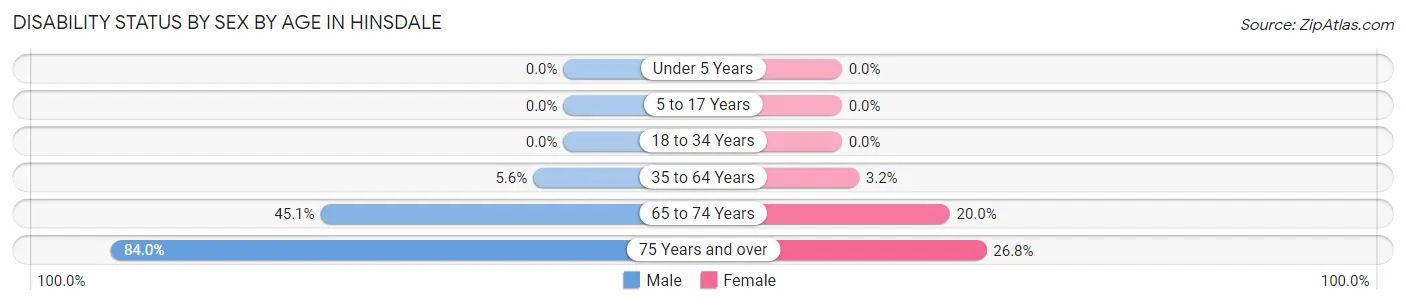
| Age Bracket | Male | Female |
| Under 5 Years | 0 (0.0%) | 0 (0.0%) |
| 5 to 17 Years | 0 (0.0%) | 0 (0.0%) |
| 18 to 34 Years | 0 (0.0%) | 0 (0.0%) |
| 35 to 64 Years | 18 (5.6%) | 9 (3.2%) |
| 65 to 74 Years | 23 (45.1%) | 11 (20.0%) |
| 75 Years and over | 89 (84.0%) | 44 (26.8%) |
Disability Class by Sex by Age in Hinsdale
Disability Class: Hearing Difficulty
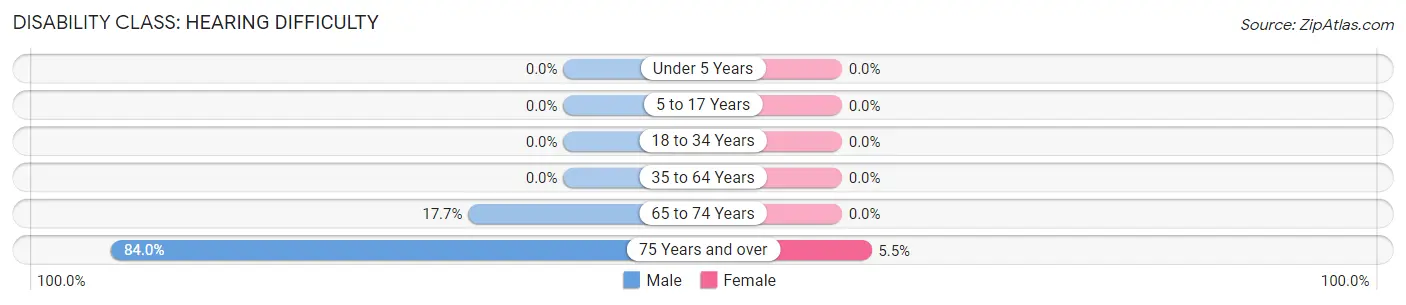
| Age Bracket | Male | Female |
| Under 5 Years | 0 (0.0%) | 0 (0.0%) |
| 5 to 17 Years | 0 (0.0%) | 0 (0.0%) |
| 18 to 34 Years | 0 (0.0%) | 0 (0.0%) |
| 35 to 64 Years | 0 (0.0%) | 0 (0.0%) |
| 65 to 74 Years | 9 (17.6%) | 0 (0.0%) |
| 75 Years and over | 89 (84.0%) | 9 (5.5%) |
Disability Class: Vision Difficulty
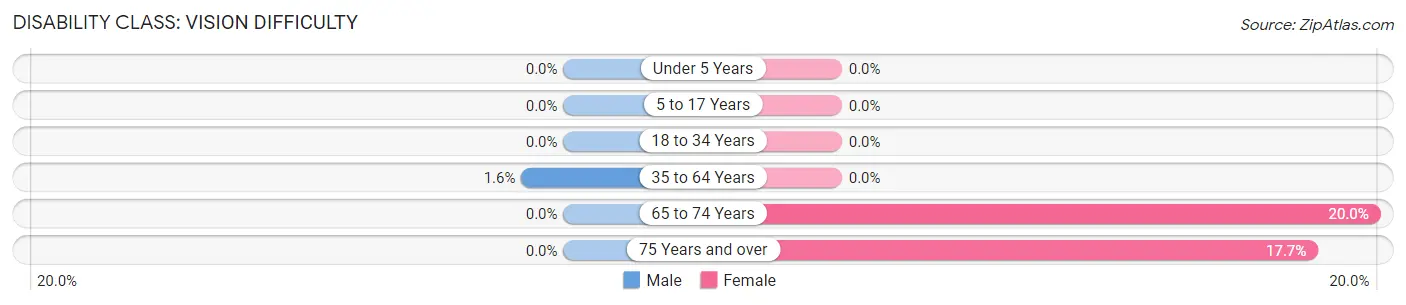
| Age Bracket | Male | Female |
| Under 5 Years | 0 (0.0%) | 0 (0.0%) |
| 5 to 17 Years | 0 (0.0%) | 0 (0.0%) |
| 18 to 34 Years | 0 (0.0%) | 0 (0.0%) |
| 35 to 64 Years | 5 (1.6%) | 0 (0.0%) |
| 65 to 74 Years | 0 (0.0%) | 11 (20.0%) |
| 75 Years and over | 0 (0.0%) | 29 (17.7%) |
Disability Class: Cognitive Difficulty
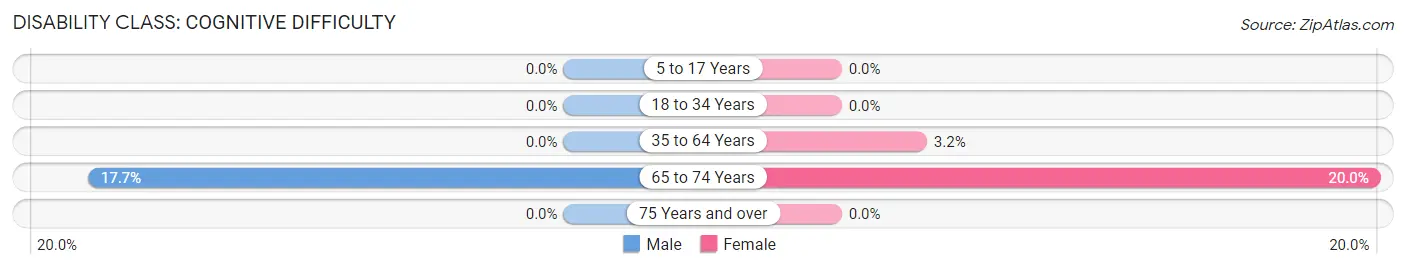
| Age Bracket | Male | Female |
| 5 to 17 Years | 0 (0.0%) | 0 (0.0%) |
| 18 to 34 Years | 0 (0.0%) | 0 (0.0%) |
| 35 to 64 Years | 0 (0.0%) | 9 (3.2%) |
| 65 to 74 Years | 9 (17.6%) | 11 (20.0%) |
| 75 Years and over | 0 (0.0%) | 0 (0.0%) |
Disability Class: Ambulatory Difficulty
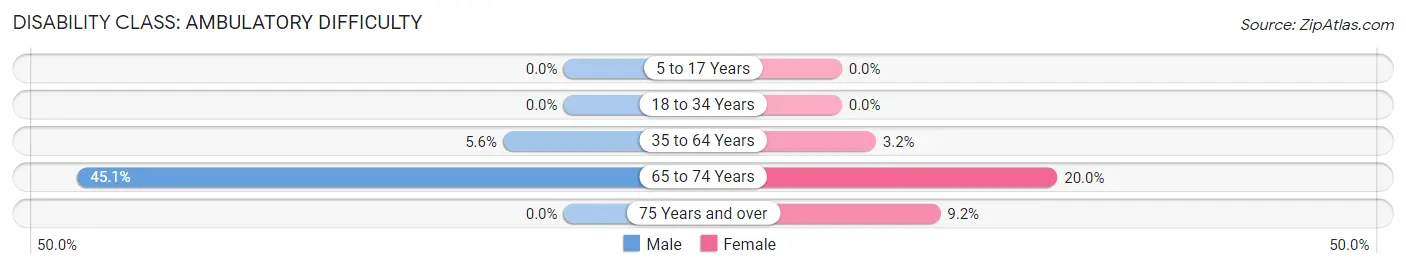
| Age Bracket | Male | Female |
| 5 to 17 Years | 0 (0.0%) | 0 (0.0%) |
| 18 to 34 Years | 0 (0.0%) | 0 (0.0%) |
| 35 to 64 Years | 18 (5.6%) | 9 (3.2%) |
| 65 to 74 Years | 23 (45.1%) | 11 (20.0%) |
| 75 Years and over | 0 (0.0%) | 15 (9.1%) |
Disability Class: Self-Care Difficulty
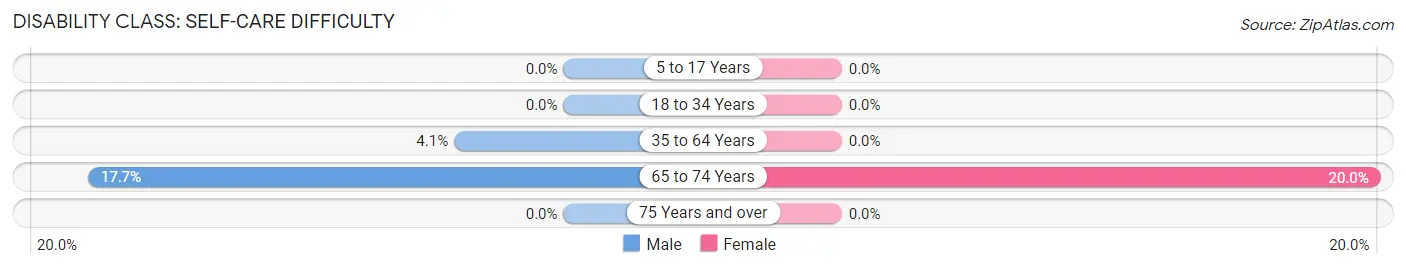
| Age Bracket | Male | Female |
| 5 to 17 Years | 0 (0.0%) | 0 (0.0%) |
| 18 to 34 Years | 0 (0.0%) | 0 (0.0%) |
| 35 to 64 Years | 13 (4.1%) | 0 (0.0%) |
| 65 to 74 Years | 9 (17.6%) | 11 (20.0%) |
| 75 Years and over | 0 (0.0%) | 0 (0.0%) |
Technology Access in Hinsdale
Computing Device Access in Hinsdale
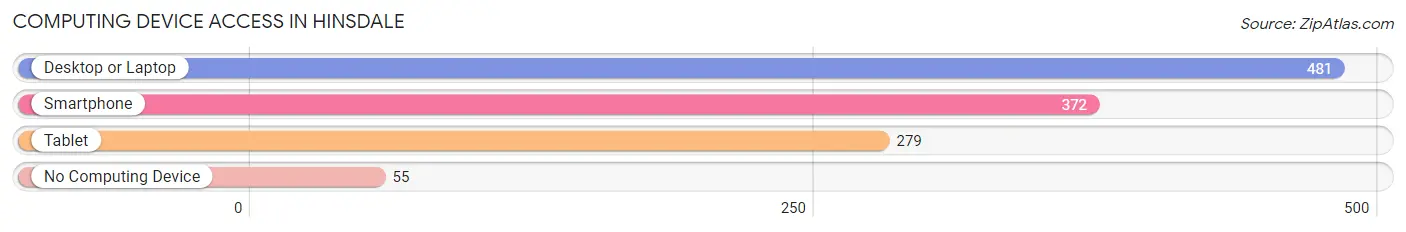
| Device Type | # Households | % Households |
| Desktop or Laptop | 481 | 84.8% |
| Smartphone | 372 | 65.6% |
| Tablet | 279 | 49.2% |
| No Computing Device | 55 | 9.7% |
| Total | 567 | 100.0% |
Internet Access in Hinsdale
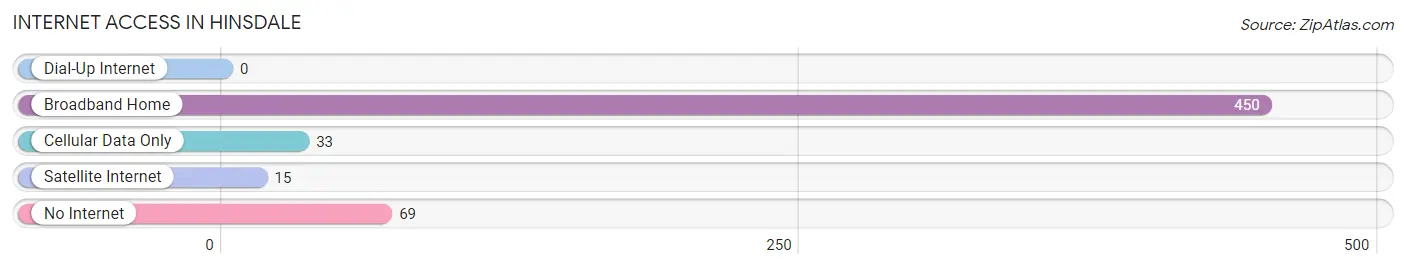
| Internet Type | # Households | % Households |
| Dial-Up Internet | 0 | 0.0% |
| Broadband Home | 450 | 79.4% |
| Cellular Data Only | 33 | 5.8% |
| Satellite Internet | 15 | 2.6% |
| No Internet | 69 | 12.2% |
| Total | 567 | 100.0% |
Hinsdale Summary
Hinsdale is a small town located in Cheshire County, New Hampshire, United States. It is situated in the southwestern corner of the state, along the Massachusetts border. The population was 3,743 at the 2010 census.
History
Hinsdale was first settled in 1764 by a group of settlers from Massachusetts. The town was named after the town of Hinsdale, Massachusetts, which was named after the English town of Hinsdale. The town was incorporated in 1768.
Hinsdale was an important stop on the stagecoach route between Boston and Albany, New York. The town was also a major stop on the Cheshire Railroad, which ran from Keene to Bellows Falls, Vermont. The railroad was built in 1848 and operated until the 1950s.
Geography
Hinsdale is located in southwestern New Hampshire, along the Massachusetts border. It is bordered by the towns of Winchester to the north, Chesterfield to the east, and Brattleboro, Vermont to the south. The town is situated in the Connecticut River Valley, with the Connecticut River forming the western boundary of the town.
The town has a total area of 24.2 square miles, of which 24.1 square miles is land and 0.1 square miles is water. The highest point in the town is the summit of Bald Mountain, at 1,845 feet above sea level.
Economy
Hinsdale is a rural town with a small economy. The town is home to several small businesses, including a few restaurants, a grocery store, and a few retail stores. The town is also home to a few small manufacturing companies.
The town is also home to a few farms, which produce a variety of products, including dairy, beef, and vegetables. The town is also home to a few wineries, which produce a variety of wines.
Demographics
As of the 2010 census, there were 3,743 people, 1,541 households, and 1,039 families residing in the town. The population density was 155.7 people per square mile. There were 1,637 housing units at an average density of 67.7 per square mile.
The racial makeup of the town was 97.2% White, 0.3% African American, 0.2% Native American, 0.4% Asian, 0.1% Pacific Islander, 0.4% from other races, and 1.4% from two or more races. Hispanic or Latino of any race were 1.3% of the population.
There were 1,541 households, out of which 30.2% had children under the age of 18 living with them, 54.2% were married couples living together, 9.7% had a female householder with no husband present, and 31.7% were non-families. 25.2% of all households were made up of individuals, and 10.2% had someone living alone who was 65 years of age or older. The average household size was 2.44 and the average family size was 2.90.
In the town, the population was spread out, with 24.2% under the age of 18, 6.2% from 18 to 24, 28.2% from 25 to 44, 27.2% from 45 to 64, and 14.2% who were 65 years of age or older. The median age was 40 years. For every 100 females, there were 97.2 males. For every 100 females age 18 and over, there were 94.2 males.
The median income for a household in the town was $45,938, and the median income for a family was $51,964. Males had a median income of $36,944 versus $27,917 for females. The per capita income for the town was $21,945. About 4.2% of families and 6.2% of the population were below the poverty line, including 8.2% of those under age 18 and 4.2% of those age 65 or over.
Common Questions
What is Per Capita Income in Hinsdale?
Per Capita income in Hinsdale is $42,438.
What is the Median Family Income in Hinsdale?
Median Family Income in Hinsdale is $104,844.
What is the Median Household income in Hinsdale?
Median Household Income in Hinsdale is $96,161.
What is Income or Wage Gap in Hinsdale?
Income or Wage Gap in Hinsdale is 34.4%.
Women in Hinsdale earn 65.6 cents for every dollar earned by a man.
What is Inequality or Gini Index in Hinsdale?
Inequality or Gini Index in Hinsdale is 0.33.
What is the Total Population of Hinsdale?
Total Population of Hinsdale is 1,432.
What is the Total Male Population of Hinsdale?
Total Male Population of Hinsdale is 702.
What is the Total Female Population of Hinsdale?
Total Female Population of Hinsdale is 730.
What is the Ratio of Males per 100 Females in Hinsdale?
There are 96.16 Males per 100 Females in Hinsdale.
What is the Ratio of Females per 100 Males in Hinsdale?
There are 103.99 Females per 100 Males in Hinsdale.
What is the Median Population Age in Hinsdale?
Median Population Age in Hinsdale is 55.0 Years.
What is the Average Family Size in Hinsdale
Average Family Size in Hinsdale is 2.7 People.
What is the Average Household Size in Hinsdale
Average Household Size in Hinsdale is 2.5 People.
How Large is the Labor Force in Hinsdale?
There are 794 People in the Labor Forcein in Hinsdale.
What is the Percentage of People in the Labor Force in Hinsdale?
62.4% of People are in the Labor Force in Hinsdale.
What is the Unemployment Rate in Hinsdale?
Unemployment Rate in Hinsdale is 1.8%.