Gorham, NH Map & Demographics
Gorham Map
Gorham Overview
$38,435
PER CAPITA INCOME
$82,853
AVG FAMILY INCOME
$55,845
AVG HOUSEHOLD INCOME
12.1%
WAGE / INCOME GAP [ % ]
87.9¢/ $1
WAGE / INCOME GAP [ $ ]
0.43
INEQUALITY / GINI INDEX
2,043
TOTAL POPULATION
1,017
MALE POPULATION
1,026
FEMALE POPULATION
99.12
MALES / 100 FEMALES
100.88
FEMALES / 100 MALES
51.7
MEDIAN AGE
2.8
AVG FAMILY SIZE
2.0
AVG HOUSEHOLD SIZE
1,073
LABOR FORCE [ PEOPLE ]
57.8%
PERCENT IN LABOR FORCE
1.0%
UNEMPLOYMENT RATE
Gorham Zip Codes
Gorham Area Codes
Income in Gorham
Income Overview in Gorham
Per Capita Income in Gorham is $38,435, while median incomes of families and households are $82,853 and $55,845 respectively.
| Characteristic | Number | Measure |
| Per Capita Income | 2,043 | $38,435 |
| Median Family Income | 571 | $82,853 |
| Mean Family Income | 571 | $101,420 |
| Median Household Income | 1,031 | $55,845 |
| Mean Household Income | 1,031 | $75,050 |
| Income Deficit | 571 | $0 |
| Wage / Income Gap (%) | 2,043 | 12.12% |
| Wage / Income Gap ($) | 2,043 | 87.88¢ per $1 |
| Gini / Inequality Index | 2,043 | 0.43 |
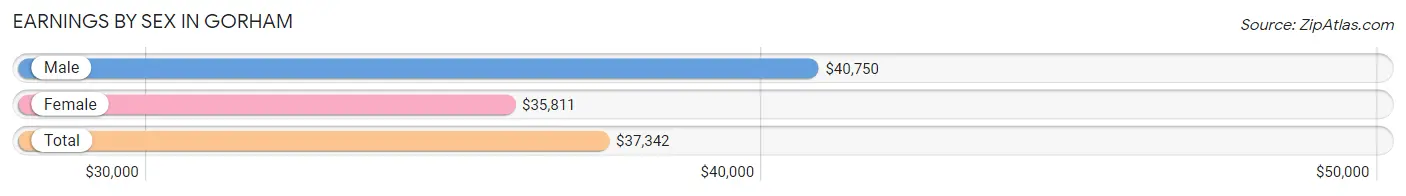
Earnings by Sex in Gorham
Average Earnings in Gorham are $37,342, $40,750 for men and $35,811 for women, a difference of 12.1%.
| Sex | Number | Average Earnings |
| Male | 654 (56.2%) | $40,750 |
| Female | 509 (43.8%) | $35,811 |
| Total | 1,163 (100.0%) | $37,342 |
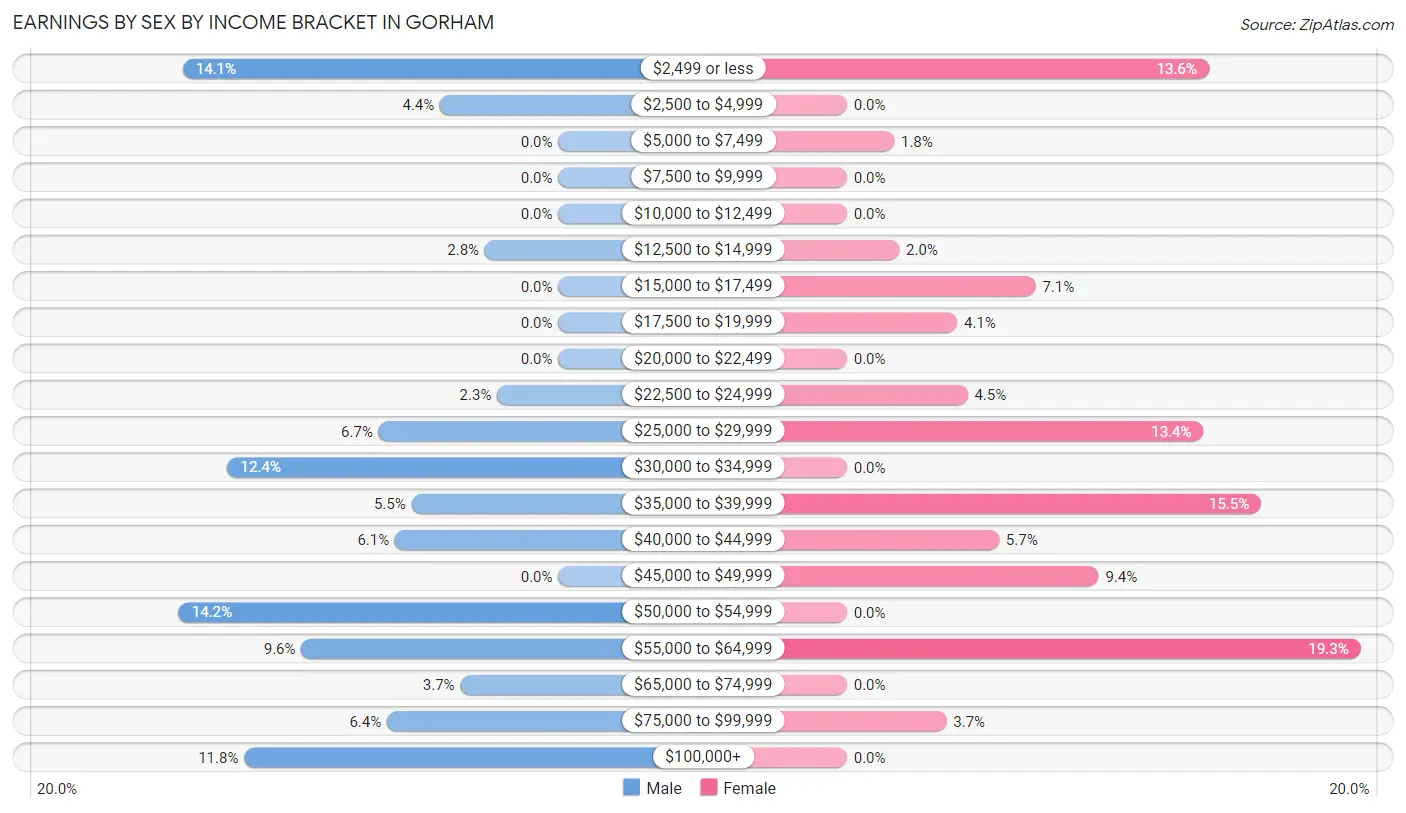
Earnings by Sex by Income Bracket in Gorham
The most common earnings brackets in Gorham are $50,000 to $54,999 for men (93 | 14.2%) and $55,000 to $64,999 for women (98 | 19.3%).
| Income | Male | Female |
| $2,499 or less | 92 (14.1%) | 69 (13.6%) |
| $2,500 to $4,999 | 29 (4.4%) | 0 (0.0%) |
| $5,000 to $7,499 | 0 (0.0%) | 9 (1.8%) |
| $7,500 to $9,999 | 0 (0.0%) | 0 (0.0%) |
| $10,000 to $12,499 | 0 (0.0%) | 0 (0.0%) |
| $12,500 to $14,999 | 18 (2.8%) | 10 (2.0%) |
| $15,000 to $17,499 | 0 (0.0%) | 36 (7.1%) |
| $17,500 to $19,999 | 0 (0.0%) | 21 (4.1%) |
| $20,000 to $22,499 | 0 (0.0%) | 0 (0.0%) |
| $22,500 to $24,999 | 15 (2.3%) | 23 (4.5%) |
| $25,000 to $29,999 | 44 (6.7%) | 68 (13.4%) |
| $30,000 to $34,999 | 81 (12.4%) | 0 (0.0%) |
| $35,000 to $39,999 | 36 (5.5%) | 79 (15.5%) |
| $40,000 to $44,999 | 40 (6.1%) | 29 (5.7%) |
| $45,000 to $49,999 | 0 (0.0%) | 48 (9.4%) |
| $50,000 to $54,999 | 93 (14.2%) | 0 (0.0%) |
| $55,000 to $64,999 | 63 (9.6%) | 98 (19.3%) |
| $65,000 to $74,999 | 24 (3.7%) | 0 (0.0%) |
| $75,000 to $99,999 | 42 (6.4%) | 19 (3.7%) |
| $100,000+ | 77 (11.8%) | 0 (0.0%) |
| Total | 654 (100.0%) | 509 (100.0%) |
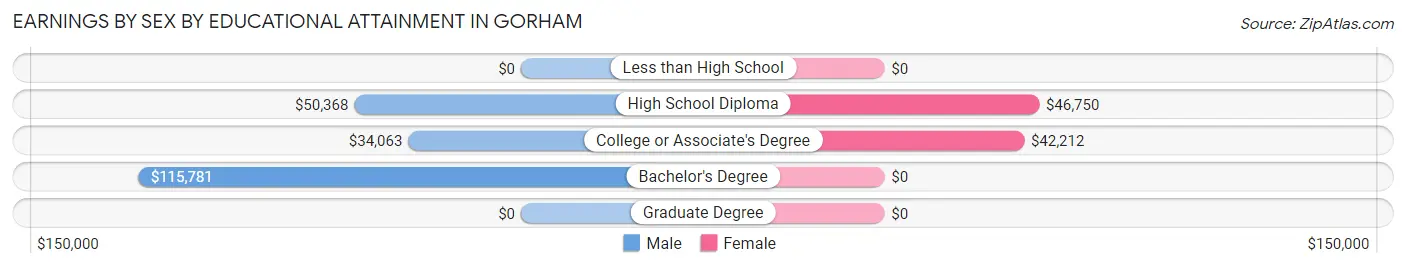
Earnings by Sex by Educational Attainment in Gorham
Average earnings in Gorham are $42,188 for men and $36,754 for women, a difference of 12.9%. Men with an educational attainment of bachelor's degree enjoy the highest average annual earnings of $115,781, while those with college or associate's degree education earn the least with $34,063. Women with an educational attainment of high school diploma earn the most with the average annual earnings of $46,750, while those with college or associate's degree education have the smallest earnings of $42,212.
| Educational Attainment | Male Income | Female Income |
| Less than High School | - | - |
| High School Diploma | $50,368 | $46,750 |
| College or Associate's Degree | $34,063 | $42,212 |
| Bachelor's Degree | $115,781 | $0 |
| Graduate Degree | - | - |
| Total | $42,188 | $36,754 |
Family Income in Gorham
Family Income Brackets in Gorham
According to the Gorham family income data, there are 152 families falling into the $35,000 to $49,999 income range, which is the most common income bracket and makes up 26.6% of all families.
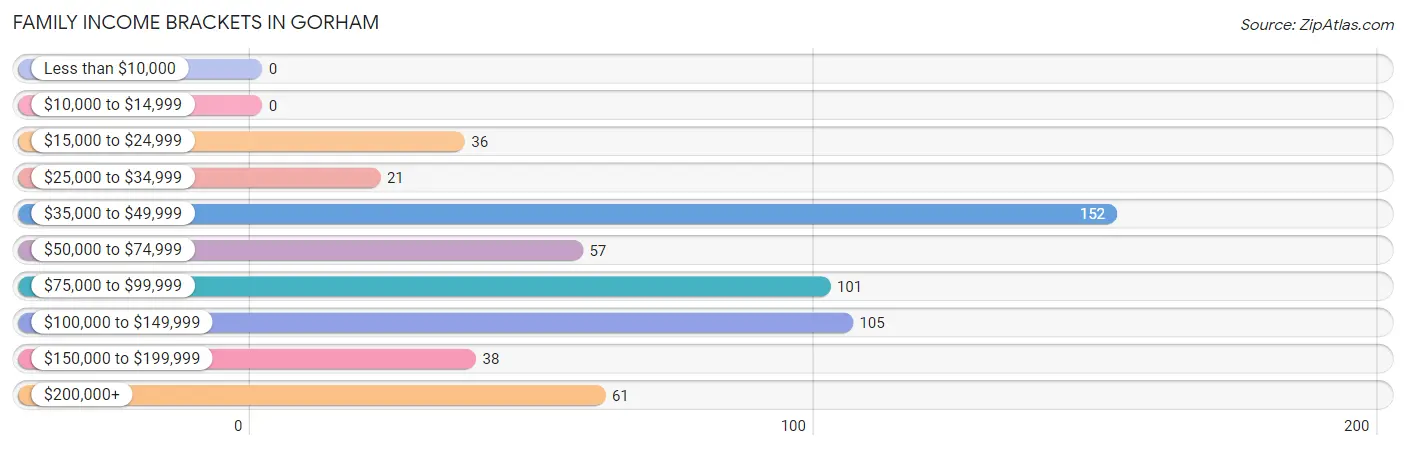
| Income Bracket | # Families | % Families |
| Less than $10,000 | 0 | 0.0% |
| $10,000 to $14,999 | 0 | 0.0% |
| $15,000 to $24,999 | 36 | 6.3% |
| $25,000 to $34,999 | 21 | 3.7% |
| $35,000 to $49,999 | 152 | 26.6% |
| $50,000 to $74,999 | 57 | 10.0% |
| $75,000 to $99,999 | 101 | 17.7% |
| $100,000 to $149,999 | 105 | 18.4% |
| $150,000 to $199,999 | 38 | 6.7% |
| $200,000+ | 61 | 10.7% |
Family Income by Famaliy Size in Gorham
4-person families (40 | 7.0%) account for the highest median family income in Gorham with $230,179 per family, while 4-person families (40 | 7.0%) have the highest median income of $57,545 per family member.
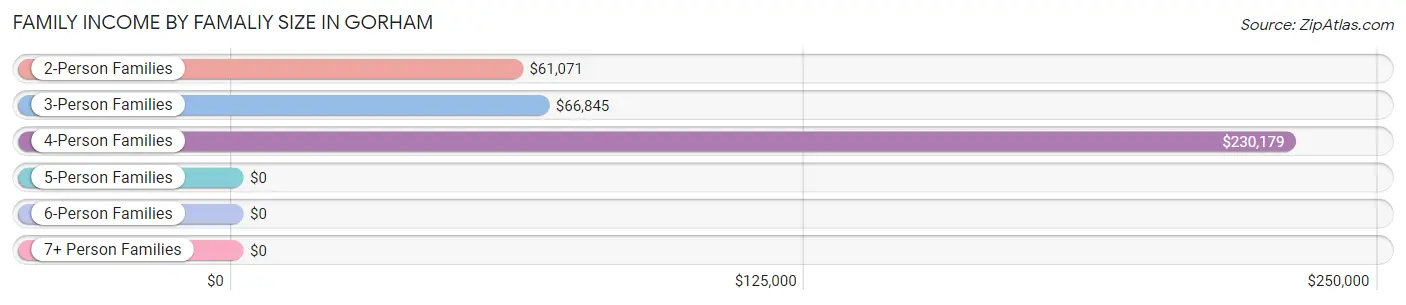
| Income Bracket | # Families | Median Income |
| 2-Person Families | 318 (55.7%) | $61,071 |
| 3-Person Families | 165 (28.9%) | $66,845 |
| 4-Person Families | 40 (7.0%) | $230,179 |
| 5-Person Families | 39 (6.8%) | $0 |
| 6-Person Families | 0 (0.0%) | $0 |
| 7+ Person Families | 9 (1.6%) | $0 |
| Total | 571 (100.0%) | $82,853 |
Family Income by Number of Earners in Gorham
The median family income in Gorham is $82,853, with families comprising 3+ earners (71) having the highest median family income of $126,629, while families with no earners (65) have the lowest median family income of $45,774, accounting for 12.4% and 11.4% of families, respectively.
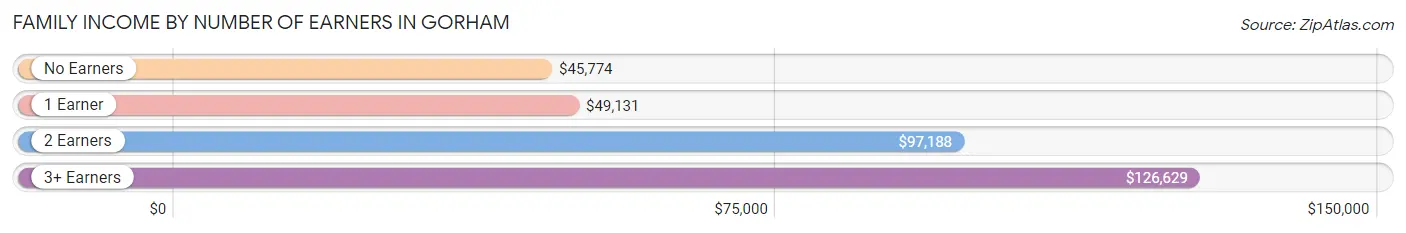
| Number of Earners | # Families | Median Income |
| No Earners | 65 (11.4%) | $45,774 |
| 1 Earner | 255 (44.7%) | $49,131 |
| 2 Earners | 180 (31.5%) | $97,188 |
| 3+ Earners | 71 (12.4%) | $126,629 |
| Total | 571 (100.0%) | $82,853 |
Household Income in Gorham
Household Income Brackets in Gorham
With 233 households falling in the category, the $35,000 to $49,999 income range is the most frequent in Gorham, accounting for 22.6% of all households.
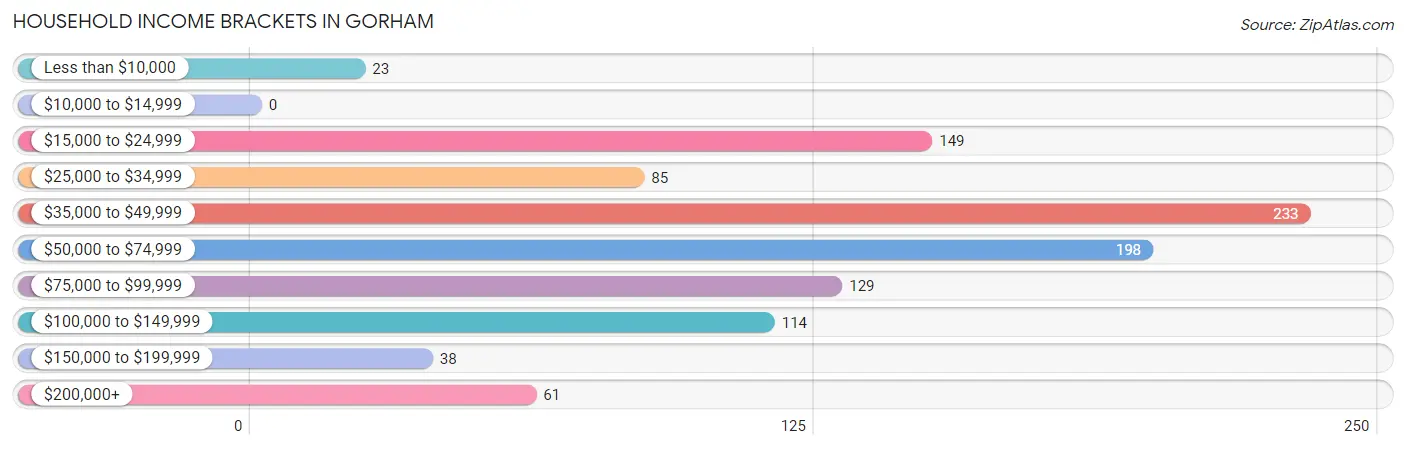
| Income Bracket | # Households | % Households |
| Less than $10,000 | 23 | 2.2% |
| $10,000 to $14,999 | 0 | 0.0% |
| $15,000 to $24,999 | 149 | 14.5% |
| $25,000 to $34,999 | 85 | 8.2% |
| $35,000 to $49,999 | 233 | 22.6% |
| $50,000 to $74,999 | 198 | 19.2% |
| $75,000 to $99,999 | 129 | 12.5% |
| $100,000 to $149,999 | 114 | 11.1% |
| $150,000 to $199,999 | 38 | 3.7% |
| $200,000+ | 61 | 5.9% |
Household Income by Householder Age in Gorham
The median household income in Gorham is $55,845, with the highest median household income of $61,964 found in the 45 to 64 years age bracket for the primary householder. A total of 406 households (39.4%) fall into this category.
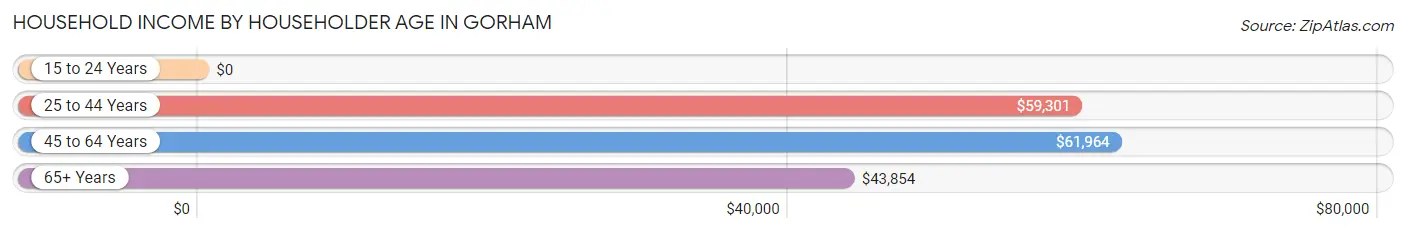
| Income Bracket | # Households | Median Income |
| 15 to 24 Years | 0 (0.0%) | $0 |
| 25 to 44 Years | 234 (22.7%) | $59,301 |
| 45 to 64 Years | 406 (39.4%) | $61,964 |
| 65+ Years | 391 (37.9%) | $43,854 |
| Total | 1,031 (100.0%) | $55,845 |
Poverty in Gorham
Income Below Poverty by Sex and Age in Gorham
With 4.7% poverty level for males and 6.6% for females among the residents of Gorham, 35 to 44 year old males and under 5 year old females are the most vulnerable to poverty, with 35 males (19.7%) and 22 females (100.0%) in their respective age groups living below the poverty level.
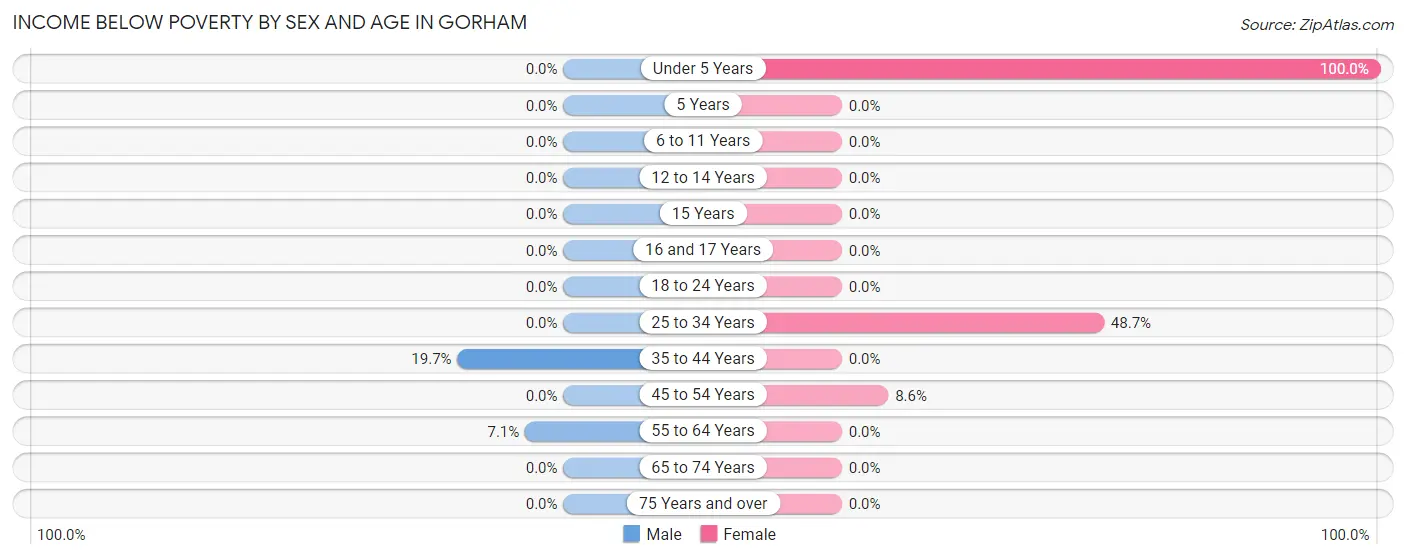
| Age Bracket | Male | Female |
| Under 5 Years | 0 (0.0%) | 22 (100.0%) |
| 5 Years | 0 (0.0%) | 0 (0.0%) |
| 6 to 11 Years | 0 (0.0%) | 0 (0.0%) |
| 12 to 14 Years | 0 (0.0%) | 0 (0.0%) |
| 15 Years | 0 (0.0%) | 0 (0.0%) |
| 16 and 17 Years | 0 (0.0%) | 0 (0.0%) |
| 18 to 24 Years | 0 (0.0%) | 0 (0.0%) |
| 25 to 34 Years | 0 (0.0%) | 36 (48.6%) |
| 35 to 44 Years | 35 (19.7%) | 0 (0.0%) |
| 45 to 54 Years | 0 (0.0%) | 10 (8.6%) |
| 55 to 64 Years | 13 (7.1%) | 0 (0.0%) |
| 65 to 74 Years | 0 (0.0%) | 0 (0.0%) |
| 75 Years and over | 0 (0.0%) | 0 (0.0%) |
| Total | 48 (4.7%) | 68 (6.6%) |
Income Above Poverty by Sex and Age in Gorham
According to the poverty statistics in Gorham, males aged under 5 years and females aged 6 to 11 years are the age groups that are most secure financially, with 100.0% of males and 100.0% of females in these age groups living above the poverty line.
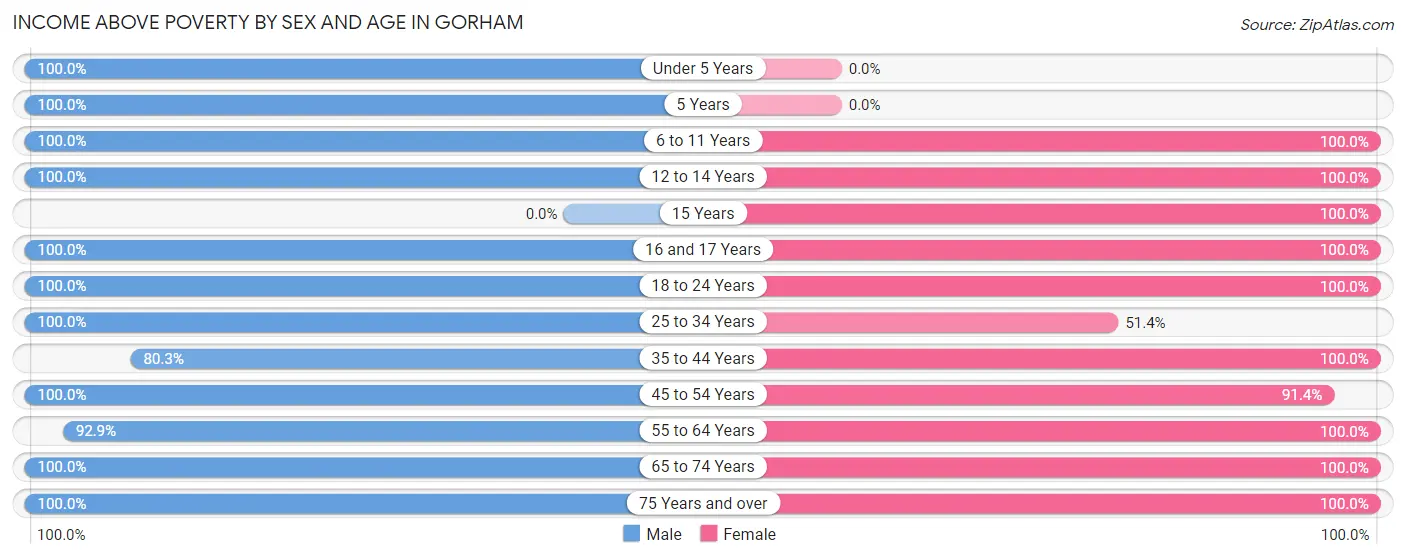
| Age Bracket | Male | Female |
| Under 5 Years | 25 (100.0%) | 0 (0.0%) |
| 5 Years | 12 (100.0%) | 0 (0.0%) |
| 6 to 11 Years | 41 (100.0%) | 22 (100.0%) |
| 12 to 14 Years | 46 (100.0%) | 11 (100.0%) |
| 15 Years | 0 (0.0%) | 8 (100.0%) |
| 16 and 17 Years | 17 (100.0%) | 50 (100.0%) |
| 18 to 24 Years | 72 (100.0%) | 43 (100.0%) |
| 25 to 34 Years | 115 (100.0%) | 38 (51.3%) |
| 35 to 44 Years | 143 (80.3%) | 100 (100.0%) |
| 45 to 54 Years | 136 (100.0%) | 106 (91.4%) |
| 55 to 64 Years | 170 (92.9%) | 222 (100.0%) |
| 65 to 74 Years | 114 (100.0%) | 166 (100.0%) |
| 75 Years and over | 78 (100.0%) | 192 (100.0%) |
| Total | 969 (95.3%) | 958 (93.4%) |
Income Below Poverty Among Married-Couple Families in Gorham
The poverty statistics for married-couple families in Gorham show that 6.7% or 36 of the total 537 families live below the poverty line. Families with 1 or 2 children have the highest poverty rate of 23.4%, comprising of 36 families. On the other hand, families with no children have the lowest poverty rate of 0.0%, which includes 0 families.
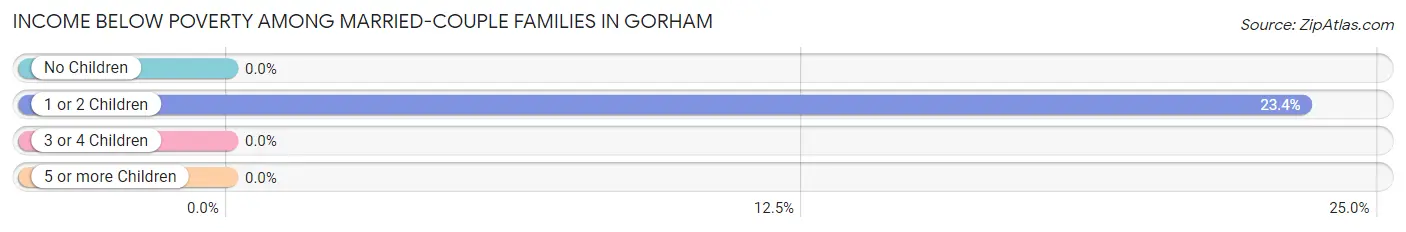
| Children | Above Poverty | Below Poverty |
| No Children | 368 (100.0%) | 0 (0.0%) |
| 1 or 2 Children | 118 (76.6%) | 36 (23.4%) |
| 3 or 4 Children | 15 (100.0%) | 0 (0.0%) |
| 5 or more Children | 0 (0.0%) | 0 (0.0%) |
| Total | 501 (93.3%) | 36 (6.7%) |
Income Below Poverty Among Single-Parent Households in Gorham
| Children | Single Father | Single Mother |
| No Children | 0 (0.0%) | 0 (0.0%) |
| 1 or 2 Children | 0 (0.0%) | 0 (0.0%) |
| 3 or 4 Children | 0 (0.0%) | 0 (0.0%) |
| 5 or more Children | 0 (0.0%) | 0 (0.0%) |
| Total | 0 (0.0%) | 0 (0.0%) |
Income Below Poverty Among Married-Couple vs Single-Parent Households in Gorham
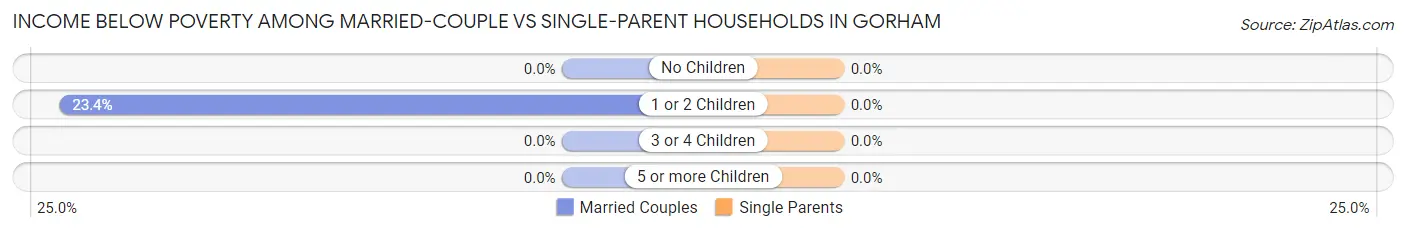
| Children | Married-Couple Families | Single-Parent Households |
| No Children | 0 (0.0%) | 0 (0.0%) |
| 1 or 2 Children | 36 (23.4%) | 0 (0.0%) |
| 3 or 4 Children | 0 (0.0%) | 0 (0.0%) |
| 5 or more Children | 0 (0.0%) | 0 (0.0%) |
| Total | 36 (6.7%) | 0 (0.0%) |
Race in Gorham
The most populous races in Gorham are White / Caucasian (1,916 | 93.8%), Asian (66 | 3.2%), and Two or more Races (61 | 3.0%).
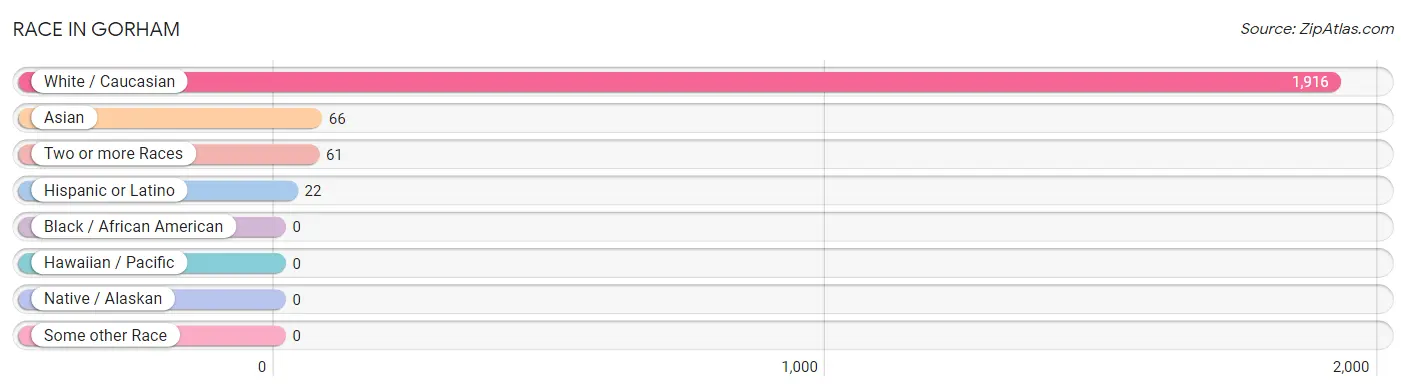
| Race | # Population | % Population |
| Asian | 66 | 3.2% |
| Black / African American | 0 | 0.0% |
| Hawaiian / Pacific | 0 | 0.0% |
| Hispanic or Latino | 22 | 1.1% |
| Native / Alaskan | 0 | 0.0% |
| White / Caucasian | 1,916 | 93.8% |
| Two or more Races | 61 | 3.0% |
| Some other Race | 0 | 0.0% |
| Total | 2,043 | 100.0% |
Ancestry in Gorham
The most populous ancestries reported in Gorham are French Canadian (536 | 26.2%), French (430 | 21.0%), English (403 | 19.7%), Irish (207 | 10.1%), and Italian (185 | 9.1%), together accounting for 86.2% of all Gorham residents.
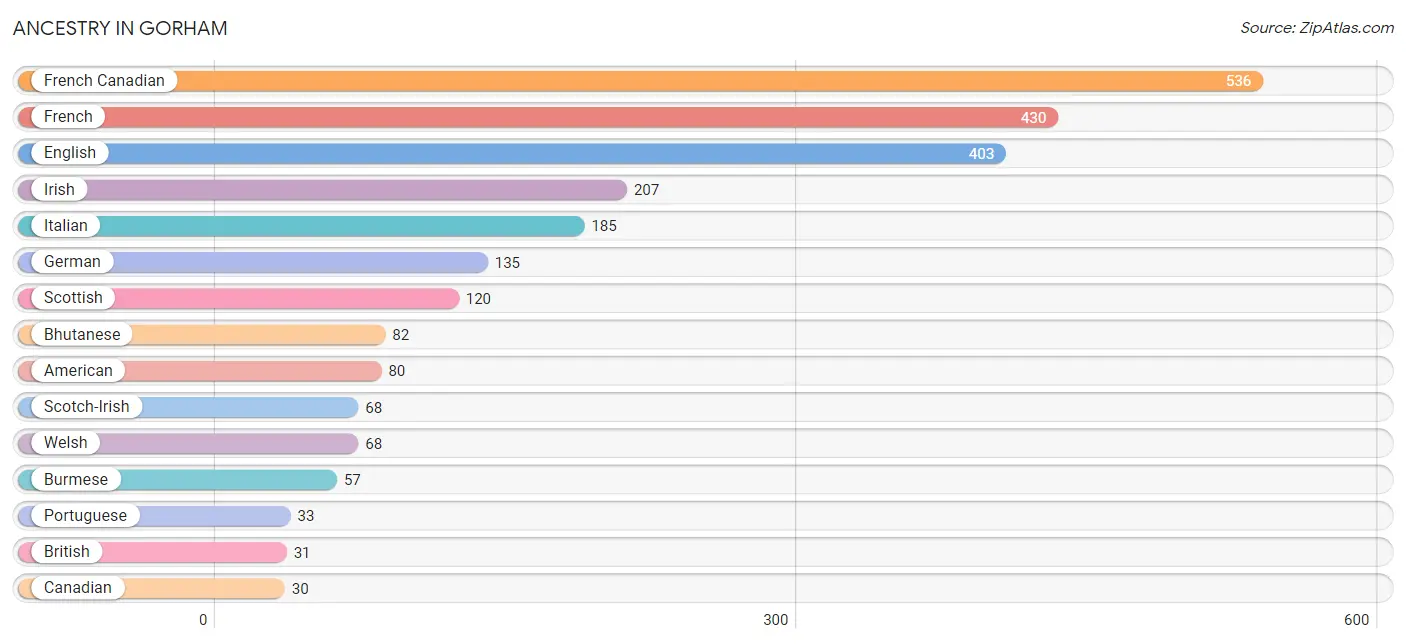
| Ancestry | # Population | % Population |
| American | 80 | 3.9% |
| Arab | 16 | 0.8% |
| Bhutanese | 82 | 4.0% |
| British | 31 | 1.5% |
| Burmese | 57 | 2.8% |
| Canadian | 30 | 1.5% |
| English | 403 | 19.7% |
| European | 16 | 0.8% |
| French | 430 | 21.0% |
| French Canadian | 536 | 26.2% |
| German | 135 | 6.6% |
| Irish | 207 | 10.1% |
| Iroquois | 1 | 0.1% |
| Italian | 185 | 9.1% |
| Lebanese | 16 | 0.8% |
| Portuguese | 33 | 1.6% |
| Puerto Rican | 22 | 1.1% |
| Scotch-Irish | 68 | 3.3% |
| Scottish | 120 | 5.9% |
| Sri Lankan | 9 | 0.4% |
| Swedish | 16 | 0.8% |
| Welsh | 68 | 3.3% | View All 22 Rows |
Immigrants in Gorham
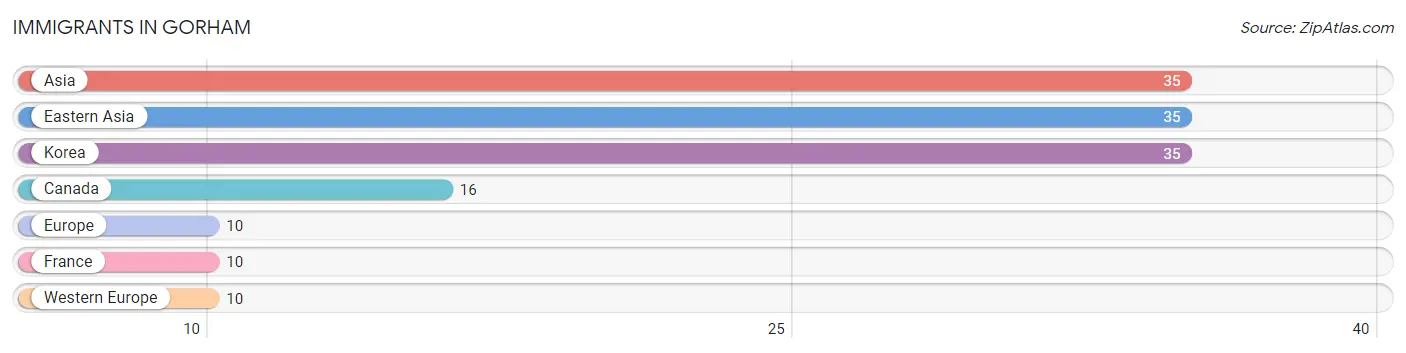
The most numerous immigrant groups reported in Gorham came from Asia (35 | 1.7%), Eastern Asia (35 | 1.7%), Korea (35 | 1.7%), Canada (16 | 0.8%), and Europe (10 | 0.5%), together accounting for 6.4% of all Gorham residents.
| Immigration Origin | # Population | % Population |
| Asia | 35 | 1.7% |
| Canada | 16 | 0.8% |
| Eastern Asia | 35 | 1.7% |
| Europe | 10 | 0.5% |
| France | 10 | 0.5% |
| Korea | 35 | 1.7% |
| Western Europe | 10 | 0.5% | View All 7 Rows |
Sex and Age in Gorham
Sex and Age in Gorham
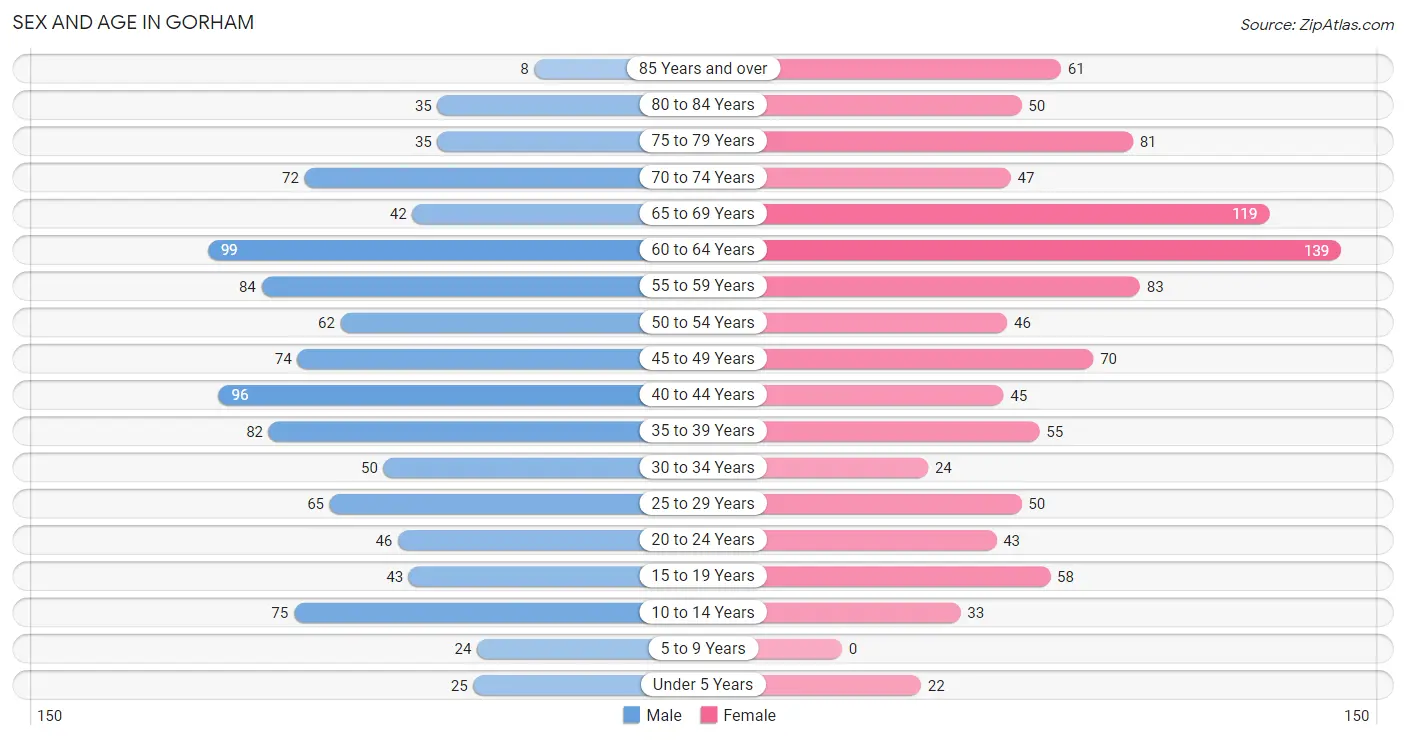
The most populous age groups in Gorham are 60 to 64 Years (99 | 9.7%) for men and 60 to 64 Years (139 | 13.6%) for women.
| Age Bracket | Male | Female |
| Under 5 Years | 25 (2.5%) | 22 (2.1%) |
| 5 to 9 Years | 24 (2.4%) | 0 (0.0%) |
| 10 to 14 Years | 75 (7.4%) | 33 (3.2%) |
| 15 to 19 Years | 43 (4.2%) | 58 (5.7%) |
| 20 to 24 Years | 46 (4.5%) | 43 (4.2%) |
| 25 to 29 Years | 65 (6.4%) | 50 (4.9%) |
| 30 to 34 Years | 50 (4.9%) | 24 (2.3%) |
| 35 to 39 Years | 82 (8.1%) | 55 (5.4%) |
| 40 to 44 Years | 96 (9.4%) | 45 (4.4%) |
| 45 to 49 Years | 74 (7.3%) | 70 (6.8%) |
| 50 to 54 Years | 62 (6.1%) | 46 (4.5%) |
| 55 to 59 Years | 84 (8.3%) | 83 (8.1%) |
| 60 to 64 Years | 99 (9.7%) | 139 (13.6%) |
| 65 to 69 Years | 42 (4.1%) | 119 (11.6%) |
| 70 to 74 Years | 72 (7.1%) | 47 (4.6%) |
| 75 to 79 Years | 35 (3.4%) | 81 (7.9%) |
| 80 to 84 Years | 35 (3.4%) | 50 (4.9%) |
| 85 Years and over | 8 (0.8%) | 61 (5.9%) |
| Total | 1,017 (100.0%) | 1,026 (100.0%) |
Families and Households in Gorham
Median Family Size in Gorham
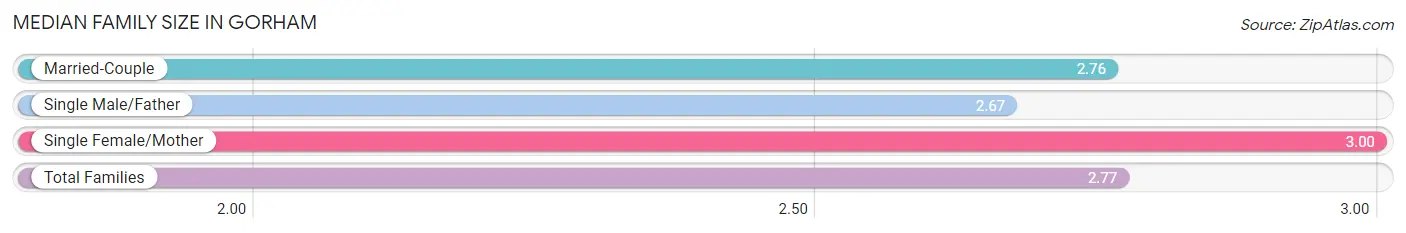
The median family size in Gorham is 2.77 persons per family, with single female/mother families (28 | 4.9%) accounting for the largest median family size of 3 persons per family. On the other hand, single male/father families (6 | 1.1%) represent the smallest median family size with 2.67 persons per family.
| Family Type | # Families | Family Size |
| Married-Couple | 537 (94.1%) | 2.76 |
| Single Male/Father | 6 (1.1%) | 2.67 |
| Single Female/Mother | 28 (4.9%) | 3.00 |
| Total Families | 571 (100.0%) | 2.77 |
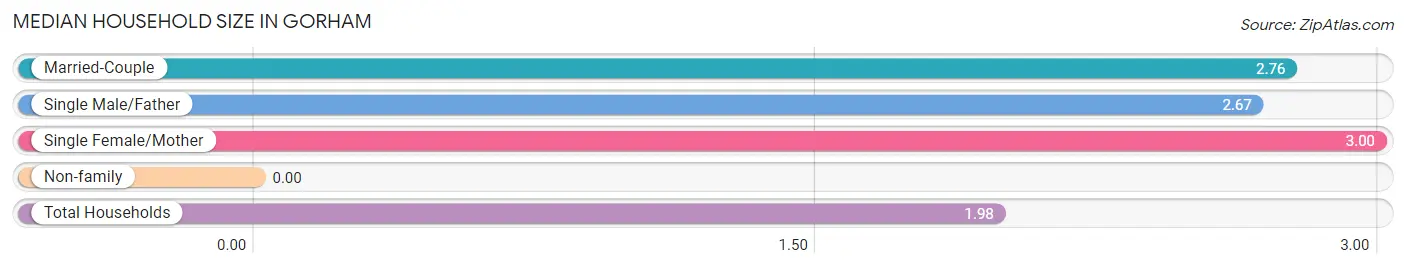
Median Household Size in Gorham
| Household Type | # Households | Household Size |
| Married-Couple | 537 (52.1%) | 2.76 |
| Single Male/Father | 6 (0.6%) | 2.67 |
| Single Female/Mother | 28 (2.7%) | 3.00 |
| Non-family | 460 (44.6%) | - |
| Total Households | 1,031 (100.0%) | 1.98 |
Household Size by Marriage Status in Gorham
Out of a total of 1,031 households in Gorham, 571 (55.4%) are family households, while 460 (44.6%) are nonfamily households. The most numerous type of family households are 2-person households, comprising 318, and the most common type of nonfamily households are 1-person households, comprising 460.
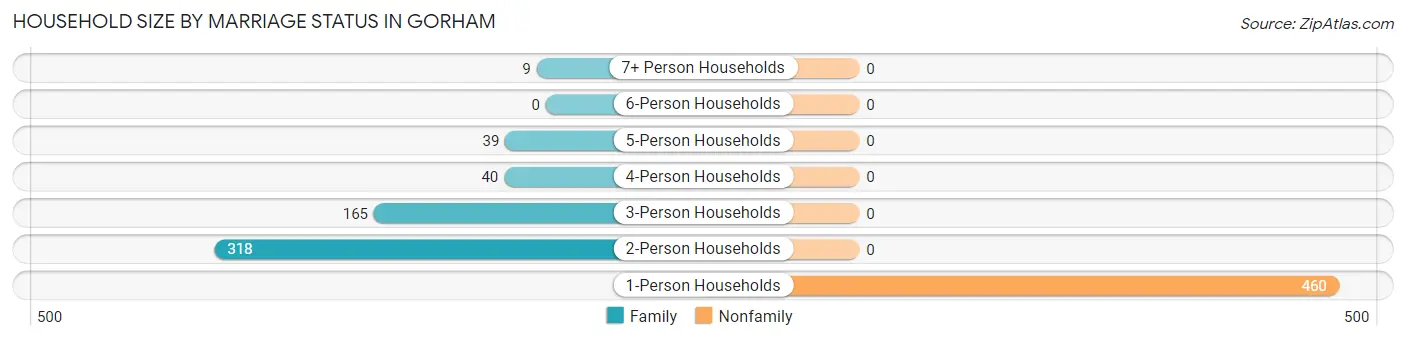
| Household Size | Family Households | Nonfamily Households |
| 1-Person Households | - | 460 (44.6%) |
| 2-Person Households | 318 (30.8%) | 0 (0.0%) |
| 3-Person Households | 165 (16.0%) | 0 (0.0%) |
| 4-Person Households | 40 (3.9%) | 0 (0.0%) |
| 5-Person Households | 39 (3.8%) | 0 (0.0%) |
| 6-Person Households | 0 (0.0%) | 0 (0.0%) |
| 7+ Person Households | 9 (0.9%) | 0 (0.0%) |
| Total | 571 (55.4%) | 460 (44.6%) |
Female Fertility in Gorham
Fertility by Age in Gorham
Average fertility rate in Gorham is 26.0 births per 1,000 women. Women in the age bracket of 35 to 50 years have the highest fertility rate with 53.0 births per 1,000 women. Women in the age bracket of 35 to 50 years acount for 100.0% of all women with births.
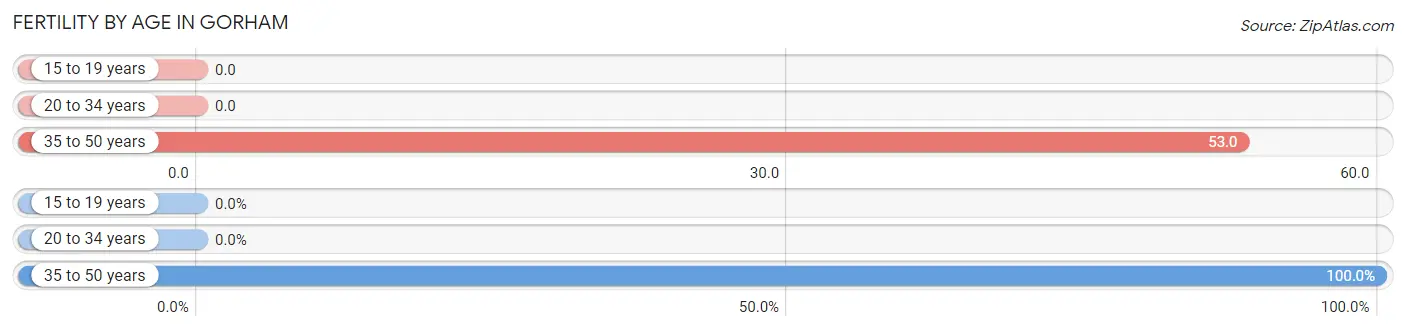
| Age Bracket | Women with Births | Births / 1,000 Women |
| 15 to 19 years | 0 (0.0%) | 0.0 |
| 20 to 34 years | 0 (0.0%) | 0.0 |
| 35 to 50 years | 9 (100.0%) | 53.0 |
| Total | 9 (100.0%) | 26.0 |
Fertility by Age by Marriage Status in Gorham
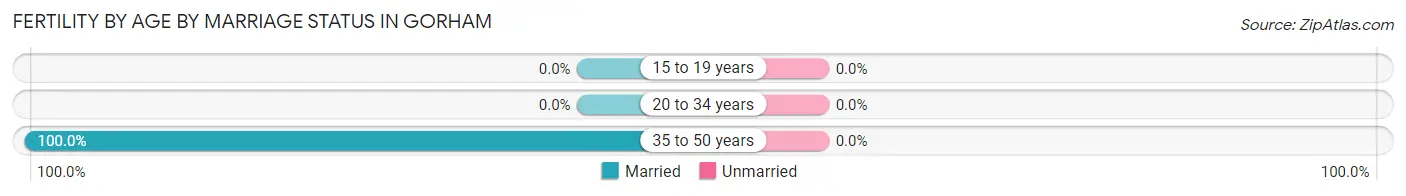
| Age Bracket | Married | Unmarried |
| 15 to 19 years | 0 (0.0%) | 0 (0.0%) |
| 20 to 34 years | 0 (0.0%) | 0 (0.0%) |
| 35 to 50 years | 9 (100.0%) | 0 (0.0%) |
| Total | 9 (100.0%) | 0 (0.0%) |
Fertility by Education in Gorham
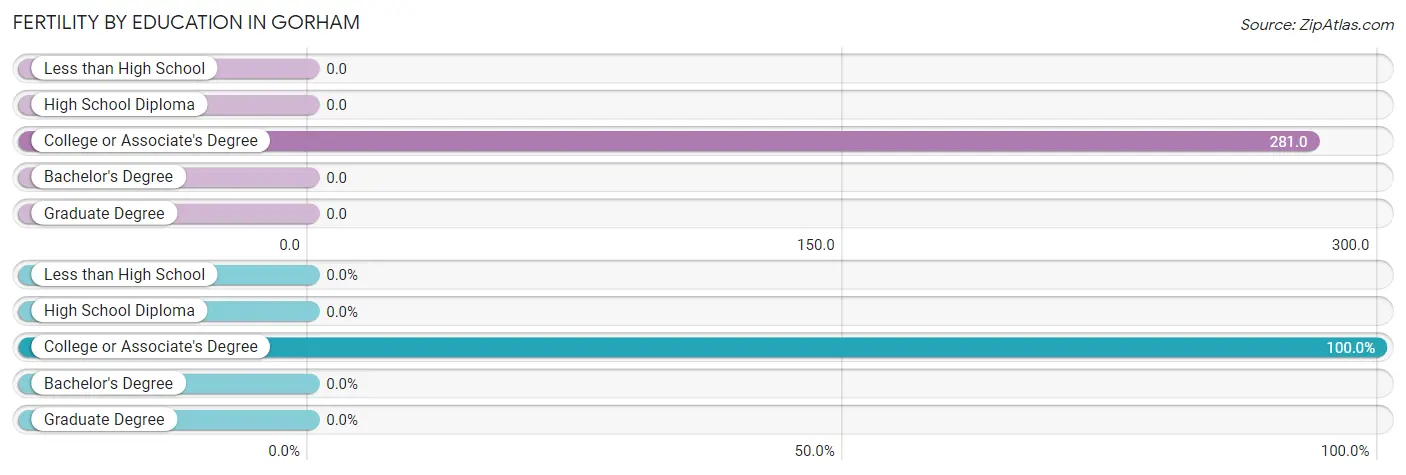
| Educational Attainment | Women with Births | Births / 1,000 Women |
| Less than High School | 0 (0.0%) | 0.0 |
| High School Diploma | 0 (0.0%) | 0.0 |
| College or Associate's Degree | 9 (100.0%) | 281.0 |
| Bachelor's Degree | 0 (0.0%) | 0.0 |
| Graduate Degree | 0 (0.0%) | 0.0 |
| Total | 9 (100.0%) | 26.0 |
Fertility by Education by Marriage Status in Gorham
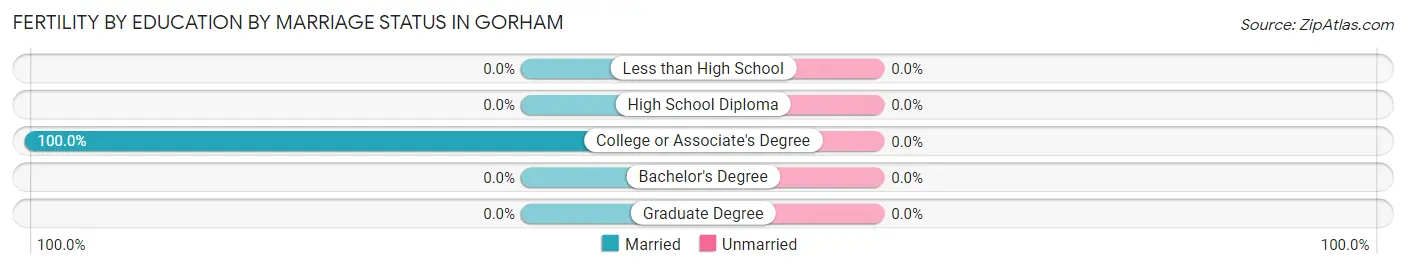
| Educational Attainment | Married | Unmarried |
| Less than High School | 0 (0.0%) | 0 (0.0%) |
| High School Diploma | 0 (0.0%) | 0 (0.0%) |
| College or Associate's Degree | 9 (100.0%) | 0 (0.0%) |
| Bachelor's Degree | 0 (0.0%) | 0 (0.0%) |
| Graduate Degree | 0 (0.0%) | 0 (0.0%) |
| Total | 9 (100.0%) | 0 (0.0%) |
Employment Characteristics in Gorham
Employment by Class of Employer in Gorham
Among the 1,061 employed individuals in Gorham, private company employees (586 | 55.2%), not-for-profit organizations (149 | 14.0%), and local government employees (141 | 13.3%) make up the most common classes of employment.
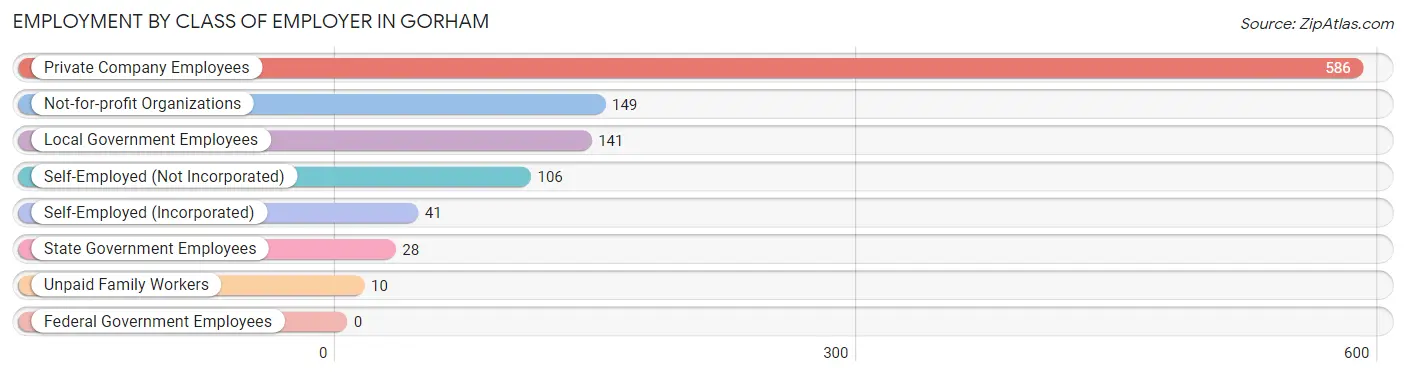
| Employer Class | # Employees | % Employees |
| Private Company Employees | 586 | 55.2% |
| Self-Employed (Incorporated) | 41 | 3.9% |
| Self-Employed (Not Incorporated) | 106 | 10.0% |
| Not-for-profit Organizations | 149 | 14.0% |
| Local Government Employees | 141 | 13.3% |
| State Government Employees | 28 | 2.6% |
| Federal Government Employees | 0 | 0.0% |
| Unpaid Family Workers | 10 | 0.9% |
| Total | 1,061 | 100.0% |
Employment Status by Age in Gorham
According to the labor force statistics for Gorham, out of the total population over 16 years of age (1,856), 57.8% or 1,073 individuals are in the labor force, with 1.0% or 11 of them unemployed. The age group with the highest labor force participation rate is 25 to 29 years, with 100.0% or 115 individuals in the labor force. Within the labor force, the 16 to 19 years age range has the highest percentage of unemployed individuals, with 29.7% or 11 of them being unemployed.
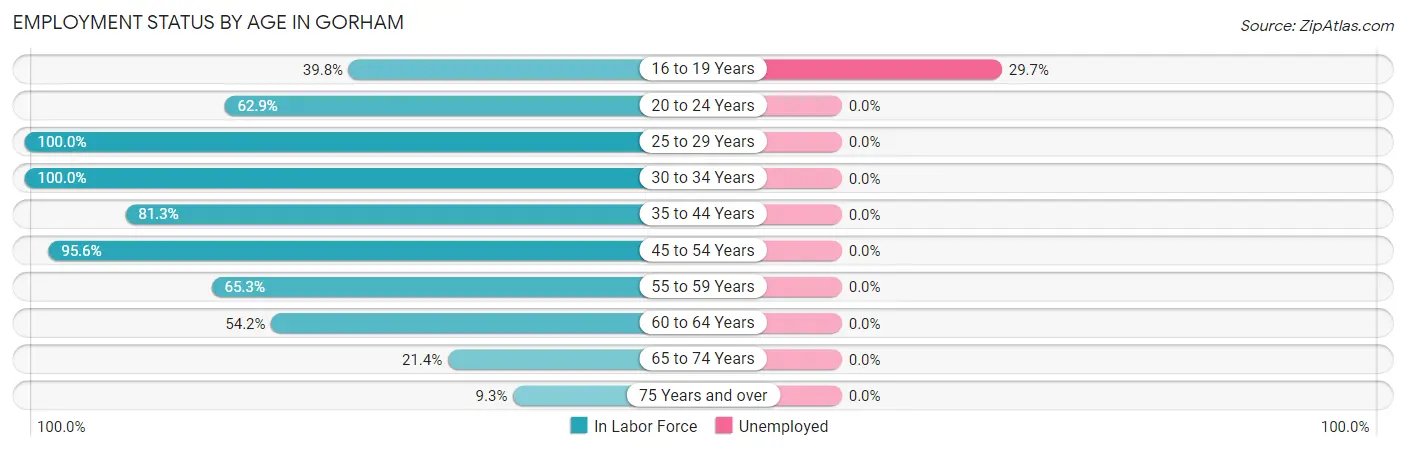
| Age Bracket | In Labor Force | Unemployed |
| 16 to 19 Years | 37 (39.8%) | 11 (29.7%) |
| 20 to 24 Years | 56 (62.9%) | 0 (0.0%) |
| 25 to 29 Years | 115 (100.0%) | 0 (0.0%) |
| 30 to 34 Years | 74 (100.0%) | 0 (0.0%) |
| 35 to 44 Years | 226 (81.3%) | 0 (0.0%) |
| 45 to 54 Years | 241 (95.6%) | 0 (0.0%) |
| 55 to 59 Years | 109 (65.3%) | 0 (0.0%) |
| 60 to 64 Years | 129 (54.2%) | 0 (0.0%) |
| 65 to 74 Years | 60 (21.4%) | 0 (0.0%) |
| 75 Years and over | 25 (9.3%) | 0 (0.0%) |
| Total | 1,073 (57.8%) | 11 (1.0%) |
Employment Status by Educational Attainment in Gorham
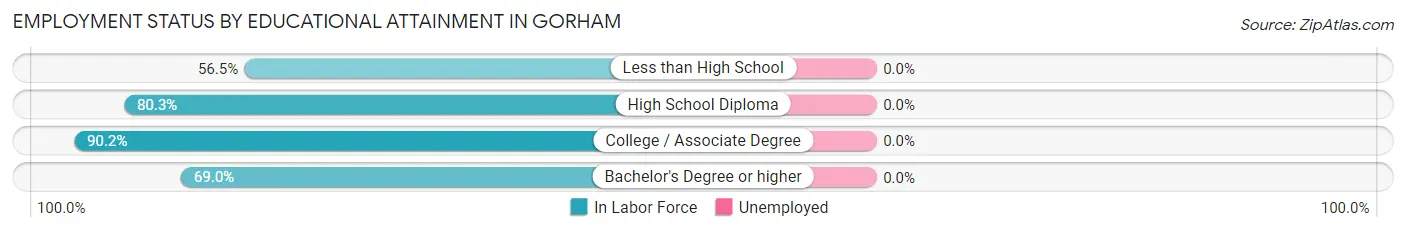
| Educational Attainment | In Labor Force | Unemployed |
| Less than High School | 13 (56.5%) | 0 (0.0%) |
| High School Diploma | 384 (80.3%) | 0 (0.0%) |
| College / Associate Degree | 286 (90.2%) | 0 (0.0%) |
| Bachelor's Degree or higher | 211 (69.0%) | 0 (0.0%) |
| Total | 894 (79.5%) | 0 (0.0%) |
Employment Occupations by Sex in Gorham
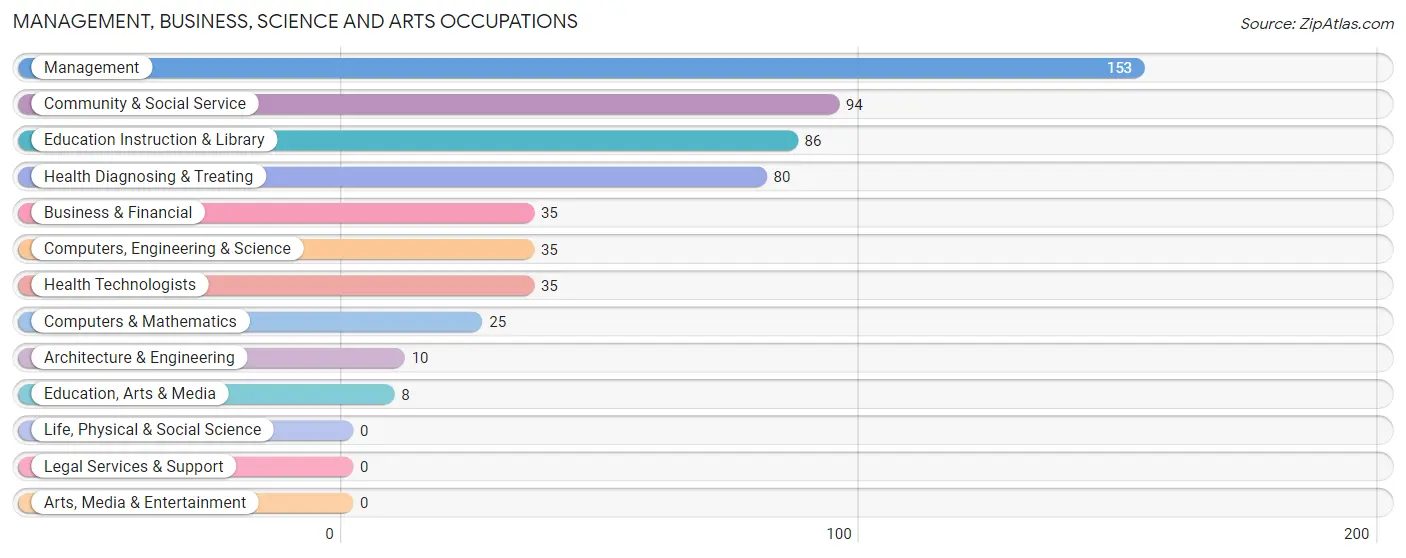
Management, Business, Science and Arts Occupations
The most common Management, Business, Science and Arts occupations in Gorham are Management (153 | 14.4%), Community & Social Service (94 | 8.9%), Education Instruction & Library (86 | 8.1%), Health Diagnosing & Treating (80 | 7.5%), and Business & Financial (35 | 3.3%).
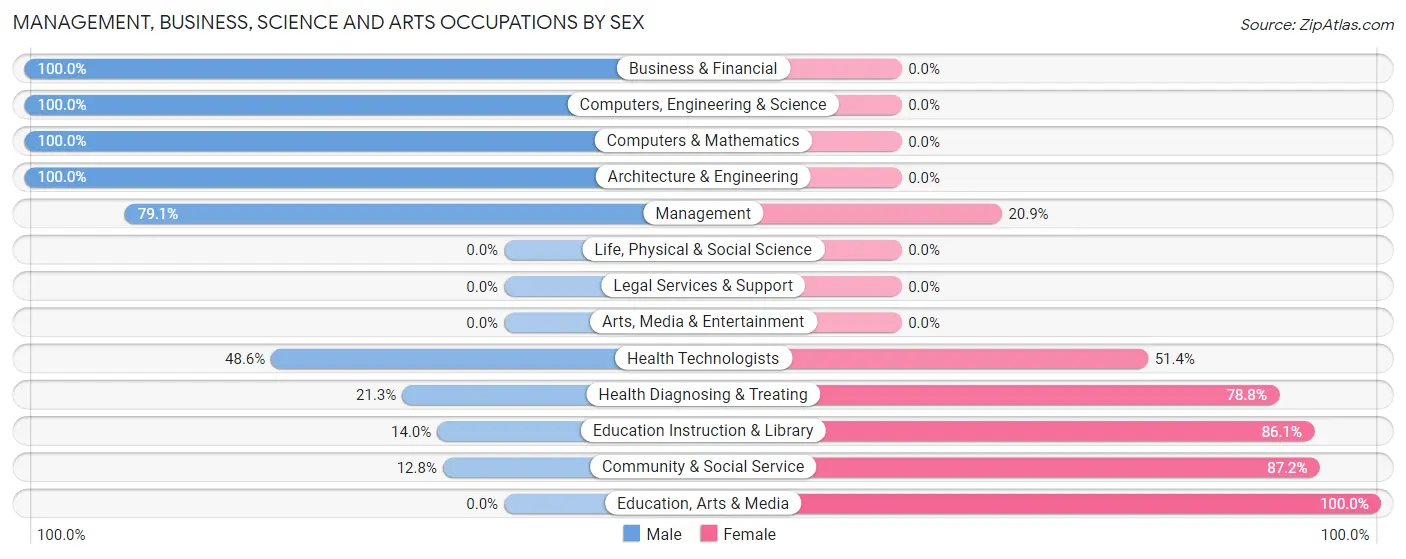
Management, Business, Science and Arts Occupations by Sex
Within the Management, Business, Science and Arts occupations in Gorham, the most male-oriented occupations are Business & Financial (100.0%), Computers, Engineering & Science (100.0%), and Computers & Mathematics (100.0%), while the most female-oriented occupations are Education, Arts & Media (100.0%), Community & Social Service (87.2%), and Education Instruction & Library (86.1%).
| Occupation | Male | Female |
| Management | 121 (79.1%) | 32 (20.9%) |
| Business & Financial | 35 (100.0%) | 0 (0.0%) |
| Computers, Engineering & Science | 35 (100.0%) | 0 (0.0%) |
| Computers & Mathematics | 25 (100.0%) | 0 (0.0%) |
| Architecture & Engineering | 10 (100.0%) | 0 (0.0%) |
| Life, Physical & Social Science | 0 (0.0%) | 0 (0.0%) |
| Community & Social Service | 12 (12.8%) | 82 (87.2%) |
| Education, Arts & Media | 0 (0.0%) | 8 (100.0%) |
| Legal Services & Support | 0 (0.0%) | 0 (0.0%) |
| Education Instruction & Library | 12 (14.0%) | 74 (86.1%) |
| Arts, Media & Entertainment | 0 (0.0%) | 0 (0.0%) |
| Health Diagnosing & Treating | 17 (21.2%) | 63 (78.7%) |
| Health Technologists | 17 (48.6%) | 18 (51.4%) |
| Total (Category) | 220 (55.4%) | 177 (44.6%) |
| Total (Overall) | 610 (57.5%) | 451 (42.5%) |
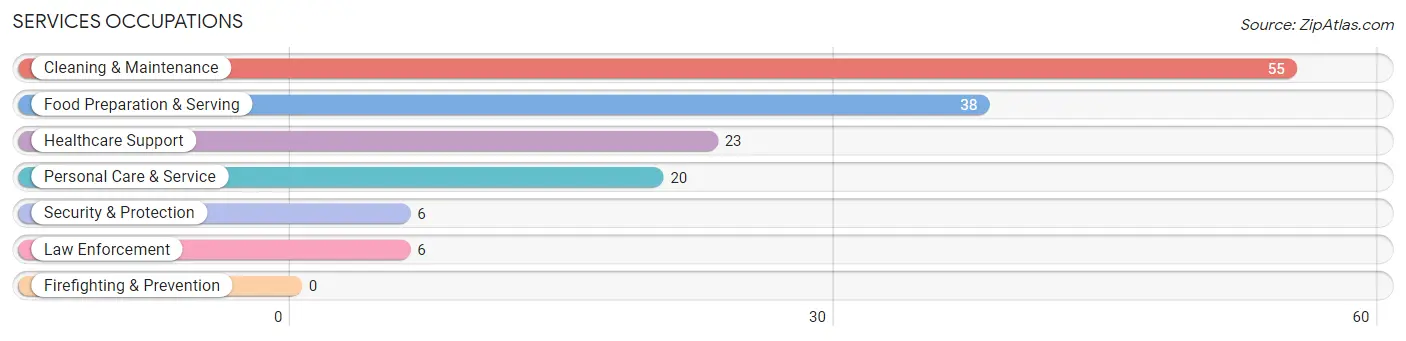
Services Occupations
The most common Services occupations in Gorham are Cleaning & Maintenance (55 | 5.2%), Food Preparation & Serving (38 | 3.6%), Healthcare Support (23 | 2.2%), Personal Care & Service (20 | 1.9%), and Security & Protection (6 | 0.6%).
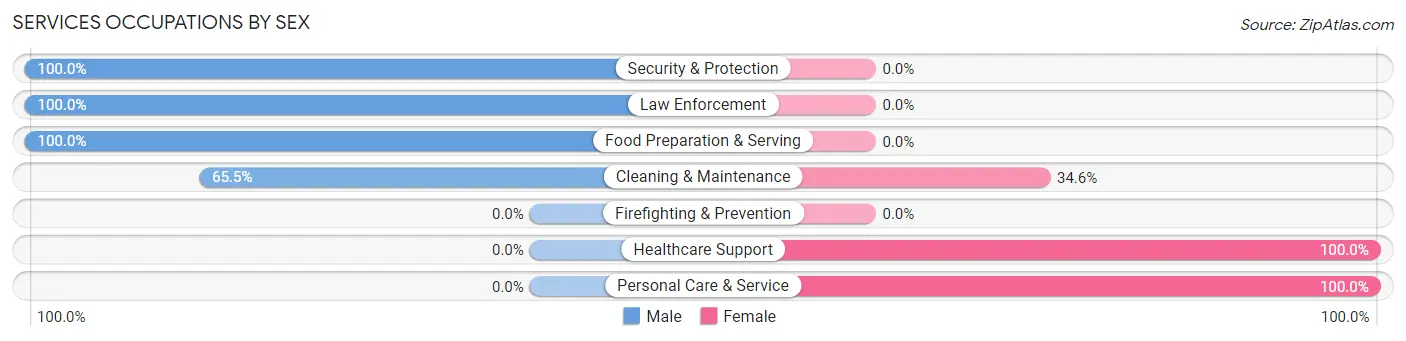
Services Occupations by Sex
Within the Services occupations in Gorham, the most male-oriented occupations are Security & Protection (100.0%), Law Enforcement (100.0%), and Food Preparation & Serving (100.0%), while the most female-oriented occupations are Healthcare Support (100.0%), Personal Care & Service (100.0%), and Cleaning & Maintenance (34.5%).
| Occupation | Male | Female |
| Healthcare Support | 0 (0.0%) | 23 (100.0%) |
| Security & Protection | 6 (100.0%) | 0 (0.0%) |
| Firefighting & Prevention | 0 (0.0%) | 0 (0.0%) |
| Law Enforcement | 6 (100.0%) | 0 (0.0%) |
| Food Preparation & Serving | 38 (100.0%) | 0 (0.0%) |
| Cleaning & Maintenance | 36 (65.4%) | 19 (34.5%) |
| Personal Care & Service | 0 (0.0%) | 20 (100.0%) |
| Total (Category) | 80 (56.3%) | 62 (43.7%) |
| Total (Overall) | 610 (57.5%) | 451 (42.5%) |
Sales and Office Occupations
The most common Sales and Office occupations in Gorham are Office & Administration (185 | 17.4%), and Sales & Related (117 | 11.0%).
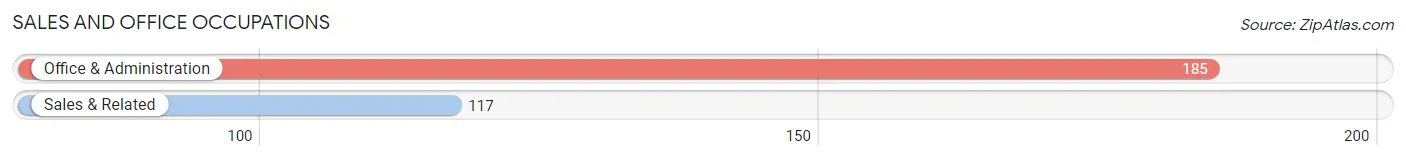
Sales and Office Occupations by Sex
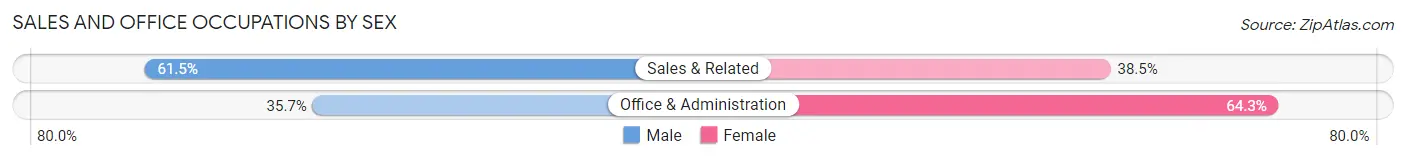
| Occupation | Male | Female |
| Sales & Related | 72 (61.5%) | 45 (38.5%) |
| Office & Administration | 66 (35.7%) | 119 (64.3%) |
| Total (Category) | 138 (45.7%) | 164 (54.3%) |
| Total (Overall) | 610 (57.5%) | 451 (42.5%) |
Natural Resources, Construction and Maintenance Occupations
The most common Natural Resources, Construction and Maintenance occupations in Gorham are Construction & Extraction (136 | 12.8%), and Installation, Maintenance & Repair (13 | 1.2%).
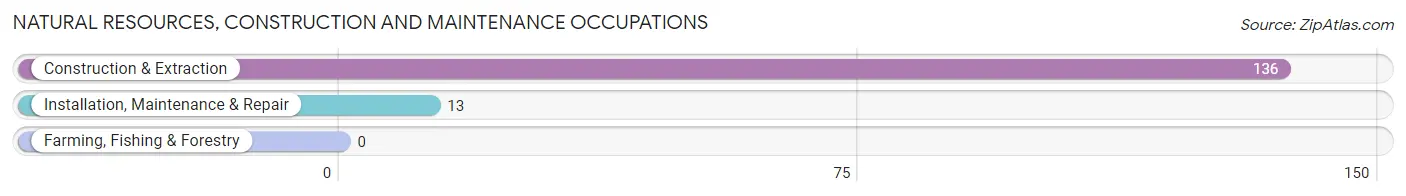
Natural Resources, Construction and Maintenance Occupations by Sex
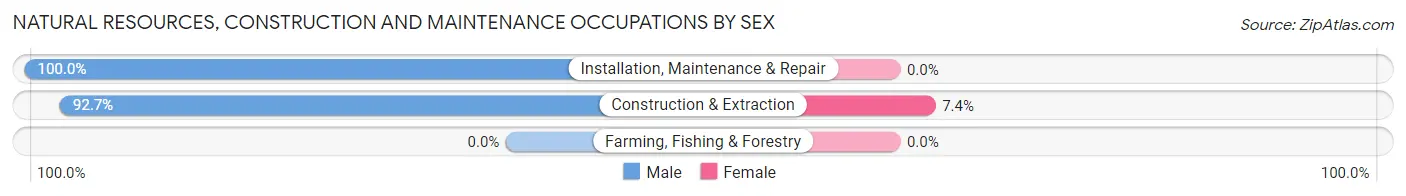
| Occupation | Male | Female |
| Farming, Fishing & Forestry | 0 (0.0%) | 0 (0.0%) |
| Construction & Extraction | 126 (92.6%) | 10 (7.3%) |
| Installation, Maintenance & Repair | 13 (100.0%) | 0 (0.0%) |
| Total (Category) | 139 (93.3%) | 10 (6.7%) |
| Total (Overall) | 610 (57.5%) | 451 (42.5%) |
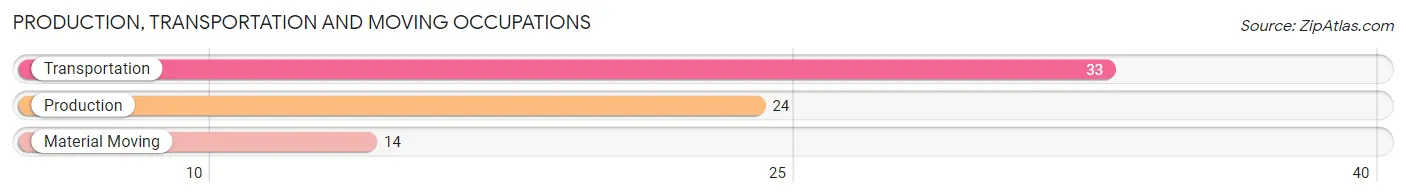
Production, Transportation and Moving Occupations
The most common Production, Transportation and Moving occupations in Gorham are Transportation (33 | 3.1%), Production (24 | 2.3%), and Material Moving (14 | 1.3%).
Production, Transportation and Moving Occupations by Sex
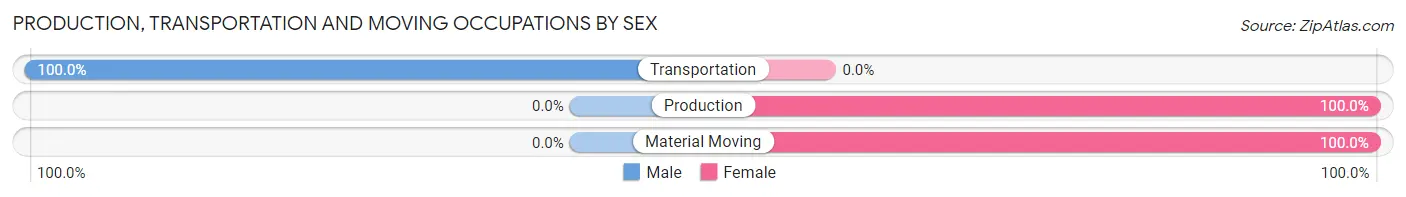
| Occupation | Male | Female |
| Production | 0 (0.0%) | 24 (100.0%) |
| Transportation | 33 (100.0%) | 0 (0.0%) |
| Material Moving | 0 (0.0%) | 14 (100.0%) |
| Total (Category) | 33 (46.5%) | 38 (53.5%) |
| Total (Overall) | 610 (57.5%) | 451 (42.5%) |
Employment Industries by Sex in Gorham
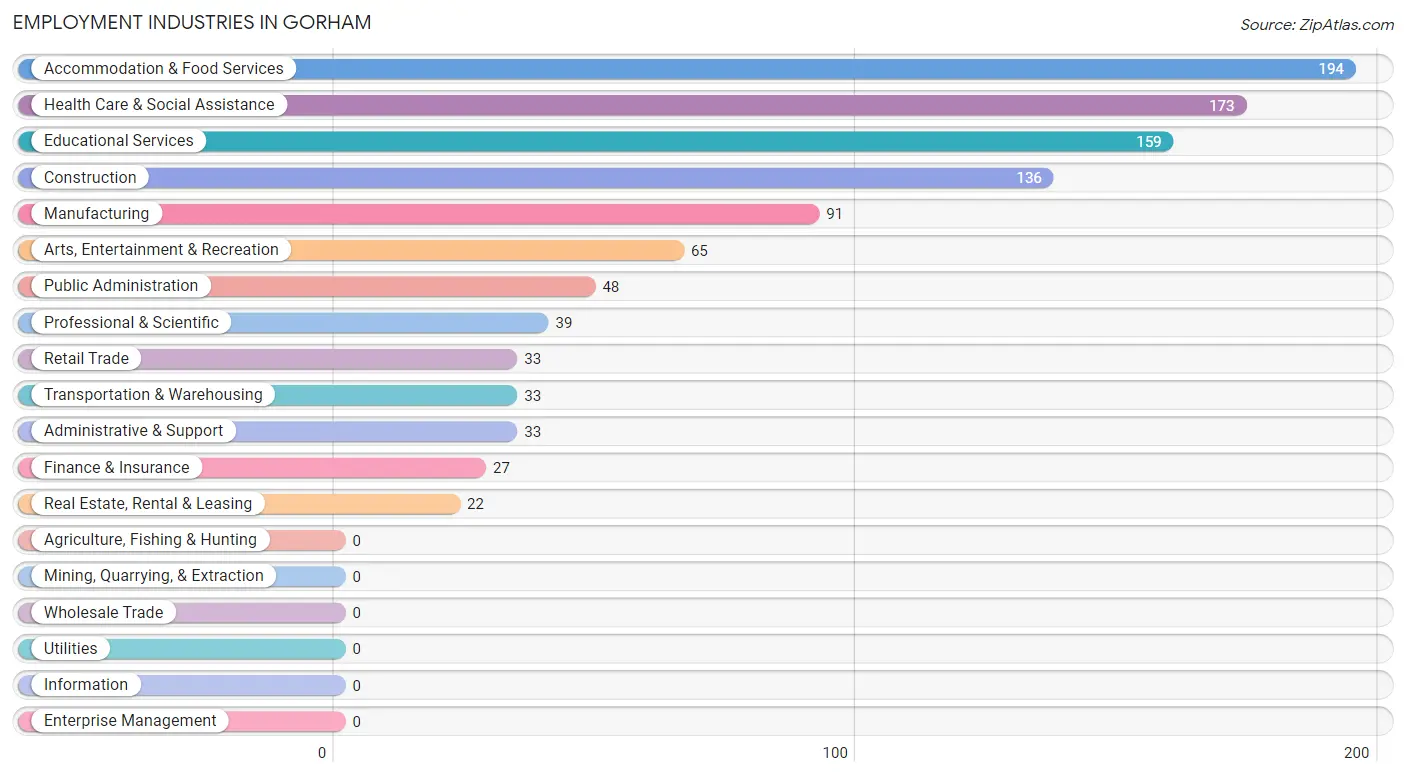
Employment Industries in Gorham
The major employment industries in Gorham include Accommodation & Food Services (194 | 18.3%), Health Care & Social Assistance (173 | 16.3%), Educational Services (159 | 15.0%), Construction (136 | 12.8%), and Manufacturing (91 | 8.6%).
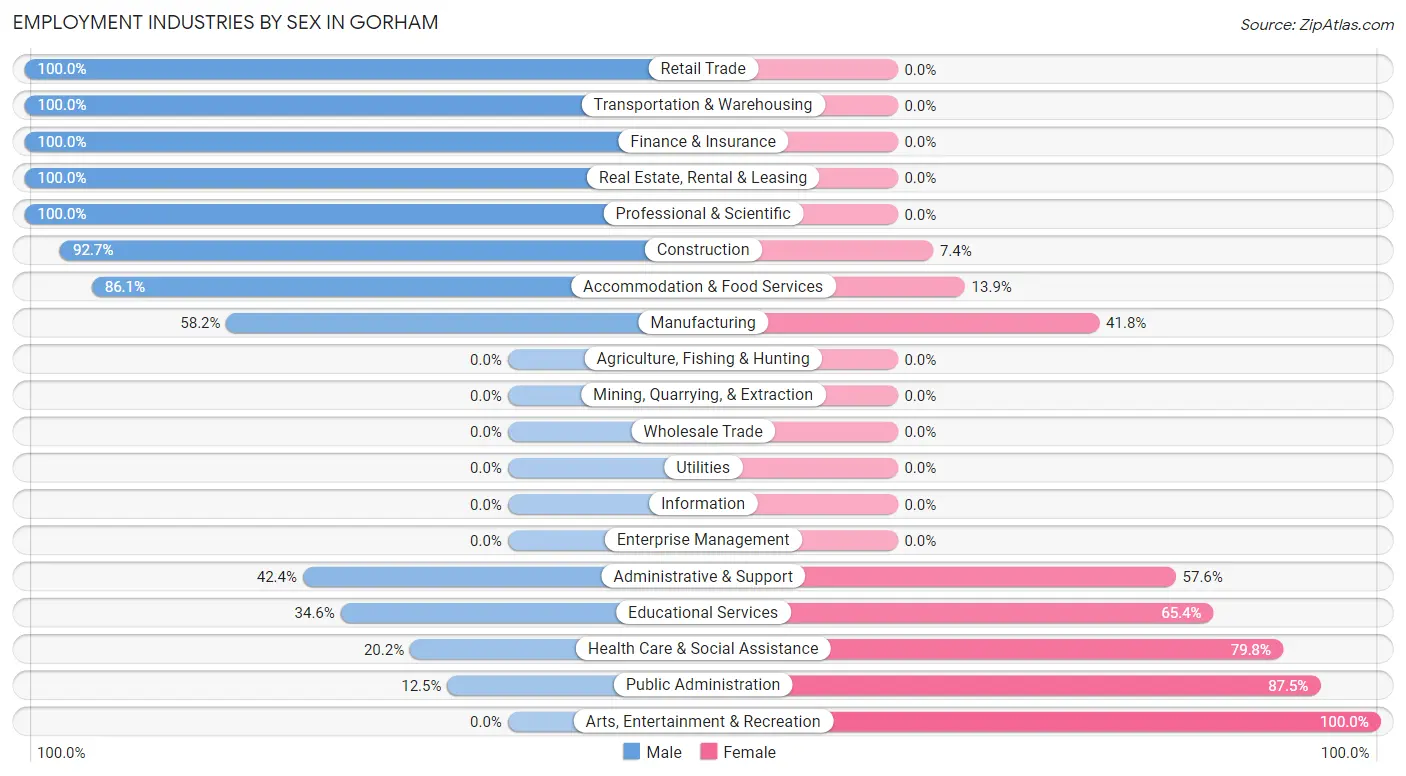
Employment Industries by Sex in Gorham
The Gorham industries that see more men than women are Retail Trade (100.0%), Transportation & Warehousing (100.0%), and Finance & Insurance (100.0%), whereas the industries that tend to have a higher number of women are Arts, Entertainment & Recreation (100.0%), Public Administration (87.5%), and Health Care & Social Assistance (79.8%).
| Industry | Male | Female |
| Agriculture, Fishing & Hunting | 0 (0.0%) | 0 (0.0%) |
| Mining, Quarrying, & Extraction | 0 (0.0%) | 0 (0.0%) |
| Construction | 126 (92.6%) | 10 (7.3%) |
| Manufacturing | 53 (58.2%) | 38 (41.8%) |
| Wholesale Trade | 0 (0.0%) | 0 (0.0%) |
| Retail Trade | 33 (100.0%) | 0 (0.0%) |
| Transportation & Warehousing | 33 (100.0%) | 0 (0.0%) |
| Utilities | 0 (0.0%) | 0 (0.0%) |
| Information | 0 (0.0%) | 0 (0.0%) |
| Finance & Insurance | 27 (100.0%) | 0 (0.0%) |
| Real Estate, Rental & Leasing | 22 (100.0%) | 0 (0.0%) |
| Professional & Scientific | 39 (100.0%) | 0 (0.0%) |
| Enterprise Management | 0 (0.0%) | 0 (0.0%) |
| Administrative & Support | 14 (42.4%) | 19 (57.6%) |
| Educational Services | 55 (34.6%) | 104 (65.4%) |
| Health Care & Social Assistance | 35 (20.2%) | 138 (79.8%) |
| Arts, Entertainment & Recreation | 0 (0.0%) | 65 (100.0%) |
| Accommodation & Food Services | 167 (86.1%) | 27 (13.9%) |
| Public Administration | 6 (12.5%) | 42 (87.5%) |
| Total | 610 (57.5%) | 451 (42.5%) |
Education in Gorham
School Enrollment in Gorham
The most common levels of schooling among the 278 students in Gorham are middle school (102 | 36.7%), high school (81 | 29.1%), and college / undergraduate (71 | 25.5%).
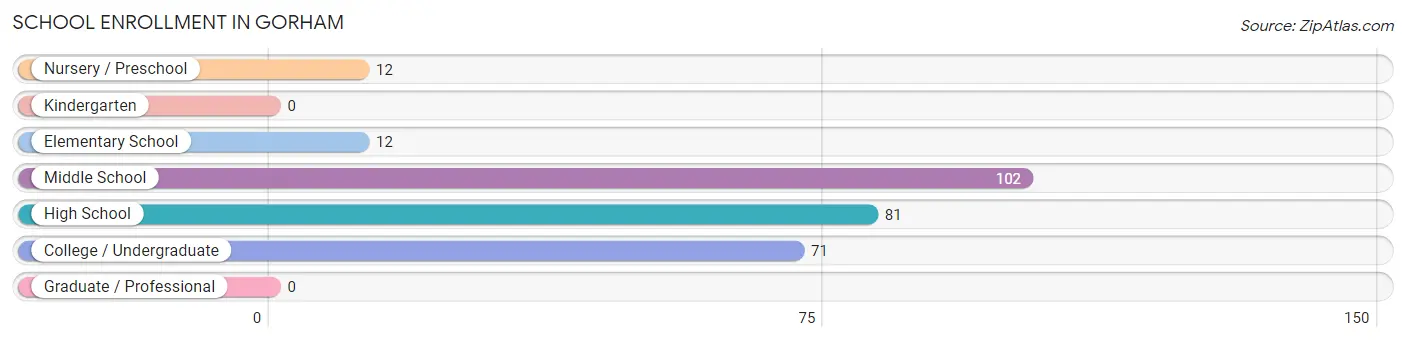
| School Level | # Students | % Students |
| Nursery / Preschool | 12 | 4.3% |
| Kindergarten | 0 | 0.0% |
| Elementary School | 12 | 4.3% |
| Middle School | 102 | 36.7% |
| High School | 81 | 29.1% |
| College / Undergraduate | 71 | 25.5% |
| Graduate / Professional | 0 | 0.0% |
| Total | 278 | 100.0% |
School Enrollment by Age by Funding Source in Gorham
Out of a total of 278 students who are enrolled in schools in Gorham, 12 (4.3%) attend a private institution, while the remaining 266 (95.7%) are enrolled in public schools. The age group of 5 to 9 year old has the highest likelihood of being enrolled in private schools, with 12 (50.0% in the age bracket) enrolled. Conversely, the age group of 10 to 14 year olds has the lowest likelihood of being enrolled in a private school, with 108 (100.0% in the age bracket) attending a public institution.
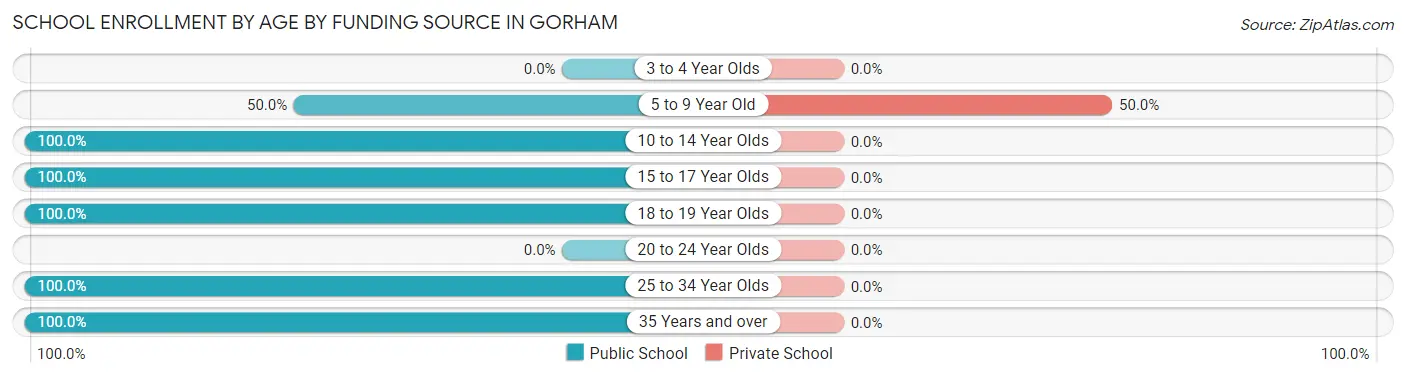
| Age Bracket | Public School | Private School |
| 3 to 4 Year Olds | 0 (0.0%) | 0 (0.0%) |
| 5 to 9 Year Old | 12 (50.0%) | 12 (50.0%) |
| 10 to 14 Year Olds | 108 (100.0%) | 0 (0.0%) |
| 15 to 17 Year Olds | 75 (100.0%) | 0 (0.0%) |
| 18 to 19 Year Olds | 26 (100.0%) | 0 (0.0%) |
| 20 to 24 Year Olds | 0 (0.0%) | 0 (0.0%) |
| 25 to 34 Year Olds | 16 (100.0%) | 0 (0.0%) |
| 35 Years and over | 29 (100.0%) | 0 (0.0%) |
| Total | 266 (95.7%) | 12 (4.3%) |
Educational Attainment by Field of Study in Gorham
Education (115 | 22.4%), visual & performing arts (81 | 15.8%), science & technology (50 | 9.8%), arts & humanities (46 | 9.0%), and bio, nature & agricultural (38 | 7.4%) are the most common fields of study among 513 individuals in Gorham who have obtained a bachelor's degree or higher.
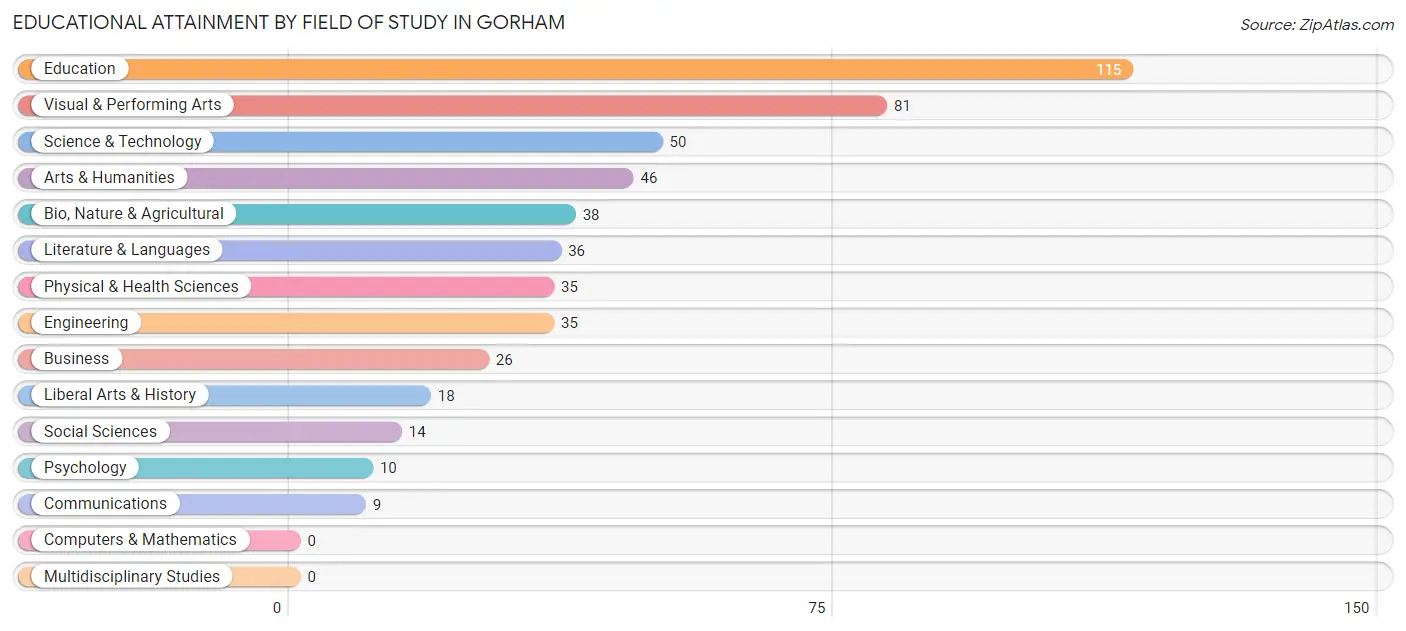
| Field of Study | # Graduates | % Graduates |
| Computers & Mathematics | 0 | 0.0% |
| Bio, Nature & Agricultural | 38 | 7.4% |
| Physical & Health Sciences | 35 | 6.8% |
| Psychology | 10 | 1.9% |
| Social Sciences | 14 | 2.7% |
| Engineering | 35 | 6.8% |
| Multidisciplinary Studies | 0 | 0.0% |
| Science & Technology | 50 | 9.8% |
| Business | 26 | 5.1% |
| Education | 115 | 22.4% |
| Literature & Languages | 36 | 7.0% |
| Liberal Arts & History | 18 | 3.5% |
| Visual & Performing Arts | 81 | 15.8% |
| Communications | 9 | 1.8% |
| Arts & Humanities | 46 | 9.0% |
| Total | 513 | 100.0% |
Transportation & Commute in Gorham
Vehicle Availability by Sex in Gorham
The most prevalent vehicle ownership categories in Gorham are males with 1 vehicle (271, accounting for 44.4%) and females with 1 vehicle (250, making up 60.1%).
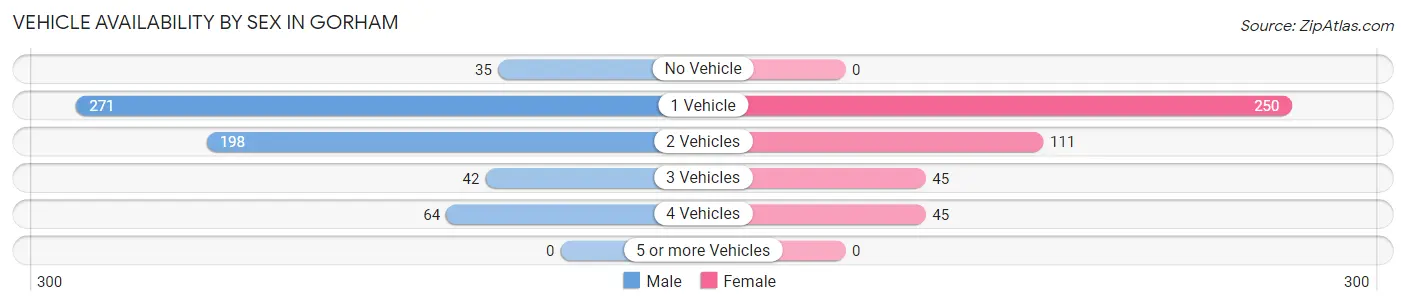
| Vehicles Available | Male | Female |
| No Vehicle | 35 (5.7%) | 0 (0.0%) |
| 1 Vehicle | 271 (44.4%) | 250 (55.4%) |
| 2 Vehicles | 198 (32.5%) | 111 (24.6%) |
| 3 Vehicles | 42 (6.9%) | 45 (10.0%) |
| 4 Vehicles | 64 (10.5%) | 45 (10.0%) |
| 5 or more Vehicles | 0 (0.0%) | 0 (0.0%) |
| Total | 610 (100.0%) | 451 (100.0%) |
Commute Time in Gorham
The most frequently occuring commute durations in Gorham are 10 to 14 minutes (176 commuters, 16.9%), 5 to 9 minutes (153 commuters, 14.7%), and less than 5 minutes (128 commuters, 12.3%).
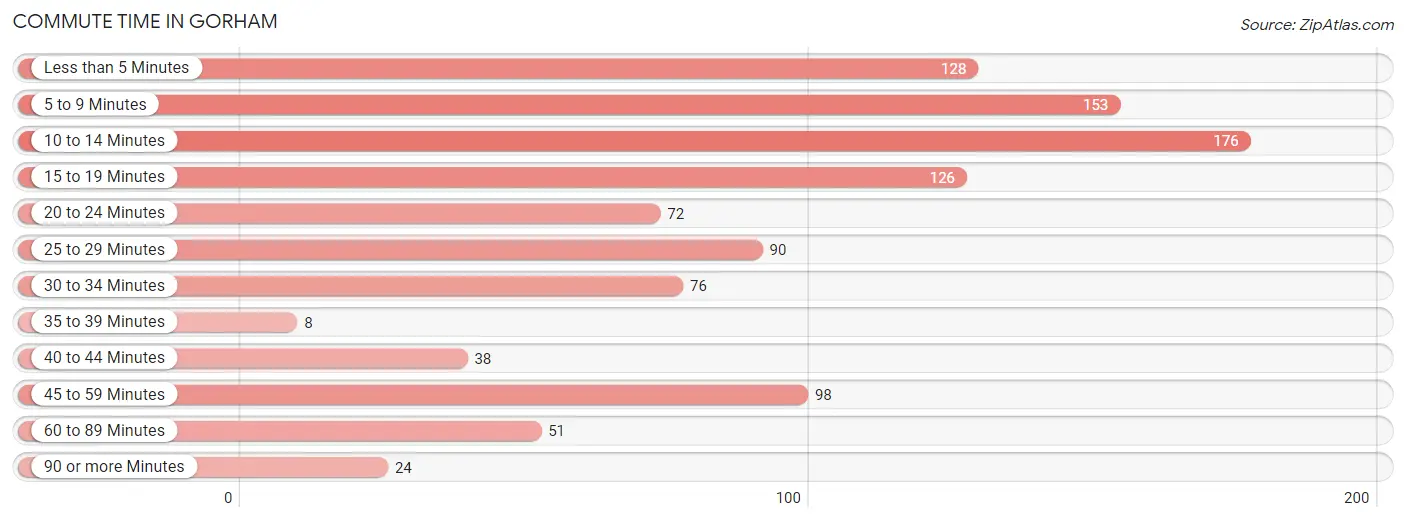
| Commute Time | # Commuters | % Commuters |
| Less than 5 Minutes | 128 | 12.3% |
| 5 to 9 Minutes | 153 | 14.7% |
| 10 to 14 Minutes | 176 | 16.9% |
| 15 to 19 Minutes | 126 | 12.1% |
| 20 to 24 Minutes | 72 | 6.9% |
| 25 to 29 Minutes | 90 | 8.6% |
| 30 to 34 Minutes | 76 | 7.3% |
| 35 to 39 Minutes | 8 | 0.8% |
| 40 to 44 Minutes | 38 | 3.6% |
| 45 to 59 Minutes | 98 | 9.4% |
| 60 to 89 Minutes | 51 | 4.9% |
| 90 or more Minutes | 24 | 2.3% |
Commute Time by Sex in Gorham
The most common commute times in Gorham are 5 to 9 minutes (117 commuters, 19.6%) for males and 10 to 14 minutes (112 commuters, 25.3%) for females.
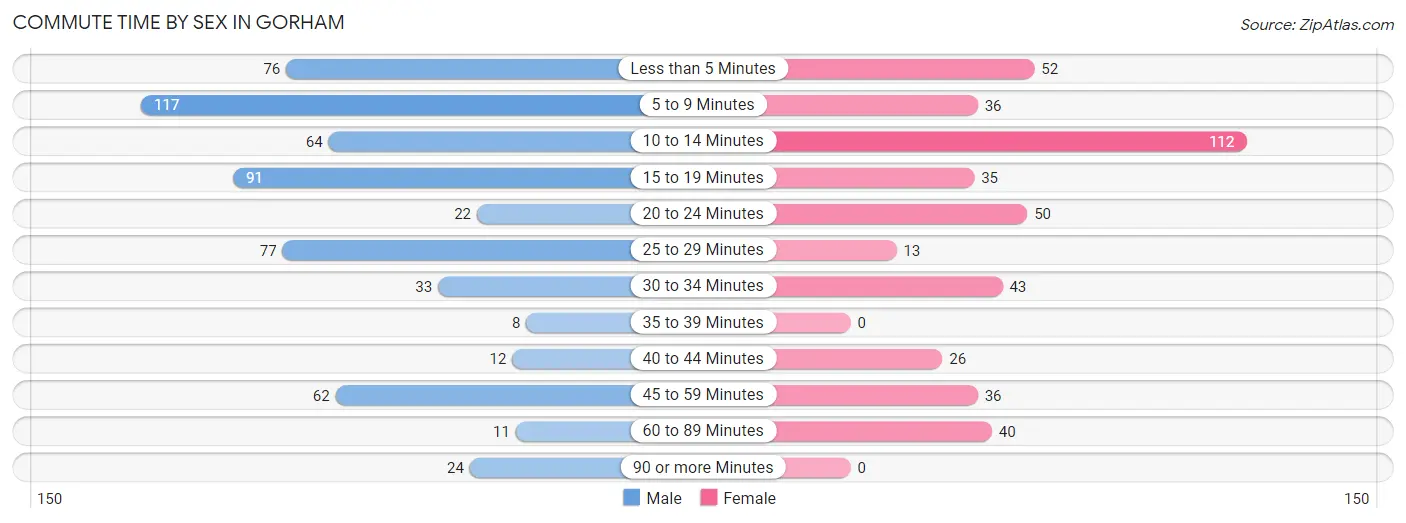
| Commute Time | Male | Female |
| Less than 5 Minutes | 76 (12.7%) | 52 (11.7%) |
| 5 to 9 Minutes | 117 (19.6%) | 36 (8.1%) |
| 10 to 14 Minutes | 64 (10.7%) | 112 (25.3%) |
| 15 to 19 Minutes | 91 (15.2%) | 35 (7.9%) |
| 20 to 24 Minutes | 22 (3.7%) | 50 (11.3%) |
| 25 to 29 Minutes | 77 (12.9%) | 13 (2.9%) |
| 30 to 34 Minutes | 33 (5.5%) | 43 (9.7%) |
| 35 to 39 Minutes | 8 (1.3%) | 0 (0.0%) |
| 40 to 44 Minutes | 12 (2.0%) | 26 (5.9%) |
| 45 to 59 Minutes | 62 (10.4%) | 36 (8.1%) |
| 60 to 89 Minutes | 11 (1.8%) | 40 (9.0%) |
| 90 or more Minutes | 24 (4.0%) | 0 (0.0%) |
Time of Departure to Work by Sex in Gorham
The most frequent times of departure to work in Gorham are 12:00 PM to 3:59 PM (115, 19.3%) for males and 7:30 AM to 7:59 AM (156, 35.2%) for females.
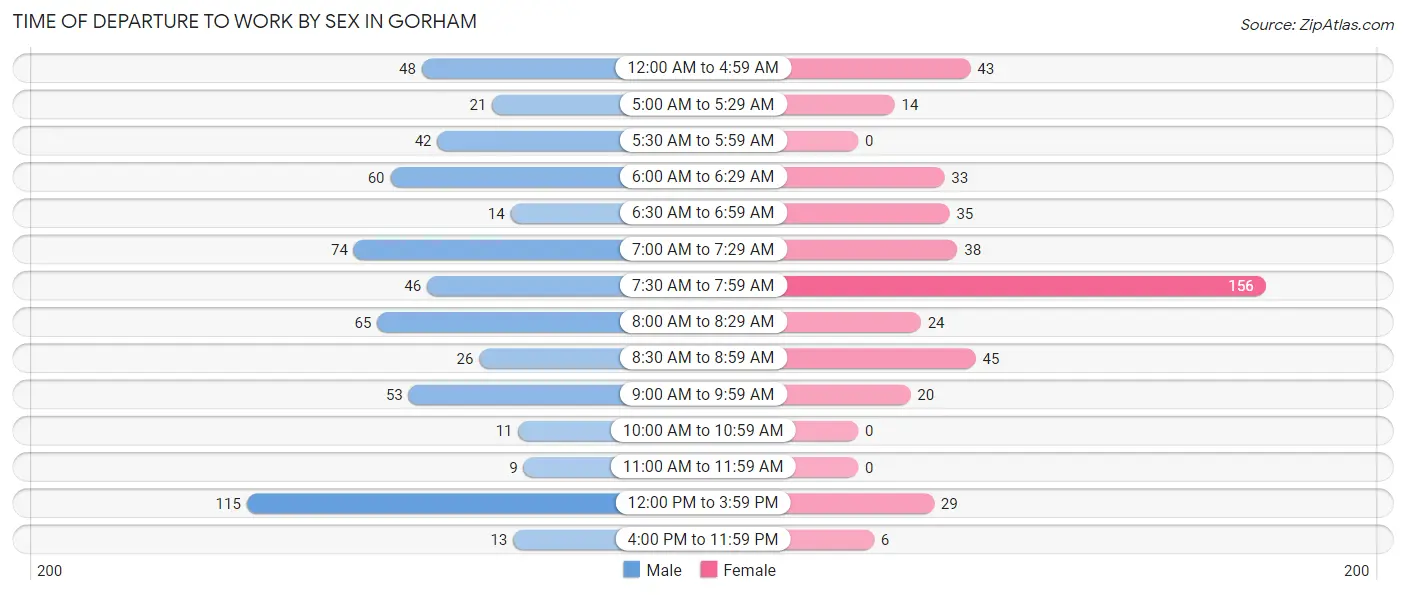
| Time of Departure | Male | Female |
| 12:00 AM to 4:59 AM | 48 (8.0%) | 43 (9.7%) |
| 5:00 AM to 5:29 AM | 21 (3.5%) | 14 (3.2%) |
| 5:30 AM to 5:59 AM | 42 (7.0%) | 0 (0.0%) |
| 6:00 AM to 6:29 AM | 60 (10.1%) | 33 (7.4%) |
| 6:30 AM to 6:59 AM | 14 (2.4%) | 35 (7.9%) |
| 7:00 AM to 7:29 AM | 74 (12.4%) | 38 (8.6%) |
| 7:30 AM to 7:59 AM | 46 (7.7%) | 156 (35.2%) |
| 8:00 AM to 8:29 AM | 65 (10.9%) | 24 (5.4%) |
| 8:30 AM to 8:59 AM | 26 (4.4%) | 45 (10.2%) |
| 9:00 AM to 9:59 AM | 53 (8.9%) | 20 (4.5%) |
| 10:00 AM to 10:59 AM | 11 (1.8%) | 0 (0.0%) |
| 11:00 AM to 11:59 AM | 9 (1.5%) | 0 (0.0%) |
| 12:00 PM to 3:59 PM | 115 (19.3%) | 29 (6.6%) |
| 4:00 PM to 11:59 PM | 13 (2.2%) | 6 (1.3%) |
| Total | 597 (100.0%) | 443 (100.0%) |
Housing Occupancy in Gorham
Occupancy by Ownership in Gorham
Of the total 1,031 dwellings in Gorham, owner-occupied units account for 727 (70.5%), while renter-occupied units make up 304 (29.5%).
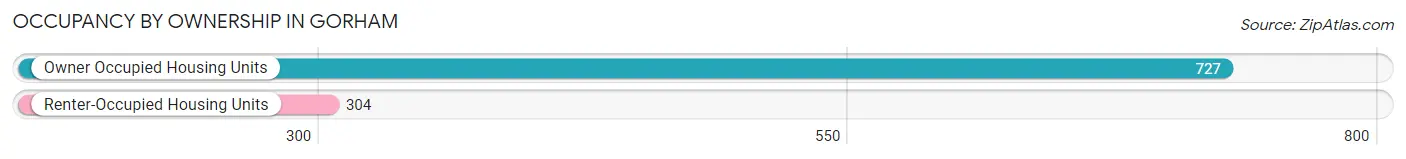
| Occupancy | # Housing Units | % Housing Units |
| Owner Occupied Housing Units | 727 | 70.5% |
| Renter-Occupied Housing Units | 304 | 29.5% |
| Total Occupied Housing Units | 1,031 | 100.0% |
Occupancy by Household Size in Gorham
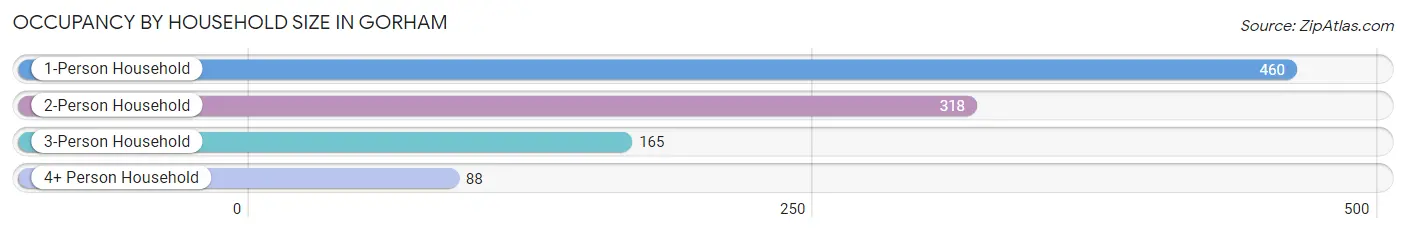
| Household Size | # Housing Units | % Housing Units |
| 1-Person Household | 460 | 44.6% |
| 2-Person Household | 318 | 30.8% |
| 3-Person Household | 165 | 16.0% |
| 4+ Person Household | 88 | 8.5% |
| Total Housing Units | 1,031 | 100.0% |
Occupancy by Ownership by Household Size in Gorham
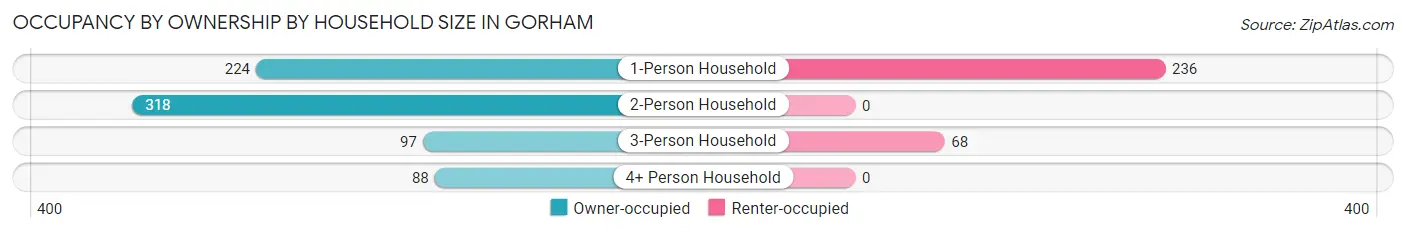
| Household Size | Owner-occupied | Renter-occupied |
| 1-Person Household | 224 (48.7%) | 236 (51.3%) |
| 2-Person Household | 318 (100.0%) | 0 (0.0%) |
| 3-Person Household | 97 (58.8%) | 68 (41.2%) |
| 4+ Person Household | 88 (100.0%) | 0 (0.0%) |
| Total Housing Units | 727 (70.5%) | 304 (29.5%) |
Occupancy by Educational Attainment in Gorham
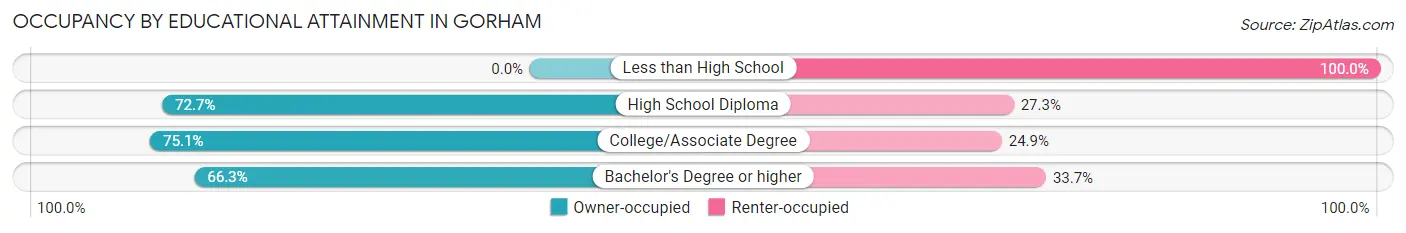
| Household Size | Owner-occupied | Renter-occupied |
| Less than High School | 0 (0.0%) | 13 (100.0%) |
| High School Diploma | 336 (72.7%) | 126 (27.3%) |
| College/Associate Degree | 190 (75.1%) | 63 (24.9%) |
| Bachelor's Degree or higher | 201 (66.3%) | 102 (33.7%) |
Occupancy by Age of Householder in Gorham
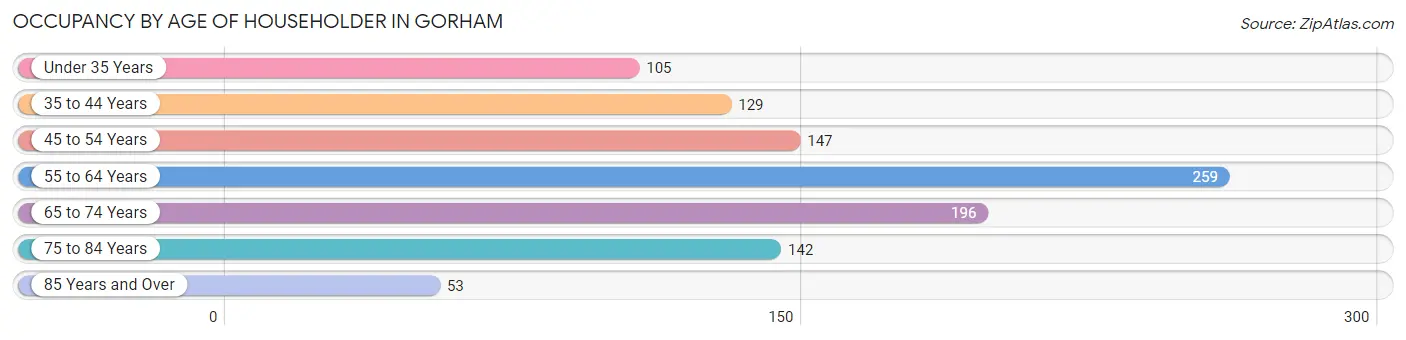
| Age Bracket | # Households | % Households |
| Under 35 Years | 105 | 10.2% |
| 35 to 44 Years | 129 | 12.5% |
| 45 to 54 Years | 147 | 14.3% |
| 55 to 64 Years | 259 | 25.1% |
| 65 to 74 Years | 196 | 19.0% |
| 75 to 84 Years | 142 | 13.8% |
| 85 Years and Over | 53 | 5.1% |
| Total | 1,031 | 100.0% |
Housing Finances in Gorham
Median Income by Occupancy in Gorham
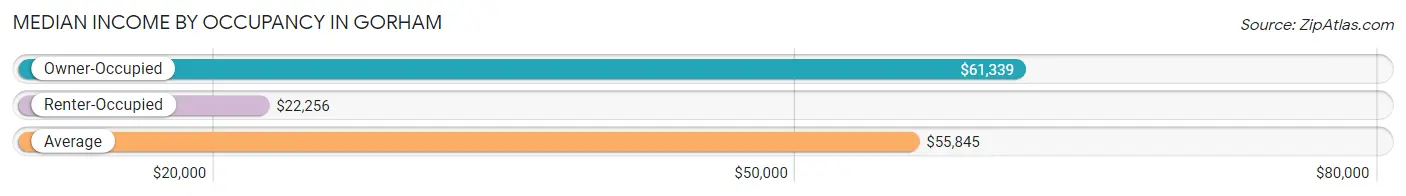
| Occupancy Type | # Households | Median Income |
| Owner-Occupied | 727 (70.5%) | $61,339 |
| Renter-Occupied | 304 (29.5%) | $22,256 |
| Average | 1,031 (100.0%) | $55,845 |
Occupancy by Householder Income Bracket in Gorham
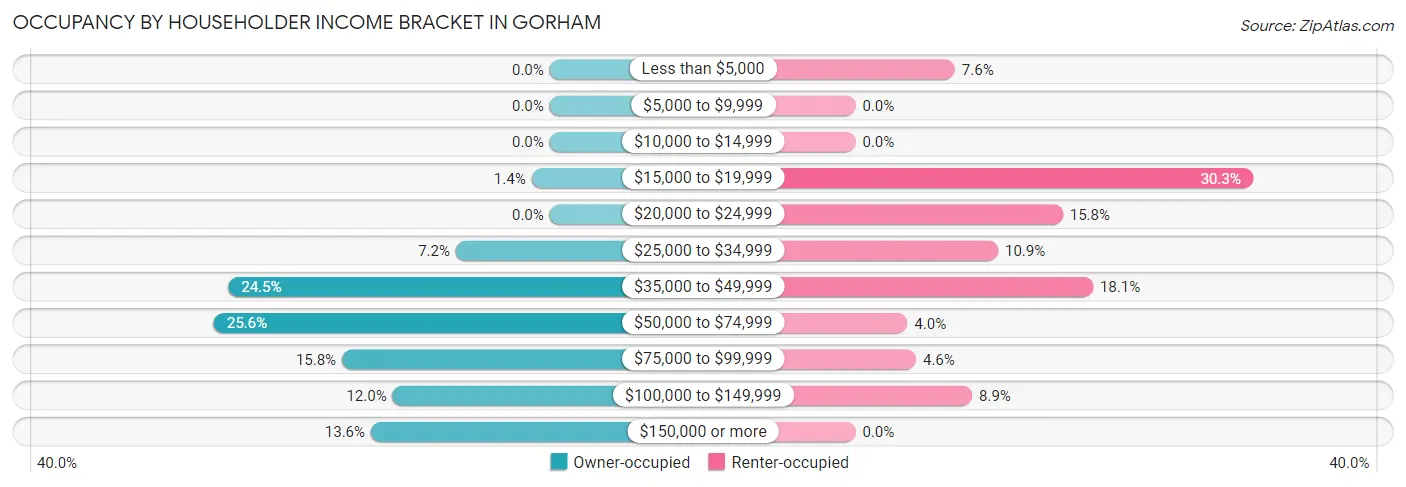
| Income Bracket | Owner-occupied | Renter-occupied |
| Less than $5,000 | 0 (0.0%) | 23 (7.6%) |
| $5,000 to $9,999 | 0 (0.0%) | 0 (0.0%) |
| $10,000 to $14,999 | 0 (0.0%) | 0 (0.0%) |
| $15,000 to $19,999 | 10 (1.4%) | 92 (30.3%) |
| $20,000 to $24,999 | 0 (0.0%) | 48 (15.8%) |
| $25,000 to $34,999 | 52 (7.1%) | 33 (10.9%) |
| $35,000 to $49,999 | 178 (24.5%) | 55 (18.1%) |
| $50,000 to $74,999 | 186 (25.6%) | 12 (4.0%) |
| $75,000 to $99,999 | 115 (15.8%) | 14 (4.6%) |
| $100,000 to $149,999 | 87 (12.0%) | 27 (8.9%) |
| $150,000 or more | 99 (13.6%) | 0 (0.0%) |
| Total | 727 (100.0%) | 304 (100.0%) |
Monthly Housing Cost Tiers in Gorham
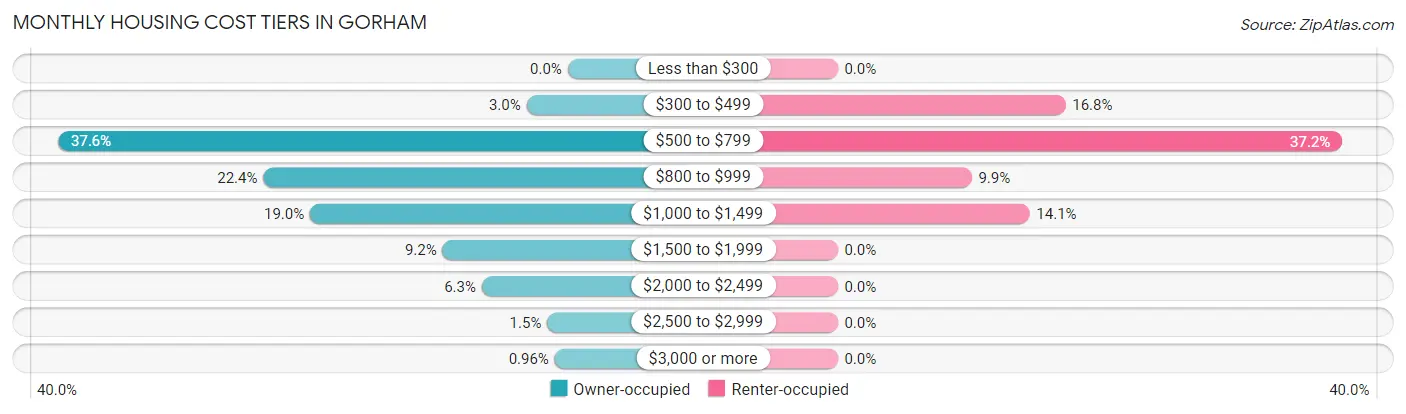
| Monthly Cost | Owner-occupied | Renter-occupied |
| Less than $300 | 0 (0.0%) | 0 (0.0%) |
| $300 to $499 | 22 (3.0%) | 51 (16.8%) |
| $500 to $799 | 273 (37.6%) | 113 (37.2%) |
| $800 to $999 | 163 (22.4%) | 30 (9.9%) |
| $1,000 to $1,499 | 138 (19.0%) | 43 (14.1%) |
| $1,500 to $1,999 | 67 (9.2%) | 0 (0.0%) |
| $2,000 to $2,499 | 46 (6.3%) | 0 (0.0%) |
| $2,500 to $2,999 | 11 (1.5%) | 0 (0.0%) |
| $3,000 or more | 7 (1.0%) | 0 (0.0%) |
| Total | 727 (100.0%) | 304 (100.0%) |
Physical Housing Characteristics in Gorham
Housing Structures in Gorham
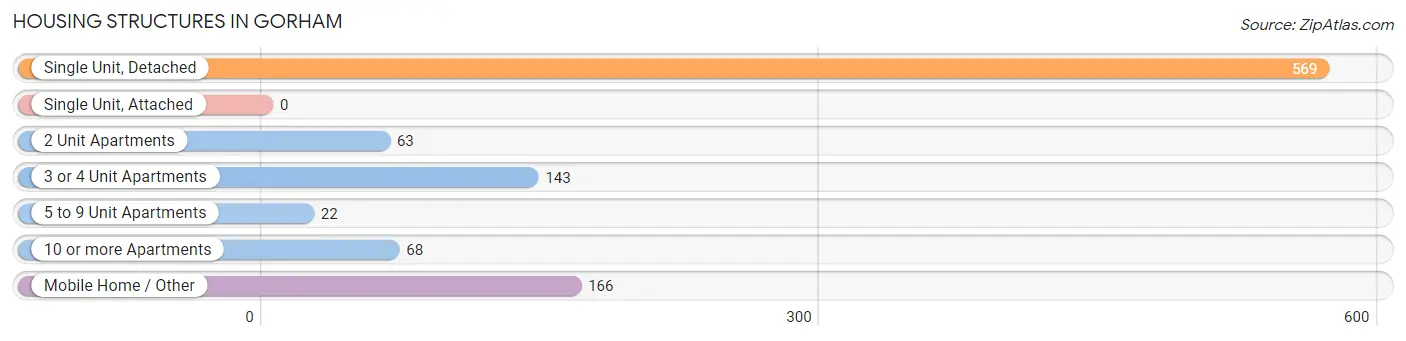
| Structure Type | # Housing Units | % Housing Units |
| Single Unit, Detached | 569 | 55.2% |
| Single Unit, Attached | 0 | 0.0% |
| 2 Unit Apartments | 63 | 6.1% |
| 3 or 4 Unit Apartments | 143 | 13.9% |
| 5 to 9 Unit Apartments | 22 | 2.1% |
| 10 or more Apartments | 68 | 6.6% |
| Mobile Home / Other | 166 | 16.1% |
| Total | 1,031 | 100.0% |
Housing Structures by Occupancy in Gorham
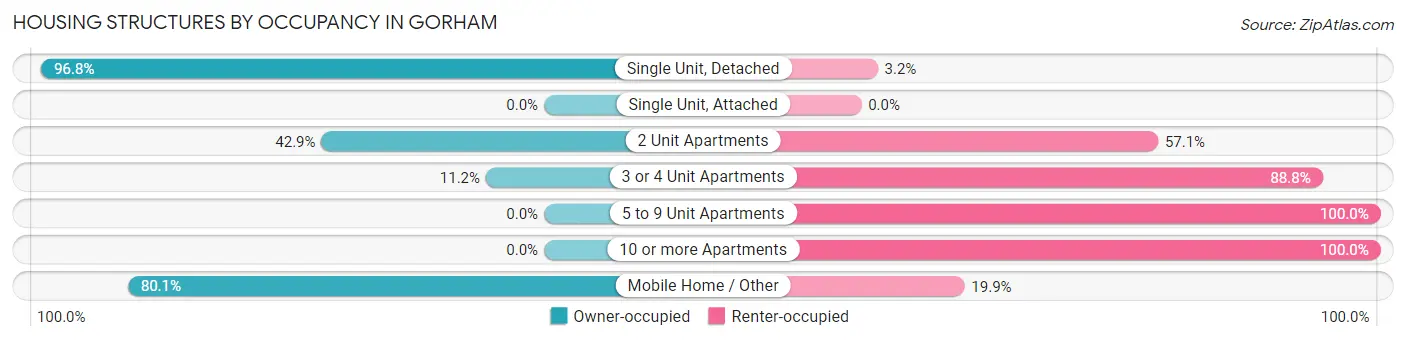
| Structure Type | Owner-occupied | Renter-occupied |
| Single Unit, Detached | 551 (96.8%) | 18 (3.2%) |
| Single Unit, Attached | 0 (0.0%) | 0 (0.0%) |
| 2 Unit Apartments | 27 (42.9%) | 36 (57.1%) |
| 3 or 4 Unit Apartments | 16 (11.2%) | 127 (88.8%) |
| 5 to 9 Unit Apartments | 0 (0.0%) | 22 (100.0%) |
| 10 or more Apartments | 0 (0.0%) | 68 (100.0%) |
| Mobile Home / Other | 133 (80.1%) | 33 (19.9%) |
| Total | 727 (70.5%) | 304 (29.5%) |
Housing Structures by Number of Rooms in Gorham
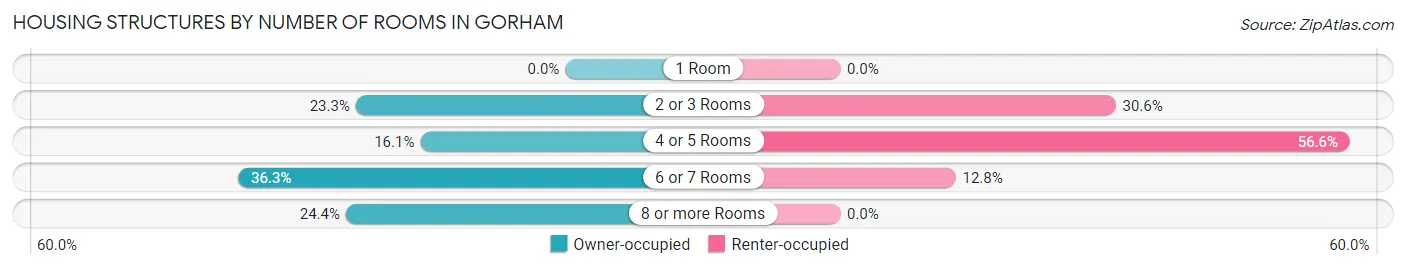
| Number of Rooms | Owner-occupied | Renter-occupied |
| 1 Room | 0 (0.0%) | 0 (0.0%) |
| 2 or 3 Rooms | 169 (23.3%) | 93 (30.6%) |
| 4 or 5 Rooms | 117 (16.1%) | 172 (56.6%) |
| 6 or 7 Rooms | 264 (36.3%) | 39 (12.8%) |
| 8 or more Rooms | 177 (24.3%) | 0 (0.0%) |
| Total | 727 (100.0%) | 304 (100.0%) |
Housing Structure by Heating Type in Gorham
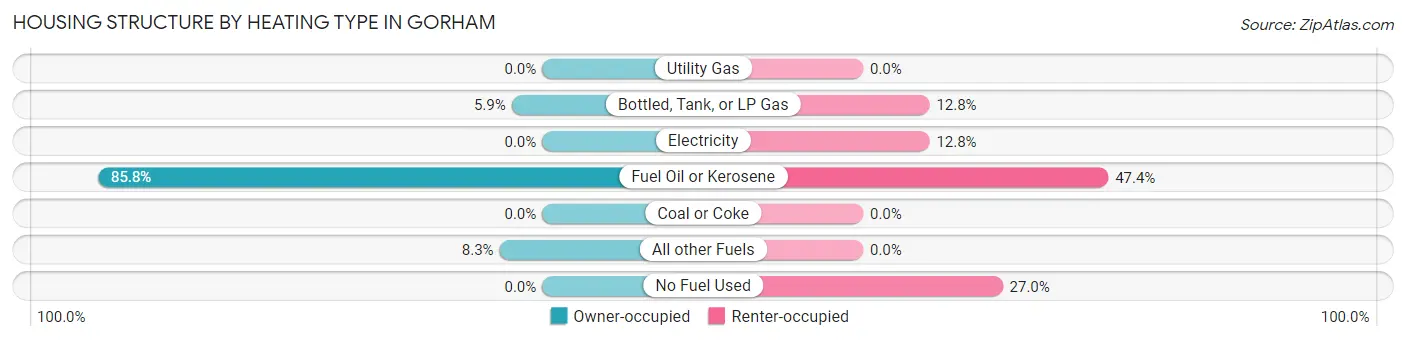
| Heating Type | Owner-occupied | Renter-occupied |
| Utility Gas | 0 (0.0%) | 0 (0.0%) |
| Bottled, Tank, or LP Gas | 43 (5.9%) | 39 (12.8%) |
| Electricity | 0 (0.0%) | 39 (12.8%) |
| Fuel Oil or Kerosene | 624 (85.8%) | 144 (47.4%) |
| Coal or Coke | 0 (0.0%) | 0 (0.0%) |
| All other Fuels | 60 (8.3%) | 0 (0.0%) |
| No Fuel Used | 0 (0.0%) | 82 (27.0%) |
| Total | 727 (100.0%) | 304 (100.0%) |
Household Vehicle Usage in Gorham
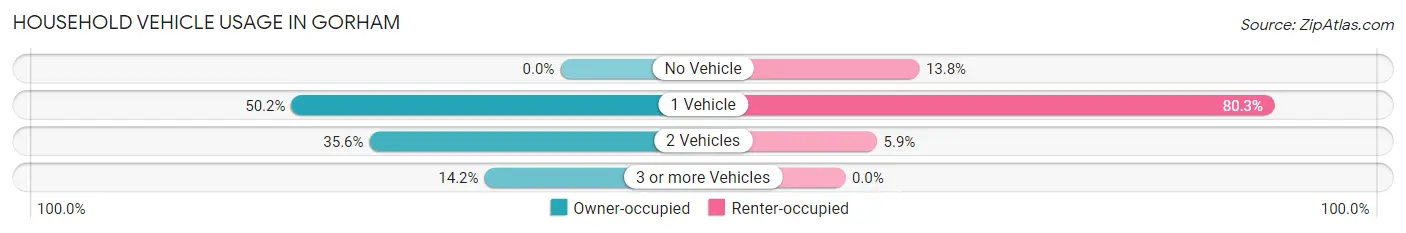
| Vehicles per Household | Owner-occupied | Renter-occupied |
| No Vehicle | 0 (0.0%) | 42 (13.8%) |
| 1 Vehicle | 365 (50.2%) | 244 (80.3%) |
| 2 Vehicles | 259 (35.6%) | 18 (5.9%) |
| 3 or more Vehicles | 103 (14.2%) | 0 (0.0%) |
| Total | 727 (100.0%) | 304 (100.0%) |
Real Estate & Mortgages in Gorham
Real Estate and Mortgage Overview in Gorham
| Characteristic | Without Mortgage | With Mortgage |
| Housing Units | 426 | 301 |
| Median Property Value | $131,700 | $133,600 |
| Median Household Income | $56,419 | $31 |
| Monthly Housing Costs | $700 | $7 |
| Real Estate Taxes | $4,339 | $0 |
Property Value by Mortgage Status in Gorham
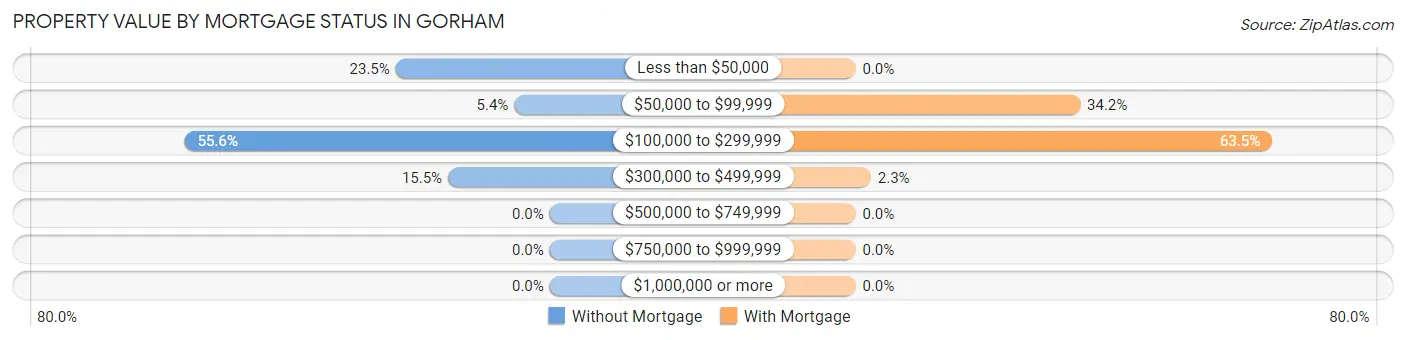
| Property Value | Without Mortgage | With Mortgage |
| Less than $50,000 | 100 (23.5%) | 0 (0.0%) |
| $50,000 to $99,999 | 23 (5.4%) | 103 (34.2%) |
| $100,000 to $299,999 | 237 (55.6%) | 191 (63.5%) |
| $300,000 to $499,999 | 66 (15.5%) | 7 (2.3%) |
| $500,000 to $749,999 | 0 (0.0%) | 0 (0.0%) |
| $750,000 to $999,999 | 0 (0.0%) | 0 (0.0%) |
| $1,000,000 or more | 0 (0.0%) | 0 (0.0%) |
| Total | 426 (100.0%) | 301 (100.0%) |
Household Income by Mortgage Status in Gorham
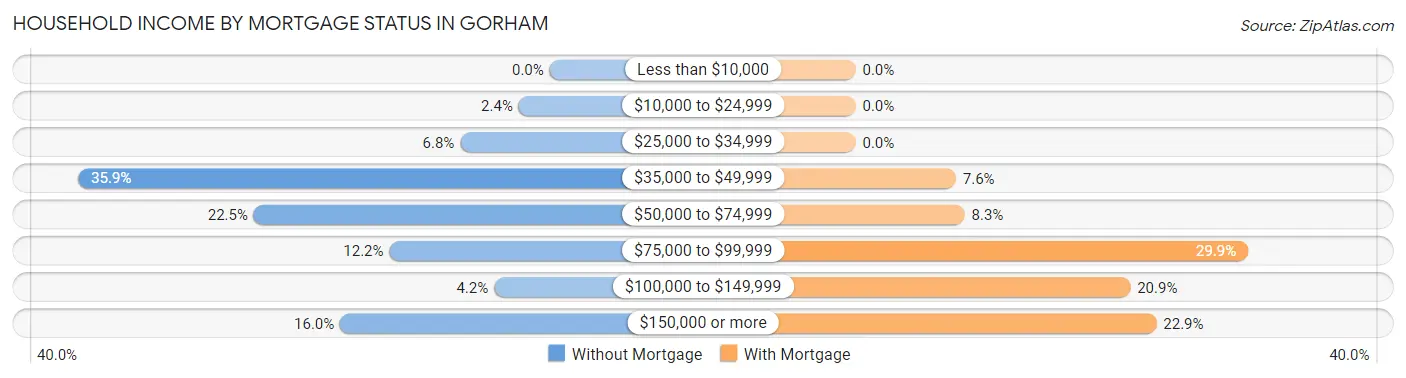
| Household Income | Without Mortgage | With Mortgage |
| Less than $10,000 | 0 (0.0%) | 0 (0.0%) |
| $10,000 to $24,999 | 10 (2.4%) | 0 (0.0%) |
| $25,000 to $34,999 | 29 (6.8%) | 0 (0.0%) |
| $35,000 to $49,999 | 153 (35.9%) | 23 (7.6%) |
| $50,000 to $74,999 | 96 (22.5%) | 25 (8.3%) |
| $75,000 to $99,999 | 52 (12.2%) | 90 (29.9%) |
| $100,000 to $149,999 | 18 (4.2%) | 63 (20.9%) |
| $150,000 or more | 68 (16.0%) | 69 (22.9%) |
| Total | 426 (100.0%) | 301 (100.0%) |
Property Value to Household Income Ratio in Gorham
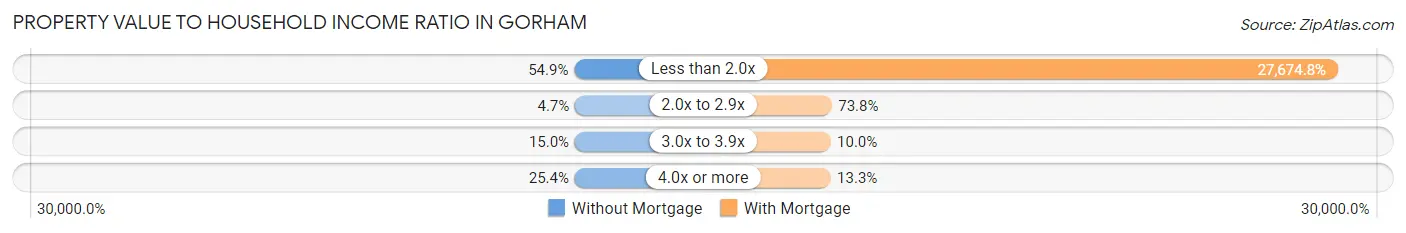
| Value-to-Income Ratio | Without Mortgage | With Mortgage |
| Less than 2.0x | 234 (54.9%) | 83,301 (27,674.8%) |
| 2.0x to 2.9x | 20 (4.7%) | 222 (73.8%) |
| 3.0x to 3.9x | 64 (15.0%) | 30 (10.0%) |
| 4.0x or more | 108 (25.4%) | 40 (13.3%) |
| Total | 426 (100.0%) | 301 (100.0%) |
Real Estate Taxes by Mortgage Status in Gorham
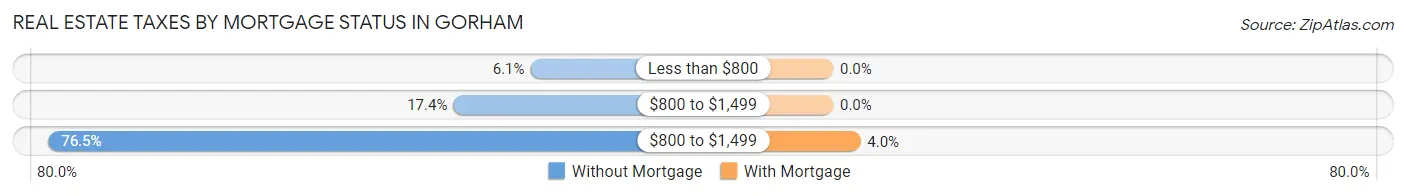
| Property Taxes | Without Mortgage | With Mortgage |
| Less than $800 | 26 (6.1%) | 0 (0.0%) |
| $800 to $1,499 | 74 (17.4%) | 0 (0.0%) |
| $800 to $1,499 | 326 (76.5%) | 12 (4.0%) |
| Total | 426 (100.0%) | 301 (100.0%) |
Health & Disability in Gorham
Health Insurance Coverage by Age in Gorham
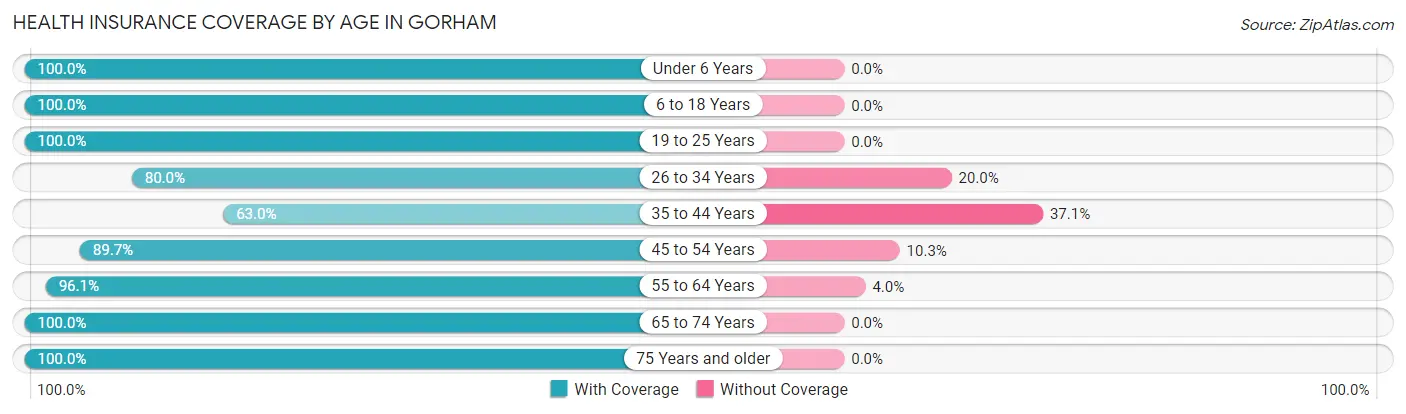
| Age Bracket | With Coverage | Without Coverage |
| Under 6 Years | 59 (100.0%) | 0 (0.0%) |
| 6 to 18 Years | 195 (100.0%) | 0 (0.0%) |
| 19 to 25 Years | 124 (100.0%) | 0 (0.0%) |
| 26 to 34 Years | 144 (80.0%) | 36 (20.0%) |
| 35 to 44 Years | 175 (62.9%) | 103 (37.0%) |
| 45 to 54 Years | 226 (89.7%) | 26 (10.3%) |
| 55 to 64 Years | 389 (96.1%) | 16 (4.0%) |
| 65 to 74 Years | 280 (100.0%) | 0 (0.0%) |
| 75 Years and older | 270 (100.0%) | 0 (0.0%) |
| Total | 1,862 (91.1%) | 181 (8.9%) |
Health Insurance Coverage by Citizenship Status in Gorham
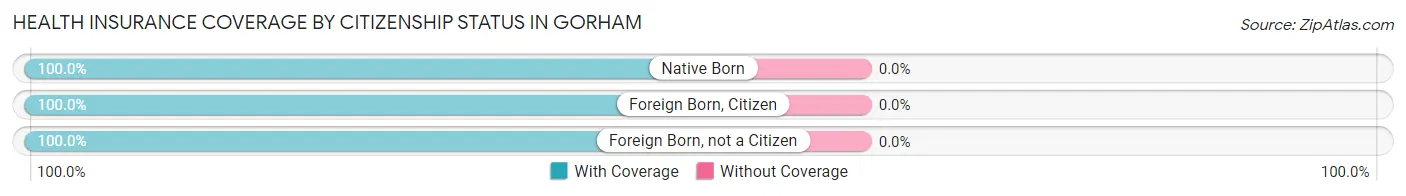
| Citizenship Status | With Coverage | Without Coverage |
| Native Born | 59 (100.0%) | 0 (0.0%) |
| Foreign Born, Citizen | 195 (100.0%) | 0 (0.0%) |
| Foreign Born, not a Citizen | 124 (100.0%) | 0 (0.0%) |
Health Insurance Coverage by Household Income in Gorham
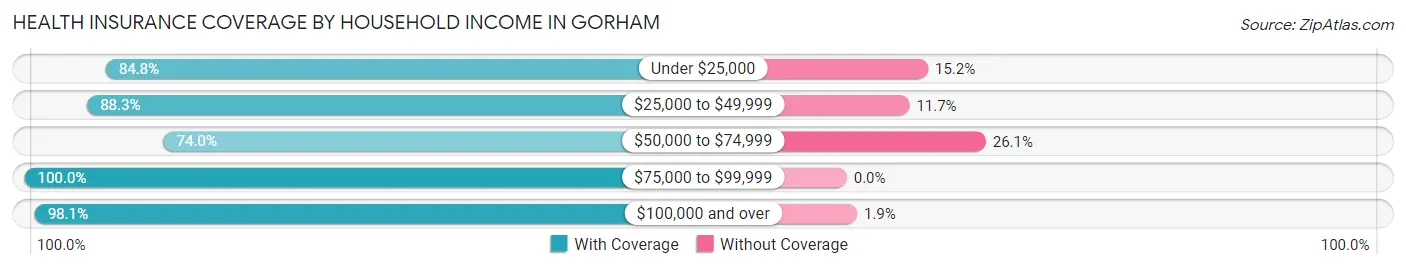
| Household Income | With Coverage | Without Coverage |
| Under $25,000 | 195 (84.8%) | 35 (15.2%) |
| $25,000 to $49,999 | 481 (88.3%) | 64 (11.7%) |
| $50,000 to $74,999 | 193 (74.0%) | 68 (26.1%) |
| $75,000 to $99,999 | 273 (100.0%) | 0 (0.0%) |
| $100,000 and over | 720 (98.1%) | 14 (1.9%) |
Public vs Private Health Insurance Coverage by Age in Gorham
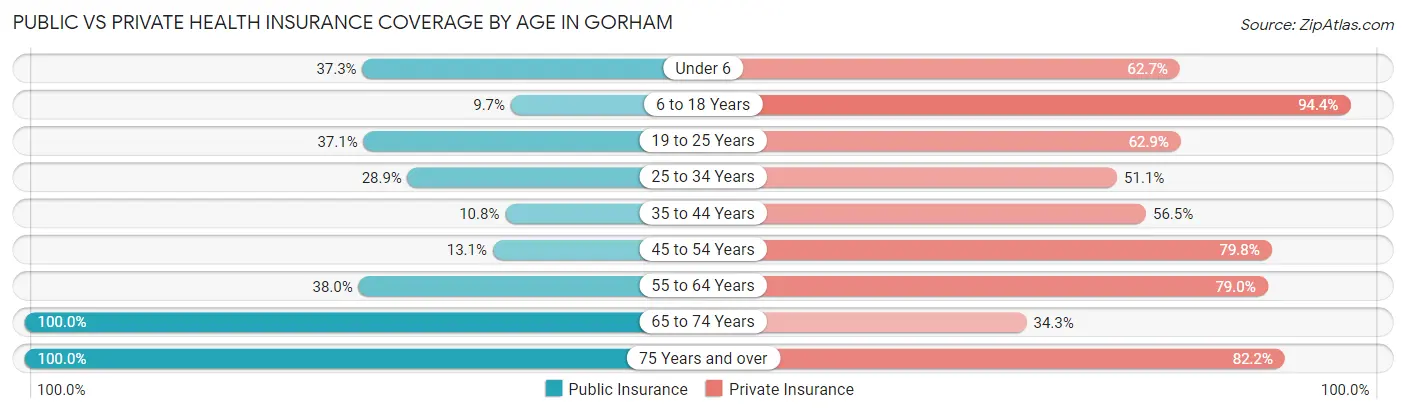
| Age Bracket | Public Insurance | Private Insurance |
| Under 6 | 22 (37.3%) | 37 (62.7%) |
| 6 to 18 Years | 19 (9.7%) | 184 (94.4%) |
| 19 to 25 Years | 46 (37.1%) | 78 (62.9%) |
| 25 to 34 Years | 52 (28.9%) | 92 (51.1%) |
| 35 to 44 Years | 30 (10.8%) | 157 (56.5%) |
| 45 to 54 Years | 33 (13.1%) | 201 (79.8%) |
| 55 to 64 Years | 154 (38.0%) | 320 (79.0%) |
| 65 to 74 Years | 280 (100.0%) | 96 (34.3%) |
| 75 Years and over | 270 (100.0%) | 222 (82.2%) |
| Total | 906 (44.4%) | 1,387 (67.9%) |
Disability Status by Sex by Age in Gorham
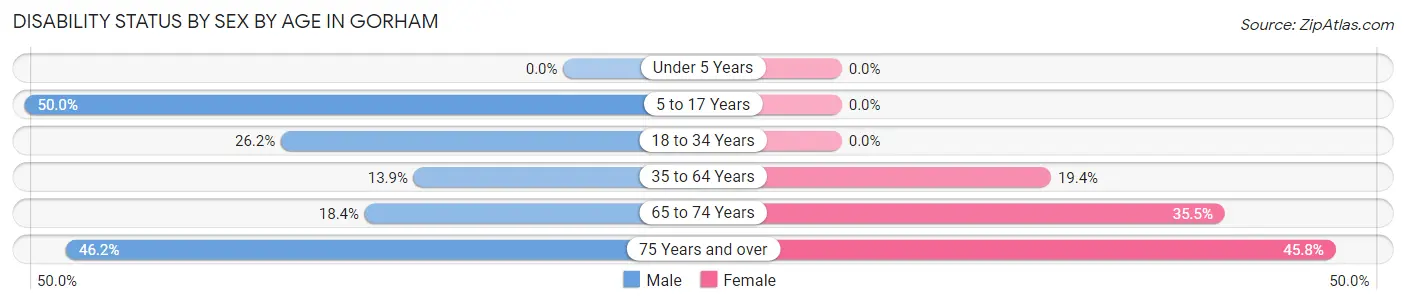
| Age Bracket | Male | Female |
| Under 5 Years | 0 (0.0%) | 0 (0.0%) |
| 5 to 17 Years | 58 (50.0%) | 0 (0.0%) |
| 18 to 34 Years | 49 (26.2%) | 0 (0.0%) |
| 35 to 64 Years | 69 (13.9%) | 85 (19.4%) |
| 65 to 74 Years | 21 (18.4%) | 59 (35.5%) |
| 75 Years and over | 36 (46.2%) | 88 (45.8%) |
Disability Class by Sex by Age in Gorham
Disability Class: Hearing Difficulty
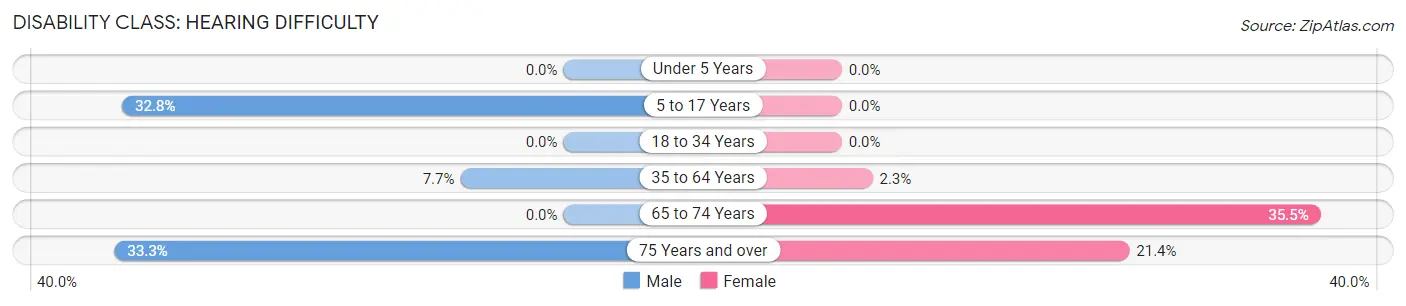
| Age Bracket | Male | Female |
| Under 5 Years | 0 (0.0%) | 0 (0.0%) |
| 5 to 17 Years | 38 (32.8%) | 0 (0.0%) |
| 18 to 34 Years | 0 (0.0%) | 0 (0.0%) |
| 35 to 64 Years | 38 (7.6%) | 10 (2.3%) |
| 65 to 74 Years | 0 (0.0%) | 59 (35.5%) |
| 75 Years and over | 26 (33.3%) | 41 (21.3%) |
Disability Class: Vision Difficulty
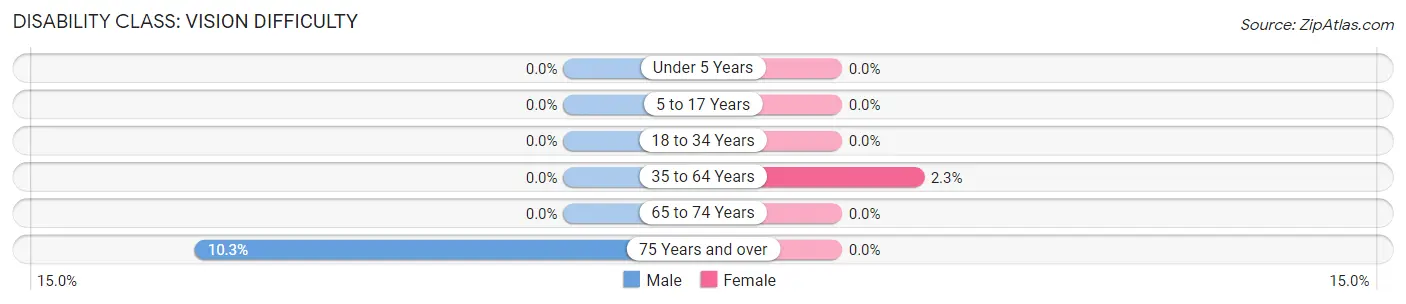
| Age Bracket | Male | Female |
| Under 5 Years | 0 (0.0%) | 0 (0.0%) |
| 5 to 17 Years | 0 (0.0%) | 0 (0.0%) |
| 18 to 34 Years | 0 (0.0%) | 0 (0.0%) |
| 35 to 64 Years | 0 (0.0%) | 10 (2.3%) |
| 65 to 74 Years | 0 (0.0%) | 0 (0.0%) |
| 75 Years and over | 8 (10.3%) | 0 (0.0%) |
Disability Class: Cognitive Difficulty
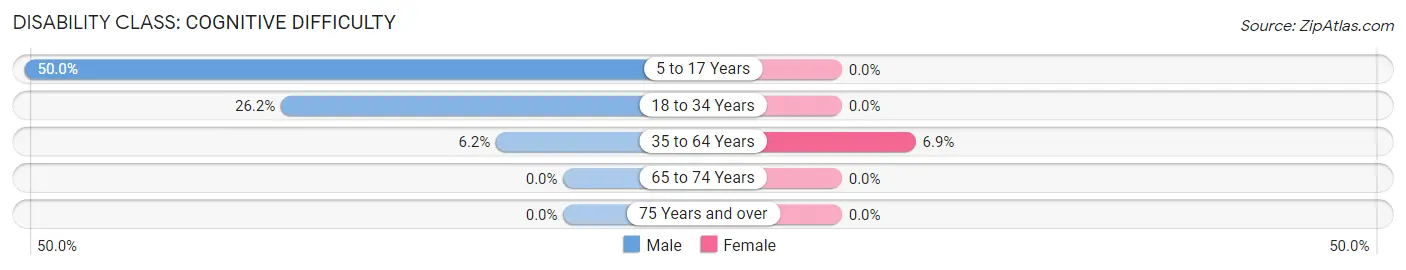
| Age Bracket | Male | Female |
| 5 to 17 Years | 58 (50.0%) | 0 (0.0%) |
| 18 to 34 Years | 49 (26.2%) | 0 (0.0%) |
| 35 to 64 Years | 31 (6.2%) | 30 (6.9%) |
| 65 to 74 Years | 0 (0.0%) | 0 (0.0%) |
| 75 Years and over | 0 (0.0%) | 0 (0.0%) |
Disability Class: Ambulatory Difficulty
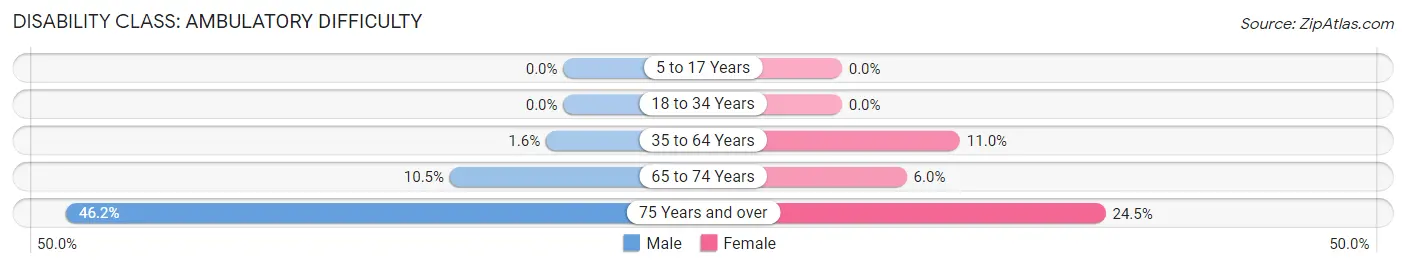
| Age Bracket | Male | Female |
| 5 to 17 Years | 0 (0.0%) | 0 (0.0%) |
| 18 to 34 Years | 0 (0.0%) | 0 (0.0%) |
| 35 to 64 Years | 8 (1.6%) | 48 (11.0%) |
| 65 to 74 Years | 12 (10.5%) | 10 (6.0%) |
| 75 Years and over | 36 (46.2%) | 47 (24.5%) |
Disability Class: Self-Care Difficulty
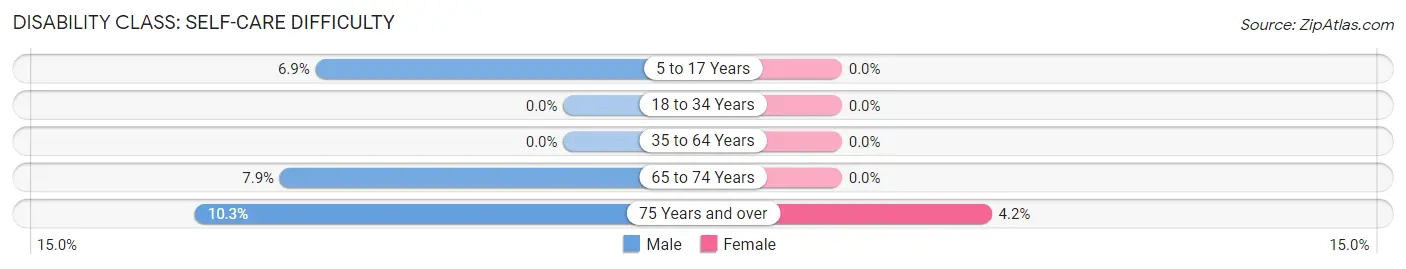
| Age Bracket | Male | Female |
| 5 to 17 Years | 8 (6.9%) | 0 (0.0%) |
| 18 to 34 Years | 0 (0.0%) | 0 (0.0%) |
| 35 to 64 Years | 0 (0.0%) | 0 (0.0%) |
| 65 to 74 Years | 9 (7.9%) | 0 (0.0%) |
| 75 Years and over | 8 (10.3%) | 8 (4.2%) |
Technology Access in Gorham
Computing Device Access in Gorham
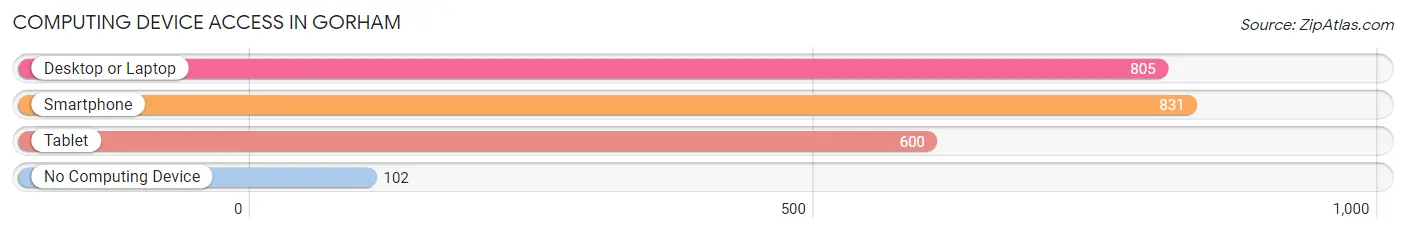
| Device Type | # Households | % Households |
| Desktop or Laptop | 805 | 78.1% |
| Smartphone | 831 | 80.6% |
| Tablet | 600 | 58.2% |
| No Computing Device | 102 | 9.9% |
| Total | 1,031 | 100.0% |
Internet Access in Gorham
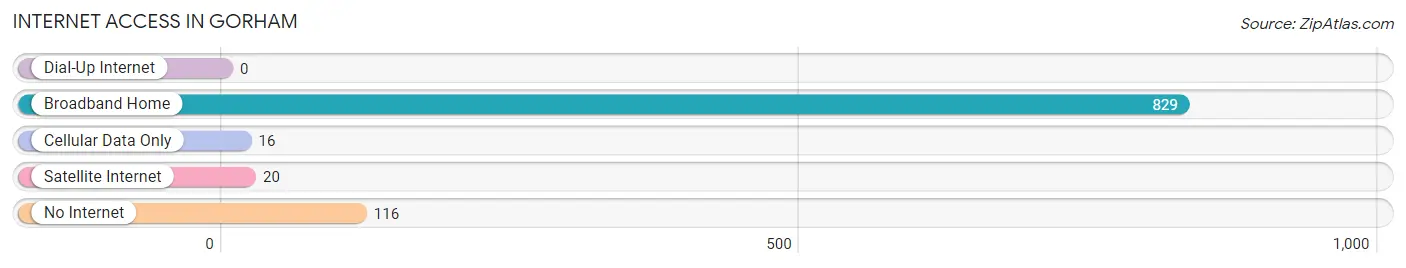
| Internet Type | # Households | % Households |
| Dial-Up Internet | 0 | 0.0% |
| Broadband Home | 829 | 80.4% |
| Cellular Data Only | 16 | 1.5% |
| Satellite Internet | 20 | 1.9% |
| No Internet | 116 | 11.3% |
| Total | 1,031 | 100.0% |
Gorham Summary
Gorham is a town located in Coos County, New Hampshire, United States. It is situated in the White Mountains region of the state, and is bordered by the towns of Berlin, Randolph, Shelburne, and Success. The population was 2,895 at the 2010 census.
Geography
Gorham is located in the White Mountains region of New Hampshire, and is bordered by the towns of Berlin, Randolph, Shelburne, and Success. The town is situated on the Androscoggin River, and is home to the Androscoggin Valley Country Club. The highest point in Gorham is the summit of Mount Madison, which has an elevation of 4,919 feet (1,499 m).
The town has a total area of 44.2 square miles (114.4 km2), of which 43.9 square miles (113.6 km2) is land and 0.3 square miles (0.8 km2) is water, comprising 0.68% of the town.
Demographics
As of the census of 2010, there were 2,895 people, 1,232 households, and 790 families residing in the town. The population density was 65.9 people per square mile (25.4/km2). There were 1,541 housing units at an average density of 35.3 per square mile (13.6/km2). The racial makeup of the town was 97.2% White, 0.3% African American, 0.4% Native American, 0.4% Asian, 0.1% Pacific Islander, 0.2% from other races, and 1.4% from two or more races. Hispanic or Latino of any race were 1.2% of the population.
There were 1,232 households, out of which 28.2% had children under the age of 18 living with them, 48.2% were married couples living together, 11.2% had a female householder with no husband present, and 35.7% were non-families. 28.7% of all households were made up of individuals, and 11.2% had someone living alone who was 65 years of age or older. The average household size was 2.35 and the average family size was 2.86.
In the town, the population was spread out, with 23.2% under the age of 18, 6.7% from 18 to 24, 27.2% from 25 to 44, 28.2% from 45 to 64, and 14.7% who were 65 years of age or older. The median age was 40 years. For every 100 females, there were 97.2 males. For every 100 females age 18 and over, there were 94.2 males.
The median income for a household in the town was $37,917, and the median income for a family was $45,938. Males had a median income of $31,917 versus $25,000 for females. The per capita income for the town was $19,945. About 8.2% of families and 11.2% of the population were below the poverty line, including 14.2% of those under age 18 and 8.2% of those age 65 or over.
Economy
Gorham is home to several businesses, including the Gorham Paper and Tissue mill, which produces paper products for the commercial and industrial markets. The town is also home to several retail stores, restaurants, and other businesses.
The town is also home to the Androscoggin Valley Country Club, which offers golf, tennis, and swimming. The club also hosts several events throughout the year, including the annual Gorham Open golf tournament.
Gorham is also home to the Gorham Historical Society, which is dedicated to preserving the history of the town. The society operates a museum and library, and hosts several events throughout the year.
Conclusion
Gorham is a small town located in the White Mountains region of New Hampshire. It is home to a variety of businesses, including the Gorham Paper and Tissue mill, and the Androscoggin Valley Country Club. The town also has a rich history, which is preserved by the Gorham Historical Society. The population of Gorham was 2,895 at the 2010 census, and the median household income was $37,917.
Common Questions
What is Per Capita Income in Gorham?
Per Capita income in Gorham is $38,435.
What is the Median Family Income in Gorham?
Median Family Income in Gorham is $82,853.
What is the Median Household income in Gorham?
Median Household Income in Gorham is $55,845.
What is Income or Wage Gap in Gorham?
Income or Wage Gap in Gorham is 12.1%.
Women in Gorham earn 87.9 cents for every dollar earned by a man.
What is Inequality or Gini Index in Gorham?
Inequality or Gini Index in Gorham is 0.43.
What is the Total Population of Gorham?
Total Population of Gorham is 2,043.
What is the Total Male Population of Gorham?
Total Male Population of Gorham is 1,017.
What is the Total Female Population of Gorham?
Total Female Population of Gorham is 1,026.
What is the Ratio of Males per 100 Females in Gorham?
There are 99.12 Males per 100 Females in Gorham.
What is the Ratio of Females per 100 Males in Gorham?
There are 100.88 Females per 100 Males in Gorham.
What is the Median Population Age in Gorham?
Median Population Age in Gorham is 51.7 Years.
What is the Average Family Size in Gorham
Average Family Size in Gorham is 2.8 People.
What is the Average Household Size in Gorham
Average Household Size in Gorham is 2.0 People.
How Large is the Labor Force in Gorham?
There are 1,073 People in the Labor Forcein in Gorham.
What is the Percentage of People in the Labor Force in Gorham?
57.8% of People are in the Labor Force in Gorham.
What is the Unemployment Rate in Gorham?
Unemployment Rate in Gorham is 1.0%.