Woodsville, NH Map & Demographics
Woodsville Map
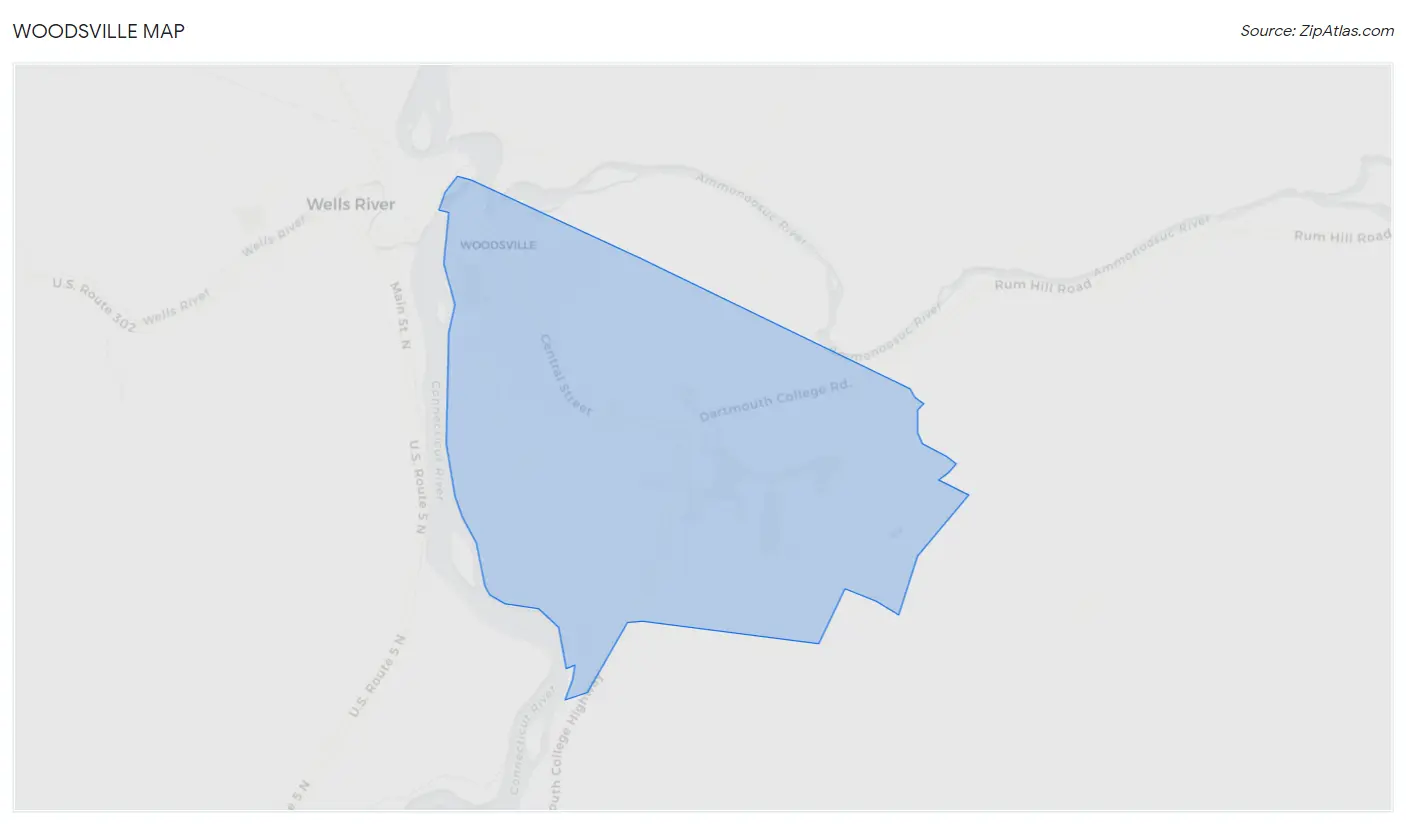
Woodsville Overview
$33,195
PER CAPITA INCOME
$109,761
AVG FAMILY INCOME
$53,578
AVG HOUSEHOLD INCOME
11.6%
WAGE / INCOME GAP [ % ]
88.4¢/ $1
WAGE / INCOME GAP [ $ ]
0.43
INEQUALITY / GINI INDEX
1,329
TOTAL POPULATION
673
MALE POPULATION
656
FEMALE POPULATION
102.59
MALES / 100 FEMALES
97.47
FEMALES / 100 MALES
30.9
MEDIAN AGE
3.6
AVG FAMILY SIZE
2.5
AVG HOUSEHOLD SIZE
638
LABOR FORCE [ PEOPLE ]
64.4%
PERCENT IN LABOR FORCE
2.8%
UNEMPLOYMENT RATE
Woodsville Zip Codes
Woodsville Area Codes
Income in Woodsville
Income Overview in Woodsville
Per Capita Income in Woodsville is $33,195, while median incomes of families and households are $109,761 and $53,578 respectively.
| Characteristic | Number | Measure |
| Per Capita Income | 1,329 | $33,195 |
| Median Family Income | 245 | $109,761 |
| Mean Family Income | 245 | $115,018 |
| Median Household Income | 542 | $53,578 |
| Mean Household Income | 542 | $71,369 |
| Income Deficit | 245 | $0 |
| Wage / Income Gap (%) | 1,329 | 11.60% |
| Wage / Income Gap ($) | 1,329 | 88.40¢ per $1 |
| Gini / Inequality Index | 1,329 | 0.43 |
Earnings by Sex in Woodsville
Average Earnings in Woodsville are $45,417, $46,526 for men and $41,130 for women, a difference of 11.6%.
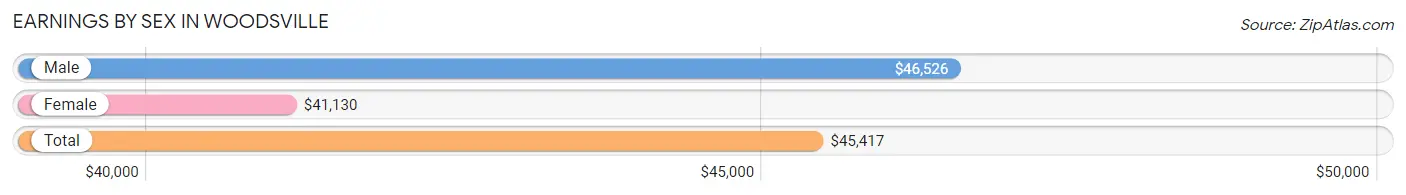
| Sex | Number | Average Earnings |
| Male | 339 (51.1%) | $46,526 |
| Female | 324 (48.9%) | $41,130 |
| Total | 663 (100.0%) | $45,417 |
Earnings by Sex by Income Bracket in Woodsville
The most common earnings brackets in Woodsville are $45,000 to $49,999 for men (127 | 37.5%) and $40,000 to $44,999 for women (85 | 26.2%).
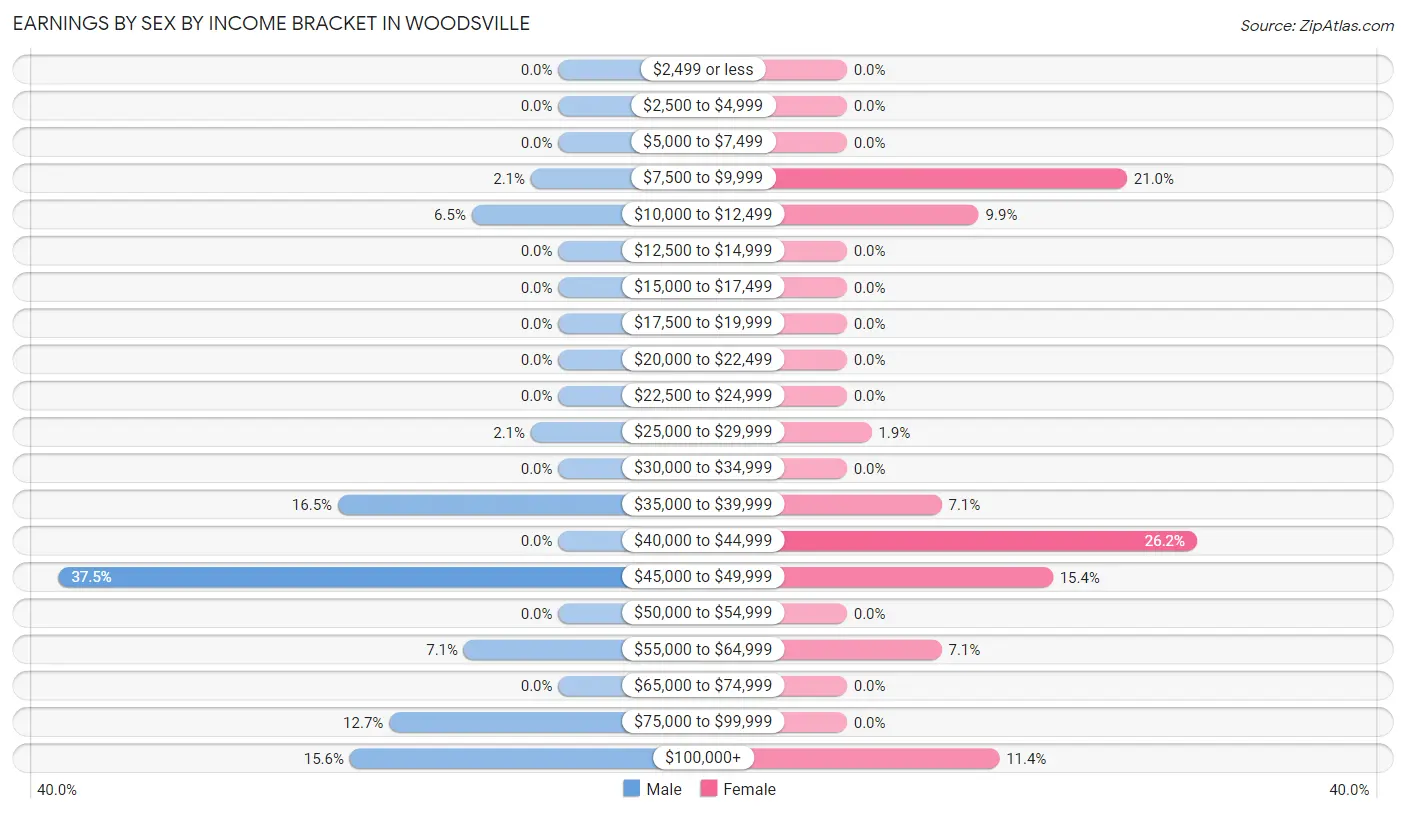
| Income | Male | Female |
| $2,499 or less | 0 (0.0%) | 0 (0.0%) |
| $2,500 to $4,999 | 0 (0.0%) | 0 (0.0%) |
| $5,000 to $7,499 | 0 (0.0%) | 0 (0.0%) |
| $7,500 to $9,999 | 7 (2.1%) | 68 (21.0%) |
| $10,000 to $12,499 | 22 (6.5%) | 32 (9.9%) |
| $12,500 to $14,999 | 0 (0.0%) | 0 (0.0%) |
| $15,000 to $17,499 | 0 (0.0%) | 0 (0.0%) |
| $17,500 to $19,999 | 0 (0.0%) | 0 (0.0%) |
| $20,000 to $22,499 | 0 (0.0%) | 0 (0.0%) |
| $22,500 to $24,999 | 0 (0.0%) | 0 (0.0%) |
| $25,000 to $29,999 | 7 (2.1%) | 6 (1.8%) |
| $30,000 to $34,999 | 0 (0.0%) | 0 (0.0%) |
| $35,000 to $39,999 | 56 (16.5%) | 23 (7.1%) |
| $40,000 to $44,999 | 0 (0.0%) | 85 (26.2%) |
| $45,000 to $49,999 | 127 (37.5%) | 50 (15.4%) |
| $50,000 to $54,999 | 0 (0.0%) | 0 (0.0%) |
| $55,000 to $64,999 | 24 (7.1%) | 23 (7.1%) |
| $65,000 to $74,999 | 0 (0.0%) | 0 (0.0%) |
| $75,000 to $99,999 | 43 (12.7%) | 0 (0.0%) |
| $100,000+ | 53 (15.6%) | 37 (11.4%) |
| Total | 339 (100.0%) | 324 (100.0%) |
Earnings by Sex by Educational Attainment in Woodsville
Average earnings in Woodsville are $46,742 for men and $42,295 for women, a difference of 9.5%. Men with an educational attainment of high school diploma enjoy the highest average annual earnings of $46,565, while those with high school diploma education earn the least with $46,565. Women with an educational attainment of high school diploma earn the most with the average annual earnings of $44,167, while those with high school diploma education have the smallest earnings of $44,167.
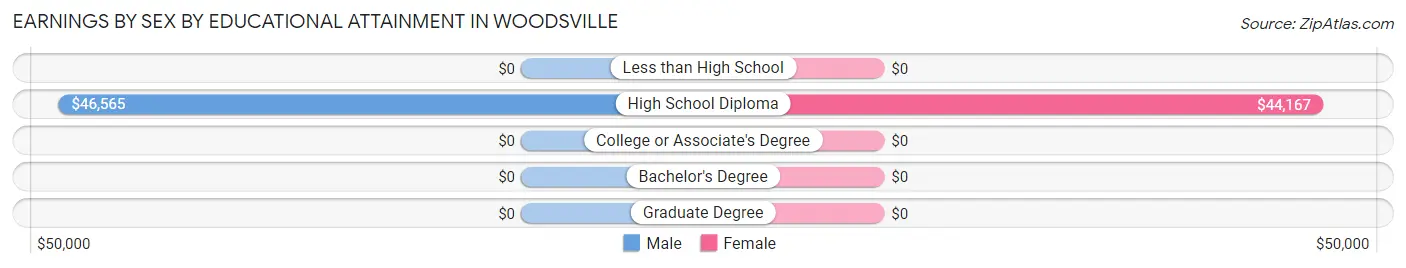
| Educational Attainment | Male Income | Female Income |
| Less than High School | - | - |
| High School Diploma | $46,565 | $44,167 |
| College or Associate's Degree | - | - |
| Bachelor's Degree | - | - |
| Graduate Degree | - | - |
| Total | $46,742 | $42,295 |
Family Income in Woodsville
Family Income Brackets in Woodsville
According to the Woodsville family income data, there are 113 families falling into the $100,000 to $149,999 income range, which is the most common income bracket and makes up 46.1% of all families.
| Income Bracket | # Families | % Families |
| Less than $10,000 | 0 | 0.0% |
| $10,000 to $14,999 | 0 | 0.0% |
| $15,000 to $24,999 | 0 | 0.0% |
| $25,000 to $34,999 | 7 | 2.9% |
| $35,000 to $49,999 | 51 | 20.8% |
| $50,000 to $74,999 | 22 | 9.0% |
| $75,000 to $99,999 | 0 | 0.0% |
| $100,000 to $149,999 | 113 | 46.1% |
| $150,000 to $199,999 | 37 | 15.1% |
| $200,000+ | 15 | 6.1% |
Family Income by Famaliy Size in Woodsville
2-person families (72 | 29.4%) account for the highest median family income in Woodsville with $115,795 per family, while 2-person families (72 | 29.4%) have the highest median income of $57,898 per family member.
| Income Bracket | # Families | Median Income |
| 2-Person Families | 72 (29.4%) | $115,795 |
| 3-Person Families | 58 (23.7%) | $109,348 |
| 4-Person Families | 108 (44.1%) | $0 |
| 5-Person Families | 7 (2.9%) | $0 |
| 6-Person Families | 0 (0.0%) | $0 |
| 7+ Person Families | 0 (0.0%) | $0 |
| Total | 245 (100.0%) | $109,761 |
Family Income by Number of Earners in Woodsville
| Number of Earners | # Families | Median Income |
| No Earners | 0 (0.0%) | $0 |
| 1 Earner | 107 (43.7%) | $0 |
| 2 Earners | 138 (56.3%) | $109,468 |
| 3+ Earners | 0 (0.0%) | $0 |
| Total | 245 (100.0%) | $109,761 |
Household Income in Woodsville
Household Income Brackets in Woodsville
With 128 households falling in the category, the $50,000 to $74,999 income range is the most frequent in Woodsville, accounting for 23.6% of all households.
| Income Bracket | # Households | % Households |
| Less than $10,000 | 22 | 4.1% |
| $10,000 to $14,999 | 0 | 0.0% |
| $15,000 to $24,999 | 76 | 14.0% |
| $25,000 to $34,999 | 89 | 16.4% |
| $35,000 to $49,999 | 62 | 11.4% |
| $50,000 to $74,999 | 128 | 23.6% |
| $75,000 to $99,999 | 0 | 0.0% |
| $100,000 to $149,999 | 113 | 20.8% |
| $150,000 to $199,999 | 37 | 6.8% |
| $200,000+ | 15 | 2.8% |
Household Income by Householder Age in Woodsville
The median household income in Woodsville is $53,578, with the highest median household income of $108,177 found in the 25 to 44 years age bracket for the primary householder. A total of 155 households (28.6%) fall into this category. Meanwhile, the 15 to 24 years age bracket for the primary householder has the lowest median household income of $0, with 66 households (12.2%) in this group.
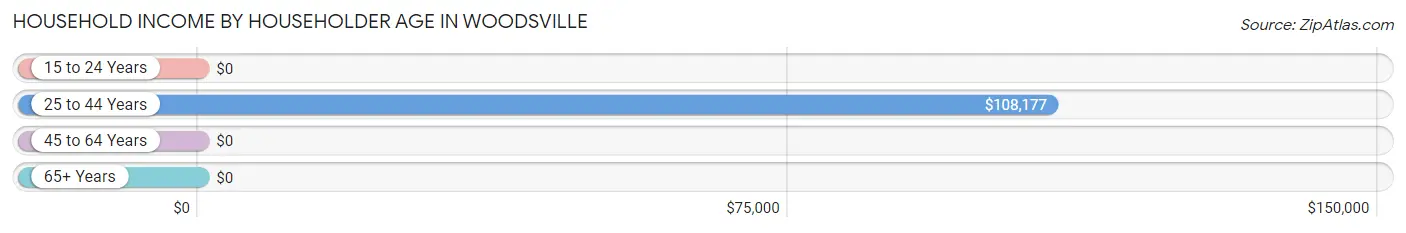
| Income Bracket | # Households | Median Income |
| 15 to 24 Years | 66 (12.2%) | $0 |
| 25 to 44 Years | 155 (28.6%) | $108,177 |
| 45 to 64 Years | 159 (29.3%) | $0 |
| 65+ Years | 162 (29.9%) | $0 |
| Total | 542 (100.0%) | $53,578 |
Poverty in Woodsville
Income Below Poverty by Sex and Age in Woodsville
With 7.6% poverty level for males and 14.9% for females among the residents of Woodsville, under 5 year old males and 18 to 24 year old females are the most vulnerable to poverty, with 15 males (100.0%) and 68 females (100.0%) in their respective age groups living below the poverty level.
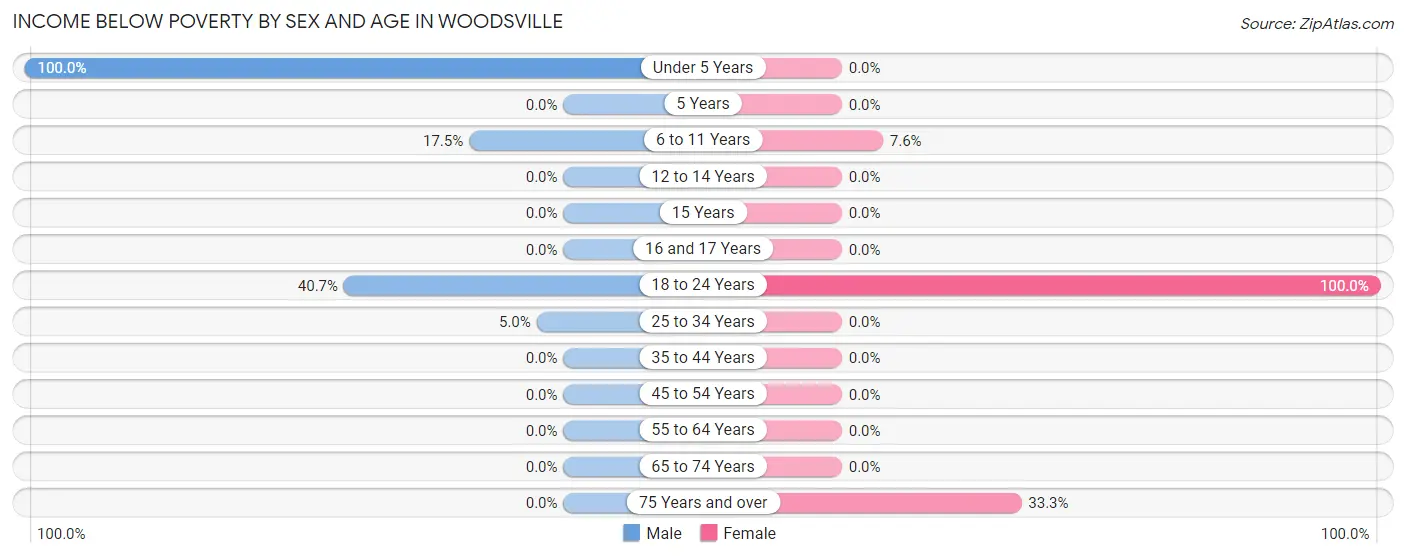
| Age Bracket | Male | Female |
| Under 5 Years | 15 (100.0%) | 0 (0.0%) |
| 5 Years | 0 (0.0%) | 0 (0.0%) |
| 6 to 11 Years | 7 (17.5%) | 8 (7.6%) |
| 12 to 14 Years | 0 (0.0%) | 0 (0.0%) |
| 15 Years | 0 (0.0%) | 0 (0.0%) |
| 16 and 17 Years | 0 (0.0%) | 0 (0.0%) |
| 18 to 24 Years | 22 (40.7%) | 68 (100.0%) |
| 25 to 34 Years | 7 (5.0%) | 0 (0.0%) |
| 35 to 44 Years | 0 (0.0%) | 0 (0.0%) |
| 45 to 54 Years | 0 (0.0%) | 0 (0.0%) |
| 55 to 64 Years | 0 (0.0%) | 0 (0.0%) |
| 65 to 74 Years | 0 (0.0%) | 0 (0.0%) |
| 75 Years and over | 0 (0.0%) | 22 (33.3%) |
| Total | 51 (7.6%) | 98 (14.9%) |
Income Above Poverty by Sex and Age in Woodsville
According to the poverty statistics in Woodsville, males aged 12 to 14 years and females aged under 5 years are the age groups that are most secure financially, with 100.0% of males and 100.0% of females in these age groups living above the poverty line.
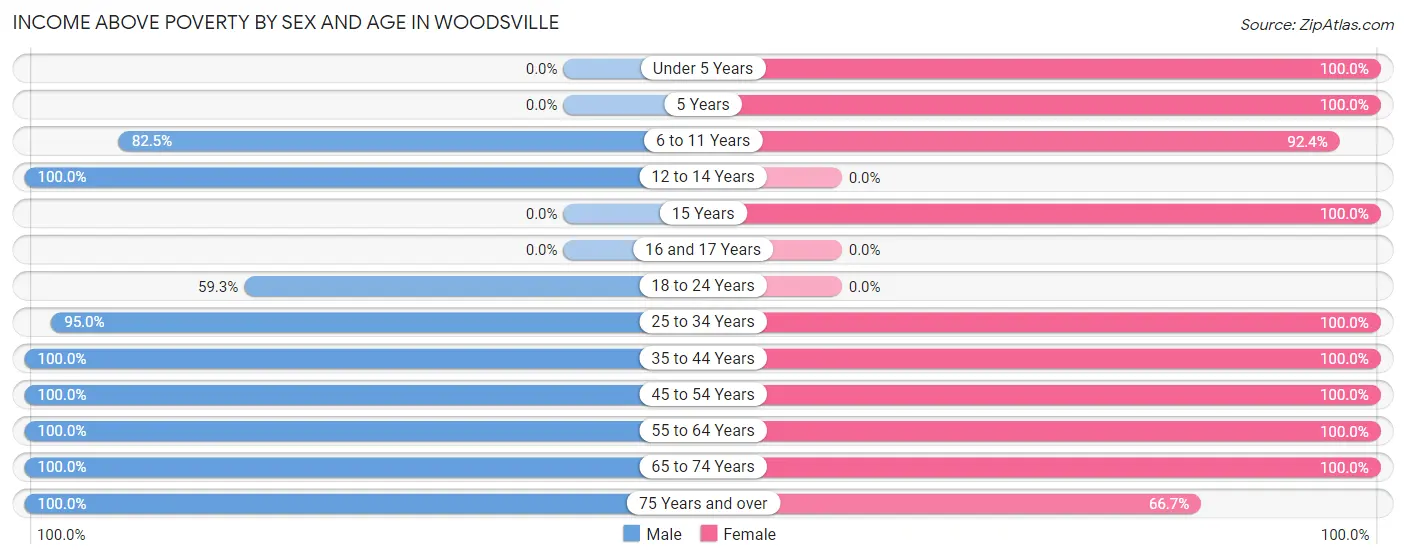
| Age Bracket | Male | Female |
| Under 5 Years | 0 (0.0%) | 83 (100.0%) |
| 5 Years | 0 (0.0%) | 33 (100.0%) |
| 6 to 11 Years | 33 (82.5%) | 97 (92.4%) |
| 12 to 14 Years | 49 (100.0%) | 0 (0.0%) |
| 15 Years | 0 (0.0%) | 13 (100.0%) |
| 16 and 17 Years | 0 (0.0%) | 0 (0.0%) |
| 18 to 24 Years | 32 (59.3%) | 0 (0.0%) |
| 25 to 34 Years | 134 (95.0%) | 77 (100.0%) |
| 35 to 44 Years | 113 (100.0%) | 107 (100.0%) |
| 45 to 54 Years | 18 (100.0%) | 53 (100.0%) |
| 55 to 64 Years | 134 (100.0%) | 34 (100.0%) |
| 65 to 74 Years | 58 (100.0%) | 17 (100.0%) |
| 75 Years and over | 51 (100.0%) | 44 (66.7%) |
| Total | 622 (92.4%) | 558 (85.1%) |
Income Below Poverty Among Married-Couple Families in Woodsville
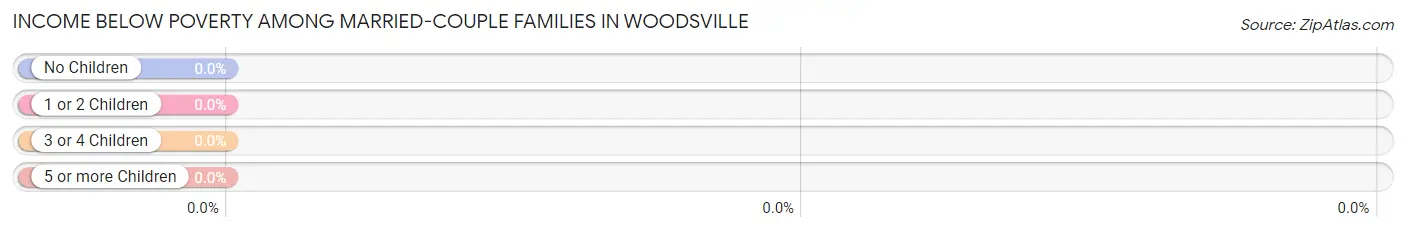
| Children | Above Poverty | Below Poverty |
| No Children | 45 (100.0%) | 0 (0.0%) |
| 1 or 2 Children | 131 (100.0%) | 0 (0.0%) |
| 3 or 4 Children | 0 (0.0%) | 0 (0.0%) |
| 5 or more Children | 0 (0.0%) | 0 (0.0%) |
| Total | 176 (100.0%) | 0 (0.0%) |
Income Below Poverty Among Single-Parent Households in Woodsville
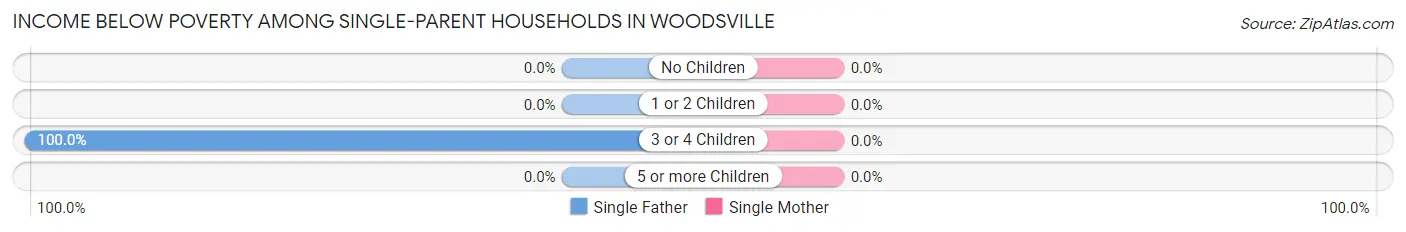
| Children | Single Father | Single Mother |
| No Children | 0 (0.0%) | 0 (0.0%) |
| 1 or 2 Children | 0 (0.0%) | 0 (0.0%) |
| 3 or 4 Children | 7 (100.0%) | 0 (0.0%) |
| 5 or more Children | 0 (0.0%) | 0 (0.0%) |
| Total | 7 (20.0%) | 0 (0.0%) |
Income Below Poverty Among Married-Couple vs Single-Parent Households in Woodsville
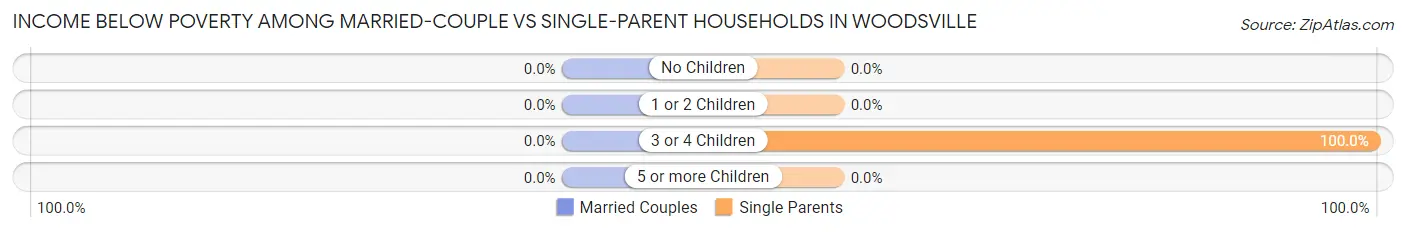
| Children | Married-Couple Families | Single-Parent Households |
| No Children | 0 (0.0%) | 0 (0.0%) |
| 1 or 2 Children | 0 (0.0%) | 0 (0.0%) |
| 3 or 4 Children | 0 (0.0%) | 7 (100.0%) |
| 5 or more Children | 0 (0.0%) | 0 (0.0%) |
| Total | 0 (0.0%) | 7 (10.1%) |
Race in Woodsville
The most populous races in Woodsville are White / Caucasian (1,310 | 98.6%), Hispanic or Latino (76 | 5.7%), and Black / African American (12 | 0.9%).
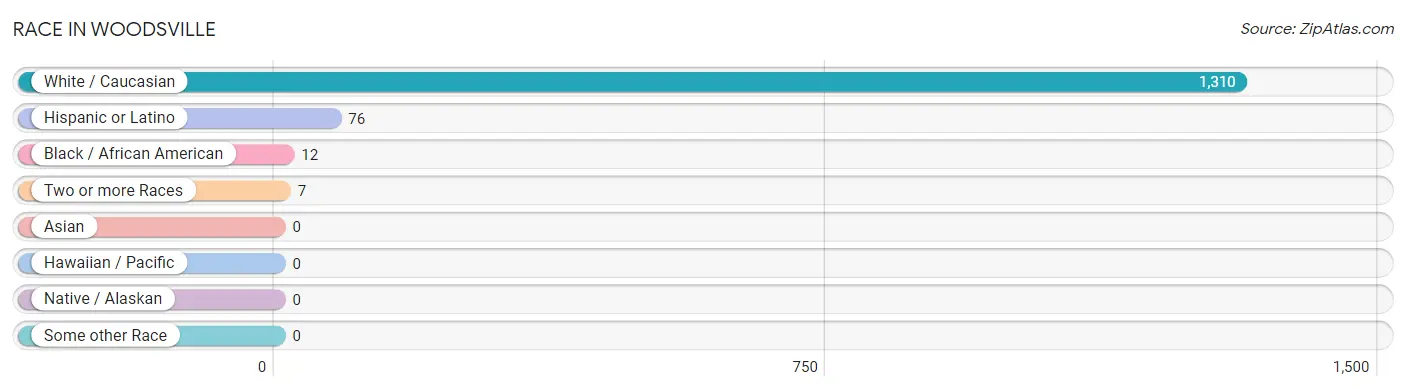
| Race | # Population | % Population |
| Asian | 0 | 0.0% |
| Black / African American | 12 | 0.9% |
| Hawaiian / Pacific | 0 | 0.0% |
| Hispanic or Latino | 76 | 5.7% |
| Native / Alaskan | 0 | 0.0% |
| White / Caucasian | 1,310 | 98.6% |
| Two or more Races | 7 | 0.5% |
| Some other Race | 0 | 0.0% |
| Total | 1,329 | 100.0% |
Ancestry in Woodsville
The most populous ancestries reported in Woodsville are Irish (339 | 25.5%), French (321 | 24.1%), French Canadian (259 | 19.5%), English (121 | 9.1%), and Polish (105 | 7.9%), together accounting for 86.1% of all Woodsville residents.
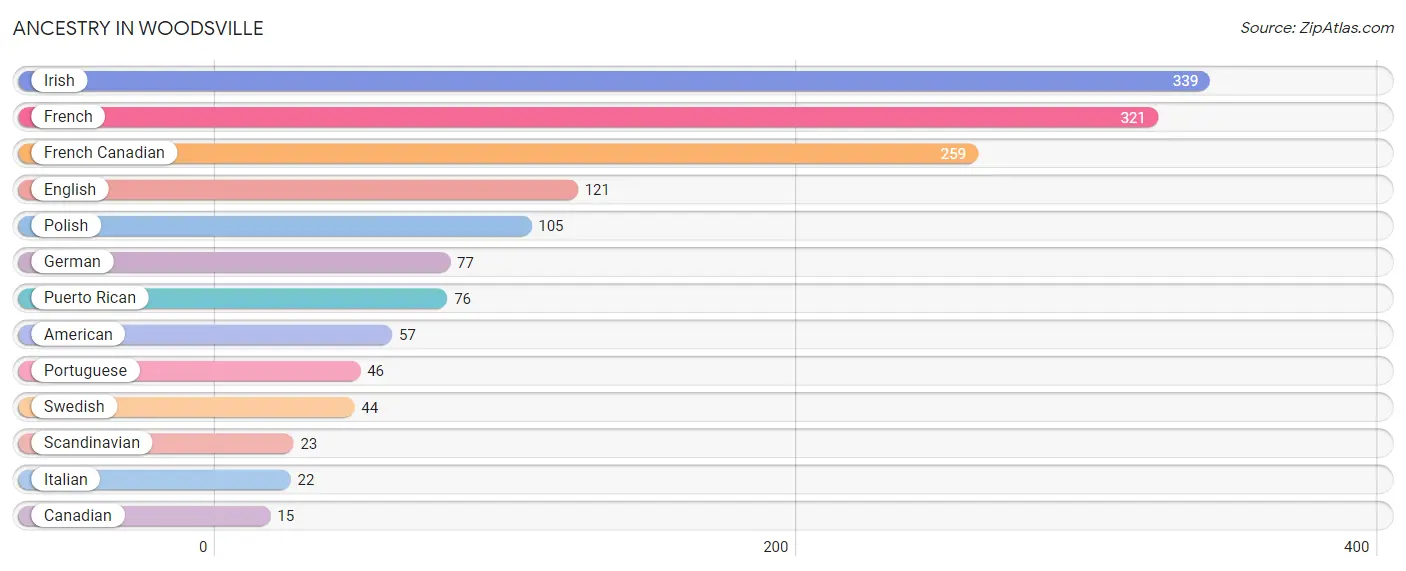
| Ancestry | # Population | % Population |
| American | 57 | 4.3% |
| Canadian | 15 | 1.1% |
| English | 121 | 9.1% |
| French | 321 | 24.1% |
| French Canadian | 259 | 19.5% |
| German | 77 | 5.8% |
| Irish | 339 | 25.5% |
| Italian | 22 | 1.7% |
| Polish | 105 | 7.9% |
| Portuguese | 46 | 3.5% |
| Puerto Rican | 76 | 5.7% |
| Scandinavian | 23 | 1.7% |
| Swedish | 44 | 3.3% | View All 13 Rows |
Immigrants in Woodsville
The most numerous immigrant groups reported in Woodsville came from Europe (40 | 3.0%), Germany (22 | 1.7%), Western Europe (22 | 1.7%), Portugal (18 | 1.3%), and Southern Europe (18 | 1.3%), together accounting for 9.0% of all Woodsville residents.
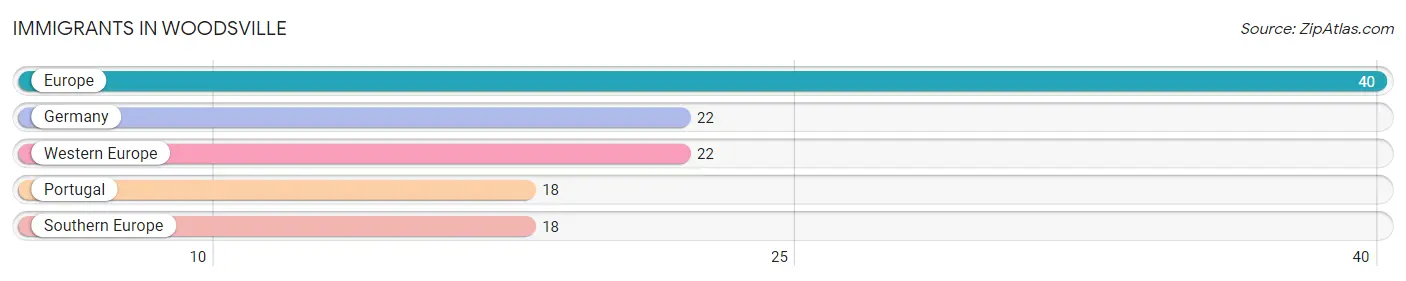
| Immigration Origin | # Population | % Population |
| Europe | 40 | 3.0% |
| Germany | 22 | 1.7% |
| Portugal | 18 | 1.3% |
| Southern Europe | 18 | 1.3% |
| Western Europe | 22 | 1.7% | View All 5 Rows |
Sex and Age in Woodsville
Sex and Age in Woodsville
The most populous age groups in Woodsville are 25 to 29 Years (127 | 18.9%) for men and Under 5 Years (83 | 12.7%) for women.
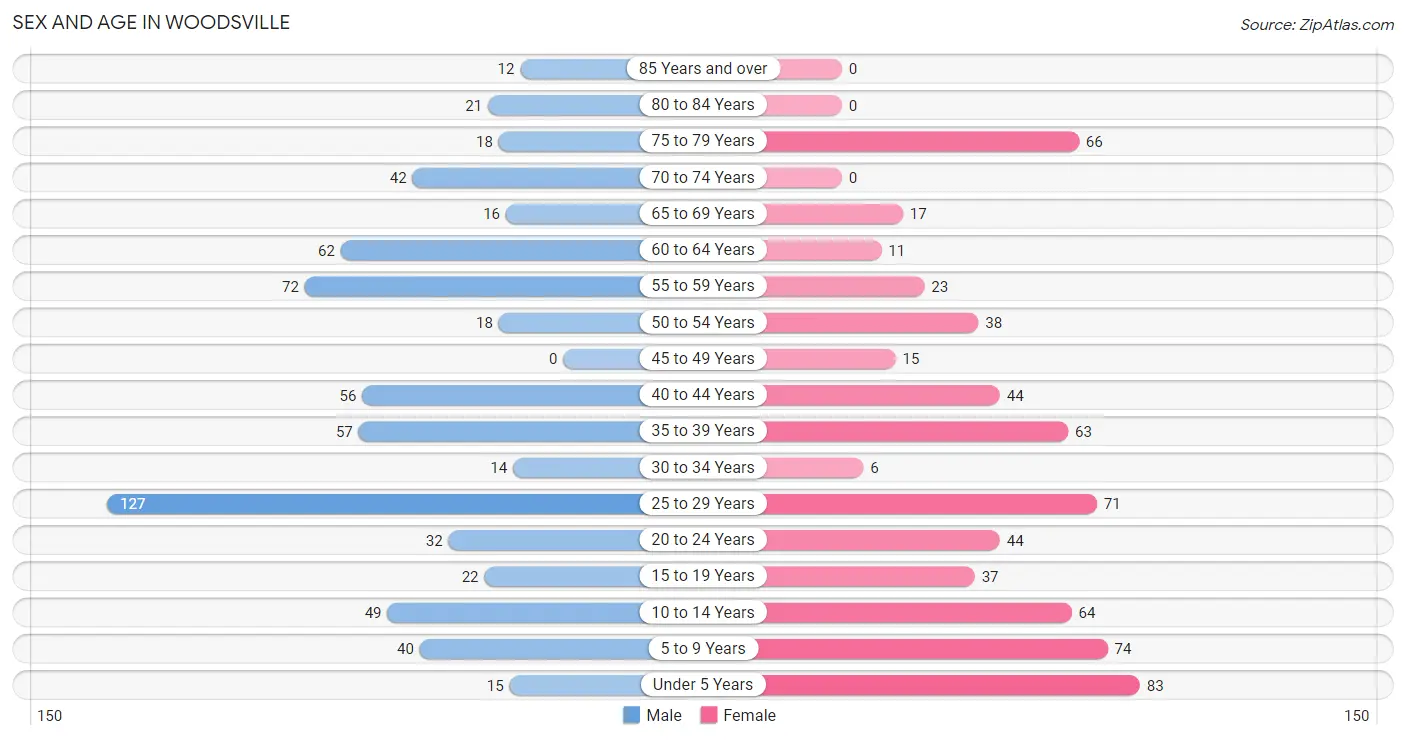
| Age Bracket | Male | Female |
| Under 5 Years | 15 (2.2%) | 83 (12.7%) |
| 5 to 9 Years | 40 (5.9%) | 74 (11.3%) |
| 10 to 14 Years | 49 (7.3%) | 64 (9.8%) |
| 15 to 19 Years | 22 (3.3%) | 37 (5.6%) |
| 20 to 24 Years | 32 (4.8%) | 44 (6.7%) |
| 25 to 29 Years | 127 (18.9%) | 71 (10.8%) |
| 30 to 34 Years | 14 (2.1%) | 6 (0.9%) |
| 35 to 39 Years | 57 (8.5%) | 63 (9.6%) |
| 40 to 44 Years | 56 (8.3%) | 44 (6.7%) |
| 45 to 49 Years | 0 (0.0%) | 15 (2.3%) |
| 50 to 54 Years | 18 (2.7%) | 38 (5.8%) |
| 55 to 59 Years | 72 (10.7%) | 23 (3.5%) |
| 60 to 64 Years | 62 (9.2%) | 11 (1.7%) |
| 65 to 69 Years | 16 (2.4%) | 17 (2.6%) |
| 70 to 74 Years | 42 (6.2%) | 0 (0.0%) |
| 75 to 79 Years | 18 (2.7%) | 66 (10.1%) |
| 80 to 84 Years | 21 (3.1%) | 0 (0.0%) |
| 85 Years and over | 12 (1.8%) | 0 (0.0%) |
| Total | 673 (100.0%) | 656 (100.0%) |
Families and Households in Woodsville
Median Family Size in Woodsville
The median family size in Woodsville is 3.57 persons per family, with married-couple families (176 | 71.8%) accounting for the largest median family size of 3.76 persons per family. On the other hand, single female/mother families (34 | 13.9%) represent the smallest median family size with 2.97 persons per family.
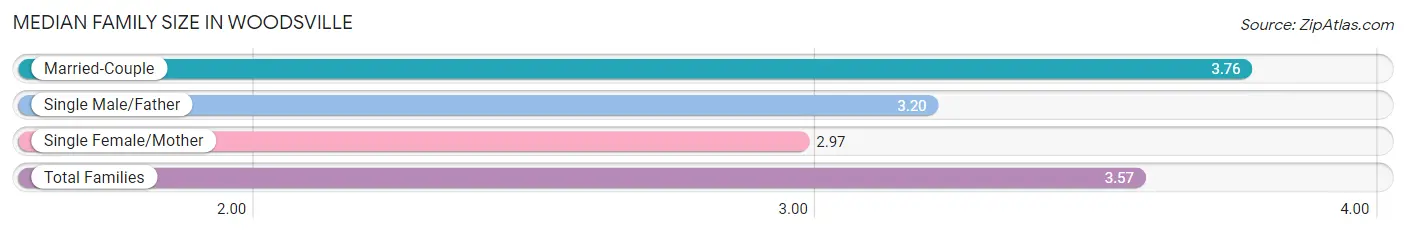
| Family Type | # Families | Family Size |
| Married-Couple | 176 (71.8%) | 3.76 |
| Single Male/Father | 35 (14.3%) | 3.20 |
| Single Female/Mother | 34 (13.9%) | 2.97 |
| Total Families | 245 (100.0%) | 3.57 |
Median Household Size in Woodsville
The median household size in Woodsville is 2.45 persons per household, with married-couple households (176 | 32.5%) accounting for the largest median household size of 3.76 persons per household. non-family households (297 | 54.8%) represent the smallest median household size with 1.51 persons per household.
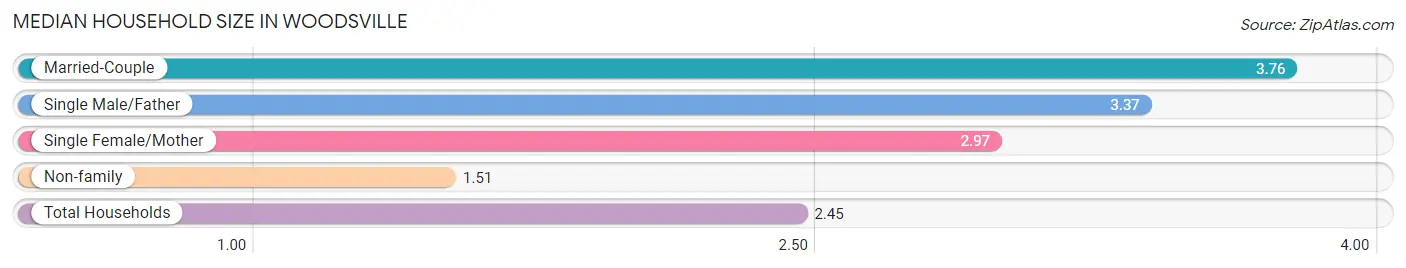
| Household Type | # Households | Household Size |
| Married-Couple | 176 (32.5%) | 3.76 |
| Single Male/Father | 35 (6.5%) | 3.37 |
| Single Female/Mother | 34 (6.3%) | 2.97 |
| Non-family | 297 (54.8%) | 1.51 |
| Total Households | 542 (100.0%) | 2.45 |
Household Size by Marriage Status in Woodsville
Out of a total of 542 households in Woodsville, 245 (45.2%) are family households, while 297 (54.8%) are nonfamily households. The most numerous type of family households are 4-person households, comprising 108, and the most common type of nonfamily households are 1-person households, comprising 231.
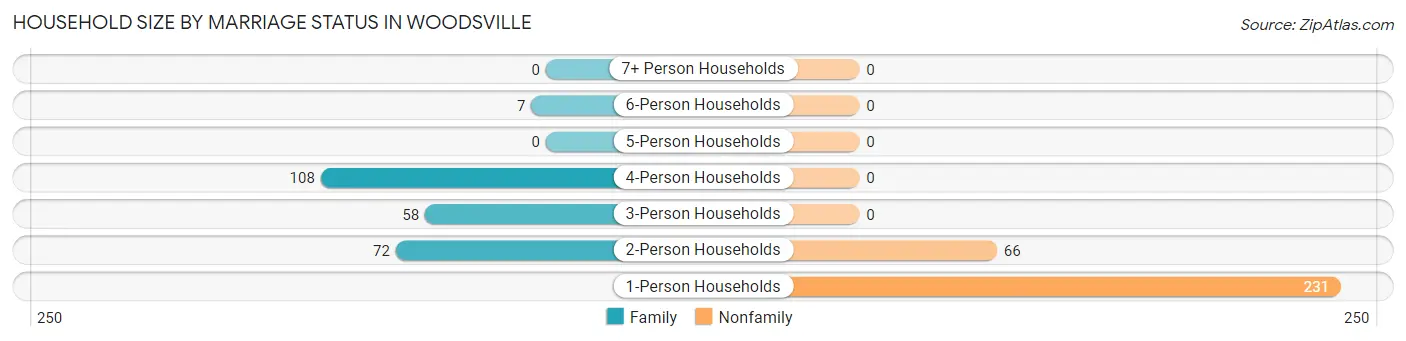
| Household Size | Family Households | Nonfamily Households |
| 1-Person Households | - | 231 (42.6%) |
| 2-Person Households | 72 (13.3%) | 66 (12.2%) |
| 3-Person Households | 58 (10.7%) | 0 (0.0%) |
| 4-Person Households | 108 (19.9%) | 0 (0.0%) |
| 5-Person Households | 0 (0.0%) | 0 (0.0%) |
| 6-Person Households | 7 (1.3%) | 0 (0.0%) |
| 7+ Person Households | 0 (0.0%) | 0 (0.0%) |
| Total | 245 (45.2%) | 297 (54.8%) |
Female Fertility in Woodsville
Fertility by Age in Woodsville
Average fertility rate in Woodsville is 21.0 births per 1,000 women. Women in the age bracket of 20 to 34 years have the highest fertility rate with 50.0 births per 1,000 women. Women in the age bracket of 20 to 34 years acount for 100.0% of all women with births.
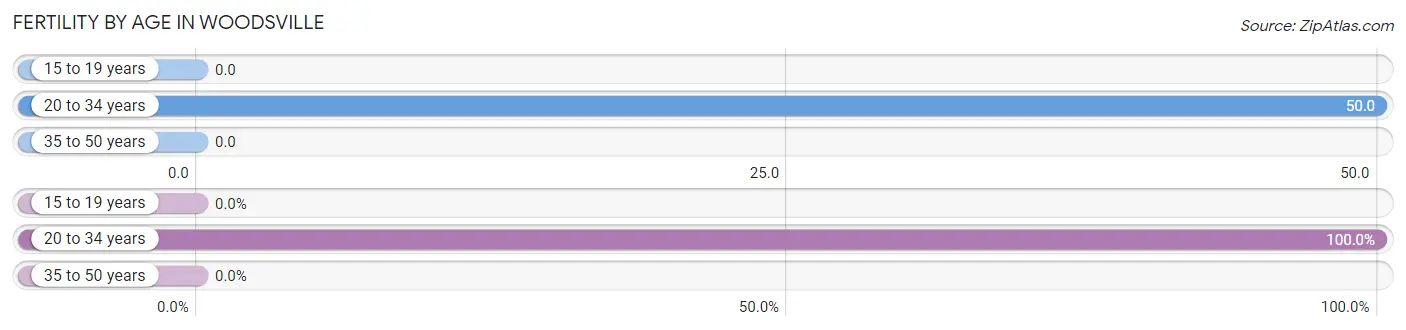
| Age Bracket | Women with Births | Births / 1,000 Women |
| 15 to 19 years | 0 (0.0%) | 0.0 |
| 20 to 34 years | 6 (100.0%) | 50.0 |
| 35 to 50 years | 0 (0.0%) | 0.0 |
| Total | 6 (100.0%) | 21.0 |
Fertility by Age by Marriage Status in Woodsville
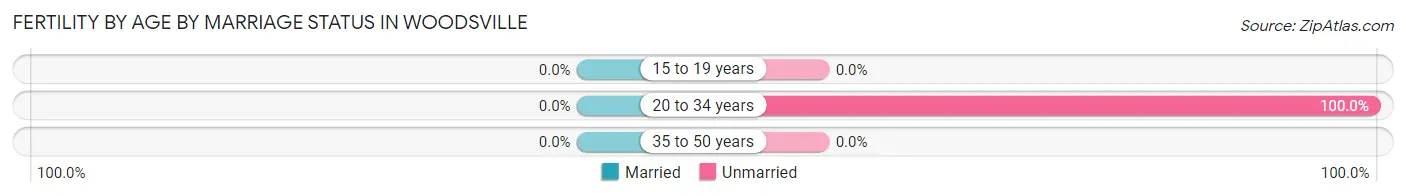
| Age Bracket | Married | Unmarried |
| 15 to 19 years | 0 (0.0%) | 0 (0.0%) |
| 20 to 34 years | 0 (0.0%) | 6 (100.0%) |
| 35 to 50 years | 0 (0.0%) | 0 (0.0%) |
| Total | 0 (0.0%) | 6 (100.0%) |
Fertility by Education in Woodsville
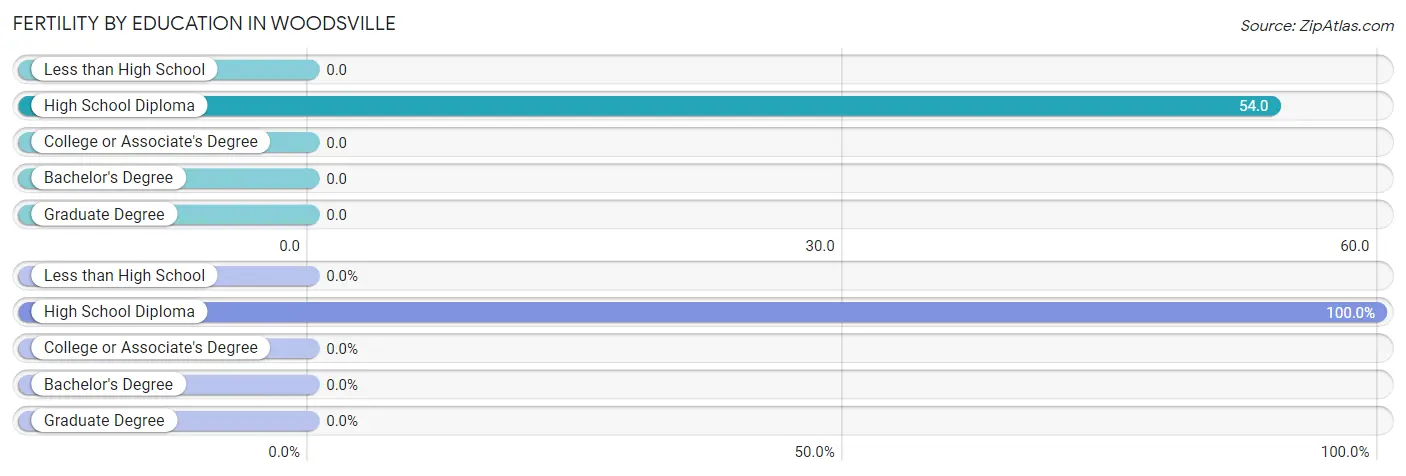
| Educational Attainment | Women with Births | Births / 1,000 Women |
| Less than High School | 0 (0.0%) | 0.0 |
| High School Diploma | 6 (100.0%) | 54.0 |
| College or Associate's Degree | 0 (0.0%) | 0.0 |
| Bachelor's Degree | 0 (0.0%) | 0.0 |
| Graduate Degree | 0 (0.0%) | 0.0 |
| Total | 6 (100.0%) | 21.0 |
Fertility by Education by Marriage Status in Woodsville
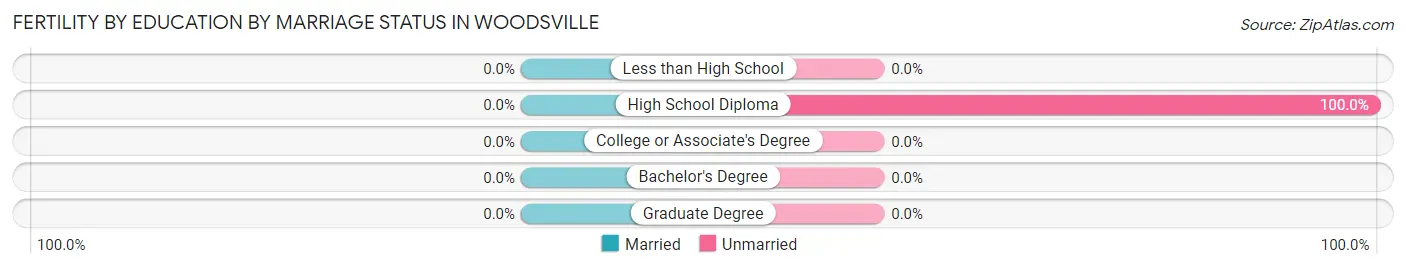
| Educational Attainment | Married | Unmarried |
| Less than High School | 0 (0.0%) | 0 (0.0%) |
| High School Diploma | 0 (0.0%) | 6 (100.0%) |
| College or Associate's Degree | 0 (0.0%) | 0 (0.0%) |
| Bachelor's Degree | 0 (0.0%) | 0 (0.0%) |
| Graduate Degree | 0 (0.0%) | 0 (0.0%) |
| Total | 0 (0.0%) | 6 (100.0%) |
Employment Characteristics in Woodsville
Employment by Class of Employer in Woodsville
Among the 620 employed individuals in Woodsville, private company employees (331 | 53.4%), not-for-profit organizations (165 | 26.6%), and state government employees (60 | 9.7%) make up the most common classes of employment.
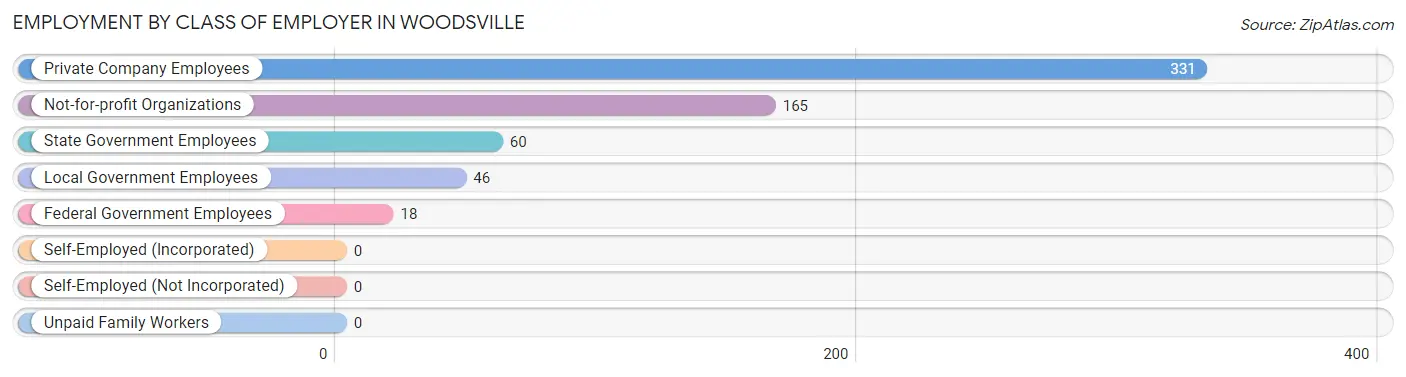
| Employer Class | # Employees | % Employees |
| Private Company Employees | 331 | 53.4% |
| Self-Employed (Incorporated) | 0 | 0.0% |
| Self-Employed (Not Incorporated) | 0 | 0.0% |
| Not-for-profit Organizations | 165 | 26.6% |
| Local Government Employees | 46 | 7.4% |
| State Government Employees | 60 | 9.7% |
| Federal Government Employees | 18 | 2.9% |
| Unpaid Family Workers | 0 | 0.0% |
| Total | 620 | 100.0% |
Employment Status by Age in Woodsville
According to the labor force statistics for Woodsville, out of the total population over 16 years of age (991), 64.4% or 638 individuals are in the labor force, with 2.8% or 18 of them unemployed. The age group with the highest labor force participation rate is 16 to 19 years, with 100.0% or 46 individuals in the labor force. Within the labor force, the 75 years and over age range has the highest percentage of unemployed individuals, with 100.0% or 18 of them being unemployed.
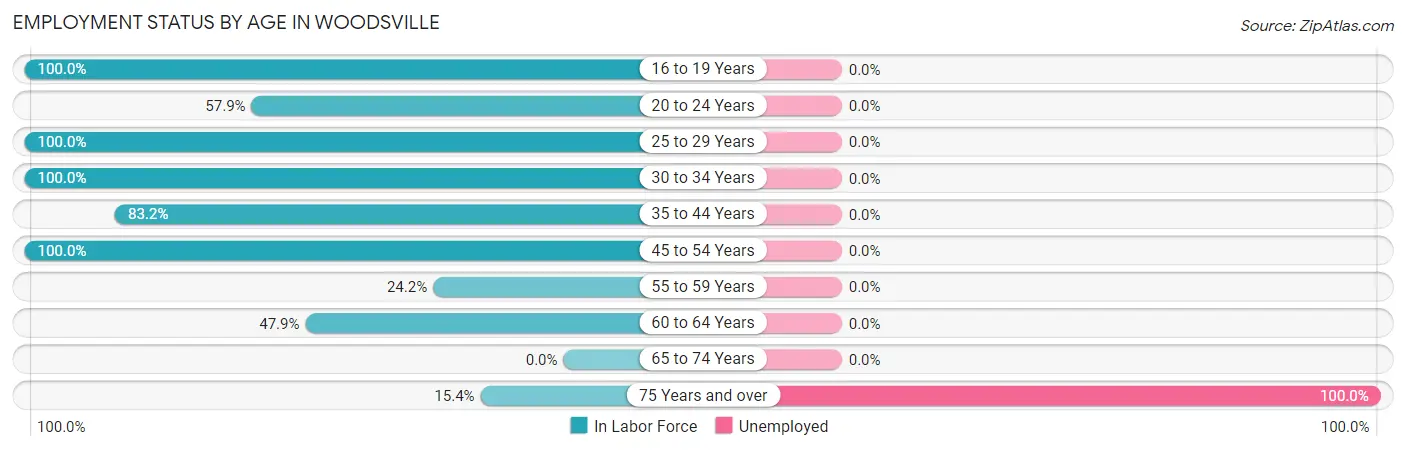
| Age Bracket | In Labor Force | Unemployed |
| 16 to 19 Years | 46 (100.0%) | 0 (0.0%) |
| 20 to 24 Years | 44 (57.9%) | 0 (0.0%) |
| 25 to 29 Years | 198 (100.0%) | 0 (0.0%) |
| 30 to 34 Years | 20 (100.0%) | 0 (0.0%) |
| 35 to 44 Years | 183 (83.2%) | 0 (0.0%) |
| 45 to 54 Years | 71 (100.0%) | 0 (0.0%) |
| 55 to 59 Years | 23 (24.2%) | 0 (0.0%) |
| 60 to 64 Years | 35 (47.9%) | 0 (0.0%) |
| 65 to 74 Years | 0 (0.0%) | 0 (0.0%) |
| 75 Years and over | 18 (15.4%) | 18 (100.0%) |
| Total | 638 (64.4%) | 18 (2.8%) |
Employment Status by Educational Attainment in Woodsville
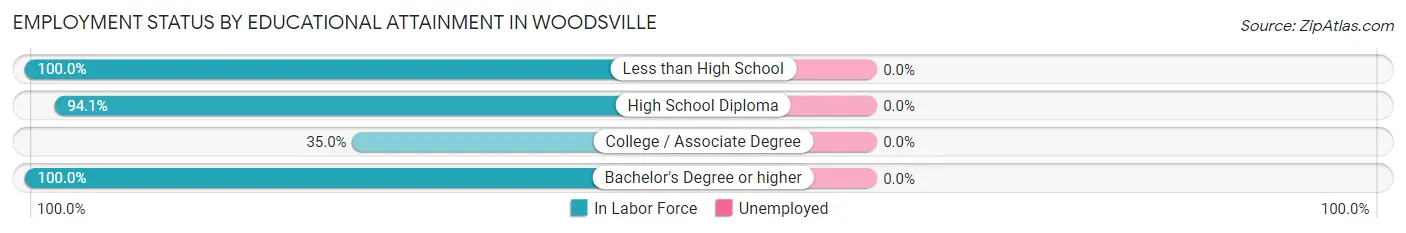
| Educational Attainment | In Labor Force | Unemployed |
| Less than High School | 64 (100.0%) | 0 (0.0%) |
| High School Diploma | 269 (94.1%) | 0 (0.0%) |
| College / Associate Degree | 70 (35.0%) | 0 (0.0%) |
| Bachelor's Degree or higher | 127 (100.0%) | 0 (0.0%) |
| Total | 530 (78.3%) | 0 (0.0%) |
Employment Occupations by Sex in Woodsville
Management, Business, Science and Arts Occupations
The most common Management, Business, Science and Arts occupations in Woodsville are Business & Financial (75 | 12.1%), Management (59 | 9.5%), Community & Social Service (58 | 9.3%), Education, Arts & Media (35 | 5.7%), and Health Diagnosing & Treating (35 | 5.7%).
Management, Business, Science and Arts Occupations by Sex
Within the Management, Business, Science and Arts occupations in Woodsville, the most male-oriented occupations are Health Diagnosing & Treating (100.0%), Health Technologists (100.0%), and Management (54.2%), while the most female-oriented occupations are Community & Social Service (100.0%), Education, Arts & Media (100.0%), and Education Instruction & Library (100.0%).
| Occupation | Male | Female |
| Management | 32 (54.2%) | 27 (45.8%) |
| Business & Financial | 18 (24.0%) | 57 (76.0%) |
| Computers, Engineering & Science | 0 (0.0%) | 0 (0.0%) |
| Computers & Mathematics | 0 (0.0%) | 0 (0.0%) |
| Architecture & Engineering | 0 (0.0%) | 0 (0.0%) |
| Life, Physical & Social Science | 0 (0.0%) | 0 (0.0%) |
| Community & Social Service | 0 (0.0%) | 58 (100.0%) |
| Education, Arts & Media | 0 (0.0%) | 35 (100.0%) |
| Legal Services & Support | 0 (0.0%) | 0 (0.0%) |
| Education Instruction & Library | 0 (0.0%) | 23 (100.0%) |
| Arts, Media & Entertainment | 0 (0.0%) | 0 (0.0%) |
| Health Diagnosing & Treating | 35 (100.0%) | 0 (0.0%) |
| Health Technologists | 35 (100.0%) | 0 (0.0%) |
| Total (Category) | 85 (37.4%) | 142 (62.6%) |
| Total (Overall) | 318 (51.3%) | 302 (48.7%) |
Services Occupations
The most common Services occupations in Woodsville are Food Preparation & Serving (54 | 8.7%), Cleaning & Maintenance (37 | 6.0%), Personal Care & Service (24 | 3.9%), and Healthcare Support (18 | 2.9%).
Services Occupations by Sex
Within the Services occupations in Woodsville, the most male-oriented occupations are Cleaning & Maintenance (83.8%), Food Preparation & Serving (40.7%), and Healthcare Support (38.9%), while the most female-oriented occupations are Personal Care & Service (100.0%), Healthcare Support (61.1%), and Food Preparation & Serving (59.3%).
| Occupation | Male | Female |
| Healthcare Support | 7 (38.9%) | 11 (61.1%) |
| Security & Protection | 0 (0.0%) | 0 (0.0%) |
| Firefighting & Prevention | 0 (0.0%) | 0 (0.0%) |
| Law Enforcement | 0 (0.0%) | 0 (0.0%) |
| Food Preparation & Serving | 22 (40.7%) | 32 (59.3%) |
| Cleaning & Maintenance | 31 (83.8%) | 6 (16.2%) |
| Personal Care & Service | 0 (0.0%) | 24 (100.0%) |
| Total (Category) | 60 (45.1%) | 73 (54.9%) |
| Total (Overall) | 318 (51.3%) | 302 (48.7%) |
Sales and Office Occupations
The most common Sales and Office occupations in Woodsville are , and Office & Administration (23 | 3.7%).
Sales and Office Occupations by Sex
| Occupation | Male | Female |
| Sales & Related | 0 (0.0%) | 0 (0.0%) |
| Office & Administration | 0 (0.0%) | 23 (100.0%) |
| Total (Category) | 0 (0.0%) | 23 (100.0%) |
| Total (Overall) | 318 (51.3%) | 302 (48.7%) |
Natural Resources, Construction and Maintenance Occupations
The most common Natural Resources, Construction and Maintenance occupations in Woodsville are , and Installation, Maintenance & Repair (127 | 20.5%).
Natural Resources, Construction and Maintenance Occupations by Sex
| Occupation | Male | Female |
| Farming, Fishing & Forestry | 0 (0.0%) | 0 (0.0%) |
| Construction & Extraction | 0 (0.0%) | 0 (0.0%) |
| Installation, Maintenance & Repair | 127 (100.0%) | 0 (0.0%) |
| Total (Category) | 127 (100.0%) | 0 (0.0%) |
| Total (Overall) | 318 (51.3%) | 302 (48.7%) |
Production, Transportation and Moving Occupations
The most common Production, Transportation and Moving occupations in Woodsville are Production (88 | 14.2%), and Transportation (22 | 3.5%).
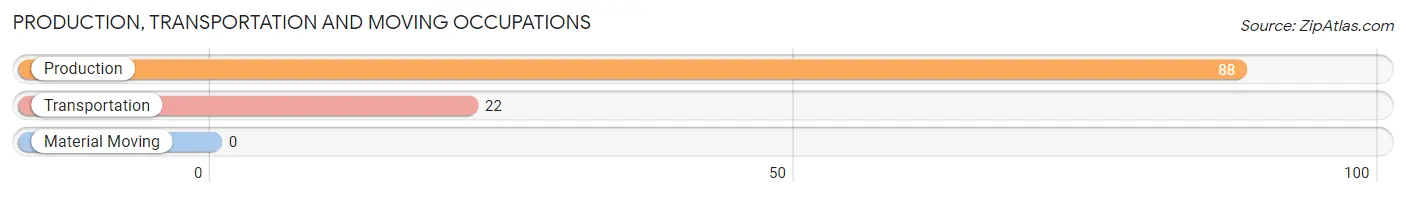
Production, Transportation and Moving Occupations by Sex
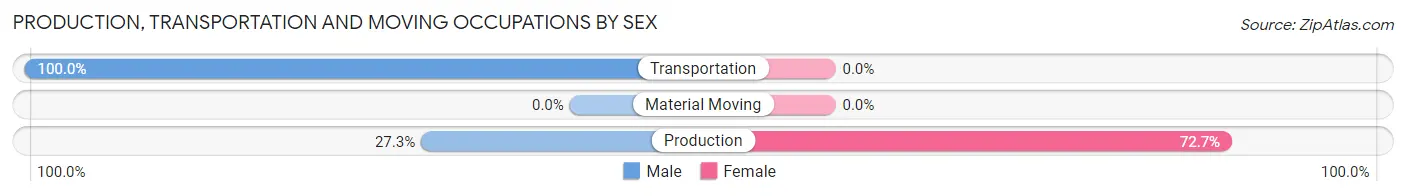
| Occupation | Male | Female |
| Production | 24 (27.3%) | 64 (72.7%) |
| Transportation | 22 (100.0%) | 0 (0.0%) |
| Material Moving | 0 (0.0%) | 0 (0.0%) |
| Total (Category) | 46 (41.8%) | 64 (58.2%) |
| Total (Overall) | 318 (51.3%) | 302 (48.7%) |
Employment Industries by Sex in Woodsville
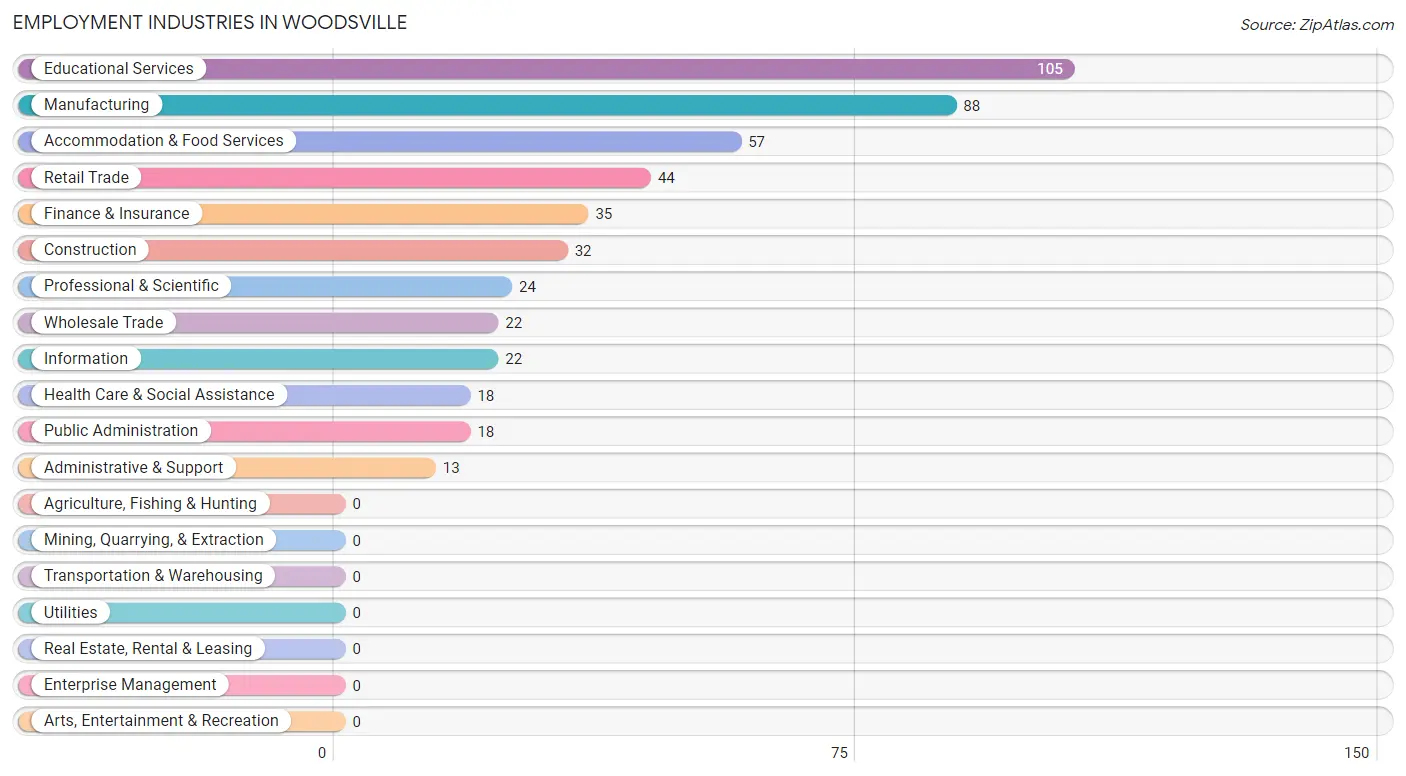
Employment Industries in Woodsville
The major employment industries in Woodsville include Educational Services (105 | 16.9%), Manufacturing (88 | 14.2%), Accommodation & Food Services (57 | 9.2%), Retail Trade (44 | 7.1%), and Finance & Insurance (35 | 5.7%).
Employment Industries by Sex in Woodsville
The Woodsville industries that see more men than women are Construction (100.0%), Wholesale Trade (100.0%), and Information (100.0%), whereas the industries that tend to have a higher number of women are Retail Trade (100.0%), Professional & Scientific (100.0%), and Administrative & Support (100.0%).
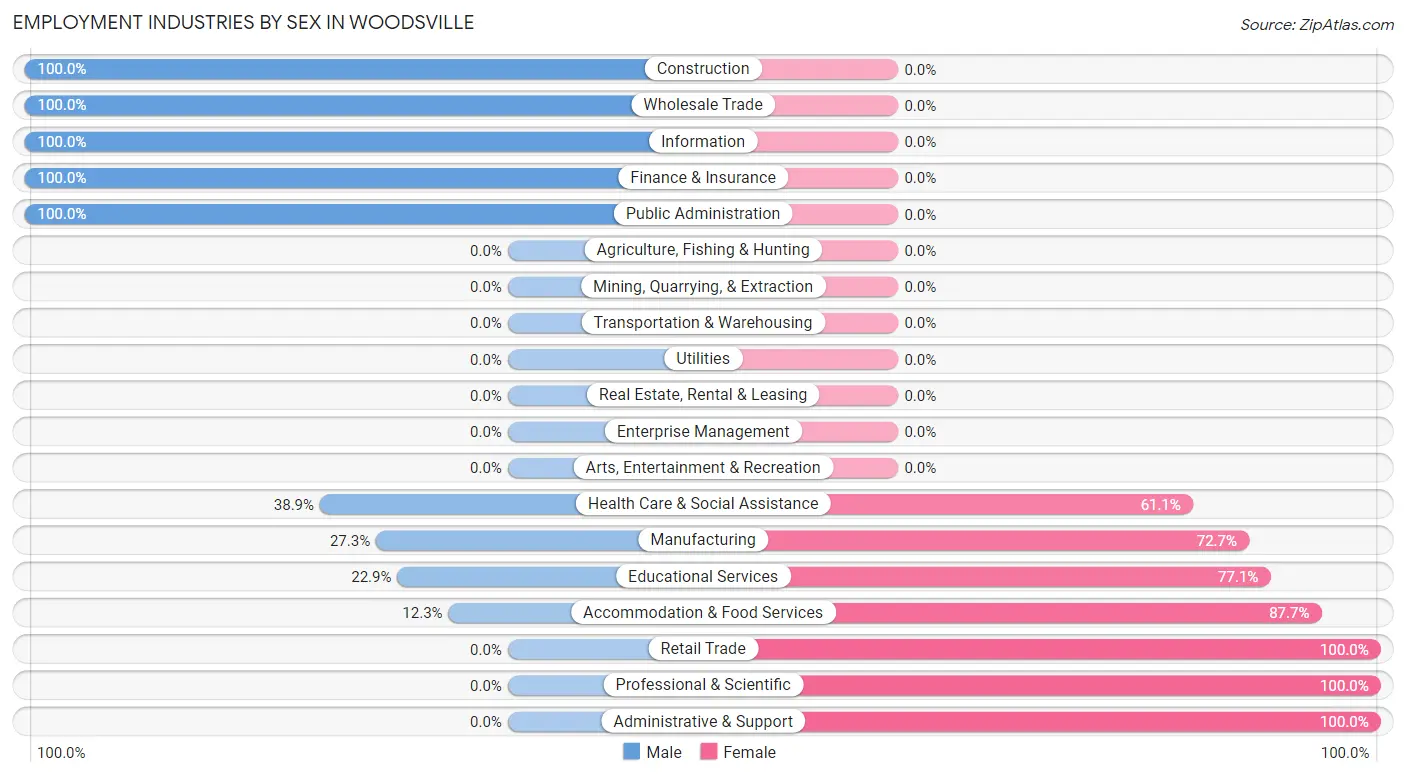
| Industry | Male | Female |
| Agriculture, Fishing & Hunting | 0 (0.0%) | 0 (0.0%) |
| Mining, Quarrying, & Extraction | 0 (0.0%) | 0 (0.0%) |
| Construction | 32 (100.0%) | 0 (0.0%) |
| Manufacturing | 24 (27.3%) | 64 (72.7%) |
| Wholesale Trade | 22 (100.0%) | 0 (0.0%) |
| Retail Trade | 0 (0.0%) | 44 (100.0%) |
| Transportation & Warehousing | 0 (0.0%) | 0 (0.0%) |
| Utilities | 0 (0.0%) | 0 (0.0%) |
| Information | 22 (100.0%) | 0 (0.0%) |
| Finance & Insurance | 35 (100.0%) | 0 (0.0%) |
| Real Estate, Rental & Leasing | 0 (0.0%) | 0 (0.0%) |
| Professional & Scientific | 0 (0.0%) | 24 (100.0%) |
| Enterprise Management | 0 (0.0%) | 0 (0.0%) |
| Administrative & Support | 0 (0.0%) | 13 (100.0%) |
| Educational Services | 24 (22.9%) | 81 (77.1%) |
| Health Care & Social Assistance | 7 (38.9%) | 11 (61.1%) |
| Arts, Entertainment & Recreation | 0 (0.0%) | 0 (0.0%) |
| Accommodation & Food Services | 7 (12.3%) | 50 (87.7%) |
| Public Administration | 18 (100.0%) | 0 (0.0%) |
| Total | 318 (51.3%) | 302 (48.7%) |
Education in Woodsville
School Enrollment in Woodsville
The most common levels of schooling among the 357 students in Woodsville are elementary school (97 | 27.2%), middle school (97 | 27.2%), and college / undergraduate (91 | 25.5%).
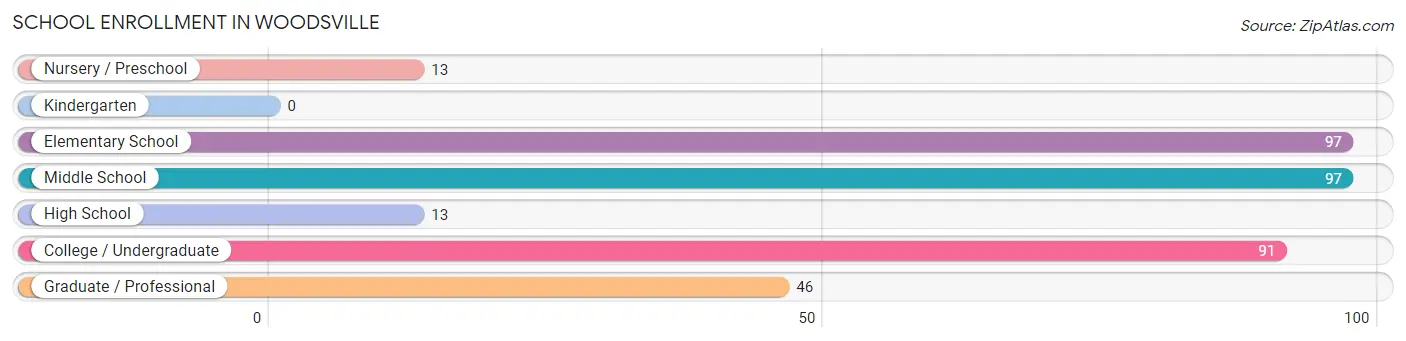
| School Level | # Students | % Students |
| Nursery / Preschool | 13 | 3.6% |
| Kindergarten | 0 | 0.0% |
| Elementary School | 97 | 27.2% |
| Middle School | 97 | 27.2% |
| High School | 13 | 3.6% |
| College / Undergraduate | 91 | 25.5% |
| Graduate / Professional | 46 | 12.9% |
| Total | 357 | 100.0% |
School Enrollment by Age by Funding Source in Woodsville
Out of a total of 357 students who are enrolled in schools in Woodsville, 23 (6.4%) attend a private institution, while the remaining 334 (93.6%) are enrolled in public schools. The age group of 25 to 34 year olds has the highest likelihood of being enrolled in private schools, with 23 (39.7% in the age bracket) enrolled. Conversely, the age group of 3 to 4 year olds has the lowest likelihood of being enrolled in a private school, with 13 (100.0% in the age bracket) attending a public institution.
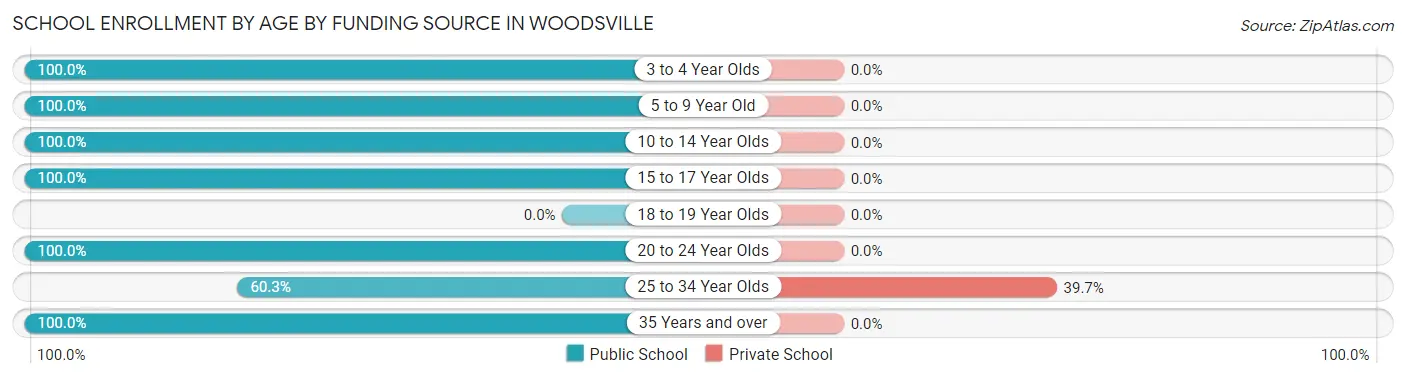
| Age Bracket | Public School | Private School |
| 3 to 4 Year Olds | 13 (100.0%) | 0 (0.0%) |
| 5 to 9 Year Old | 81 (100.0%) | 0 (0.0%) |
| 10 to 14 Year Olds | 113 (100.0%) | 0 (0.0%) |
| 15 to 17 Year Olds | 13 (100.0%) | 0 (0.0%) |
| 18 to 19 Year Olds | 0 (0.0%) | 0 (0.0%) |
| 20 to 24 Year Olds | 32 (100.0%) | 0 (0.0%) |
| 25 to 34 Year Olds | 35 (60.3%) | 23 (39.7%) |
| 35 Years and over | 47 (100.0%) | 0 (0.0%) |
| Total | 334 (93.6%) | 23 (6.4%) |
Educational Attainment by Field of Study in Woodsville
Science & technology (58 | 31.5%), business (55 | 29.9%), arts & humanities (33 | 17.9%), education (23 | 12.5%), and communications (15 | 8.2%) are the most common fields of study among 184 individuals in Woodsville who have obtained a bachelor's degree or higher.
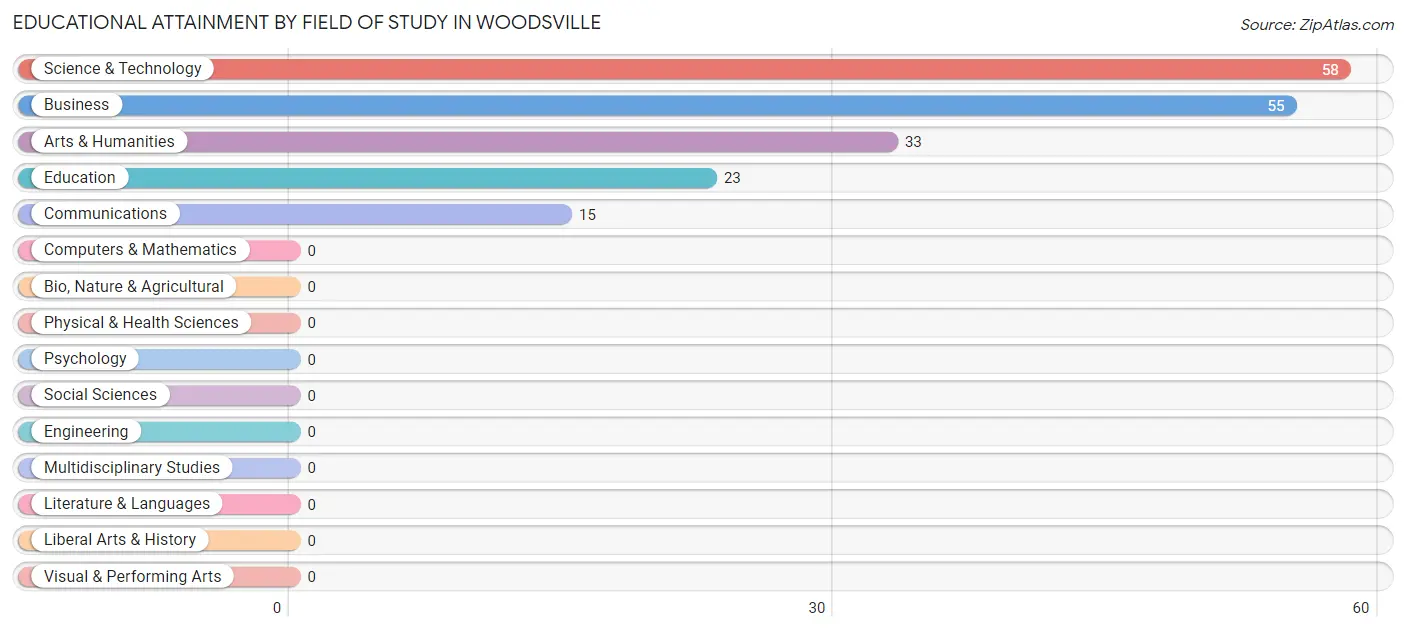
| Field of Study | # Graduates | % Graduates |
| Computers & Mathematics | 0 | 0.0% |
| Bio, Nature & Agricultural | 0 | 0.0% |
| Physical & Health Sciences | 0 | 0.0% |
| Psychology | 0 | 0.0% |
| Social Sciences | 0 | 0.0% |
| Engineering | 0 | 0.0% |
| Multidisciplinary Studies | 0 | 0.0% |
| Science & Technology | 58 | 31.5% |
| Business | 55 | 29.9% |
| Education | 23 | 12.5% |
| Literature & Languages | 0 | 0.0% |
| Liberal Arts & History | 0 | 0.0% |
| Visual & Performing Arts | 0 | 0.0% |
| Communications | 15 | 8.2% |
| Arts & Humanities | 33 | 17.9% |
| Total | 184 | 100.0% |
Transportation & Commute in Woodsville
Vehicle Availability by Sex in Woodsville
The most prevalent vehicle ownership categories in Woodsville are males with 3 vehicles (206, accounting for 64.8%) and females with 3 vehicles (120, making up 68.2%).
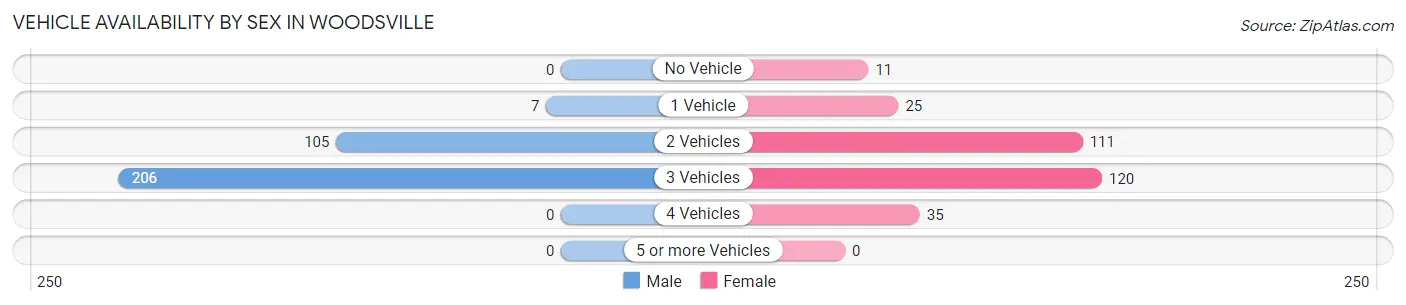
| Vehicles Available | Male | Female |
| No Vehicle | 0 (0.0%) | 11 (3.6%) |
| 1 Vehicle | 7 (2.2%) | 25 (8.3%) |
| 2 Vehicles | 105 (33.0%) | 111 (36.7%) |
| 3 Vehicles | 206 (64.8%) | 120 (39.7%) |
| 4 Vehicles | 0 (0.0%) | 35 (11.6%) |
| 5 or more Vehicles | 0 (0.0%) | 0 (0.0%) |
| Total | 318 (100.0%) | 302 (100.0%) |
Commute Time in Woodsville
The most frequently occuring commute durations in Woodsville are 60 to 89 minutes (187 commuters, 31.1%), 45 to 59 minutes (103 commuters, 17.1%), and 40 to 44 minutes (83 commuters, 13.8%).
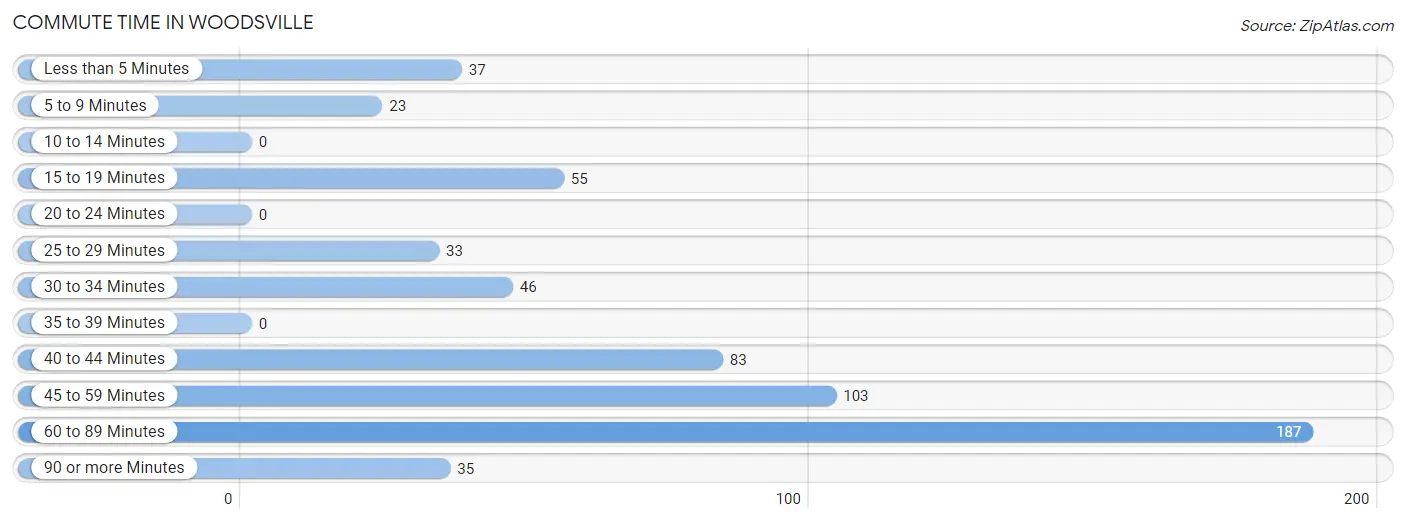
| Commute Time | # Commuters | % Commuters |
| Less than 5 Minutes | 37 | 6.1% |
| 5 to 9 Minutes | 23 | 3.8% |
| 10 to 14 Minutes | 0 | 0.0% |
| 15 to 19 Minutes | 55 | 9.1% |
| 20 to 24 Minutes | 0 | 0.0% |
| 25 to 29 Minutes | 33 | 5.5% |
| 30 to 34 Minutes | 46 | 7.6% |
| 35 to 39 Minutes | 0 | 0.0% |
| 40 to 44 Minutes | 83 | 13.8% |
| 45 to 59 Minutes | 103 | 17.1% |
| 60 to 89 Minutes | 187 | 31.1% |
| 90 or more Minutes | 35 | 5.8% |
Commute Time by Sex in Woodsville
The most common commute times in Woodsville are 60 to 89 minutes (149 commuters, 49.7%) for males and 45 to 59 minutes (79 commuters, 26.2%) for females.
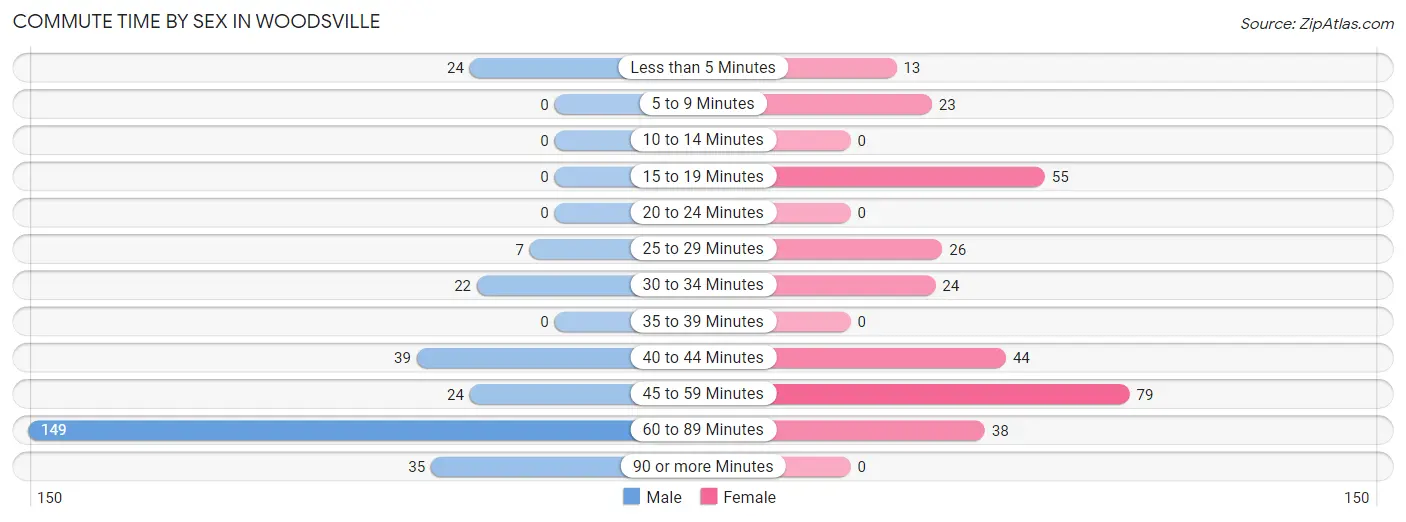
| Commute Time | Male | Female |
| Less than 5 Minutes | 24 (8.0%) | 13 (4.3%) |
| 5 to 9 Minutes | 0 (0.0%) | 23 (7.6%) |
| 10 to 14 Minutes | 0 (0.0%) | 0 (0.0%) |
| 15 to 19 Minutes | 0 (0.0%) | 55 (18.2%) |
| 20 to 24 Minutes | 0 (0.0%) | 0 (0.0%) |
| 25 to 29 Minutes | 7 (2.3%) | 26 (8.6%) |
| 30 to 34 Minutes | 22 (7.3%) | 24 (8.0%) |
| 35 to 39 Minutes | 0 (0.0%) | 0 (0.0%) |
| 40 to 44 Minutes | 39 (13.0%) | 44 (14.6%) |
| 45 to 59 Minutes | 24 (8.0%) | 79 (26.2%) |
| 60 to 89 Minutes | 149 (49.7%) | 38 (12.6%) |
| 90 or more Minutes | 35 (11.7%) | 0 (0.0%) |
Time of Departure to Work by Sex in Woodsville
The most frequent times of departure to work in Woodsville are 8:00 AM to 8:29 AM (127, 42.3%) for males and 7:00 AM to 7:29 AM (52, 17.2%) for females.
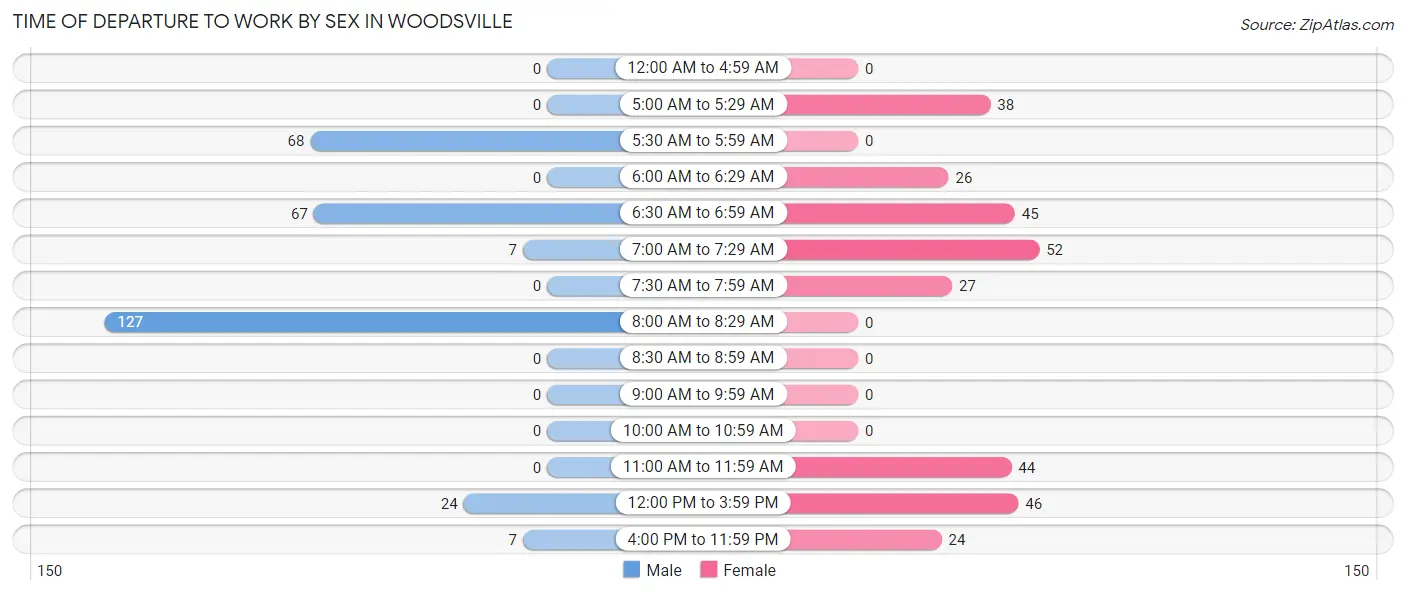
| Time of Departure | Male | Female |
| 12:00 AM to 4:59 AM | 0 (0.0%) | 0 (0.0%) |
| 5:00 AM to 5:29 AM | 0 (0.0%) | 38 (12.6%) |
| 5:30 AM to 5:59 AM | 68 (22.7%) | 0 (0.0%) |
| 6:00 AM to 6:29 AM | 0 (0.0%) | 26 (8.6%) |
| 6:30 AM to 6:59 AM | 67 (22.3%) | 45 (14.9%) |
| 7:00 AM to 7:29 AM | 7 (2.3%) | 52 (17.2%) |
| 7:30 AM to 7:59 AM | 0 (0.0%) | 27 (8.9%) |
| 8:00 AM to 8:29 AM | 127 (42.3%) | 0 (0.0%) |
| 8:30 AM to 8:59 AM | 0 (0.0%) | 0 (0.0%) |
| 9:00 AM to 9:59 AM | 0 (0.0%) | 0 (0.0%) |
| 10:00 AM to 10:59 AM | 0 (0.0%) | 0 (0.0%) |
| 11:00 AM to 11:59 AM | 0 (0.0%) | 44 (14.6%) |
| 12:00 PM to 3:59 PM | 24 (8.0%) | 46 (15.2%) |
| 4:00 PM to 11:59 PM | 7 (2.3%) | 24 (8.0%) |
| Total | 300 (100.0%) | 302 (100.0%) |
Housing Occupancy in Woodsville
Occupancy by Ownership in Woodsville
Of the total 542 dwellings in Woodsville, owner-occupied units account for 219 (40.4%), while renter-occupied units make up 323 (59.6%).
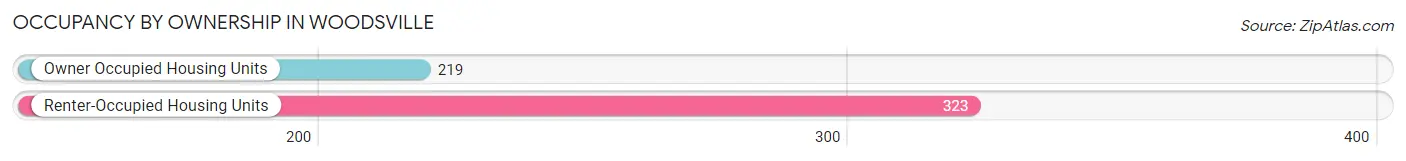
| Occupancy | # Housing Units | % Housing Units |
| Owner Occupied Housing Units | 219 | 40.4% |
| Renter-Occupied Housing Units | 323 | 59.6% |
| Total Occupied Housing Units | 542 | 100.0% |
Occupancy by Household Size in Woodsville
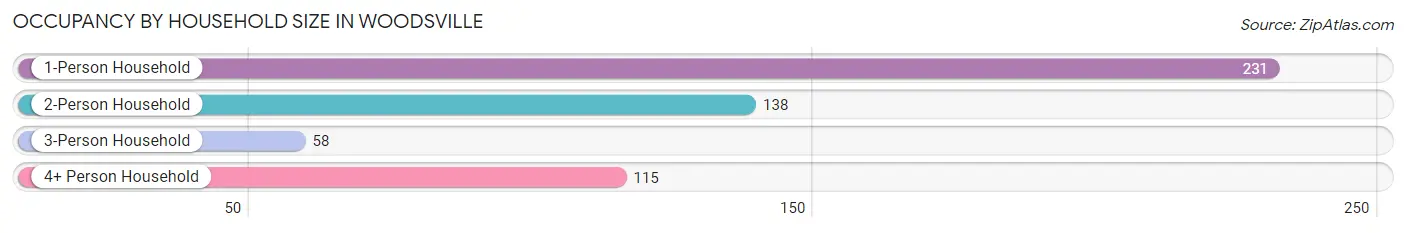
| Household Size | # Housing Units | % Housing Units |
| 1-Person Household | 231 | 42.6% |
| 2-Person Household | 138 | 25.5% |
| 3-Person Household | 58 | 10.7% |
| 4+ Person Household | 115 | 21.2% |
| Total Housing Units | 542 | 100.0% |
Occupancy by Ownership by Household Size in Woodsville
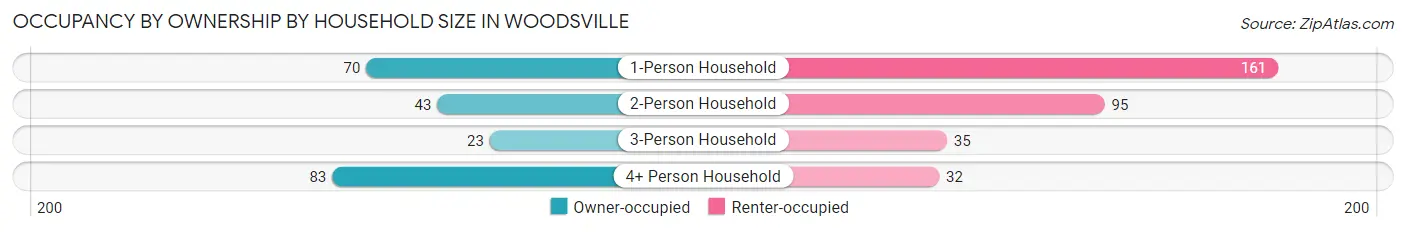
| Household Size | Owner-occupied | Renter-occupied |
| 1-Person Household | 70 (30.3%) | 161 (69.7%) |
| 2-Person Household | 43 (31.2%) | 95 (68.8%) |
| 3-Person Household | 23 (39.7%) | 35 (60.3%) |
| 4+ Person Household | 83 (72.2%) | 32 (27.8%) |
| Total Housing Units | 219 (40.4%) | 323 (59.6%) |
Occupancy by Educational Attainment in Woodsville
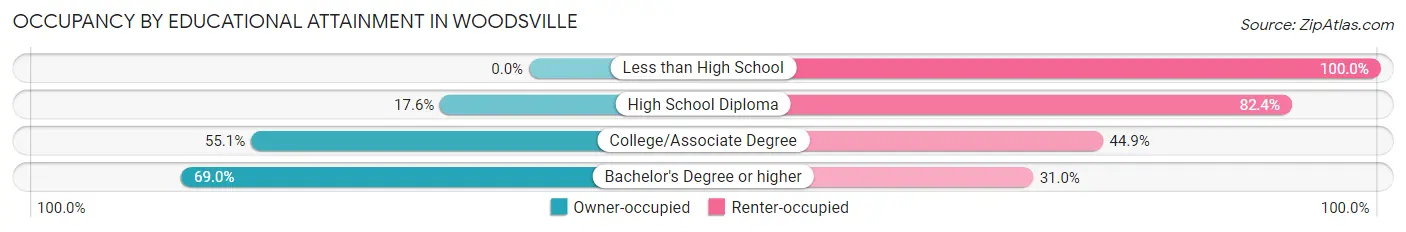
| Household Size | Owner-occupied | Renter-occupied |
| Less than High School | 0 (0.0%) | 54 (100.0%) |
| High School Diploma | 31 (17.6%) | 145 (82.4%) |
| College/Associate Degree | 108 (55.1%) | 88 (44.9%) |
| Bachelor's Degree or higher | 80 (69.0%) | 36 (31.0%) |
Occupancy by Age of Householder in Woodsville
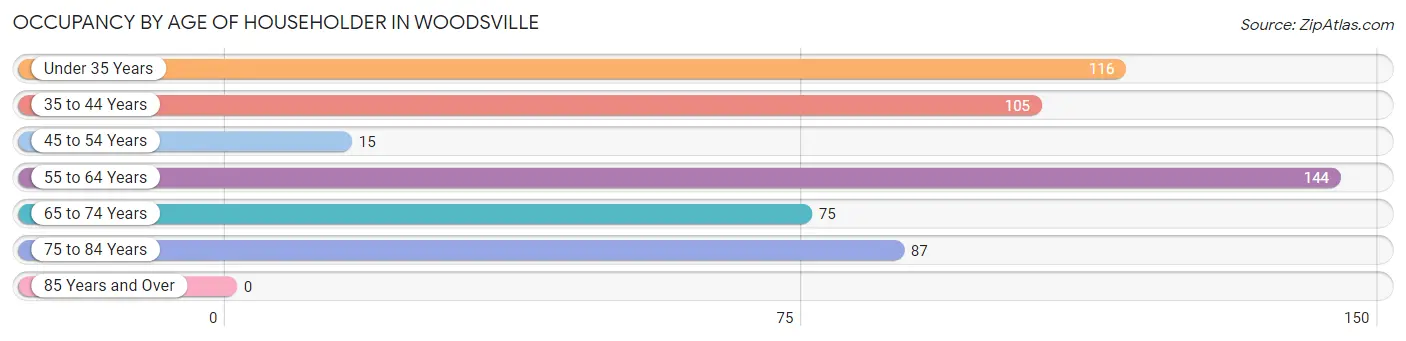
| Age Bracket | # Households | % Households |
| Under 35 Years | 116 | 21.4% |
| 35 to 44 Years | 105 | 19.4% |
| 45 to 54 Years | 15 | 2.8% |
| 55 to 64 Years | 144 | 26.6% |
| 65 to 74 Years | 75 | 13.8% |
| 75 to 84 Years | 87 | 16.1% |
| 85 Years and Over | 0 | 0.0% |
| Total | 542 | 100.0% |
Housing Finances in Woodsville
Median Income by Occupancy in Woodsville
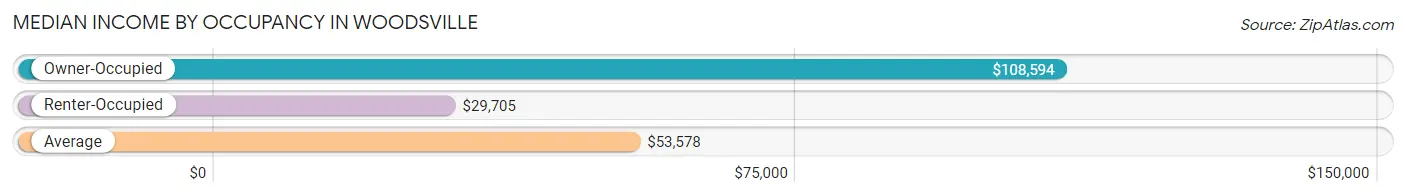
| Occupancy Type | # Households | Median Income |
| Owner-Occupied | 219 (40.4%) | $108,594 |
| Renter-Occupied | 323 (59.6%) | $29,705 |
| Average | 542 (100.0%) | $53,578 |
Occupancy by Householder Income Bracket in Woodsville
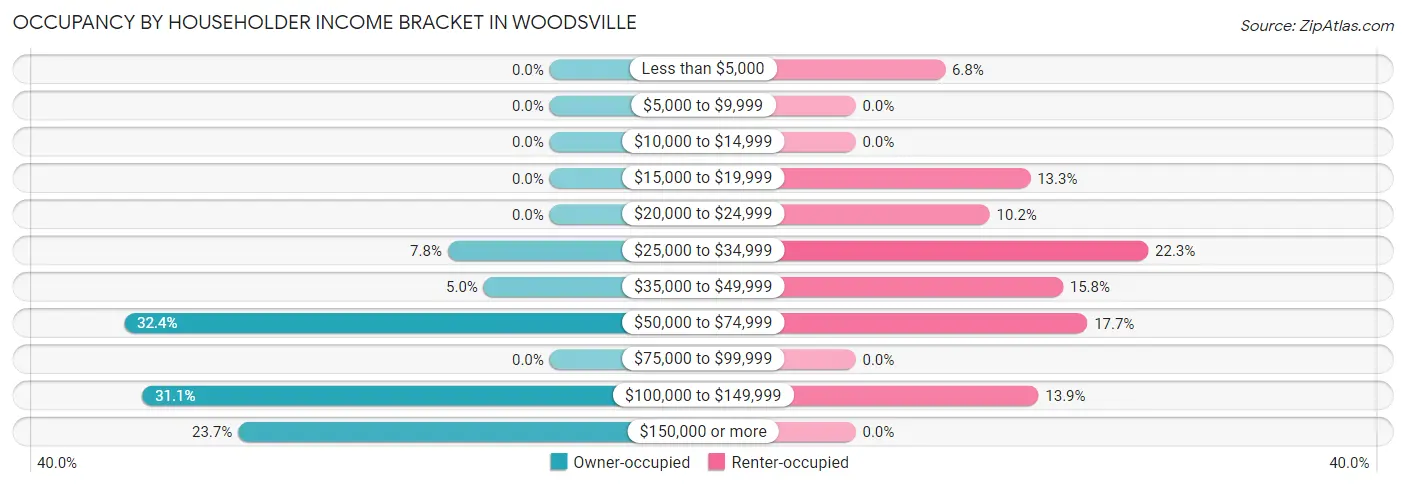
| Income Bracket | Owner-occupied | Renter-occupied |
| Less than $5,000 | 0 (0.0%) | 22 (6.8%) |
| $5,000 to $9,999 | 0 (0.0%) | 0 (0.0%) |
| $10,000 to $14,999 | 0 (0.0%) | 0 (0.0%) |
| $15,000 to $19,999 | 0 (0.0%) | 43 (13.3%) |
| $20,000 to $24,999 | 0 (0.0%) | 33 (10.2%) |
| $25,000 to $34,999 | 17 (7.8%) | 72 (22.3%) |
| $35,000 to $49,999 | 11 (5.0%) | 51 (15.8%) |
| $50,000 to $74,999 | 71 (32.4%) | 57 (17.6%) |
| $75,000 to $99,999 | 0 (0.0%) | 0 (0.0%) |
| $100,000 to $149,999 | 68 (31.0%) | 45 (13.9%) |
| $150,000 or more | 52 (23.7%) | 0 (0.0%) |
| Total | 219 (100.0%) | 323 (100.0%) |
Monthly Housing Cost Tiers in Woodsville
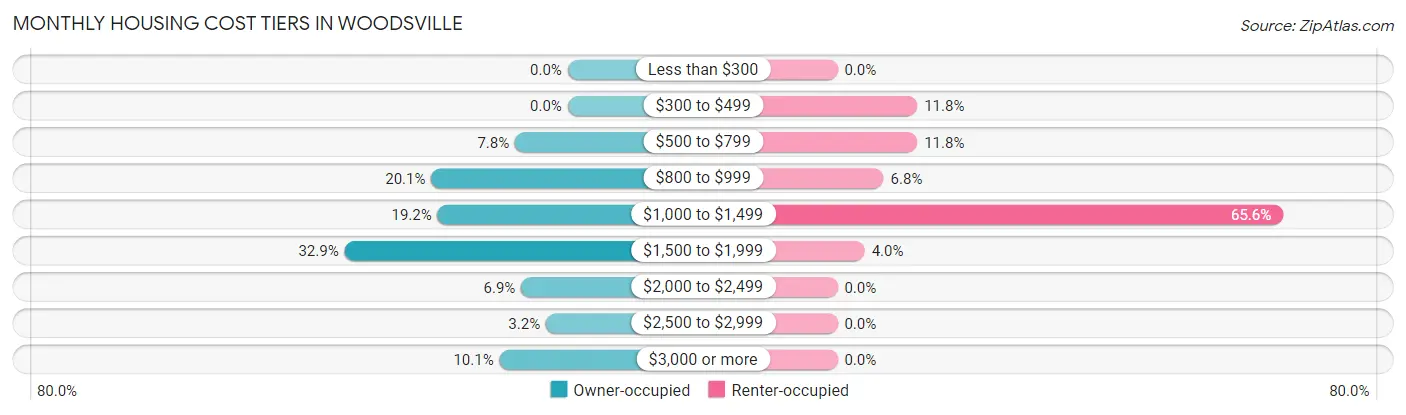
| Monthly Cost | Owner-occupied | Renter-occupied |
| Less than $300 | 0 (0.0%) | 0 (0.0%) |
| $300 to $499 | 0 (0.0%) | 38 (11.8%) |
| $500 to $799 | 17 (7.8%) | 38 (11.8%) |
| $800 to $999 | 44 (20.1%) | 22 (6.8%) |
| $1,000 to $1,499 | 42 (19.2%) | 212 (65.6%) |
| $1,500 to $1,999 | 72 (32.9%) | 13 (4.0%) |
| $2,000 to $2,499 | 15 (6.9%) | 0 (0.0%) |
| $2,500 to $2,999 | 7 (3.2%) | 0 (0.0%) |
| $3,000 or more | 22 (10.1%) | 0 (0.0%) |
| Total | 219 (100.0%) | 323 (100.0%) |
Physical Housing Characteristics in Woodsville
Housing Structures in Woodsville
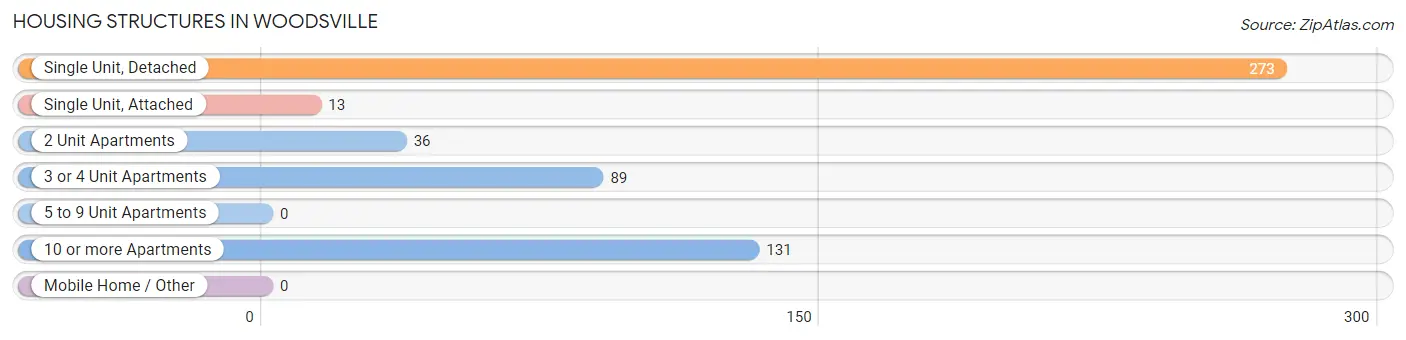
| Structure Type | # Housing Units | % Housing Units |
| Single Unit, Detached | 273 | 50.4% |
| Single Unit, Attached | 13 | 2.4% |
| 2 Unit Apartments | 36 | 6.6% |
| 3 or 4 Unit Apartments | 89 | 16.4% |
| 5 to 9 Unit Apartments | 0 | 0.0% |
| 10 or more Apartments | 131 | 24.2% |
| Mobile Home / Other | 0 | 0.0% |
| Total | 542 | 100.0% |
Housing Structures by Occupancy in Woodsville
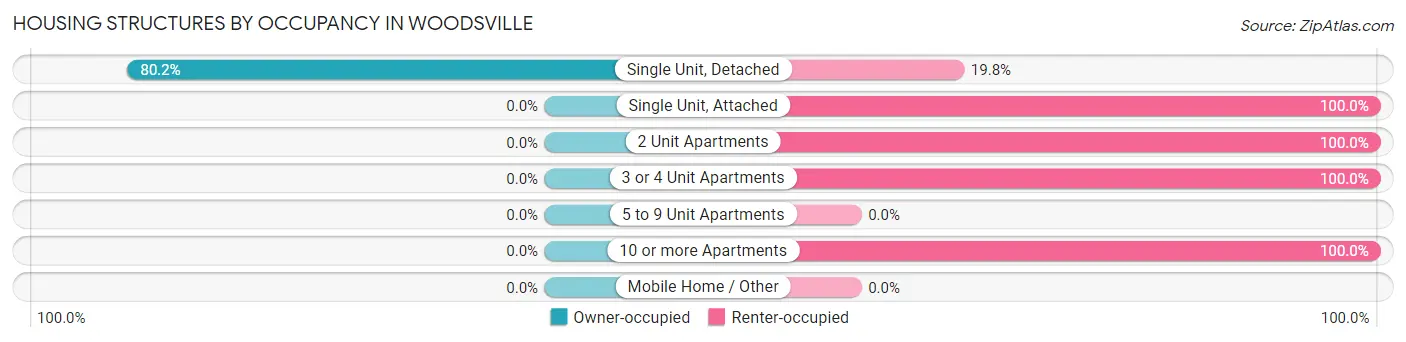
| Structure Type | Owner-occupied | Renter-occupied |
| Single Unit, Detached | 219 (80.2%) | 54 (19.8%) |
| Single Unit, Attached | 0 (0.0%) | 13 (100.0%) |
| 2 Unit Apartments | 0 (0.0%) | 36 (100.0%) |
| 3 or 4 Unit Apartments | 0 (0.0%) | 89 (100.0%) |
| 5 to 9 Unit Apartments | 0 (0.0%) | 0 (0.0%) |
| 10 or more Apartments | 0 (0.0%) | 131 (100.0%) |
| Mobile Home / Other | 0 (0.0%) | 0 (0.0%) |
| Total | 219 (40.4%) | 323 (59.6%) |
Housing Structures by Number of Rooms in Woodsville
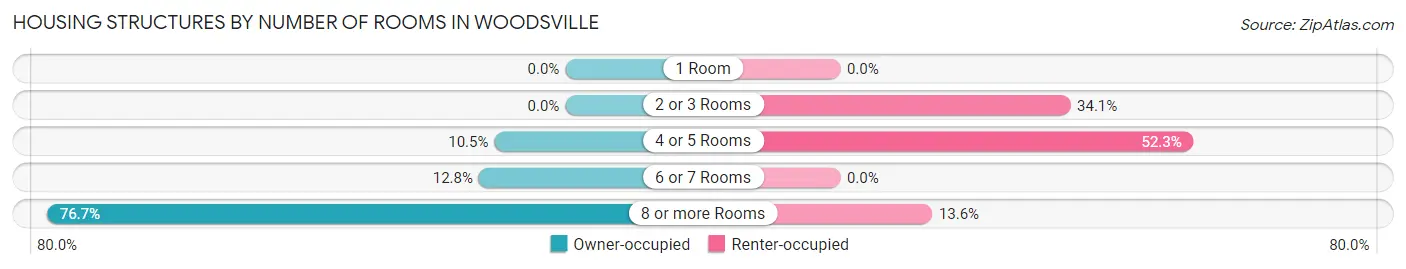
| Number of Rooms | Owner-occupied | Renter-occupied |
| 1 Room | 0 (0.0%) | 0 (0.0%) |
| 2 or 3 Rooms | 0 (0.0%) | 110 (34.1%) |
| 4 or 5 Rooms | 23 (10.5%) | 169 (52.3%) |
| 6 or 7 Rooms | 28 (12.8%) | 0 (0.0%) |
| 8 or more Rooms | 168 (76.7%) | 44 (13.6%) |
| Total | 219 (100.0%) | 323 (100.0%) |
Housing Structure by Heating Type in Woodsville
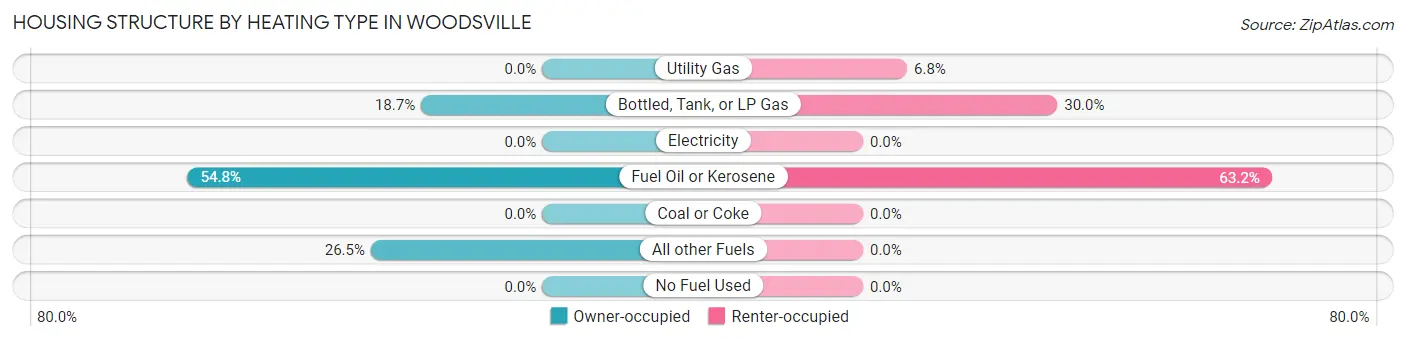
| Heating Type | Owner-occupied | Renter-occupied |
| Utility Gas | 0 (0.0%) | 22 (6.8%) |
| Bottled, Tank, or LP Gas | 41 (18.7%) | 97 (30.0%) |
| Electricity | 0 (0.0%) | 0 (0.0%) |
| Fuel Oil or Kerosene | 120 (54.8%) | 204 (63.2%) |
| Coal or Coke | 0 (0.0%) | 0 (0.0%) |
| All other Fuels | 58 (26.5%) | 0 (0.0%) |
| No Fuel Used | 0 (0.0%) | 0 (0.0%) |
| Total | 219 (100.0%) | 323 (100.0%) |
Household Vehicle Usage in Woodsville
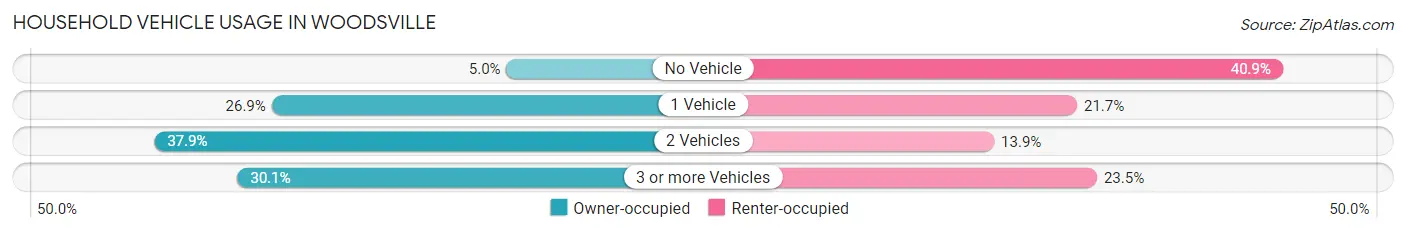
| Vehicles per Household | Owner-occupied | Renter-occupied |
| No Vehicle | 11 (5.0%) | 132 (40.9%) |
| 1 Vehicle | 59 (26.9%) | 70 (21.7%) |
| 2 Vehicles | 83 (37.9%) | 45 (13.9%) |
| 3 or more Vehicles | 66 (30.1%) | 76 (23.5%) |
| Total | 219 (100.0%) | 323 (100.0%) |
Real Estate & Mortgages in Woodsville
Real Estate and Mortgage Overview in Woodsville
| Characteristic | Without Mortgage | With Mortgage |
| Housing Units | 38 | 181 |
| Median Property Value | - | - |
| Median Household Income | - | - |
| Monthly Housing Costs | - | - |
| Real Estate Taxes | - | - |
Property Value by Mortgage Status in Woodsville
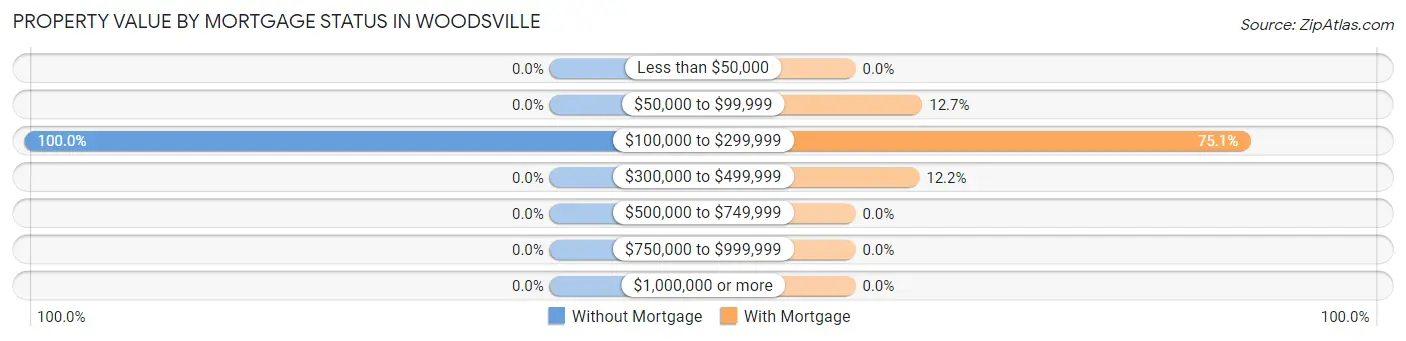
| Property Value | Without Mortgage | With Mortgage |
| Less than $50,000 | 0 (0.0%) | 0 (0.0%) |
| $50,000 to $99,999 | 0 (0.0%) | 23 (12.7%) |
| $100,000 to $299,999 | 38 (100.0%) | 136 (75.1%) |
| $300,000 to $499,999 | 0 (0.0%) | 22 (12.1%) |
| $500,000 to $749,999 | 0 (0.0%) | 0 (0.0%) |
| $750,000 to $999,999 | 0 (0.0%) | 0 (0.0%) |
| $1,000,000 or more | 0 (0.0%) | 0 (0.0%) |
| Total | 38 (100.0%) | 181 (100.0%) |
Household Income by Mortgage Status in Woodsville
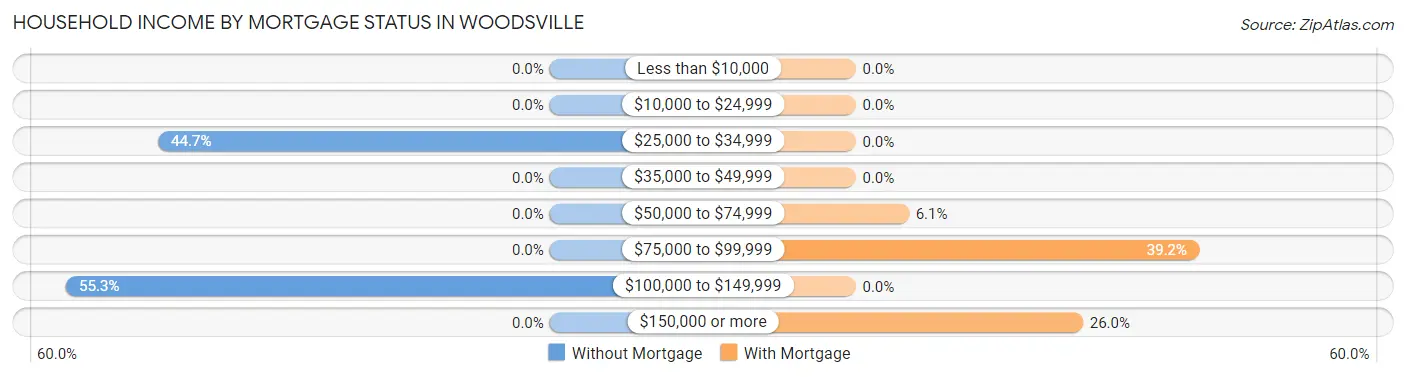
| Household Income | Without Mortgage | With Mortgage |
| Less than $10,000 | 0 (0.0%) | 0 (0.0%) |
| $10,000 to $24,999 | 0 (0.0%) | 0 (0.0%) |
| $25,000 to $34,999 | 17 (44.7%) | 0 (0.0%) |
| $35,000 to $49,999 | 0 (0.0%) | 0 (0.0%) |
| $50,000 to $74,999 | 0 (0.0%) | 11 (6.1%) |
| $75,000 to $99,999 | 0 (0.0%) | 71 (39.2%) |
| $100,000 to $149,999 | 21 (55.3%) | 0 (0.0%) |
| $150,000 or more | 0 (0.0%) | 47 (26.0%) |
| Total | 38 (100.0%) | 181 (100.0%) |
Property Value to Household Income Ratio in Woodsville
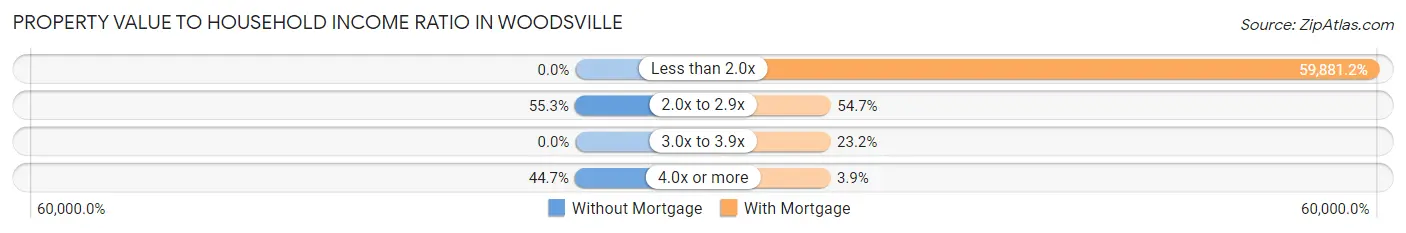
| Value-to-Income Ratio | Without Mortgage | With Mortgage |
| Less than 2.0x | 0 (0.0%) | 108,385 (59,881.2%) |
| 2.0x to 2.9x | 21 (55.3%) | 99 (54.7%) |
| 3.0x to 3.9x | 0 (0.0%) | 42 (23.2%) |
| 4.0x or more | 17 (44.7%) | 7 (3.9%) |
| Total | 38 (100.0%) | 181 (100.0%) |
Real Estate Taxes by Mortgage Status in Woodsville
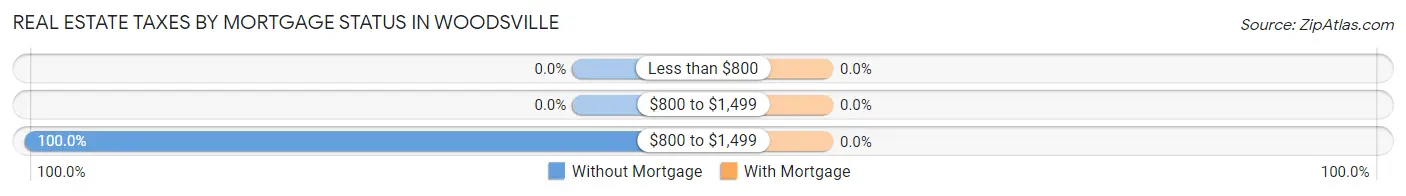
| Property Taxes | Without Mortgage | With Mortgage |
| Less than $800 | 0 (0.0%) | 0 (0.0%) |
| $800 to $1,499 | 0 (0.0%) | 0 (0.0%) |
| $800 to $1,499 | 38 (100.0%) | 0 (0.0%) |
| Total | 38 (100.0%) | 181 (100.0%) |
Health & Disability in Woodsville
Health Insurance Coverage by Age in Woodsville
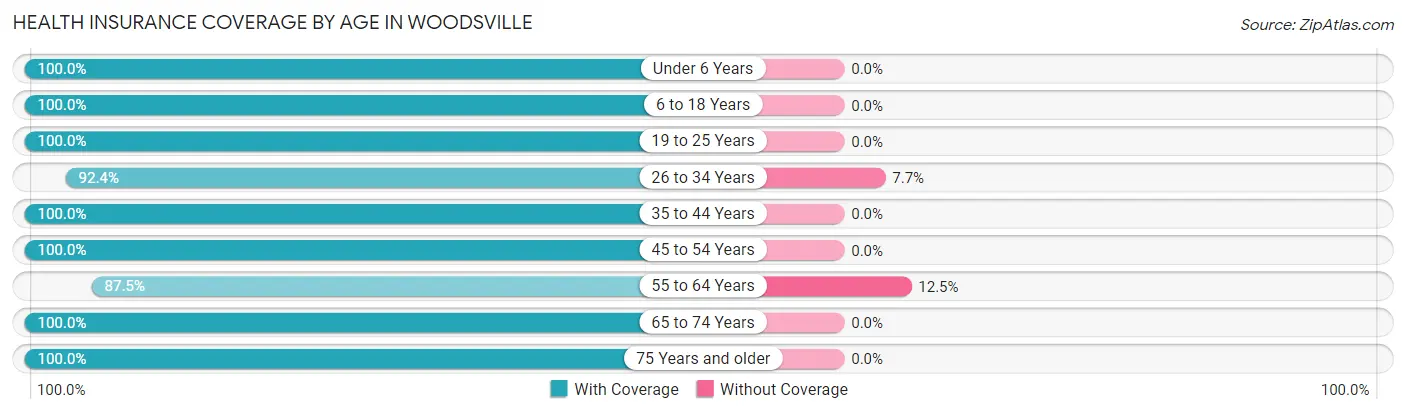
| Age Bracket | With Coverage | Without Coverage |
| Under 6 Years | 131 (100.0%) | 0 (0.0%) |
| 6 to 18 Years | 229 (100.0%) | 0 (0.0%) |
| 19 to 25 Years | 135 (100.0%) | 0 (0.0%) |
| 26 to 34 Years | 169 (92.3%) | 14 (7.6%) |
| 35 to 44 Years | 220 (100.0%) | 0 (0.0%) |
| 45 to 54 Years | 71 (100.0%) | 0 (0.0%) |
| 55 to 64 Years | 147 (87.5%) | 21 (12.5%) |
| 65 to 74 Years | 75 (100.0%) | 0 (0.0%) |
| 75 Years and older | 117 (100.0%) | 0 (0.0%) |
| Total | 1,294 (97.4%) | 35 (2.6%) |
Health Insurance Coverage by Citizenship Status in Woodsville
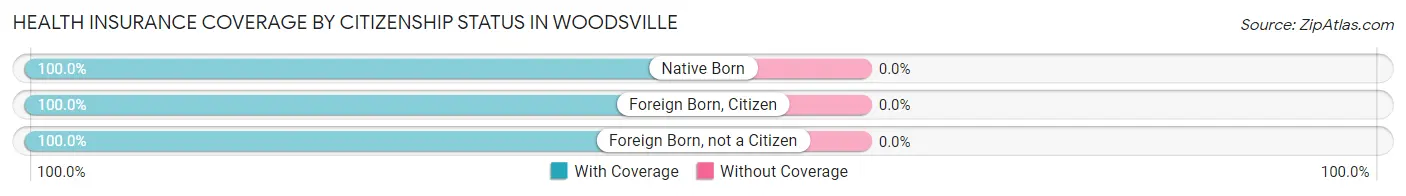
| Citizenship Status | With Coverage | Without Coverage |
| Native Born | 131 (100.0%) | 0 (0.0%) |
| Foreign Born, Citizen | 229 (100.0%) | 0 (0.0%) |
| Foreign Born, not a Citizen | 135 (100.0%) | 0 (0.0%) |
Health Insurance Coverage by Household Income in Woodsville
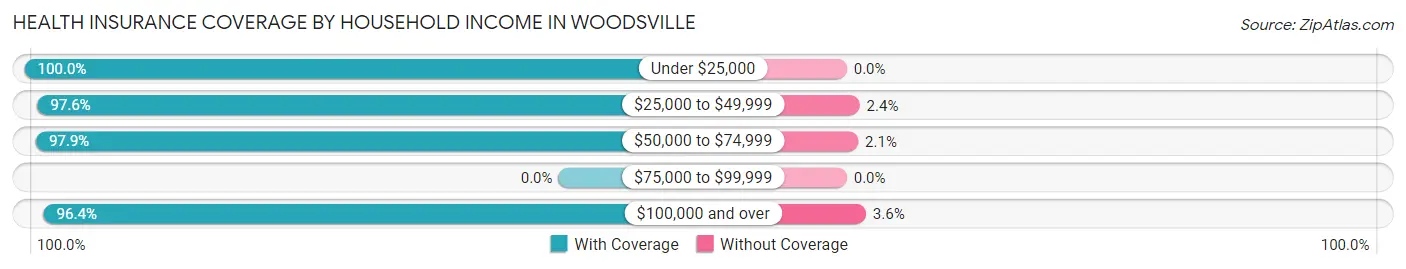
| Household Income | With Coverage | Without Coverage |
| Under $25,000 | 122 (100.0%) | 0 (0.0%) |
| $25,000 to $49,999 | 284 (97.6%) | 7 (2.4%) |
| $50,000 to $74,999 | 322 (97.9%) | 7 (2.1%) |
| $75,000 to $99,999 | 0 (0.0%) | 0 (0.0%) |
| $100,000 and over | 566 (96.4%) | 21 (3.6%) |
Public vs Private Health Insurance Coverage by Age in Woodsville
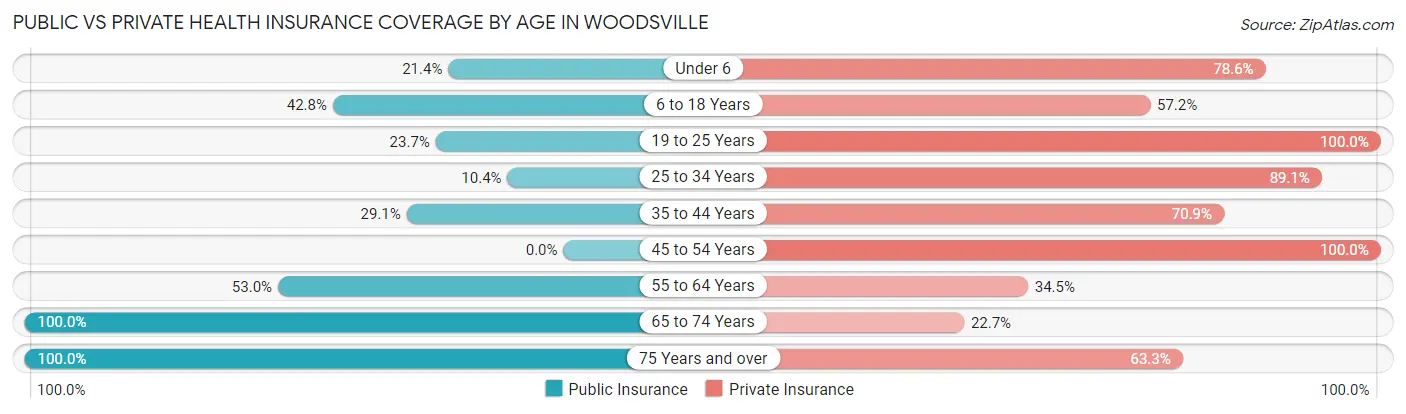
| Age Bracket | Public Insurance | Private Insurance |
| Under 6 | 28 (21.4%) | 103 (78.6%) |
| 6 to 18 Years | 98 (42.8%) | 131 (57.2%) |
| 19 to 25 Years | 32 (23.7%) | 135 (100.0%) |
| 25 to 34 Years | 19 (10.4%) | 163 (89.1%) |
| 35 to 44 Years | 64 (29.1%) | 156 (70.9%) |
| 45 to 54 Years | 0 (0.0%) | 71 (100.0%) |
| 55 to 64 Years | 89 (53.0%) | 58 (34.5%) |
| 65 to 74 Years | 75 (100.0%) | 17 (22.7%) |
| 75 Years and over | 117 (100.0%) | 74 (63.2%) |
| Total | 522 (39.3%) | 908 (68.3%) |
Disability Status by Sex by Age in Woodsville
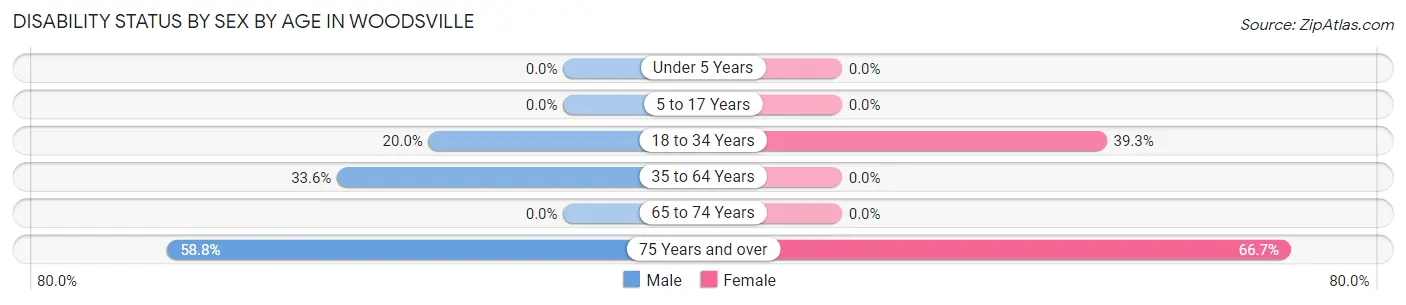
| Age Bracket | Male | Female |
| Under 5 Years | 0 (0.0%) | 0 (0.0%) |
| 5 to 17 Years | 0 (0.0%) | 0 (0.0%) |
| 18 to 34 Years | 39 (20.0%) | 57 (39.3%) |
| 35 to 64 Years | 89 (33.6%) | 0 (0.0%) |
| 65 to 74 Years | 0 (0.0%) | 0 (0.0%) |
| 75 Years and over | 30 (58.8%) | 44 (66.7%) |
Disability Class by Sex by Age in Woodsville
Disability Class: Hearing Difficulty
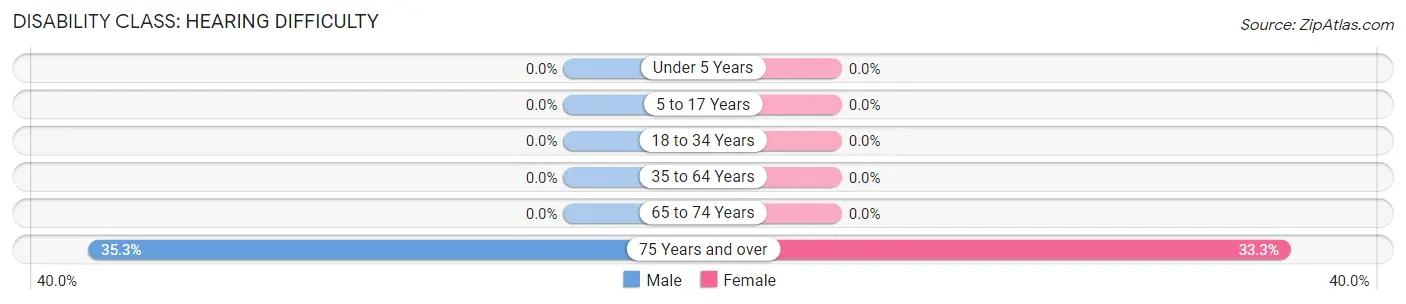
| Age Bracket | Male | Female |
| Under 5 Years | 0 (0.0%) | 0 (0.0%) |
| 5 to 17 Years | 0 (0.0%) | 0 (0.0%) |
| 18 to 34 Years | 0 (0.0%) | 0 (0.0%) |
| 35 to 64 Years | 0 (0.0%) | 0 (0.0%) |
| 65 to 74 Years | 0 (0.0%) | 0 (0.0%) |
| 75 Years and over | 18 (35.3%) | 22 (33.3%) |
Disability Class: Vision Difficulty
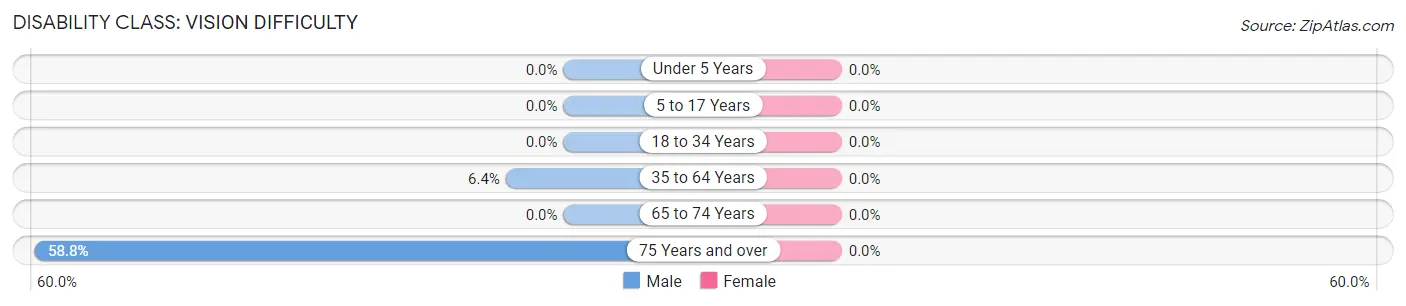
| Age Bracket | Male | Female |
| Under 5 Years | 0 (0.0%) | 0 (0.0%) |
| 5 to 17 Years | 0 (0.0%) | 0 (0.0%) |
| 18 to 34 Years | 0 (0.0%) | 0 (0.0%) |
| 35 to 64 Years | 17 (6.4%) | 0 (0.0%) |
| 65 to 74 Years | 0 (0.0%) | 0 (0.0%) |
| 75 Years and over | 30 (58.8%) | 0 (0.0%) |
Disability Class: Cognitive Difficulty

| Age Bracket | Male | Female |
| 5 to 17 Years | 0 (0.0%) | 0 (0.0%) |
| 18 to 34 Years | 39 (20.0%) | 57 (39.3%) |
| 35 to 64 Years | 0 (0.0%) | 0 (0.0%) |
| 65 to 74 Years | 0 (0.0%) | 0 (0.0%) |
| 75 Years and over | 0 (0.0%) | 0 (0.0%) |
Disability Class: Ambulatory Difficulty
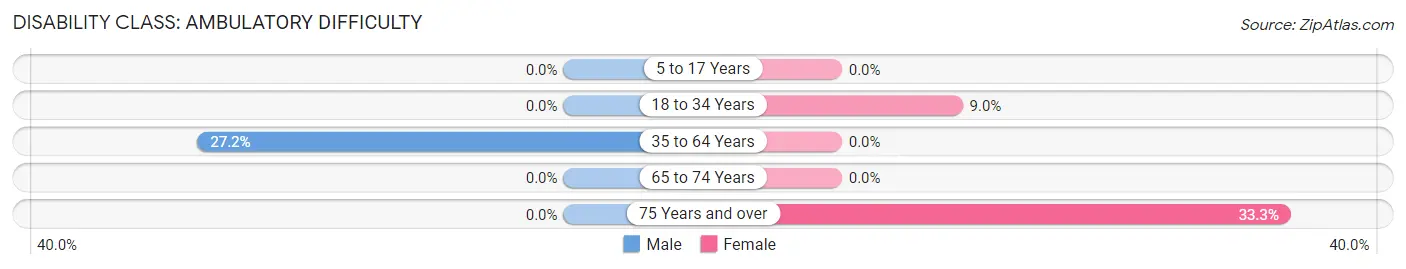
| Age Bracket | Male | Female |
| 5 to 17 Years | 0 (0.0%) | 0 (0.0%) |
| 18 to 34 Years | 0 (0.0%) | 13 (9.0%) |
| 35 to 64 Years | 72 (27.2%) | 0 (0.0%) |
| 65 to 74 Years | 0 (0.0%) | 0 (0.0%) |
| 75 Years and over | 0 (0.0%) | 22 (33.3%) |
Disability Class: Self-Care Difficulty
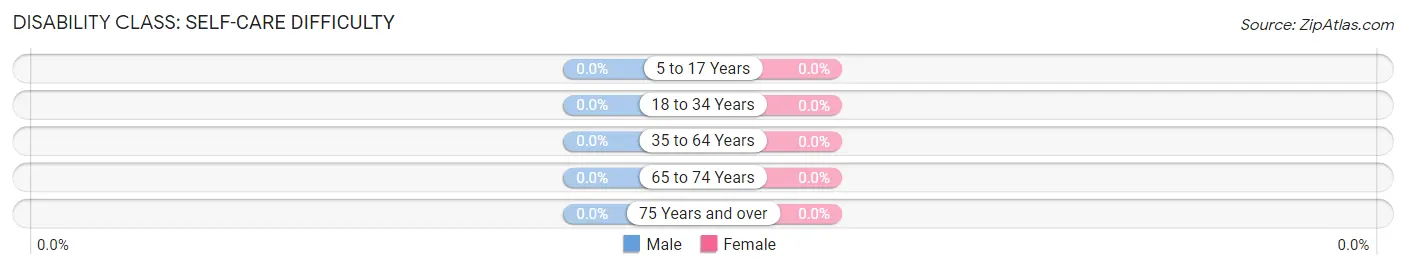
| Age Bracket | Male | Female |
| 5 to 17 Years | 0 (0.0%) | 0 (0.0%) |
| 18 to 34 Years | 0 (0.0%) | 0 (0.0%) |
| 35 to 64 Years | 0 (0.0%) | 0 (0.0%) |
| 65 to 74 Years | 0 (0.0%) | 0 (0.0%) |
| 75 Years and over | 0 (0.0%) | 0 (0.0%) |
Technology Access in Woodsville
Computing Device Access in Woodsville
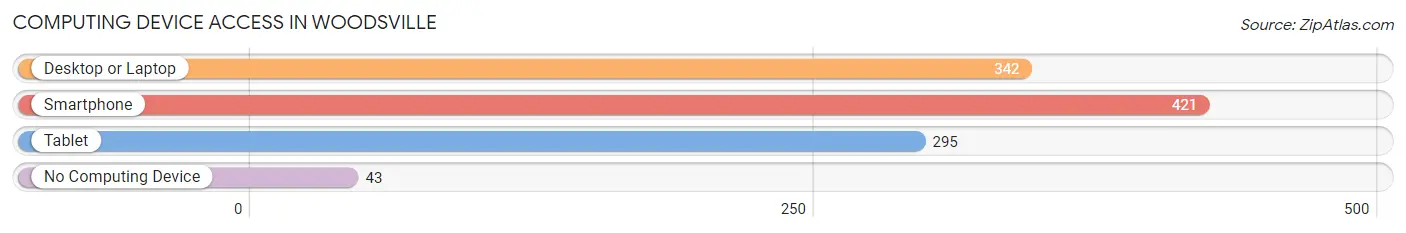
| Device Type | # Households | % Households |
| Desktop or Laptop | 342 | 63.1% |
| Smartphone | 421 | 77.7% |
| Tablet | 295 | 54.4% |
| No Computing Device | 43 | 7.9% |
| Total | 542 | 100.0% |
Internet Access in Woodsville
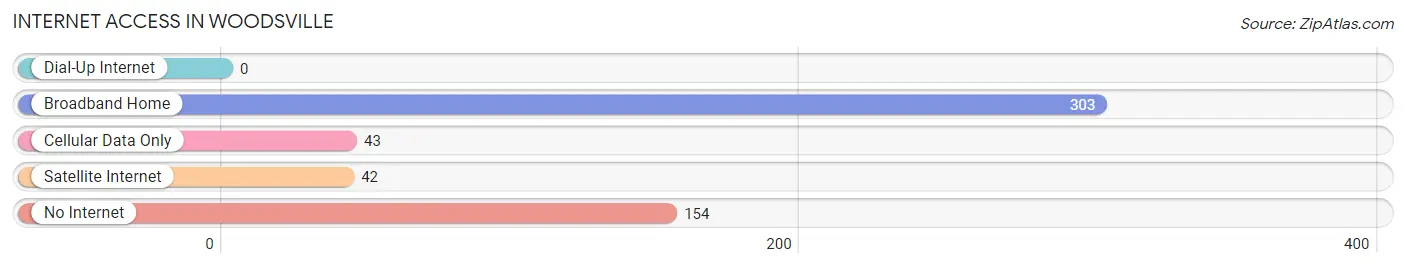
| Internet Type | # Households | % Households |
| Dial-Up Internet | 0 | 0.0% |
| Broadband Home | 303 | 55.9% |
| Cellular Data Only | 43 | 7.9% |
| Satellite Internet | 42 | 7.7% |
| No Internet | 154 | 28.4% |
| Total | 542 | 100.0% |
Woodsville Summary
Woodsville is a small town located in Grafton County, New Hampshire, United States. It is situated on the Connecticut River, which forms the border between New Hampshire and Vermont. The town was incorporated in 1799 and has a population of 1,717 as of the 2010 census.
Geography
Woodsville is located at the junction of the Connecticut River and the Ammonoosuc River. The town is situated in the White Mountains region of New Hampshire and is bordered by the towns of Haverhill to the north, Bath to the east, and Lisbon to the south. The town has a total area of 8.2 square miles, of which 8.1 square miles is land and 0.1 square miles is water.
History
The area that is now Woodsville was originally inhabited by the Abenaki Native American tribe. The first European settlers arrived in the area in the late 1700s and the town was incorporated in 1799. The town was named after the Woods family, who were among the first settlers.
In the 19th century, the town was an important stop on the stagecoach route between Boston and Montreal. The town was also a major lumbering center, with several sawmills located along the Connecticut River.
Economy
The economy of Woodsville is largely based on tourism and services. The town is home to several small businesses, including restaurants, shops, and lodging. The town is also home to a number of manufacturing companies, including a paper mill and a woodworking factory.
Demographics
As of the 2010 census, there were 1,717 people, 745 households, and 463 families residing in the town. The population density was 211.2 people per square mile. The racial makeup of the town was 97.2% White, 0.5% African American, 0.2% Native American, 0.3% Asian, 0.1% Pacific Islander, 0.4% from other races, and 1.3% from two or more races. Hispanic or Latino of any race were 1.2% of the population.
The median income for a household in the town was $41,250, and the median income for a family was $50,000. The per capita income for the town was $20,945. About 8.3% of families and 11.2% of the population were below the poverty line, including 15.2% of those under age 18 and 8.2% of those age 65 or over.
Conclusion
Woodsville is a small town located in Grafton County, New Hampshire, United States. It is situated on the Connecticut River, which forms the border between New Hampshire and Vermont. The town was incorporated in 1799 and has a population of 1,717 as of the 2010 census. The economy of Woodsville is largely based on tourism and services, and the town is home to several small businesses, including restaurants, shops, and lodging. The median income for a household in the town was $41,250, and the median income for a family was $50,000. Woodsville is a small but vibrant town with a rich history and a bright future.
Common Questions
What is Per Capita Income in Woodsville?
Per Capita income in Woodsville is $33,195.
What is the Median Family Income in Woodsville?
Median Family Income in Woodsville is $109,761.
What is the Median Household income in Woodsville?
Median Household Income in Woodsville is $53,578.
What is Income or Wage Gap in Woodsville?
Income or Wage Gap in Woodsville is 11.6%.
Women in Woodsville earn 88.4 cents for every dollar earned by a man.
What is Inequality or Gini Index in Woodsville?
Inequality or Gini Index in Woodsville is 0.43.
What is the Total Population of Woodsville?
Total Population of Woodsville is 1,329.
What is the Total Male Population of Woodsville?
Total Male Population of Woodsville is 673.
What is the Total Female Population of Woodsville?
Total Female Population of Woodsville is 656.
What is the Ratio of Males per 100 Females in Woodsville?
There are 102.59 Males per 100 Females in Woodsville.
What is the Ratio of Females per 100 Males in Woodsville?
There are 97.47 Females per 100 Males in Woodsville.
What is the Median Population Age in Woodsville?
Median Population Age in Woodsville is 30.9 Years.
What is the Average Family Size in Woodsville
Average Family Size in Woodsville is 3.6 People.
What is the Average Household Size in Woodsville
Average Household Size in Woodsville is 2.5 People.
How Large is the Labor Force in Woodsville?
There are 638 People in the Labor Forcein in Woodsville.
What is the Percentage of People in the Labor Force in Woodsville?
64.4% of People are in the Labor Force in Woodsville.
What is the Unemployment Rate in Woodsville?
Unemployment Rate in Woodsville is 2.8%.