North Conway, NH Map & Demographics
North Conway Map
North Conway Overview
$46,610
PER CAPITA INCOME
$66,776
AVG FAMILY INCOME
$59,041
AVG HOUSEHOLD INCOME
0.57
INEQUALITY / GINI INDEX
2,079
TOTAL POPULATION
1,127
MALE POPULATION
952
FEMALE POPULATION
118.38
MALES / 100 FEMALES
84.47
FEMALES / 100 MALES
57.1
MEDIAN AGE
2.6
AVG FAMILY SIZE
1.7
AVG HOUSEHOLD SIZE
1,272
LABOR FORCE [ PEOPLE ]
68.4%
PERCENT IN LABOR FORCE
5.2%
UNEMPLOYMENT RATE
North Conway Zip Codes
North Conway Area Codes
Income in North Conway
Income Overview in North Conway
Per Capita Income in North Conway is $46,610, while median incomes of families and households are $66,776 and $59,041 respectively.
| Characteristic | Number | Measure |
| Per Capita Income | 2,079 | $46,610 |
| Median Family Income | 419 | $66,776 |
| Mean Family Income | 419 | $62,696 |
| Median Household Income | 1,141 | $59,041 |
| Mean Household Income | 1,141 | $80,453 |
| Income Deficit | 419 | $0 |
| Wage / Income Gap (%) | 2,079 | 0.00% |
| Wage / Income Gap ($) | 2,079 | 100.00¢ per $1 |
| Gini / Inequality Index | 2,079 | 0.57 |
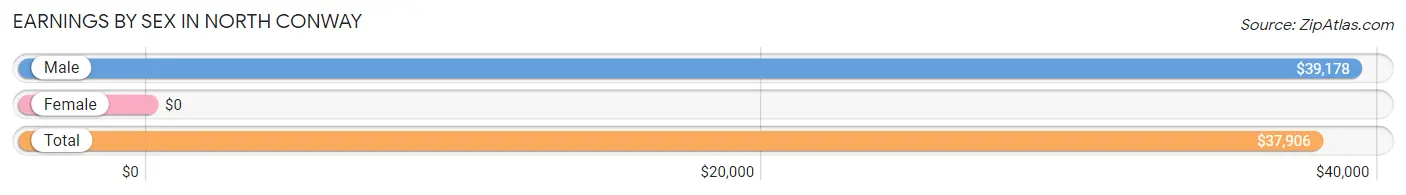
Earnings by Sex in North Conway
| Sex | Number | Average Earnings |
| Male | 690 (54.8%) | $39,178 |
| Female | 568 (45.2%) | $0 |
| Total | 1,258 (100.0%) | $37,906 |
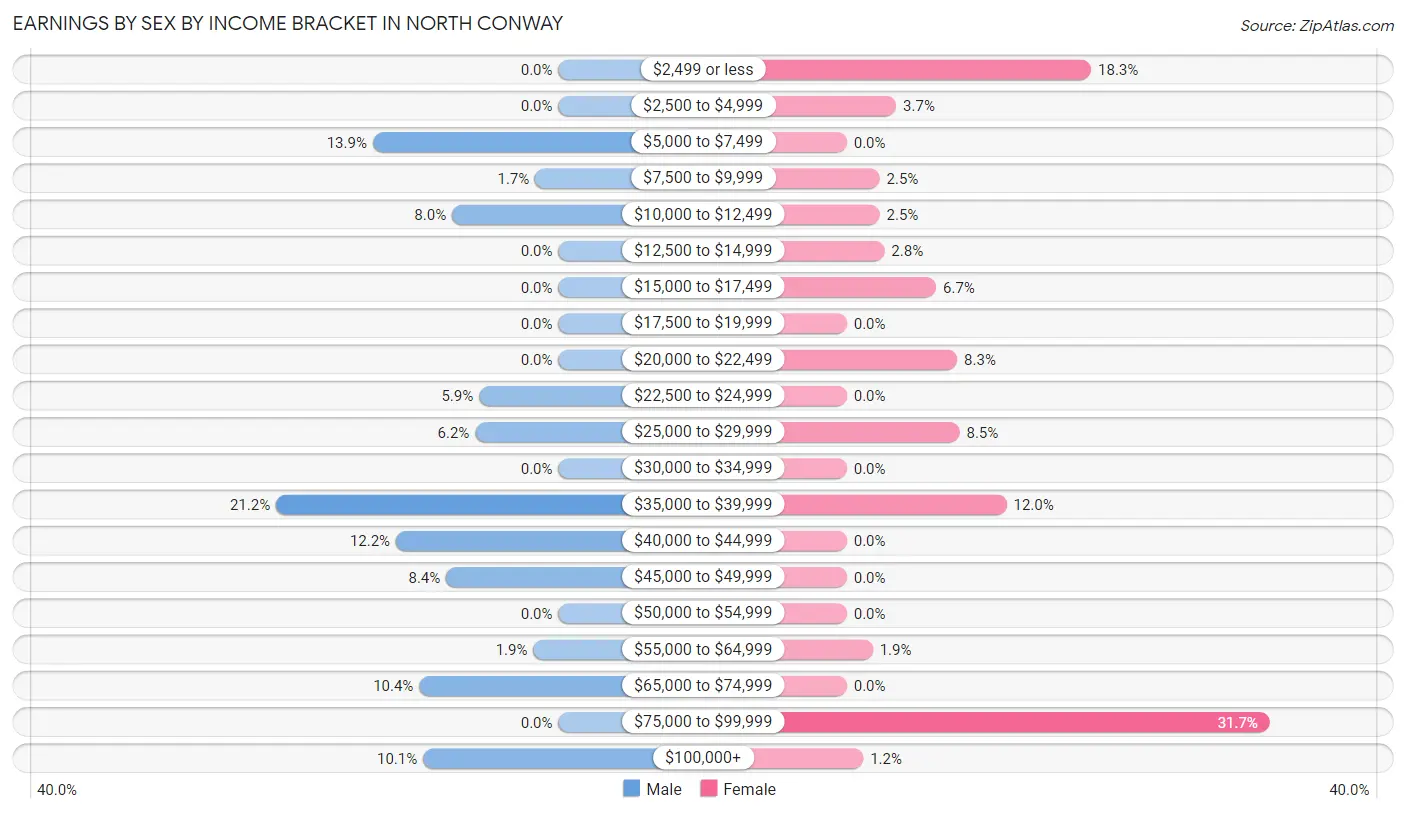
Earnings by Sex by Income Bracket in North Conway
The most common earnings brackets in North Conway are $35,000 to $39,999 for men (146 | 21.2%) and $75,000 to $99,999 for women (180 | 31.7%).
| Income | Male | Female |
| $2,499 or less | 0 (0.0%) | 104 (18.3%) |
| $2,500 to $4,999 | 0 (0.0%) | 21 (3.7%) |
| $5,000 to $7,499 | 96 (13.9%) | 0 (0.0%) |
| $7,500 to $9,999 | 12 (1.7%) | 14 (2.5%) |
| $10,000 to $12,499 | 55 (8.0%) | 14 (2.5%) |
| $12,500 to $14,999 | 0 (0.0%) | 16 (2.8%) |
| $15,000 to $17,499 | 0 (0.0%) | 38 (6.7%) |
| $17,500 to $19,999 | 0 (0.0%) | 0 (0.0%) |
| $20,000 to $22,499 | 0 (0.0%) | 47 (8.3%) |
| $22,500 to $24,999 | 41 (5.9%) | 0 (0.0%) |
| $25,000 to $29,999 | 43 (6.2%) | 48 (8.5%) |
| $30,000 to $34,999 | 0 (0.0%) | 0 (0.0%) |
| $35,000 to $39,999 | 146 (21.2%) | 68 (12.0%) |
| $40,000 to $44,999 | 84 (12.2%) | 0 (0.0%) |
| $45,000 to $49,999 | 58 (8.4%) | 0 (0.0%) |
| $50,000 to $54,999 | 0 (0.0%) | 0 (0.0%) |
| $55,000 to $64,999 | 13 (1.9%) | 11 (1.9%) |
| $65,000 to $74,999 | 72 (10.4%) | 0 (0.0%) |
| $75,000 to $99,999 | 0 (0.0%) | 180 (31.7%) |
| $100,000+ | 70 (10.1%) | 7 (1.2%) |
| Total | 690 (100.0%) | 568 (100.0%) |
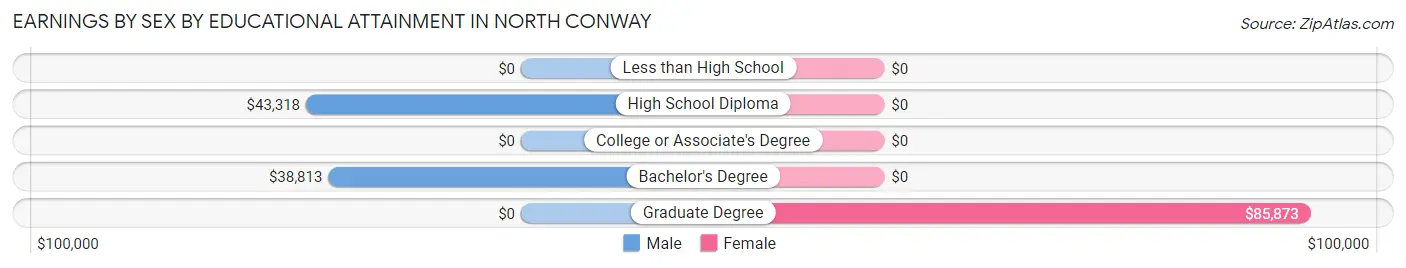
Earnings by Sex by Educational Attainment in North Conway
| Educational Attainment | Male Income | Female Income |
| Less than High School | - | - |
| High School Diploma | $43,318 | $0 |
| College or Associate's Degree | - | - |
| Bachelor's Degree | $38,813 | $0 |
| Graduate Degree | - | - |
| Total | $39,615 | $0 |
Family Income in North Conway
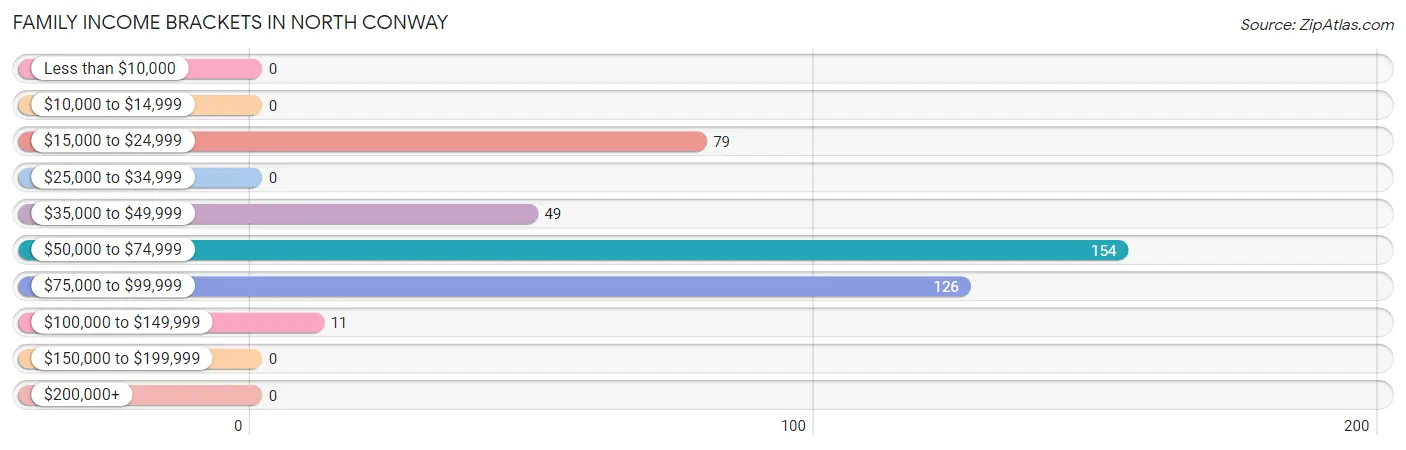
Family Income Brackets in North Conway
According to the North Conway family income data, there are 154 families falling into the $50,000 to $74,999 income range, which is the most common income bracket and makes up 36.7% of all families.
| Income Bracket | # Families | % Families |
| Less than $10,000 | 0 | 0.0% |
| $10,000 to $14,999 | 0 | 0.0% |
| $15,000 to $24,999 | 79 | 18.9% |
| $25,000 to $34,999 | 0 | 0.0% |
| $35,000 to $49,999 | 49 | 11.7% |
| $50,000 to $74,999 | 154 | 36.8% |
| $75,000 to $99,999 | 126 | 30.1% |
| $100,000 to $149,999 | 11 | 2.6% |
| $150,000 to $199,999 | 0 | 0.0% |
| $200,000+ | 0 | 0.0% |
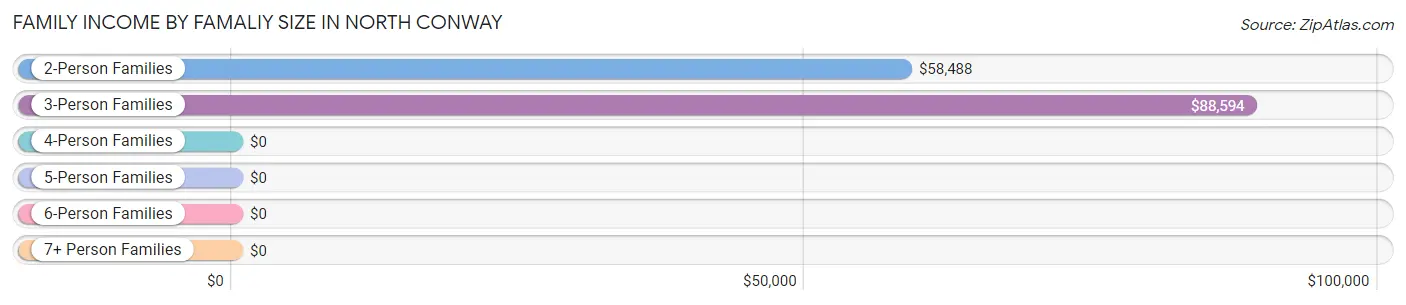
Family Income by Famaliy Size in North Conway
3-person families (40 | 9.6%) account for the highest median family income in North Conway with $88,594 per family, while 3-person families (40 | 9.6%) have the highest median income of $29,531 per family member.
| Income Bracket | # Families | Median Income |
| 2-Person Families | 290 (69.2%) | $58,488 |
| 3-Person Families | 40 (9.6%) | $88,594 |
| 4-Person Families | 25 (6.0%) | $0 |
| 5-Person Families | 64 (15.3%) | $0 |
| 6-Person Families | 0 (0.0%) | $0 |
| 7+ Person Families | 0 (0.0%) | $0 |
| Total | 419 (100.0%) | $66,776 |
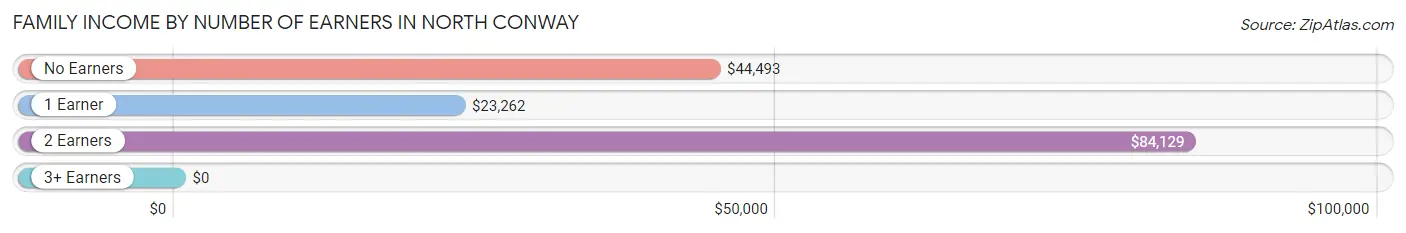
Family Income by Number of Earners in North Conway
| Number of Earners | # Families | Median Income |
| No Earners | 59 (14.1%) | $44,493 |
| 1 Earner | 101 (24.1%) | $23,262 |
| 2 Earners | 205 (48.9%) | $84,129 |
| 3+ Earners | 54 (12.9%) | $0 |
| Total | 419 (100.0%) | $66,776 |
Household Income in North Conway
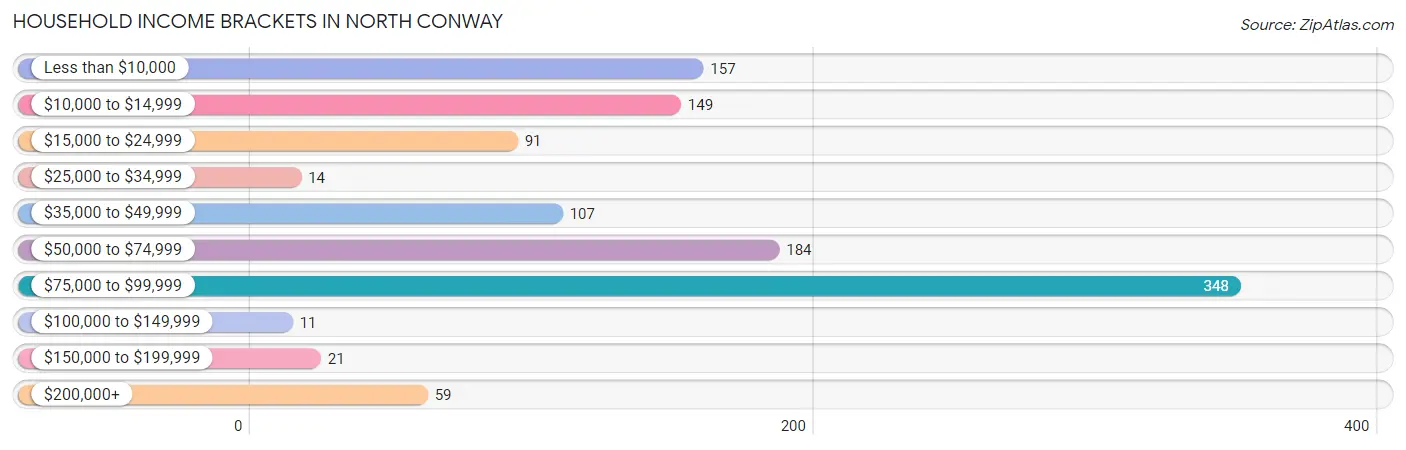
Household Income Brackets in North Conway
With 348 households falling in the category, the $75,000 to $99,999 income range is the most frequent in North Conway, accounting for 30.5% of all households. In contrast, only 11 households (1.0%) fall into the $100,000 to $149,999 income bracket, making it the least populous group.
| Income Bracket | # Households | % Households |
| Less than $10,000 | 157 | 13.8% |
| $10,000 to $14,999 | 149 | 13.1% |
| $15,000 to $24,999 | 91 | 8.0% |
| $25,000 to $34,999 | 14 | 1.2% |
| $35,000 to $49,999 | 107 | 9.4% |
| $50,000 to $74,999 | 184 | 16.1% |
| $75,000 to $99,999 | 348 | 30.5% |
| $100,000 to $149,999 | 11 | 1.0% |
| $150,000 to $199,999 | 21 | 1.8% |
| $200,000+ | 59 | 5.2% |
Household Income by Householder Age in North Conway
The median household income in North Conway is $59,041, with the highest median household income of $66,281 found in the 25 to 44 years age bracket for the primary householder. A total of 277 households (24.3%) fall into this category.
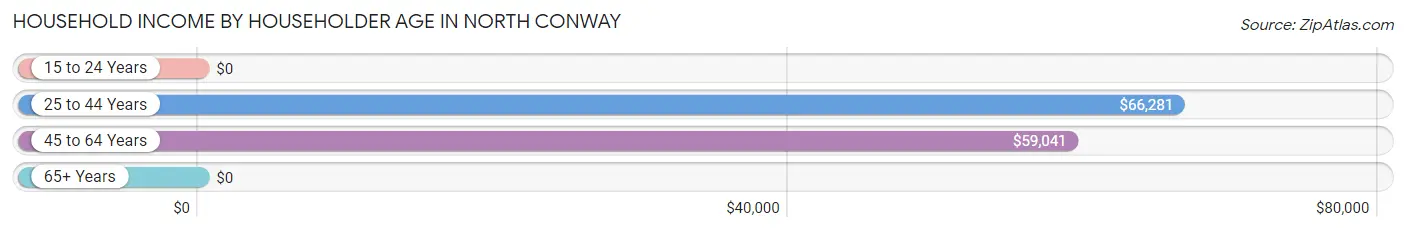
| Income Bracket | # Households | Median Income |
| 15 to 24 Years | 0 (0.0%) | $0 |
| 25 to 44 Years | 277 (24.3%) | $66,281 |
| 45 to 64 Years | 507 (44.4%) | $59,041 |
| 65+ Years | 357 (31.3%) | $0 |
| Total | 1,141 (100.0%) | $59,041 |
Poverty in North Conway
Income Below Poverty by Sex and Age in North Conway
With 24.5% poverty level for males and 18.6% for females among the residents of North Conway, 65 to 74 year old males and 5 year old females are the most vulnerable to poverty, with 84 males (100.0%) and 37 females (82.2%) in their respective age groups living below the poverty level.
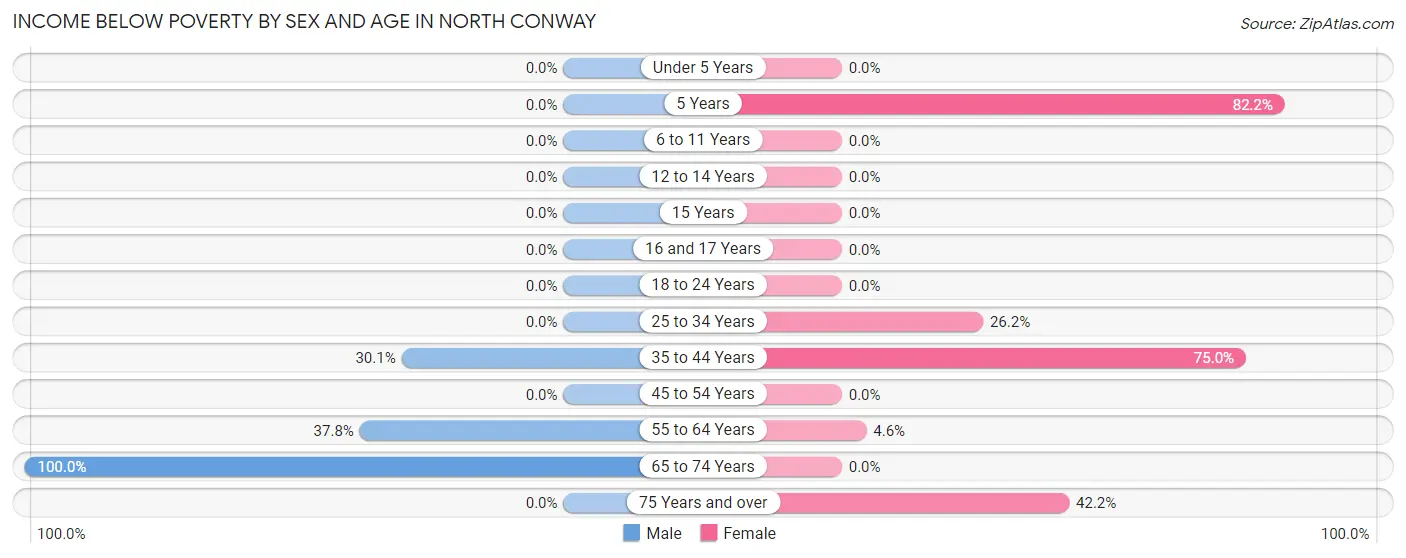
| Age Bracket | Male | Female |
| Under 5 Years | 0 (0.0%) | 0 (0.0%) |
| 5 Years | 0 (0.0%) | 37 (82.2%) |
| 6 to 11 Years | 0 (0.0%) | 0 (0.0%) |
| 12 to 14 Years | 0 (0.0%) | 0 (0.0%) |
| 15 Years | 0 (0.0%) | 0 (0.0%) |
| 16 and 17 Years | 0 (0.0%) | 0 (0.0%) |
| 18 to 24 Years | 0 (0.0%) | 0 (0.0%) |
| 25 to 34 Years | 0 (0.0%) | 38 (26.2%) |
| 35 to 44 Years | 55 (30.0%) | 30 (75.0%) |
| 45 to 54 Years | 0 (0.0%) | 0 (0.0%) |
| 55 to 64 Years | 121 (37.8%) | 9 (4.5%) |
| 65 to 74 Years | 84 (100.0%) | 0 (0.0%) |
| 75 Years and over | 0 (0.0%) | 54 (42.2%) |
| Total | 260 (24.5%) | 168 (18.6%) |
Income Above Poverty by Sex and Age in North Conway
According to the poverty statistics in North Conway, males aged under 5 years and females aged under 5 years are the age groups that are most secure financially, with 100.0% of males and 100.0% of females in these age groups living above the poverty line.
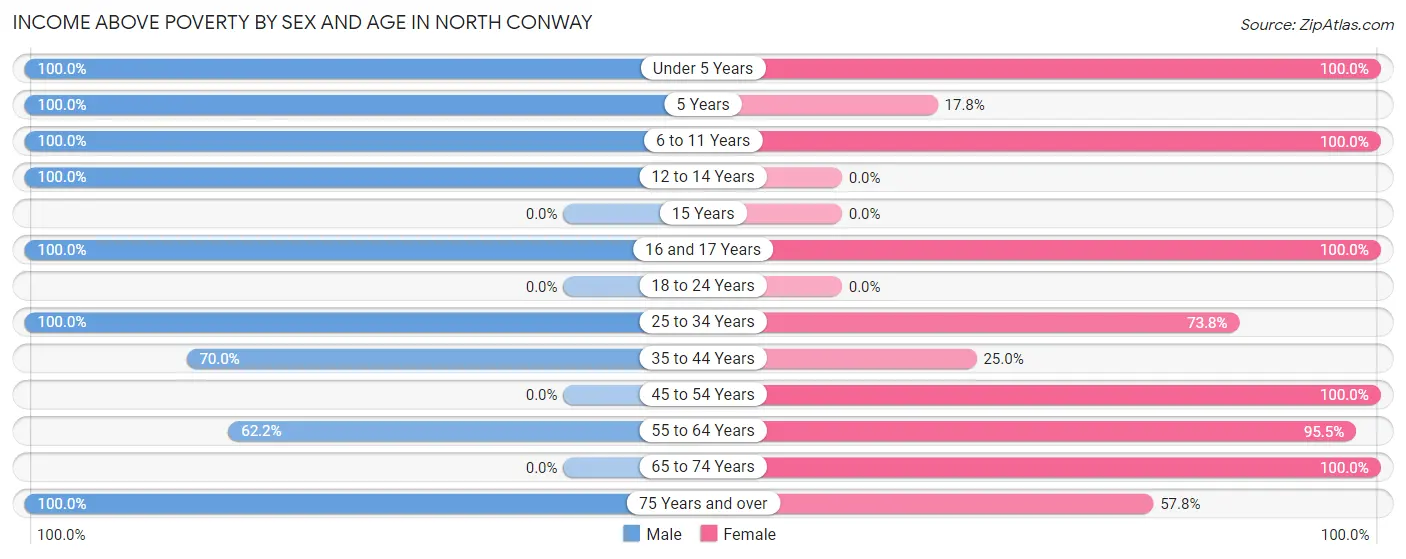
| Age Bracket | Male | Female |
| Under 5 Years | 11 (100.0%) | 10 (100.0%) |
| 5 Years | 23 (100.0%) | 8 (17.8%) |
| 6 to 11 Years | 7 (100.0%) | 12 (100.0%) |
| 12 to 14 Years | 112 (100.0%) | 0 (0.0%) |
| 15 Years | 0 (0.0%) | 0 (0.0%) |
| 16 and 17 Years | 51 (100.0%) | 61 (100.0%) |
| 18 to 24 Years | 0 (0.0%) | 0 (0.0%) |
| 25 to 34 Years | 212 (100.0%) | 107 (73.8%) |
| 35 to 44 Years | 128 (70.0%) | 10 (25.0%) |
| 45 to 54 Years | 0 (0.0%) | 98 (100.0%) |
| 55 to 64 Years | 199 (62.2%) | 189 (95.5%) |
| 65 to 74 Years | 0 (0.0%) | 164 (100.0%) |
| 75 Years and over | 56 (100.0%) | 74 (57.8%) |
| Total | 799 (75.4%) | 733 (81.4%) |
Income Below Poverty Among Married-Couple Families in North Conway
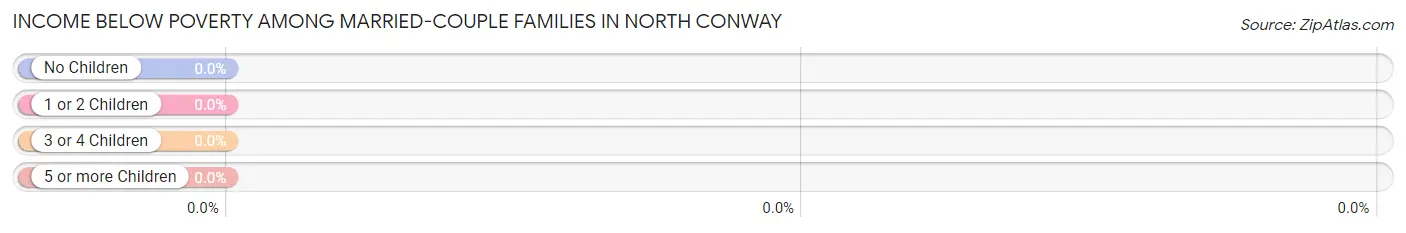
| Children | Above Poverty | Below Poverty |
| No Children | 171 (100.0%) | 0 (0.0%) |
| 1 or 2 Children | 24 (100.0%) | 0 (0.0%) |
| 3 or 4 Children | 10 (100.0%) | 0 (0.0%) |
| 5 or more Children | 0 (0.0%) | 0 (0.0%) |
| Total | 205 (100.0%) | 0 (0.0%) |
Income Below Poverty Among Single-Parent Households in North Conway
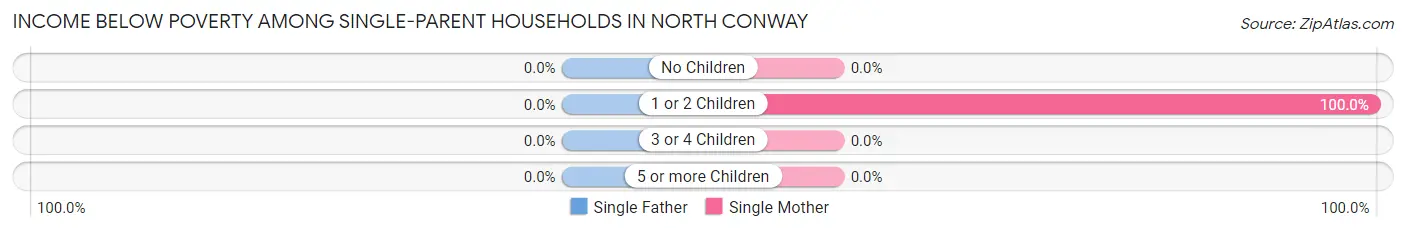
| Children | Single Father | Single Mother |
| No Children | 0 (0.0%) | 0 (0.0%) |
| 1 or 2 Children | 0 (0.0%) | 38 (100.0%) |
| 3 or 4 Children | 0 (0.0%) | 0 (0.0%) |
| 5 or more Children | 0 (0.0%) | 0 (0.0%) |
| Total | 0 (0.0%) | 38 (24.4%) |
Income Below Poverty Among Married-Couple vs Single-Parent Households in North Conway
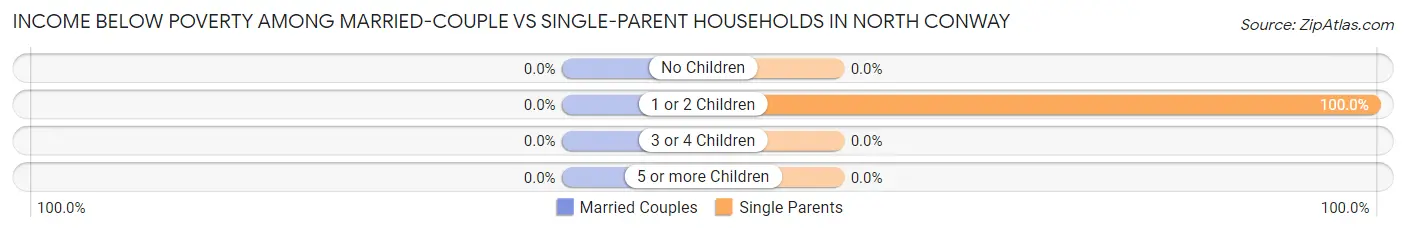
| Children | Married-Couple Families | Single-Parent Households |
| No Children | 0 (0.0%) | 0 (0.0%) |
| 1 or 2 Children | 0 (0.0%) | 38 (100.0%) |
| 3 or 4 Children | 0 (0.0%) | 0 (0.0%) |
| 5 or more Children | 0 (0.0%) | 0 (0.0%) |
| Total | 0 (0.0%) | 38 (17.8%) |
Race in North Conway
The most populous races in North Conway are White / Caucasian (1,946 | 93.6%), Two or more Races (67 | 3.2%), and Asian (66 | 3.2%).
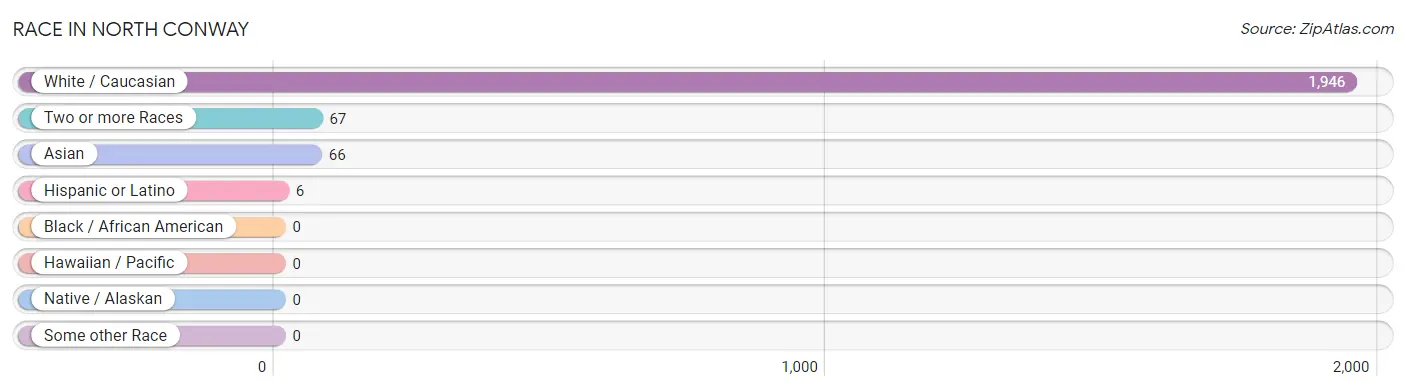
| Race | # Population | % Population |
| Asian | 66 | 3.2% |
| Black / African American | 0 | 0.0% |
| Hawaiian / Pacific | 0 | 0.0% |
| Hispanic or Latino | 6 | 0.3% |
| Native / Alaskan | 0 | 0.0% |
| White / Caucasian | 1,946 | 93.6% |
| Two or more Races | 67 | 3.2% |
| Some other Race | 0 | 0.0% |
| Total | 2,079 | 100.0% |
Ancestry in North Conway
The most populous ancestries reported in North Conway are Irish (596 | 28.7%), English (390 | 18.8%), Italian (309 | 14.9%), French Canadian (215 | 10.3%), and German (148 | 7.1%), together accounting for 79.8% of all North Conway residents.
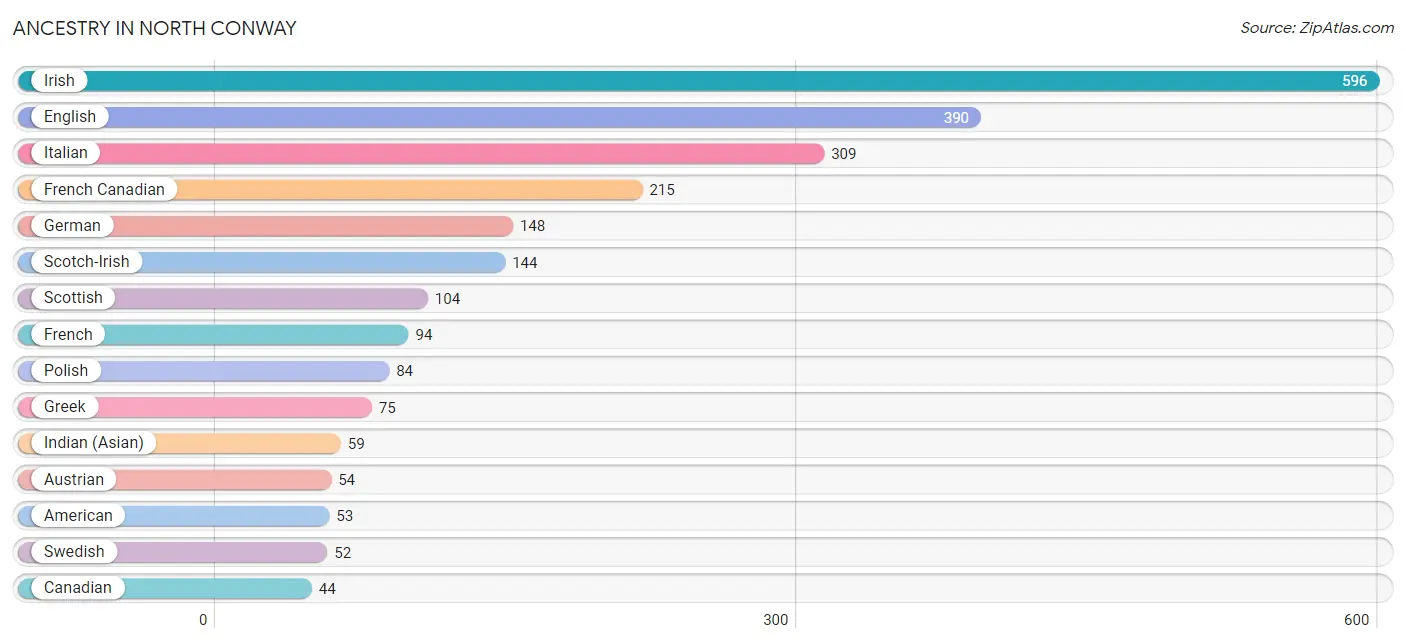
| Ancestry | # Population | % Population |
| American | 53 | 2.5% |
| Armenian | 12 | 0.6% |
| Austrian | 54 | 2.6% |
| Belgian | 4 | 0.2% |
| Brazilian | 14 | 0.7% |
| Burmese | 7 | 0.3% |
| Canadian | 44 | 2.1% |
| Eastern European | 33 | 1.6% |
| English | 390 | 18.8% |
| European | 27 | 1.3% |
| French | 94 | 4.5% |
| French Canadian | 215 | 10.3% |
| German | 148 | 7.1% |
| Greek | 75 | 3.6% |
| Indian (Asian) | 59 | 2.8% |
| Irish | 596 | 28.7% |
| Italian | 309 | 14.9% |
| Mexican | 6 | 0.3% |
| Polish | 84 | 4.0% |
| Portuguese | 9 | 0.4% |
| Scotch-Irish | 144 | 6.9% |
| Scottish | 104 | 5.0% |
| Swedish | 52 | 2.5% |
| Welsh | 6 | 0.3% | View All 24 Rows |
Immigrants in North Conway
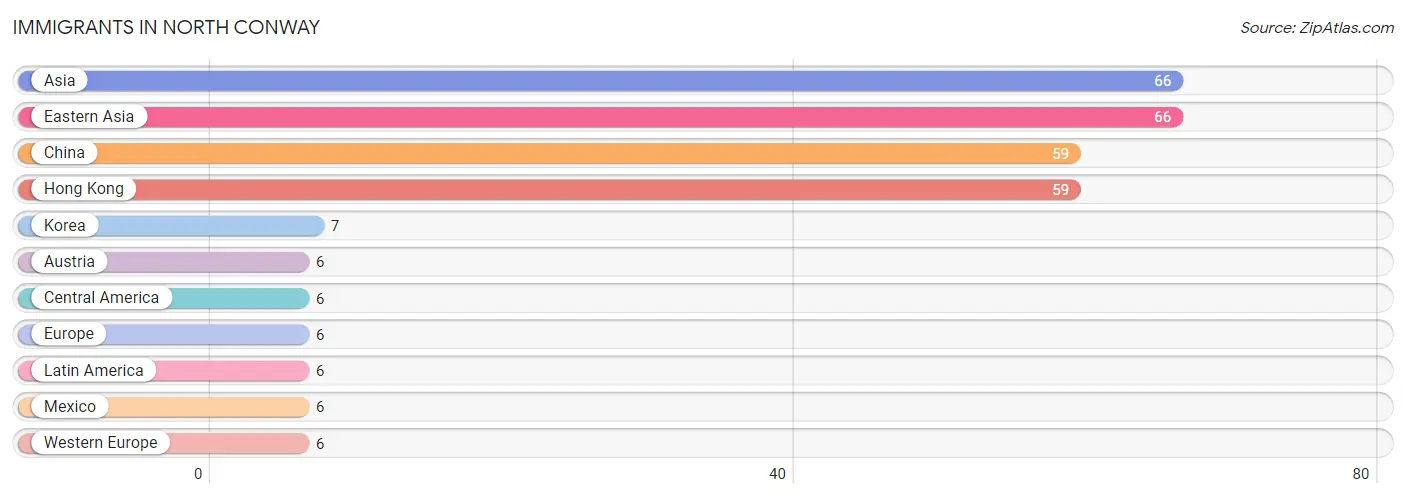
The most numerous immigrant groups reported in North Conway came from Asia (66 | 3.2%), Eastern Asia (66 | 3.2%), China (59 | 2.8%), Hong Kong (59 | 2.8%), and Korea (7 | 0.3%), together accounting for 12.4% of all North Conway residents.
| Immigration Origin | # Population | % Population |
| Asia | 66 | 3.2% |
| Austria | 6 | 0.3% |
| Central America | 6 | 0.3% |
| China | 59 | 2.8% |
| Eastern Asia | 66 | 3.2% |
| Europe | 6 | 0.3% |
| Hong Kong | 59 | 2.8% |
| Korea | 7 | 0.3% |
| Latin America | 6 | 0.3% |
| Mexico | 6 | 0.3% |
| Western Europe | 6 | 0.3% | View All 11 Rows |
Sex and Age in North Conway
Sex and Age in North Conway
The most populous age groups in North Conway are 55 to 59 Years (173 | 15.3%) for men and 65 to 69 Years (164 | 17.2%) for women.
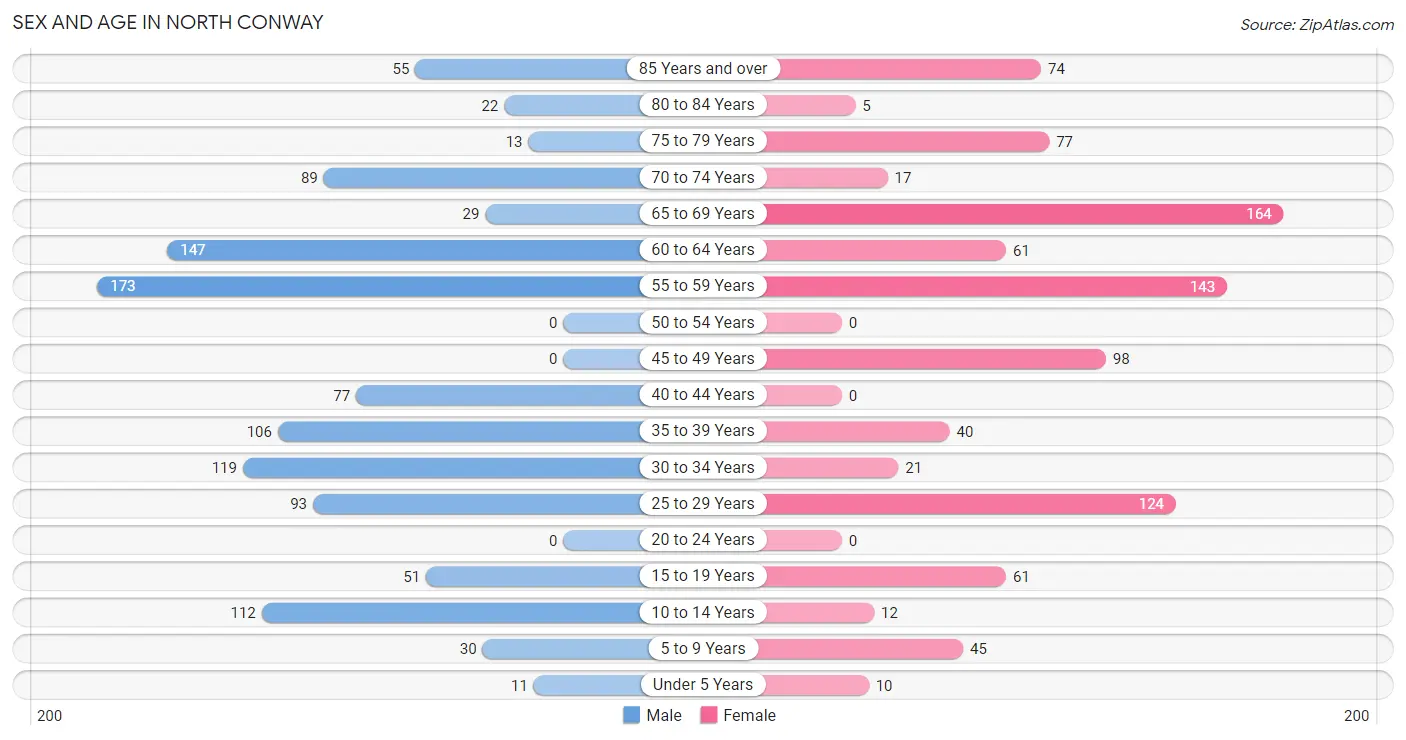
| Age Bracket | Male | Female |
| Under 5 Years | 11 (1.0%) | 10 (1.1%) |
| 5 to 9 Years | 30 (2.7%) | 45 (4.7%) |
| 10 to 14 Years | 112 (9.9%) | 12 (1.3%) |
| 15 to 19 Years | 51 (4.5%) | 61 (6.4%) |
| 20 to 24 Years | 0 (0.0%) | 0 (0.0%) |
| 25 to 29 Years | 93 (8.3%) | 124 (13.0%) |
| 30 to 34 Years | 119 (10.6%) | 21 (2.2%) |
| 35 to 39 Years | 106 (9.4%) | 40 (4.2%) |
| 40 to 44 Years | 77 (6.8%) | 0 (0.0%) |
| 45 to 49 Years | 0 (0.0%) | 98 (10.3%) |
| 50 to 54 Years | 0 (0.0%) | 0 (0.0%) |
| 55 to 59 Years | 173 (15.3%) | 143 (15.0%) |
| 60 to 64 Years | 147 (13.0%) | 61 (6.4%) |
| 65 to 69 Years | 29 (2.6%) | 164 (17.2%) |
| 70 to 74 Years | 89 (7.9%) | 17 (1.8%) |
| 75 to 79 Years | 13 (1.1%) | 77 (8.1%) |
| 80 to 84 Years | 22 (1.9%) | 5 (0.5%) |
| 85 Years and over | 55 (4.9%) | 74 (7.8%) |
| Total | 1,127 (100.0%) | 952 (100.0%) |
Families and Households in North Conway
Median Family Size in North Conway
The median family size in North Conway is 2.63 persons per family, with single male/father families (58 | 13.8%) accounting for the largest median family size of 3.21 persons per family. On the other hand, married-couple families (205 | 48.9%) represent the smallest median family size with 2.42 persons per family.
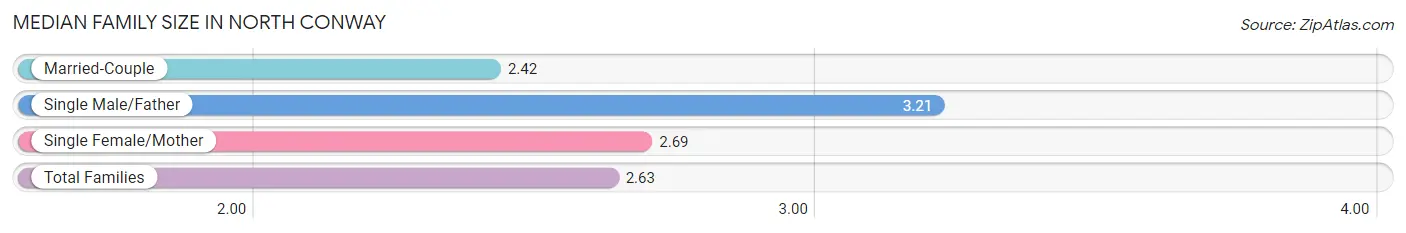
| Family Type | # Families | Family Size |
| Married-Couple | 205 (48.9%) | 2.42 |
| Single Male/Father | 58 (13.8%) | 3.21 |
| Single Female/Mother | 156 (37.2%) | 2.69 |
| Total Families | 419 (100.0%) | 2.63 |
Median Household Size in North Conway
The median household size in North Conway is 1.72 persons per household, with single male/father households (58 | 5.1%) accounting for the largest median household size of 3.72 persons per household. non-family households (722 | 63.3%) represent the smallest median household size with 1.15 persons per household.
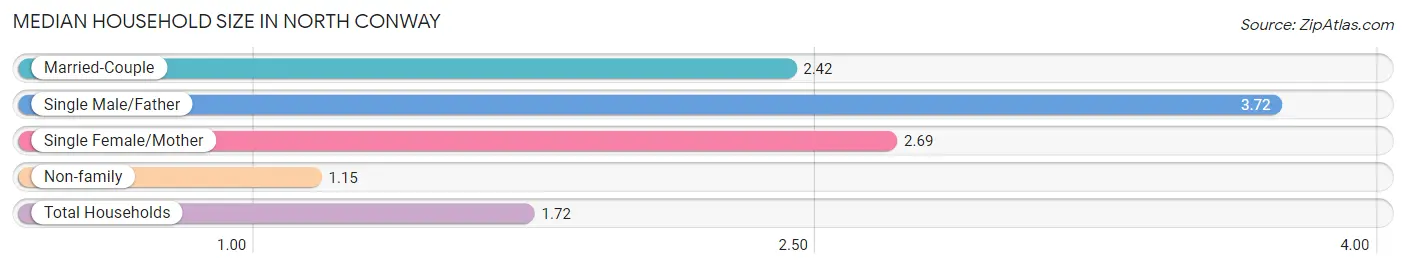
| Household Type | # Households | Household Size |
| Married-Couple | 205 (18.0%) | 2.42 |
| Single Male/Father | 58 (5.1%) | 3.72 |
| Single Female/Mother | 156 (13.7%) | 2.69 |
| Non-family | 722 (63.3%) | 1.15 |
| Total Households | 1,141 (100.0%) | 1.72 |
Household Size by Marriage Status in North Conway
Out of a total of 1,141 households in North Conway, 419 (36.7%) are family households, while 722 (63.3%) are nonfamily households. The most numerous type of family households are 2-person households, comprising 290, and the most common type of nonfamily households are 1-person households, comprising 657.
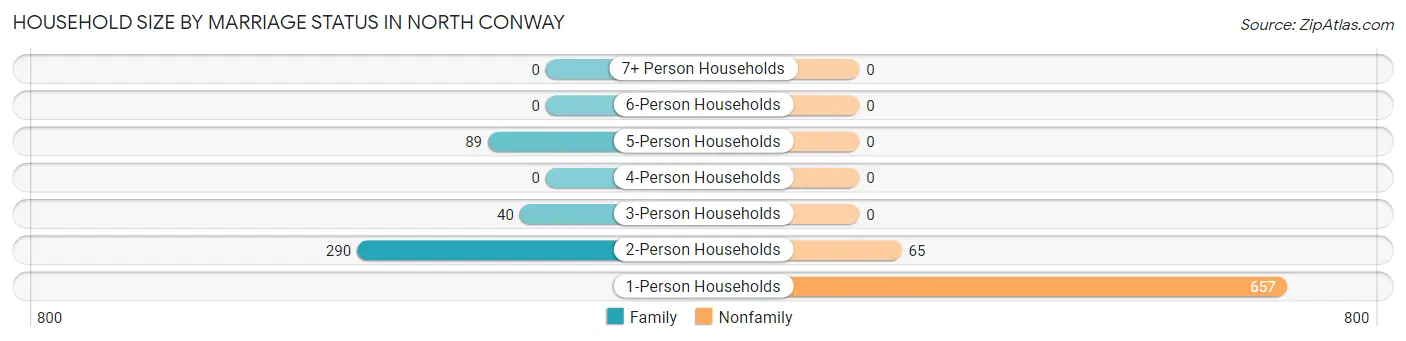
| Household Size | Family Households | Nonfamily Households |
| 1-Person Households | - | 657 (57.6%) |
| 2-Person Households | 290 (25.4%) | 65 (5.7%) |
| 3-Person Households | 40 (3.5%) | 0 (0.0%) |
| 4-Person Households | 0 (0.0%) | 0 (0.0%) |
| 5-Person Households | 89 (7.8%) | 0 (0.0%) |
| 6-Person Households | 0 (0.0%) | 0 (0.0%) |
| 7+ Person Households | 0 (0.0%) | 0 (0.0%) |
| Total | 419 (36.7%) | 722 (63.3%) |
Female Fertility in North Conway
Fertility by Age in North Conway
| Age Bracket | Women with Births | Births / 1,000 Women |
| 15 to 19 years | 0 (0.0%) | 0.0 |
| 20 to 34 years | 0 (0.0%) | 0.0 |
| 35 to 50 years | 0 (0.0%) | 0.0 |
| Total | 0 (0.0%) | 0.0 |
Fertility by Age by Marriage Status in North Conway
| Age Bracket | Married | Unmarried |
| 15 to 19 years | 0 (0.0%) | 0 (0.0%) |
| 20 to 34 years | 0 (0.0%) | 0 (0.0%) |
| 35 to 50 years | 0 (0.0%) | 0 (0.0%) |
| Total | 0 (0.0%) | 0 (0.0%) |
Fertility by Education in North Conway
| Educational Attainment | Women with Births | Births / 1,000 Women |
| Less than High School | 0 (0.0%) | 0.0 |
| High School Diploma | 0 (0.0%) | 0.0 |
| College or Associate's Degree | 0 (0.0%) | 0.0 |
| Bachelor's Degree | 0 (0.0%) | 0.0 |
| Graduate Degree | 0 (0.0%) | 0.0 |
| Total | 0 (0.0%) | 0.0 |
Fertility by Education by Marriage Status in North Conway
| Educational Attainment | Married | Unmarried |
| Less than High School | 0 (0.0%) | 0 (0.0%) |
| High School Diploma | 0 (0.0%) | 0 (0.0%) |
| College or Associate's Degree | 0 (0.0%) | 0 (0.0%) |
| Bachelor's Degree | 0 (0.0%) | 0 (0.0%) |
| Graduate Degree | 0 (0.0%) | 0 (0.0%) |
| Total | 0 (0.0%) | 0 (0.0%) |
Employment Characteristics in North Conway
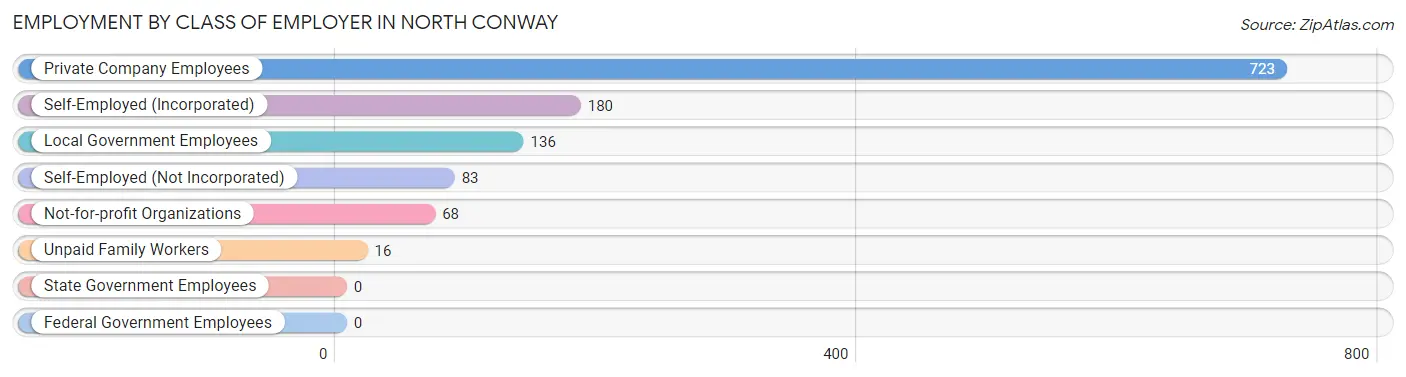
Employment by Class of Employer in North Conway
Among the 1,206 employed individuals in North Conway, private company employees (723 | 60.0%), self-employed (incorporated) (180 | 14.9%), and local government employees (136 | 11.3%) make up the most common classes of employment.
| Employer Class | # Employees | % Employees |
| Private Company Employees | 723 | 60.0% |
| Self-Employed (Incorporated) | 180 | 14.9% |
| Self-Employed (Not Incorporated) | 83 | 6.9% |
| Not-for-profit Organizations | 68 | 5.6% |
| Local Government Employees | 136 | 11.3% |
| State Government Employees | 0 | 0.0% |
| Federal Government Employees | 0 | 0.0% |
| Unpaid Family Workers | 16 | 1.3% |
| Total | 1,206 | 100.0% |
Employment Status by Age in North Conway
According to the labor force statistics for North Conway, out of the total population over 16 years of age (1,859), 68.4% or 1,272 individuals are in the labor force, with 5.2% or 66 of them unemployed. The age group with the highest labor force participation rate is 30 to 34 years, with 100.0% or 140 individuals in the labor force. Within the labor force, the 60 to 64 years age range has the highest percentage of unemployed individuals, with 37.9% or 36 of them being unemployed.
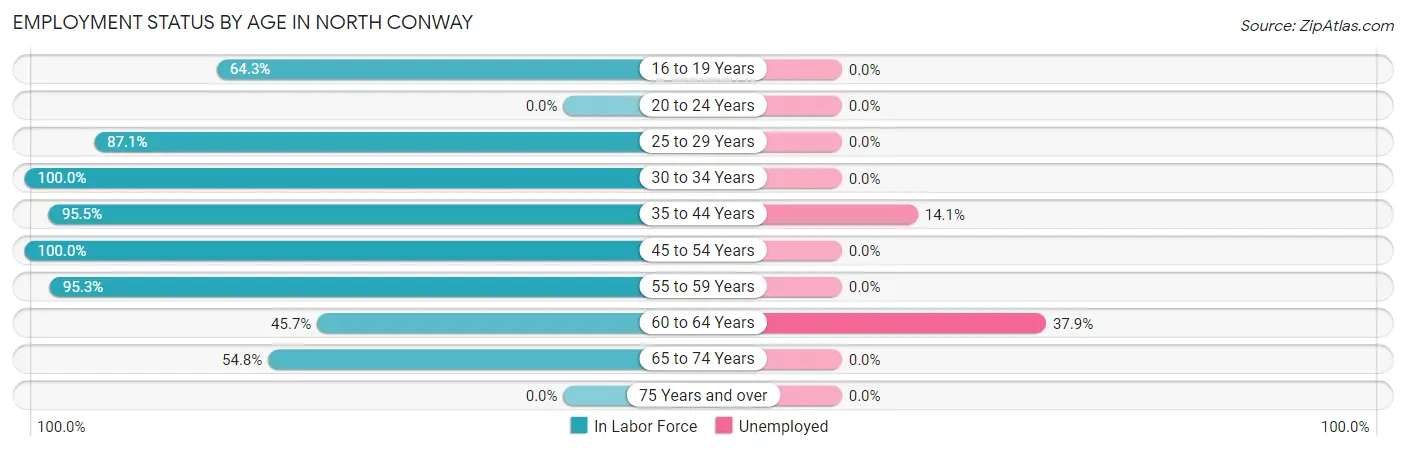
| Age Bracket | In Labor Force | Unemployed |
| 16 to 19 Years | 72 (64.3%) | 0 (0.0%) |
| 20 to 24 Years | 0 (0.0%) | 0 (0.0%) |
| 25 to 29 Years | 189 (87.1%) | 0 (0.0%) |
| 30 to 34 Years | 140 (100.0%) | 0 (0.0%) |
| 35 to 44 Years | 213 (95.5%) | 30 (14.1%) |
| 45 to 54 Years | 98 (100.0%) | 0 (0.0%) |
| 55 to 59 Years | 301 (95.3%) | 0 (0.0%) |
| 60 to 64 Years | 95 (45.7%) | 36 (37.9%) |
| 65 to 74 Years | 164 (54.8%) | 0 (0.0%) |
| 75 Years and over | 0 (0.0%) | 0 (0.0%) |
| Total | 1,272 (68.4%) | 66 (5.2%) |
Employment Status by Educational Attainment in North Conway
According to labor force statistics for North Conway, 86.2% of individuals (1,036) out of the total population between 25 and 64 years of age (1,202) are in the labor force, with 6.4% or 66 of them being unemployed. The group with the highest labor force participation rate are those with the educational attainment of bachelor's degree or higher, with 94.4% or 455 individuals in the labor force. Within the labor force, individuals with college / associate degree education have the highest percentage of unemployment, with 7.9% or 30 of them being unemployed.
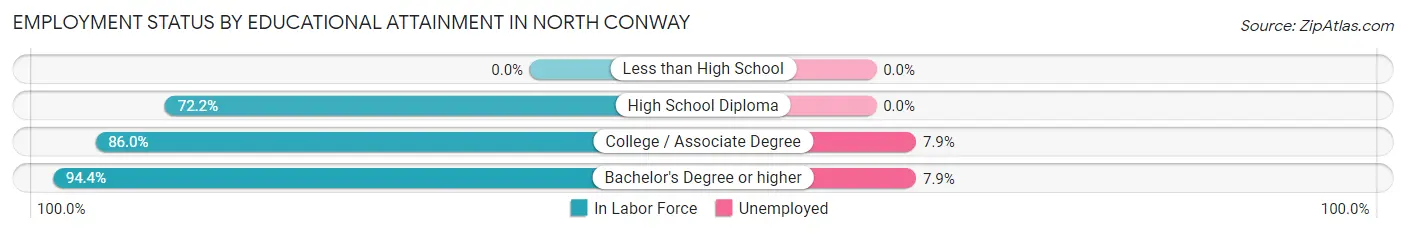
| Educational Attainment | In Labor Force | Unemployed |
| Less than High School | 0 (0.0%) | 0 (0.0%) |
| High School Diploma | 200 (72.2%) | 0 (0.0%) |
| College / Associate Degree | 381 (86.0%) | 35 (7.9%) |
| Bachelor's Degree or higher | 455 (94.4%) | 38 (7.9%) |
| Total | 1,036 (86.2%) | 77 (6.4%) |
Employment Occupations by Sex in North Conway
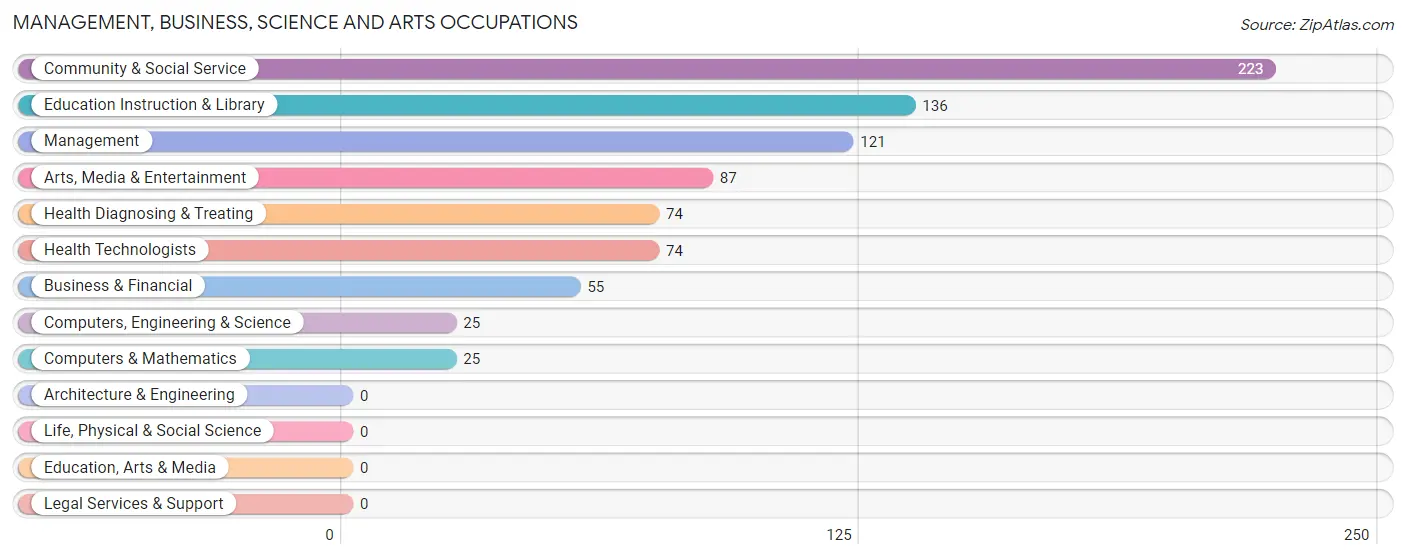
Management, Business, Science and Arts Occupations
The most common Management, Business, Science and Arts occupations in North Conway are Community & Social Service (223 | 18.5%), Education Instruction & Library (136 | 11.3%), Management (121 | 10.0%), Arts, Media & Entertainment (87 | 7.2%), and Health Diagnosing & Treating (74 | 6.1%).
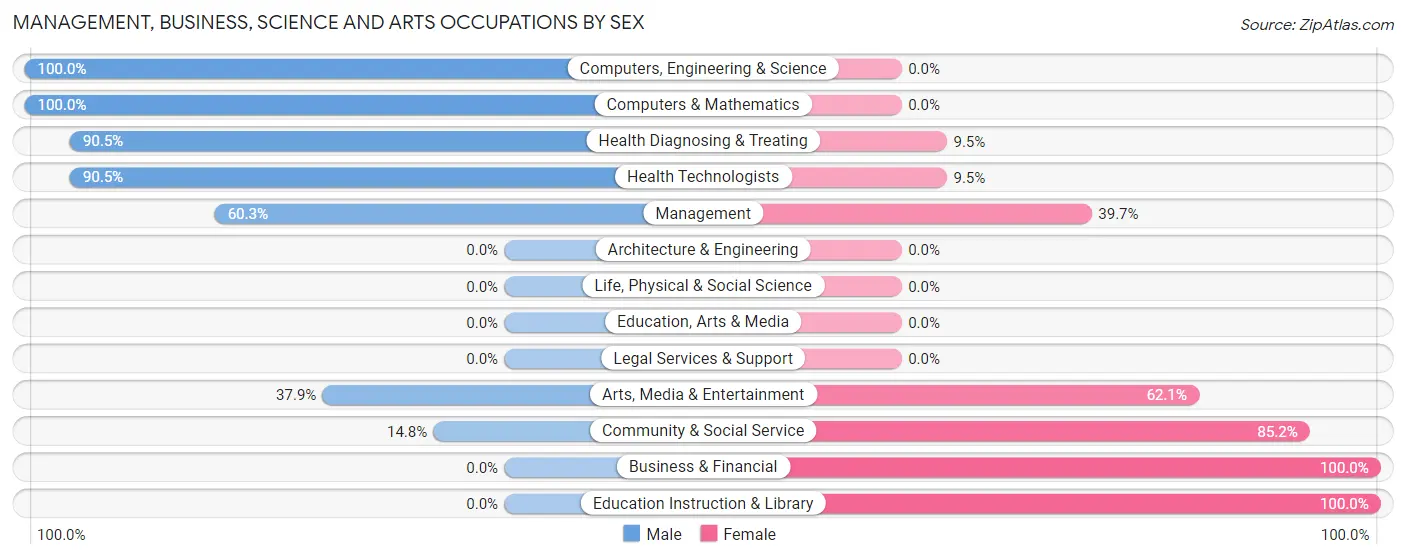
Management, Business, Science and Arts Occupations by Sex
Within the Management, Business, Science and Arts occupations in North Conway, the most male-oriented occupations are Computers, Engineering & Science (100.0%), Computers & Mathematics (100.0%), and Health Diagnosing & Treating (90.5%), while the most female-oriented occupations are Business & Financial (100.0%), Education Instruction & Library (100.0%), and Community & Social Service (85.2%).
| Occupation | Male | Female |
| Management | 73 (60.3%) | 48 (39.7%) |
| Business & Financial | 0 (0.0%) | 55 (100.0%) |
| Computers, Engineering & Science | 25 (100.0%) | 0 (0.0%) |
| Computers & Mathematics | 25 (100.0%) | 0 (0.0%) |
| Architecture & Engineering | 0 (0.0%) | 0 (0.0%) |
| Life, Physical & Social Science | 0 (0.0%) | 0 (0.0%) |
| Community & Social Service | 33 (14.8%) | 190 (85.2%) |
| Education, Arts & Media | 0 (0.0%) | 0 (0.0%) |
| Legal Services & Support | 0 (0.0%) | 0 (0.0%) |
| Education Instruction & Library | 0 (0.0%) | 136 (100.0%) |
| Arts, Media & Entertainment | 33 (37.9%) | 54 (62.1%) |
| Health Diagnosing & Treating | 67 (90.5%) | 7 (9.5%) |
| Health Technologists | 67 (90.5%) | 7 (9.5%) |
| Total (Category) | 198 (39.8%) | 300 (60.2%) |
| Total (Overall) | 678 (56.2%) | 528 (43.8%) |
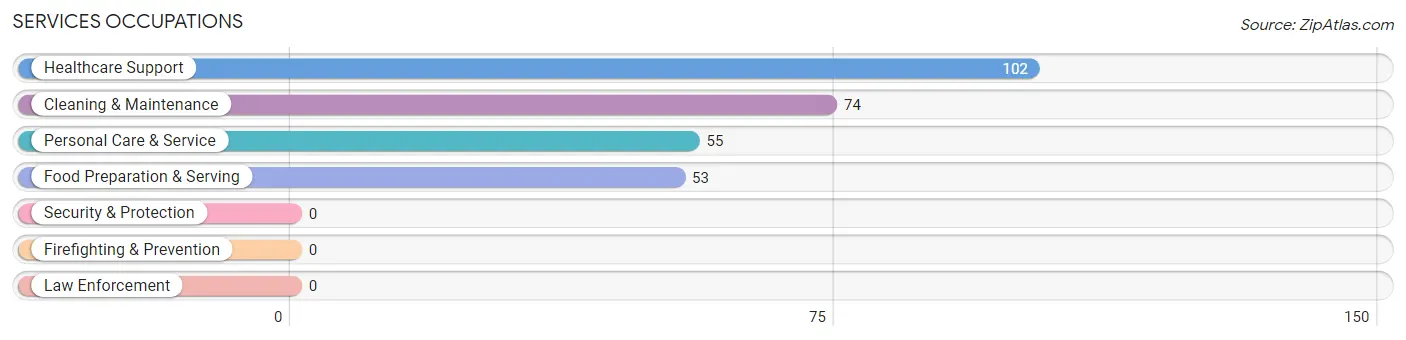
Services Occupations
The most common Services occupations in North Conway are Healthcare Support (102 | 8.5%), Cleaning & Maintenance (74 | 6.1%), Personal Care & Service (55 | 4.6%), and Food Preparation & Serving (53 | 4.4%).
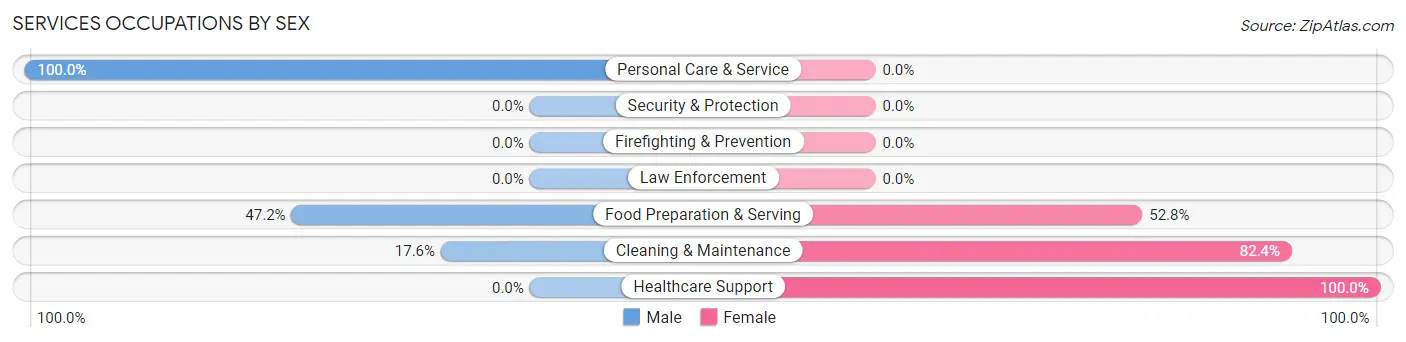
Services Occupations by Sex
Within the Services occupations in North Conway, the most male-oriented occupations are Personal Care & Service (100.0%), Food Preparation & Serving (47.2%), and Cleaning & Maintenance (17.6%), while the most female-oriented occupations are Healthcare Support (100.0%), Cleaning & Maintenance (82.4%), and Food Preparation & Serving (52.8%).
| Occupation | Male | Female |
| Healthcare Support | 0 (0.0%) | 102 (100.0%) |
| Security & Protection | 0 (0.0%) | 0 (0.0%) |
| Firefighting & Prevention | 0 (0.0%) | 0 (0.0%) |
| Law Enforcement | 0 (0.0%) | 0 (0.0%) |
| Food Preparation & Serving | 25 (47.2%) | 28 (52.8%) |
| Cleaning & Maintenance | 13 (17.6%) | 61 (82.4%) |
| Personal Care & Service | 55 (100.0%) | 0 (0.0%) |
| Total (Category) | 93 (32.8%) | 191 (67.2%) |
| Total (Overall) | 678 (56.2%) | 528 (43.8%) |
Sales and Office Occupations
The most common Sales and Office occupations in North Conway are Office & Administration (81 | 6.7%), and Sales & Related (78 | 6.5%).
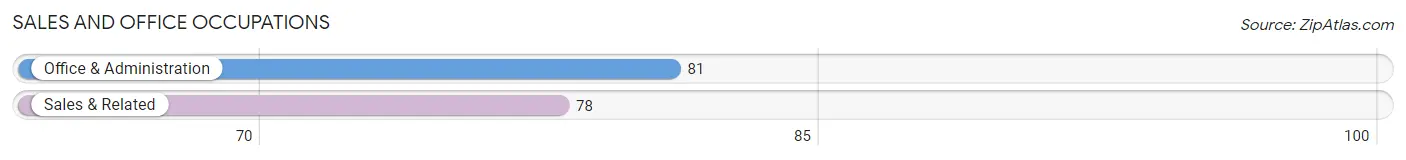
Sales and Office Occupations by Sex
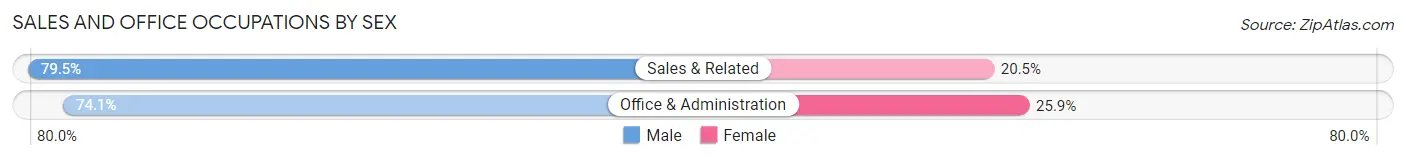
| Occupation | Male | Female |
| Sales & Related | 62 (79.5%) | 16 (20.5%) |
| Office & Administration | 60 (74.1%) | 21 (25.9%) |
| Total (Category) | 122 (76.7%) | 37 (23.3%) |
| Total (Overall) | 678 (56.2%) | 528 (43.8%) |
Natural Resources, Construction and Maintenance Occupations
The most common Natural Resources, Construction and Maintenance occupations in North Conway are Construction & Extraction (182 | 15.1%), and Installation, Maintenance & Repair (42 | 3.5%).
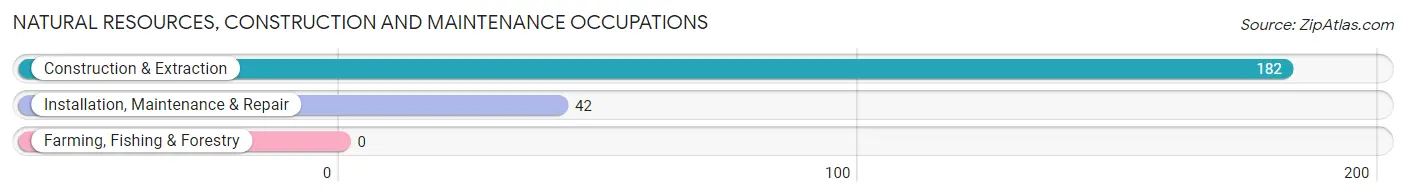
Natural Resources, Construction and Maintenance Occupations by Sex
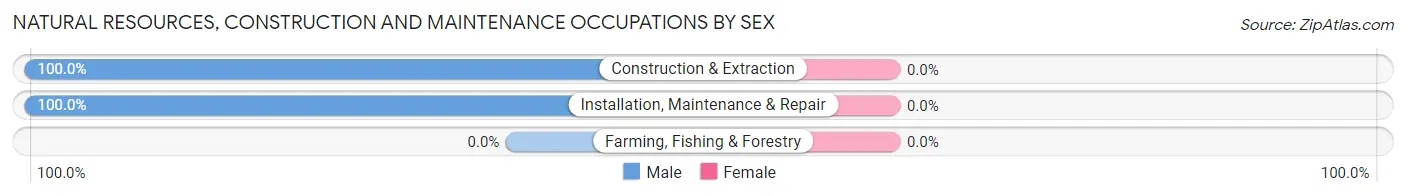
| Occupation | Male | Female |
| Farming, Fishing & Forestry | 0 (0.0%) | 0 (0.0%) |
| Construction & Extraction | 182 (100.0%) | 0 (0.0%) |
| Installation, Maintenance & Repair | 42 (100.0%) | 0 (0.0%) |
| Total (Category) | 224 (100.0%) | 0 (0.0%) |
| Total (Overall) | 678 (56.2%) | 528 (43.8%) |
Production, Transportation and Moving Occupations
The most common Production, Transportation and Moving occupations in North Conway are , and Material Moving (41 | 3.4%).
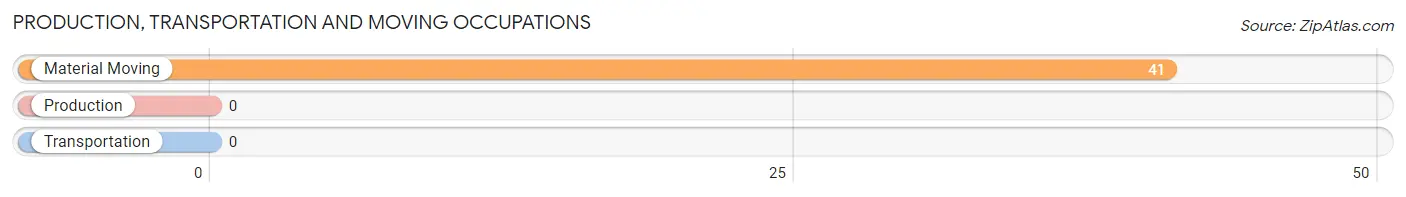
Production, Transportation and Moving Occupations by Sex
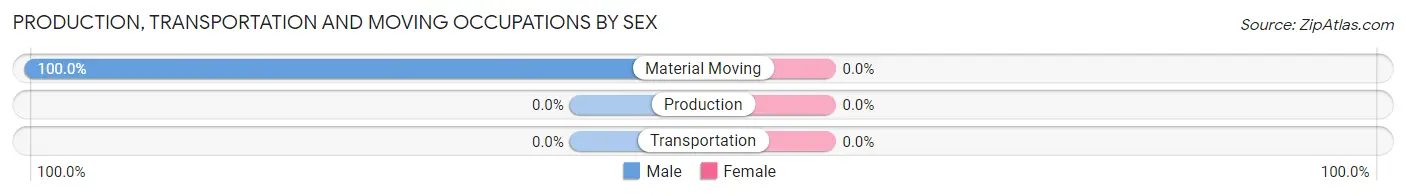
| Occupation | Male | Female |
| Production | 0 (0.0%) | 0 (0.0%) |
| Transportation | 0 (0.0%) | 0 (0.0%) |
| Material Moving | 41 (100.0%) | 0 (0.0%) |
| Total (Category) | 41 (100.0%) | 0 (0.0%) |
| Total (Overall) | 678 (56.2%) | 528 (43.8%) |
Employment Industries by Sex in North Conway
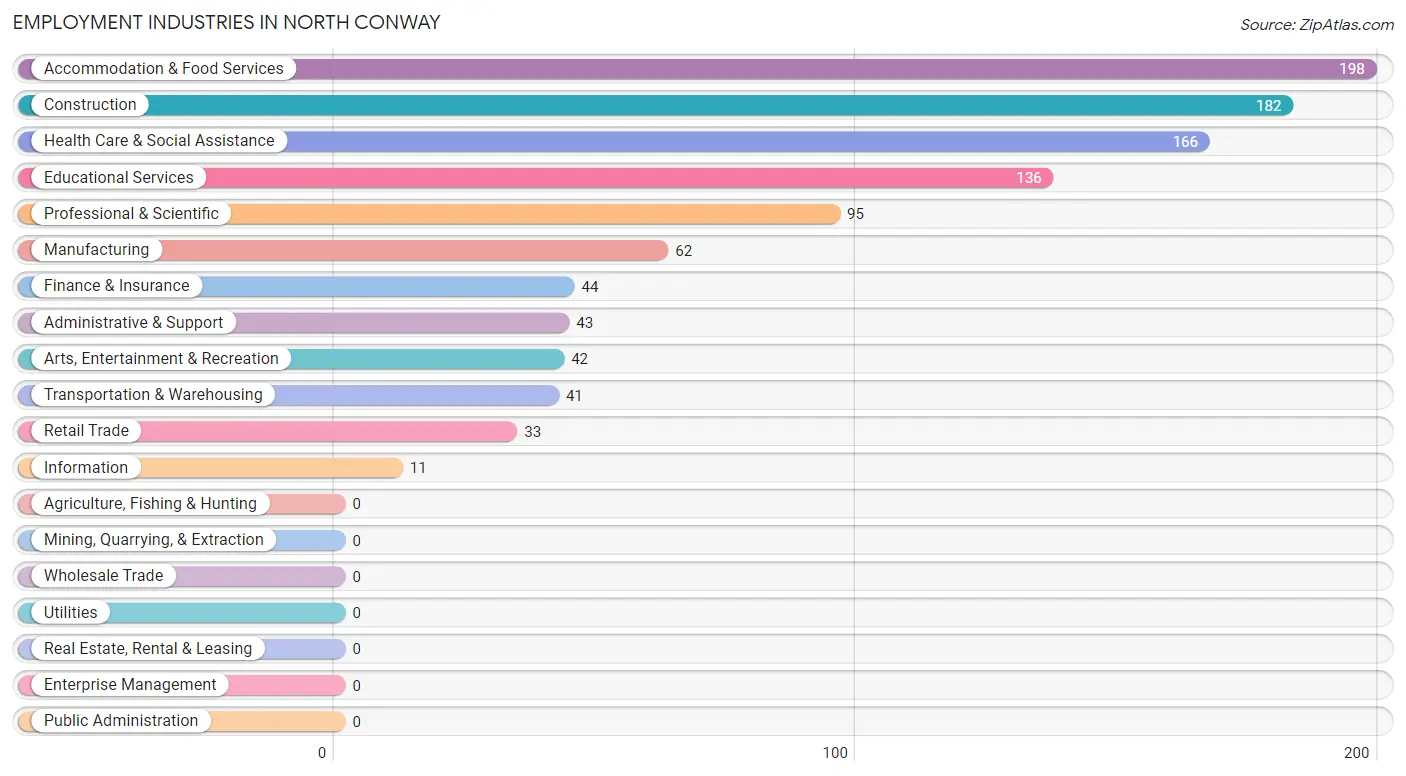
Employment Industries in North Conway
The major employment industries in North Conway include Accommodation & Food Services (198 | 16.4%), Construction (182 | 15.1%), Health Care & Social Assistance (166 | 13.8%), Educational Services (136 | 11.3%), and Professional & Scientific (95 | 7.9%).
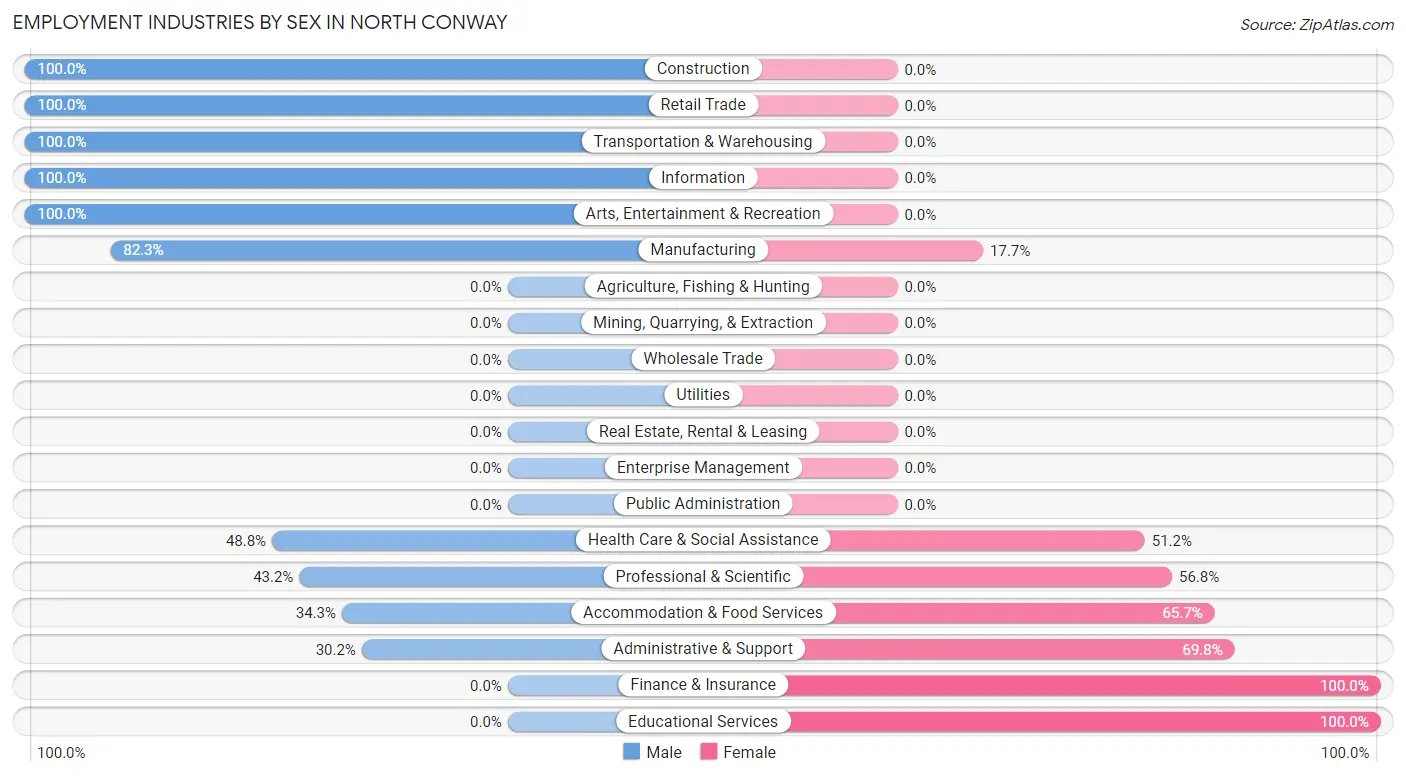
Employment Industries by Sex in North Conway
The North Conway industries that see more men than women are Construction (100.0%), Retail Trade (100.0%), and Transportation & Warehousing (100.0%), whereas the industries that tend to have a higher number of women are Finance & Insurance (100.0%), Educational Services (100.0%), and Administrative & Support (69.8%).
| Industry | Male | Female |
| Agriculture, Fishing & Hunting | 0 (0.0%) | 0 (0.0%) |
| Mining, Quarrying, & Extraction | 0 (0.0%) | 0 (0.0%) |
| Construction | 182 (100.0%) | 0 (0.0%) |
| Manufacturing | 51 (82.3%) | 11 (17.7%) |
| Wholesale Trade | 0 (0.0%) | 0 (0.0%) |
| Retail Trade | 33 (100.0%) | 0 (0.0%) |
| Transportation & Warehousing | 41 (100.0%) | 0 (0.0%) |
| Utilities | 0 (0.0%) | 0 (0.0%) |
| Information | 11 (100.0%) | 0 (0.0%) |
| Finance & Insurance | 0 (0.0%) | 44 (100.0%) |
| Real Estate, Rental & Leasing | 0 (0.0%) | 0 (0.0%) |
| Professional & Scientific | 41 (43.2%) | 54 (56.8%) |
| Enterprise Management | 0 (0.0%) | 0 (0.0%) |
| Administrative & Support | 13 (30.2%) | 30 (69.8%) |
| Educational Services | 0 (0.0%) | 136 (100.0%) |
| Health Care & Social Assistance | 81 (48.8%) | 85 (51.2%) |
| Arts, Entertainment & Recreation | 42 (100.0%) | 0 (0.0%) |
| Accommodation & Food Services | 68 (34.3%) | 130 (65.7%) |
| Public Administration | 0 (0.0%) | 0 (0.0%) |
| Total | 678 (56.2%) | 528 (43.8%) |
Education in North Conway
School Enrollment in North Conway
The most common levels of schooling among the 303 students in North Conway are middle school (124 | 40.9%), high school (112 | 37.0%), and kindergarten (60 | 19.8%).
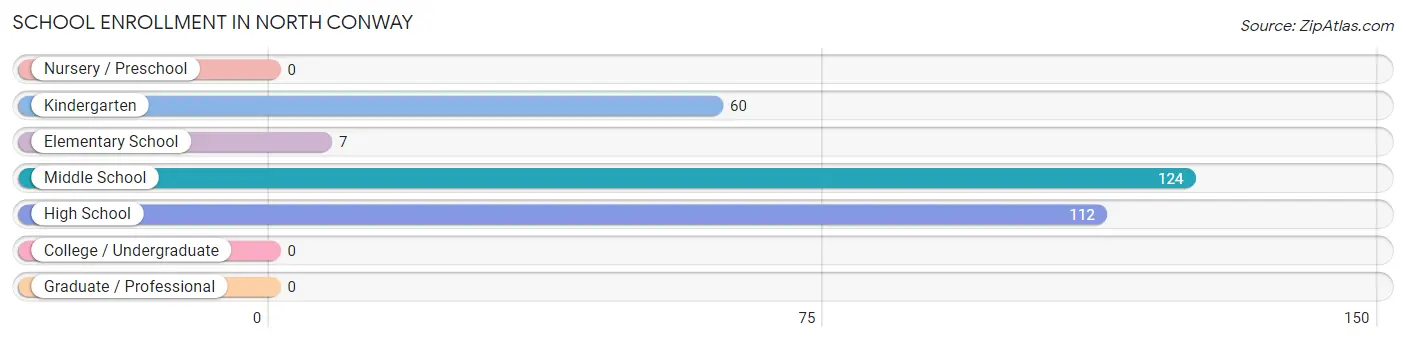
| School Level | # Students | % Students |
| Nursery / Preschool | 0 | 0.0% |
| Kindergarten | 60 | 19.8% |
| Elementary School | 7 | 2.3% |
| Middle School | 124 | 40.9% |
| High School | 112 | 37.0% |
| College / Undergraduate | 0 | 0.0% |
| Graduate / Professional | 0 | 0.0% |
| Total | 303 | 100.0% |
School Enrollment by Age by Funding Source in North Conway
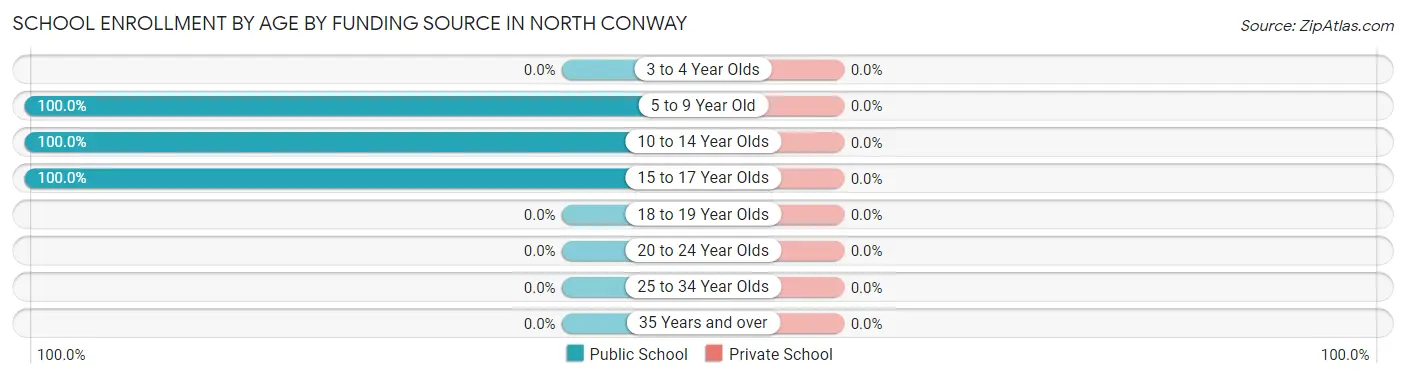
| Age Bracket | Public School | Private School |
| 3 to 4 Year Olds | 0 (0.0%) | 0 (0.0%) |
| 5 to 9 Year Old | 67 (100.0%) | 0 (0.0%) |
| 10 to 14 Year Olds | 124 (100.0%) | 0 (0.0%) |
| 15 to 17 Year Olds | 112 (100.0%) | 0 (0.0%) |
| 18 to 19 Year Olds | 0 (0.0%) | 0 (0.0%) |
| 20 to 24 Year Olds | 0 (0.0%) | 0 (0.0%) |
| 25 to 34 Year Olds | 0 (0.0%) | 0 (0.0%) |
| 35 Years and over | 0 (0.0%) | 0 (0.0%) |
| Total | 303 (100.0%) | 0 (0.0%) |
Educational Attainment by Field of Study in North Conway
Psychology (136 | 17.3%), business (134 | 17.0%), physical & health sciences (107 | 13.6%), liberal arts & history (66 | 8.4%), and social sciences (56 | 7.1%) are the most common fields of study among 788 individuals in North Conway who have obtained a bachelor's degree or higher.
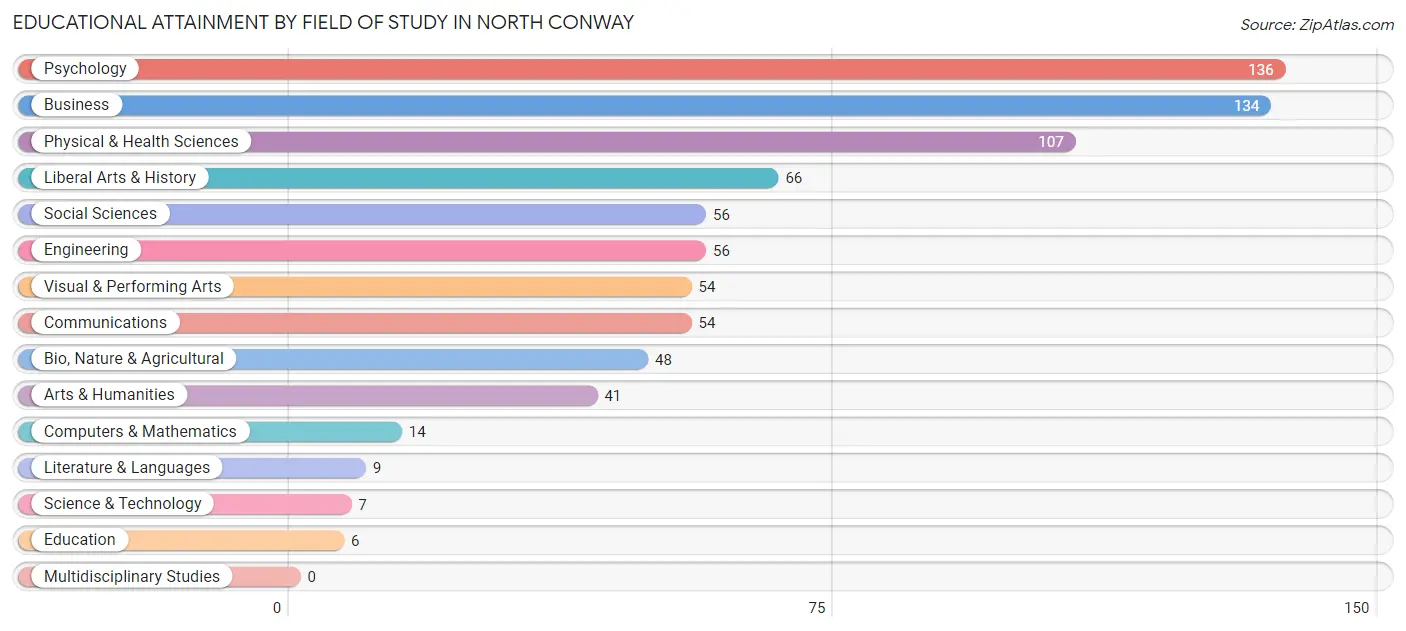
| Field of Study | # Graduates | % Graduates |
| Computers & Mathematics | 14 | 1.8% |
| Bio, Nature & Agricultural | 48 | 6.1% |
| Physical & Health Sciences | 107 | 13.6% |
| Psychology | 136 | 17.3% |
| Social Sciences | 56 | 7.1% |
| Engineering | 56 | 7.1% |
| Multidisciplinary Studies | 0 | 0.0% |
| Science & Technology | 7 | 0.9% |
| Business | 134 | 17.0% |
| Education | 6 | 0.8% |
| Literature & Languages | 9 | 1.1% |
| Liberal Arts & History | 66 | 8.4% |
| Visual & Performing Arts | 54 | 6.9% |
| Communications | 54 | 6.9% |
| Arts & Humanities | 41 | 5.2% |
| Total | 788 | 100.0% |
Transportation & Commute in North Conway
Vehicle Availability by Sex in North Conway
The most prevalent vehicle ownership categories in North Conway are males with 2 vehicles (423, accounting for 62.4%) and females with 2 vehicles (248, making up 80.1%).
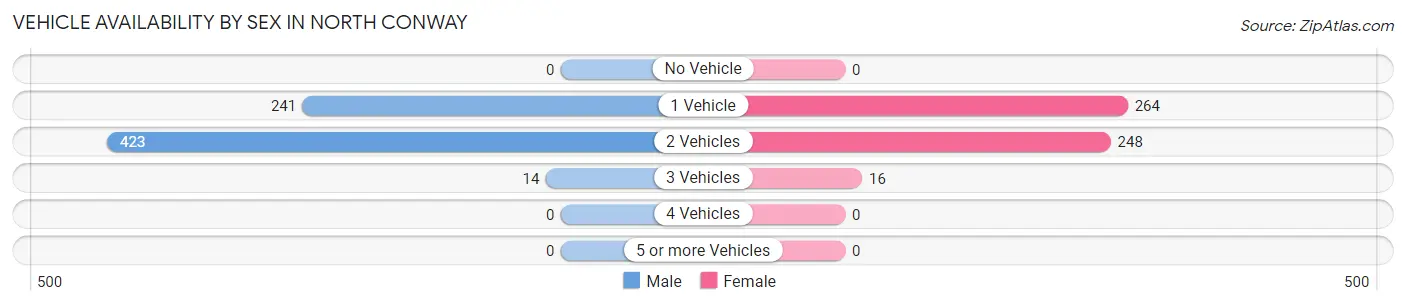
| Vehicles Available | Male | Female |
| No Vehicle | 0 (0.0%) | 0 (0.0%) |
| 1 Vehicle | 241 (35.5%) | 264 (50.0%) |
| 2 Vehicles | 423 (62.4%) | 248 (47.0%) |
| 3 Vehicles | 14 (2.1%) | 16 (3.0%) |
| 4 Vehicles | 0 (0.0%) | 0 (0.0%) |
| 5 or more Vehicles | 0 (0.0%) | 0 (0.0%) |
| Total | 678 (100.0%) | 528 (100.0%) |
Commute Time in North Conway
The most frequently occuring commute durations in North Conway are 5 to 9 minutes (390 commuters, 36.3%), 10 to 14 minutes (227 commuters, 21.1%), and 20 to 24 minutes (196 commuters, 18.2%).
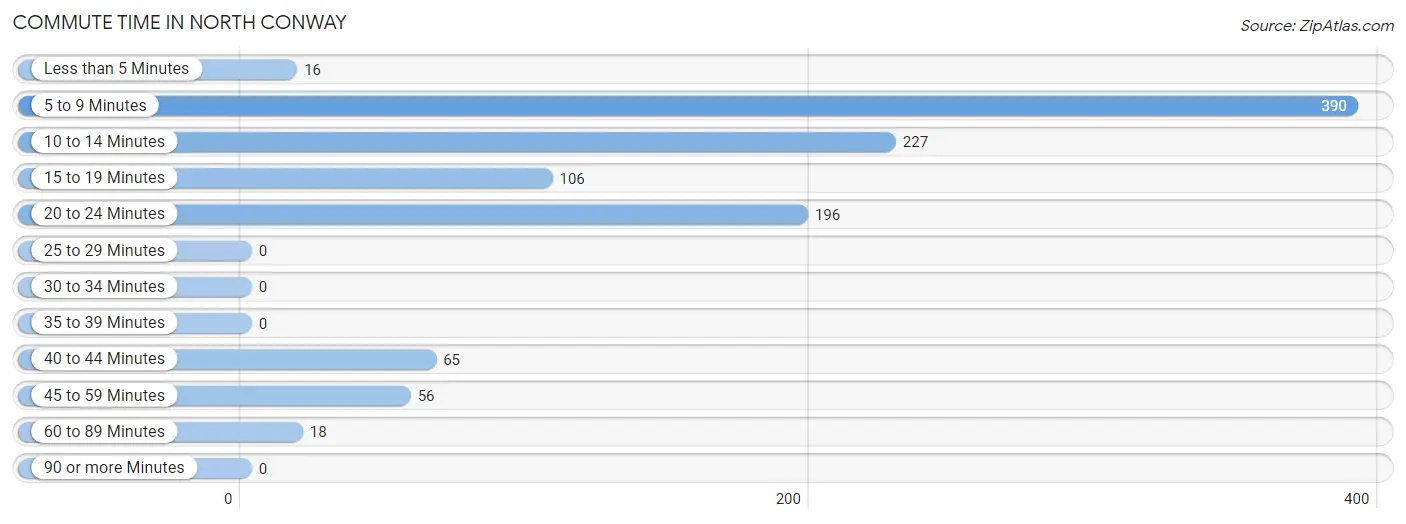
| Commute Time | # Commuters | % Commuters |
| Less than 5 Minutes | 16 | 1.5% |
| 5 to 9 Minutes | 390 | 36.3% |
| 10 to 14 Minutes | 227 | 21.1% |
| 15 to 19 Minutes | 106 | 9.9% |
| 20 to 24 Minutes | 196 | 18.2% |
| 25 to 29 Minutes | 0 | 0.0% |
| 30 to 34 Minutes | 0 | 0.0% |
| 35 to 39 Minutes | 0 | 0.0% |
| 40 to 44 Minutes | 65 | 6.0% |
| 45 to 59 Minutes | 56 | 5.2% |
| 60 to 89 Minutes | 18 | 1.7% |
| 90 or more Minutes | 0 | 0.0% |
Commute Time by Sex in North Conway
The most common commute times in North Conway are 10 to 14 minutes (227 commuters, 38.2%) for males and 5 to 9 minutes (261 commuters, 54.4%) for females.
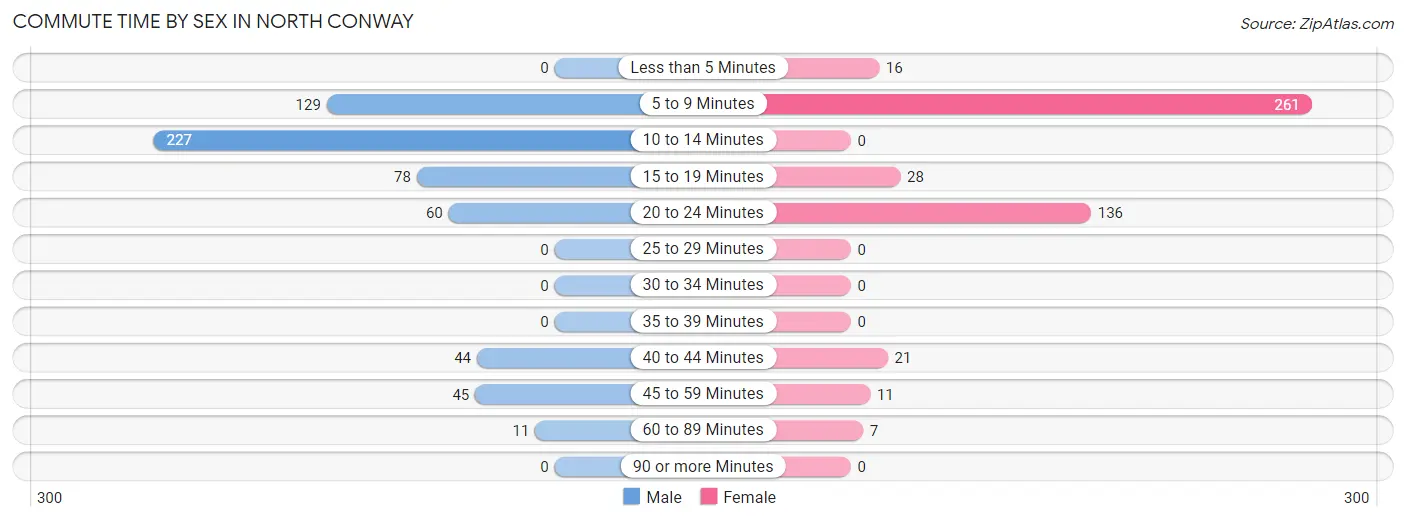
| Commute Time | Male | Female |
| Less than 5 Minutes | 0 (0.0%) | 16 (3.3%) |
| 5 to 9 Minutes | 129 (21.7%) | 261 (54.4%) |
| 10 to 14 Minutes | 227 (38.2%) | 0 (0.0%) |
| 15 to 19 Minutes | 78 (13.1%) | 28 (5.8%) |
| 20 to 24 Minutes | 60 (10.1%) | 136 (28.3%) |
| 25 to 29 Minutes | 0 (0.0%) | 0 (0.0%) |
| 30 to 34 Minutes | 0 (0.0%) | 0 (0.0%) |
| 35 to 39 Minutes | 0 (0.0%) | 0 (0.0%) |
| 40 to 44 Minutes | 44 (7.4%) | 21 (4.4%) |
| 45 to 59 Minutes | 45 (7.6%) | 11 (2.3%) |
| 60 to 89 Minutes | 11 (1.8%) | 7 (1.5%) |
| 90 or more Minutes | 0 (0.0%) | 0 (0.0%) |
Time of Departure to Work by Sex in North Conway
The most frequent times of departure to work in North Conway are 9:00 AM to 9:59 AM (178, 30.0%) for males and 7:00 AM to 7:29 AM (160, 33.3%) for females.
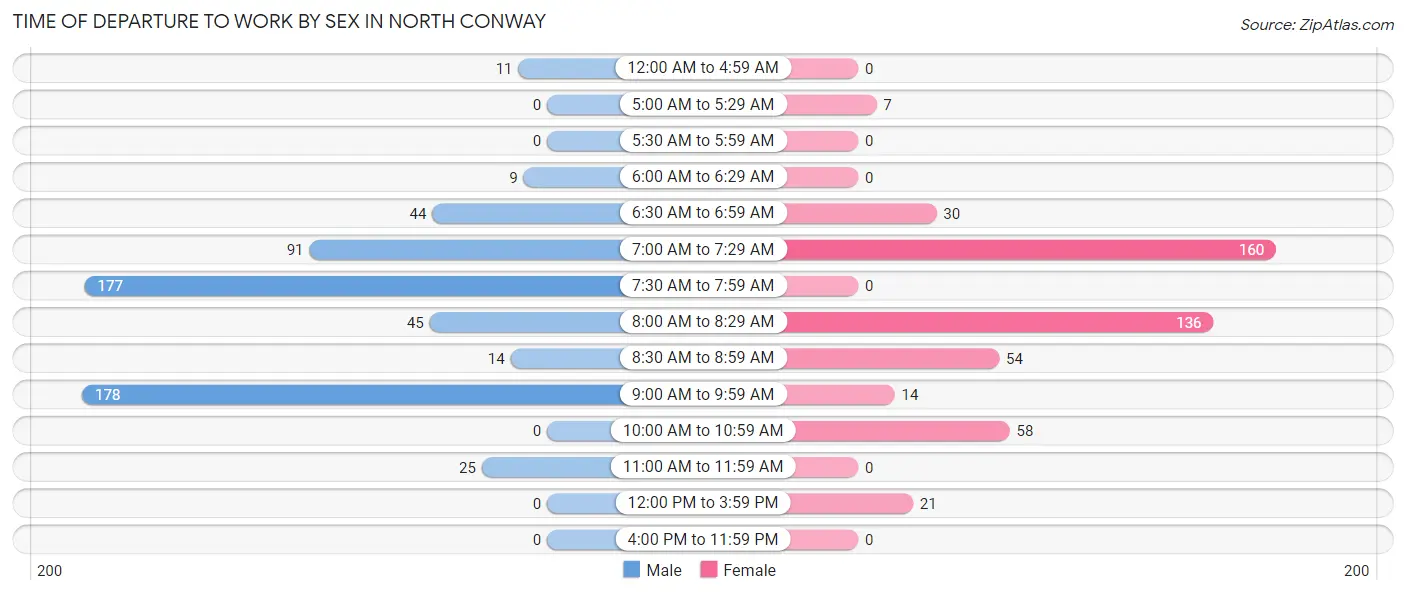
| Time of Departure | Male | Female |
| 12:00 AM to 4:59 AM | 11 (1.8%) | 0 (0.0%) |
| 5:00 AM to 5:29 AM | 0 (0.0%) | 7 (1.5%) |
| 5:30 AM to 5:59 AM | 0 (0.0%) | 0 (0.0%) |
| 6:00 AM to 6:29 AM | 9 (1.5%) | 0 (0.0%) |
| 6:30 AM to 6:59 AM | 44 (7.4%) | 30 (6.2%) |
| 7:00 AM to 7:29 AM | 91 (15.3%) | 160 (33.3%) |
| 7:30 AM to 7:59 AM | 177 (29.8%) | 0 (0.0%) |
| 8:00 AM to 8:29 AM | 45 (7.6%) | 136 (28.3%) |
| 8:30 AM to 8:59 AM | 14 (2.4%) | 54 (11.3%) |
| 9:00 AM to 9:59 AM | 178 (30.0%) | 14 (2.9%) |
| 10:00 AM to 10:59 AM | 0 (0.0%) | 58 (12.1%) |
| 11:00 AM to 11:59 AM | 25 (4.2%) | 0 (0.0%) |
| 12:00 PM to 3:59 PM | 0 (0.0%) | 21 (4.4%) |
| 4:00 PM to 11:59 PM | 0 (0.0%) | 0 (0.0%) |
| Total | 594 (100.0%) | 480 (100.0%) |
Housing Occupancy in North Conway
Occupancy by Ownership in North Conway
Of the total 1,141 dwellings in North Conway, owner-occupied units account for 544 (47.7%), while renter-occupied units make up 597 (52.3%).
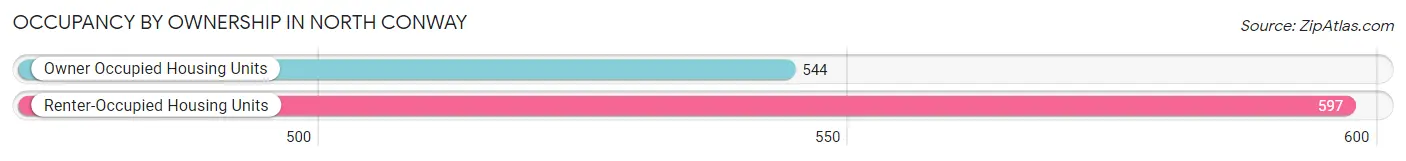
| Occupancy | # Housing Units | % Housing Units |
| Owner Occupied Housing Units | 544 | 47.7% |
| Renter-Occupied Housing Units | 597 | 52.3% |
| Total Occupied Housing Units | 1,141 | 100.0% |
Occupancy by Household Size in North Conway
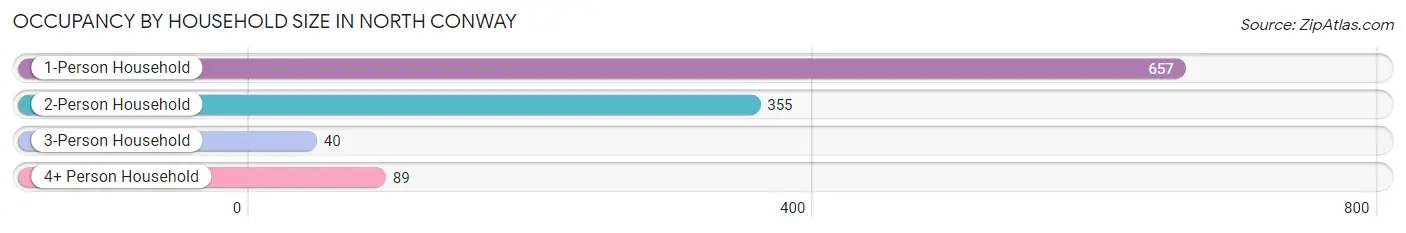
| Household Size | # Housing Units | % Housing Units |
| 1-Person Household | 657 | 57.6% |
| 2-Person Household | 355 | 31.1% |
| 3-Person Household | 40 | 3.5% |
| 4+ Person Household | 89 | 7.8% |
| Total Housing Units | 1,141 | 100.0% |
Occupancy by Ownership by Household Size in North Conway
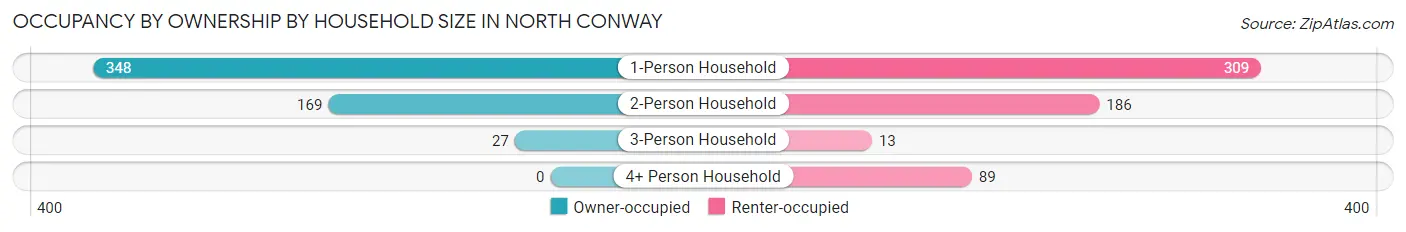
| Household Size | Owner-occupied | Renter-occupied |
| 1-Person Household | 348 (53.0%) | 309 (47.0%) |
| 2-Person Household | 169 (47.6%) | 186 (52.4%) |
| 3-Person Household | 27 (67.5%) | 13 (32.5%) |
| 4+ Person Household | 0 (0.0%) | 89 (100.0%) |
| Total Housing Units | 544 (47.7%) | 597 (52.3%) |
Occupancy by Educational Attainment in North Conway
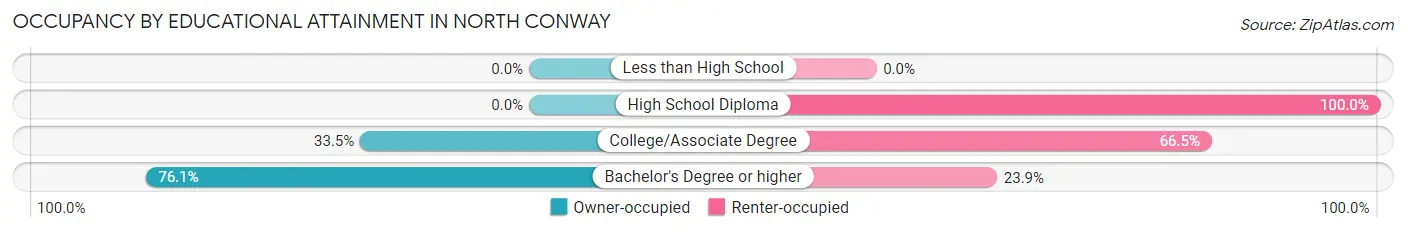
| Household Size | Owner-occupied | Renter-occupied |
| Less than High School | 0 (0.0%) | 0 (0.0%) |
| High School Diploma | 0 (0.0%) | 170 (100.0%) |
| College/Associate Degree | 153 (33.5%) | 304 (66.5%) |
| Bachelor's Degree or higher | 391 (76.1%) | 123 (23.9%) |
Occupancy by Age of Householder in North Conway
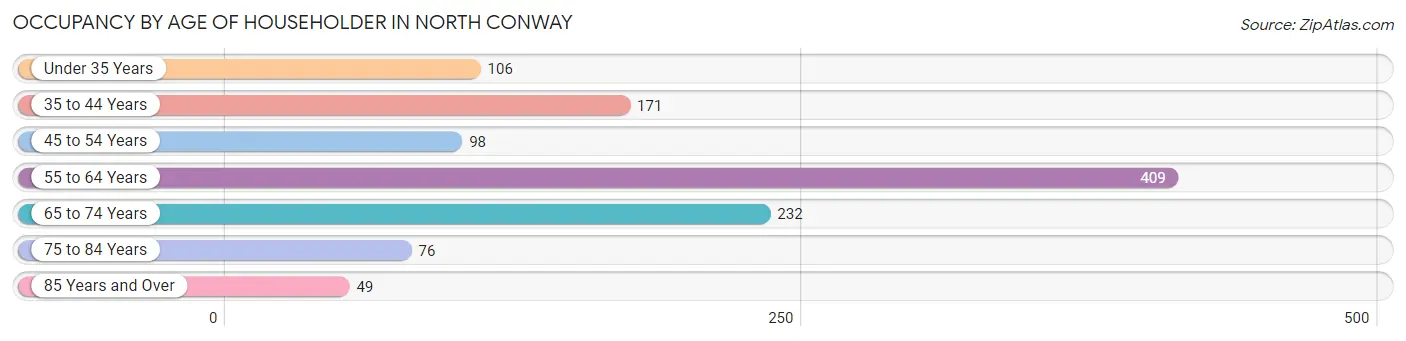
| Age Bracket | # Households | % Households |
| Under 35 Years | 106 | 9.3% |
| 35 to 44 Years | 171 | 15.0% |
| 45 to 54 Years | 98 | 8.6% |
| 55 to 64 Years | 409 | 35.8% |
| 65 to 74 Years | 232 | 20.3% |
| 75 to 84 Years | 76 | 6.7% |
| 85 Years and Over | 49 | 4.3% |
| Total | 1,141 | 100.0% |
Housing Finances in North Conway
Median Income by Occupancy in North Conway
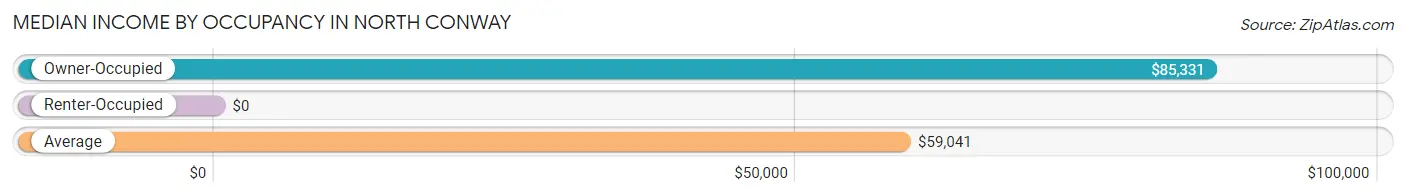
| Occupancy Type | # Households | Median Income |
| Owner-Occupied | 544 (47.7%) | $85,331 |
| Renter-Occupied | 597 (52.3%) | $0 |
| Average | 1,141 (100.0%) | $59,041 |
Occupancy by Householder Income Bracket in North Conway
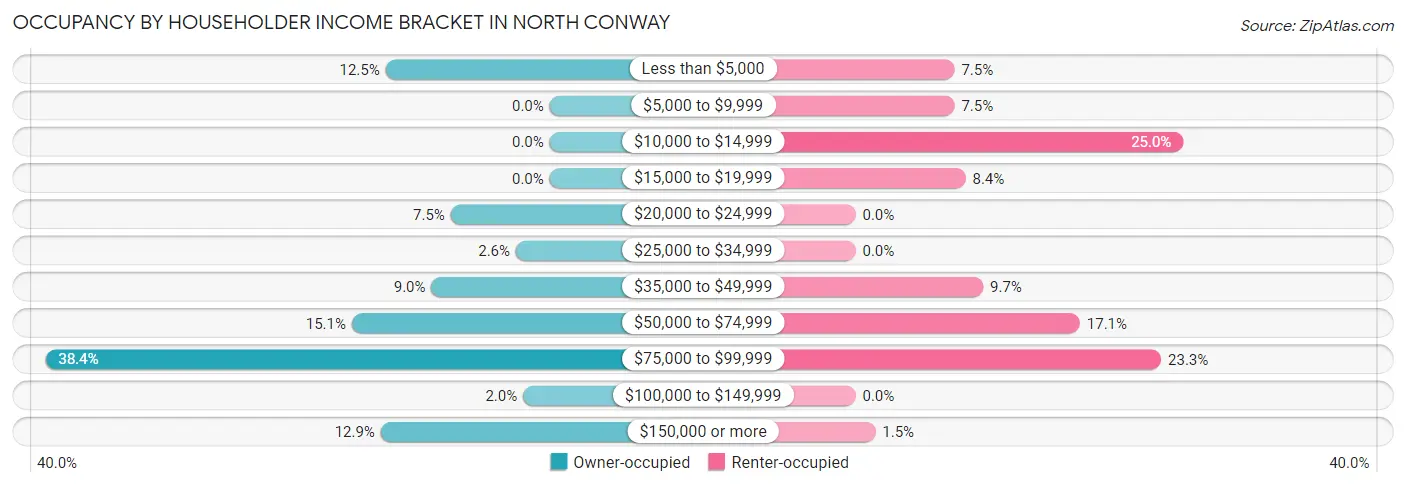
| Income Bracket | Owner-occupied | Renter-occupied |
| Less than $5,000 | 68 (12.5%) | 45 (7.5%) |
| $5,000 to $9,999 | 0 (0.0%) | 45 (7.5%) |
| $10,000 to $14,999 | 0 (0.0%) | 149 (25.0%) |
| $15,000 to $19,999 | 0 (0.0%) | 50 (8.4%) |
| $20,000 to $24,999 | 41 (7.5%) | 0 (0.0%) |
| $25,000 to $34,999 | 14 (2.6%) | 0 (0.0%) |
| $35,000 to $49,999 | 49 (9.0%) | 58 (9.7%) |
| $50,000 to $74,999 | 82 (15.1%) | 102 (17.1%) |
| $75,000 to $99,999 | 209 (38.4%) | 139 (23.3%) |
| $100,000 to $149,999 | 11 (2.0%) | 0 (0.0%) |
| $150,000 or more | 70 (12.9%) | 9 (1.5%) |
| Total | 544 (100.0%) | 597 (100.0%) |
Monthly Housing Cost Tiers in North Conway
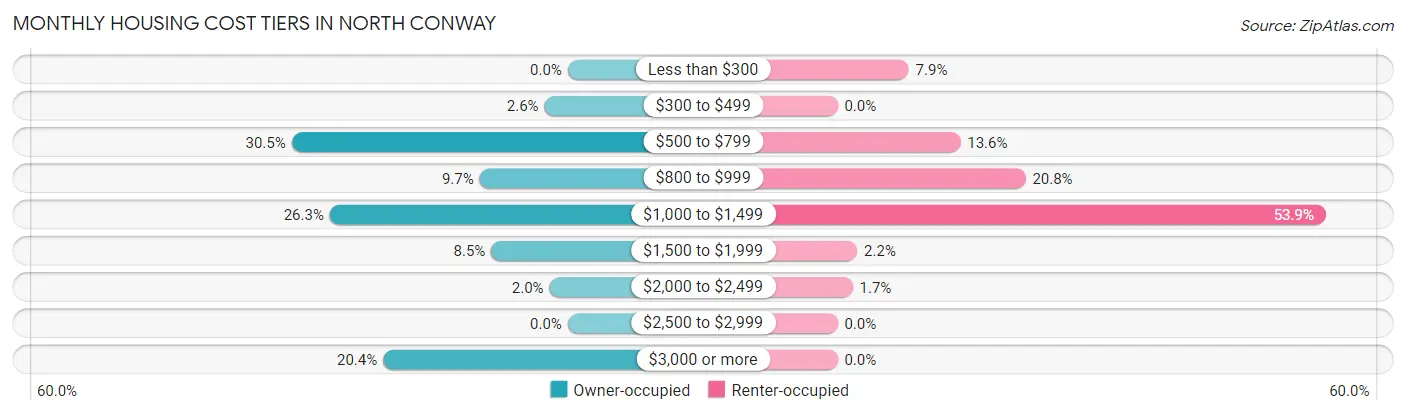
| Monthly Cost | Owner-occupied | Renter-occupied |
| Less than $300 | 0 (0.0%) | 47 (7.9%) |
| $300 to $499 | 14 (2.6%) | 0 (0.0%) |
| $500 to $799 | 166 (30.5%) | 81 (13.6%) |
| $800 to $999 | 53 (9.7%) | 124 (20.8%) |
| $1,000 to $1,499 | 143 (26.3%) | 322 (53.9%) |
| $1,500 to $1,999 | 46 (8.5%) | 13 (2.2%) |
| $2,000 to $2,499 | 11 (2.0%) | 10 (1.7%) |
| $2,500 to $2,999 | 0 (0.0%) | 0 (0.0%) |
| $3,000 or more | 111 (20.4%) | 0 (0.0%) |
| Total | 544 (100.0%) | 597 (100.0%) |
Physical Housing Characteristics in North Conway
Housing Structures in North Conway
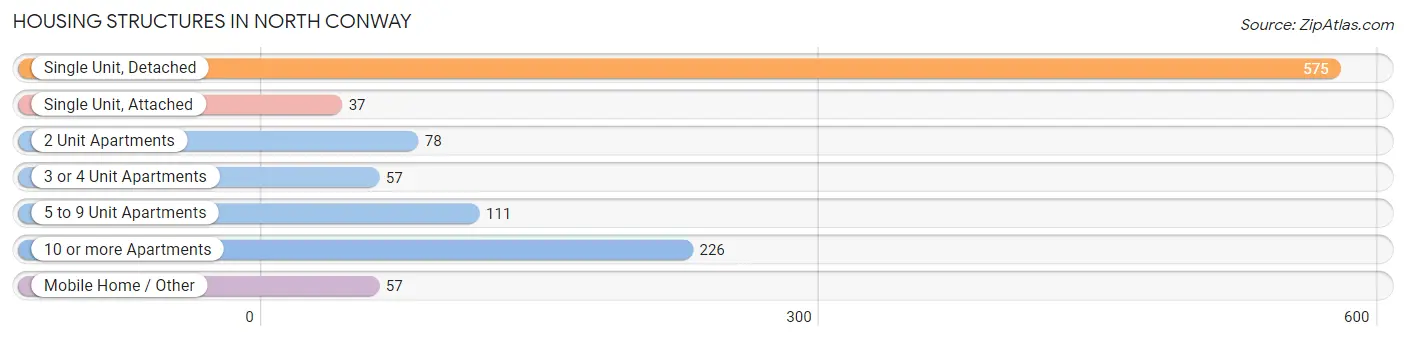
| Structure Type | # Housing Units | % Housing Units |
| Single Unit, Detached | 575 | 50.4% |
| Single Unit, Attached | 37 | 3.2% |
| 2 Unit Apartments | 78 | 6.8% |
| 3 or 4 Unit Apartments | 57 | 5.0% |
| 5 to 9 Unit Apartments | 111 | 9.7% |
| 10 or more Apartments | 226 | 19.8% |
| Mobile Home / Other | 57 | 5.0% |
| Total | 1,141 | 100.0% |
Housing Structures by Occupancy in North Conway
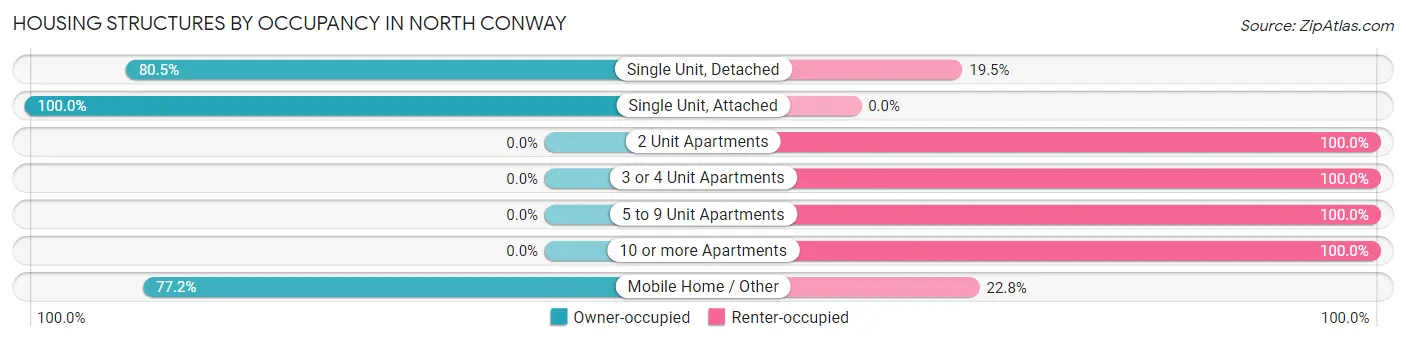
| Structure Type | Owner-occupied | Renter-occupied |
| Single Unit, Detached | 463 (80.5%) | 112 (19.5%) |
| Single Unit, Attached | 37 (100.0%) | 0 (0.0%) |
| 2 Unit Apartments | 0 (0.0%) | 78 (100.0%) |
| 3 or 4 Unit Apartments | 0 (0.0%) | 57 (100.0%) |
| 5 to 9 Unit Apartments | 0 (0.0%) | 111 (100.0%) |
| 10 or more Apartments | 0 (0.0%) | 226 (100.0%) |
| Mobile Home / Other | 44 (77.2%) | 13 (22.8%) |
| Total | 544 (47.7%) | 597 (52.3%) |
Housing Structures by Number of Rooms in North Conway
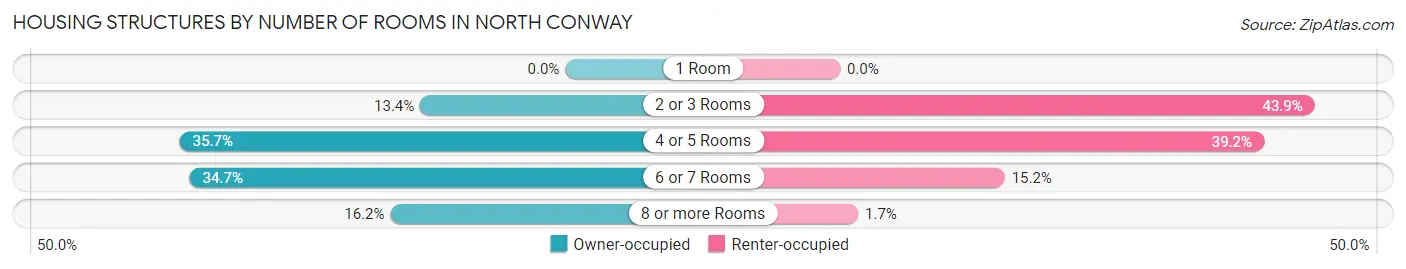
| Number of Rooms | Owner-occupied | Renter-occupied |
| 1 Room | 0 (0.0%) | 0 (0.0%) |
| 2 or 3 Rooms | 73 (13.4%) | 262 (43.9%) |
| 4 or 5 Rooms | 194 (35.7%) | 234 (39.2%) |
| 6 or 7 Rooms | 189 (34.7%) | 91 (15.2%) |
| 8 or more Rooms | 88 (16.2%) | 10 (1.7%) |
| Total | 544 (100.0%) | 597 (100.0%) |
Housing Structure by Heating Type in North Conway
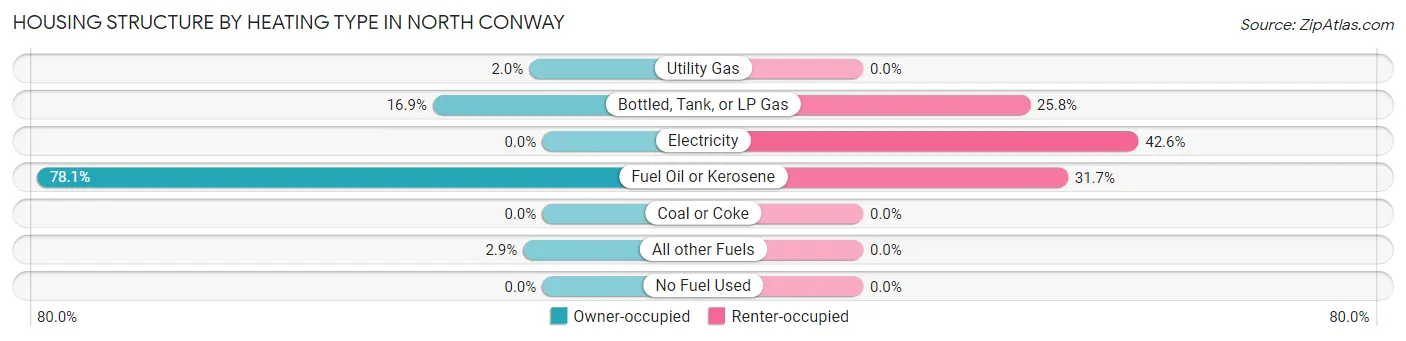
| Heating Type | Owner-occupied | Renter-occupied |
| Utility Gas | 11 (2.0%) | 0 (0.0%) |
| Bottled, Tank, or LP Gas | 92 (16.9%) | 154 (25.8%) |
| Electricity | 0 (0.0%) | 254 (42.5%) |
| Fuel Oil or Kerosene | 425 (78.1%) | 189 (31.7%) |
| Coal or Coke | 0 (0.0%) | 0 (0.0%) |
| All other Fuels | 16 (2.9%) | 0 (0.0%) |
| No Fuel Used | 0 (0.0%) | 0 (0.0%) |
| Total | 544 (100.0%) | 597 (100.0%) |
Household Vehicle Usage in North Conway
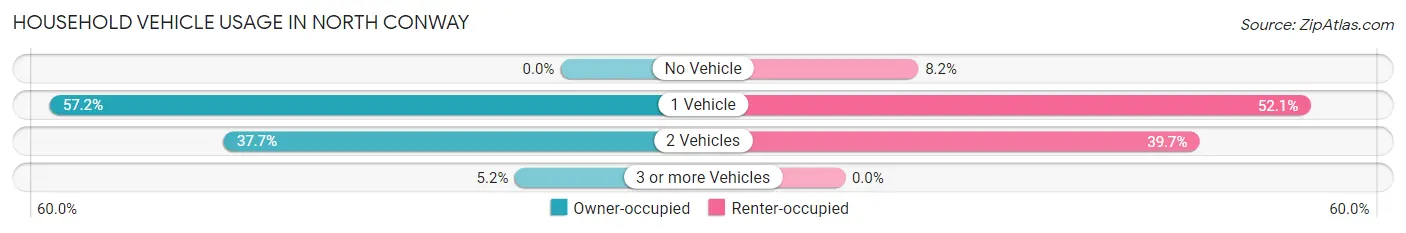
| Vehicles per Household | Owner-occupied | Renter-occupied |
| No Vehicle | 0 (0.0%) | 49 (8.2%) |
| 1 Vehicle | 311 (57.2%) | 311 (52.1%) |
| 2 Vehicles | 205 (37.7%) | 237 (39.7%) |
| 3 or more Vehicles | 28 (5.1%) | 0 (0.0%) |
| Total | 544 (100.0%) | 597 (100.0%) |
Real Estate & Mortgages in North Conway
Real Estate and Mortgage Overview in North Conway
| Characteristic | Without Mortgage | With Mortgage |
| Housing Units | 305 | 239 |
| Median Property Value | - | - |
| Median Household Income | $86,020 | $11 |
| Monthly Housing Costs | $708 | $111 |
| Real Estate Taxes | $4,798 | $0 |
Property Value by Mortgage Status in North Conway
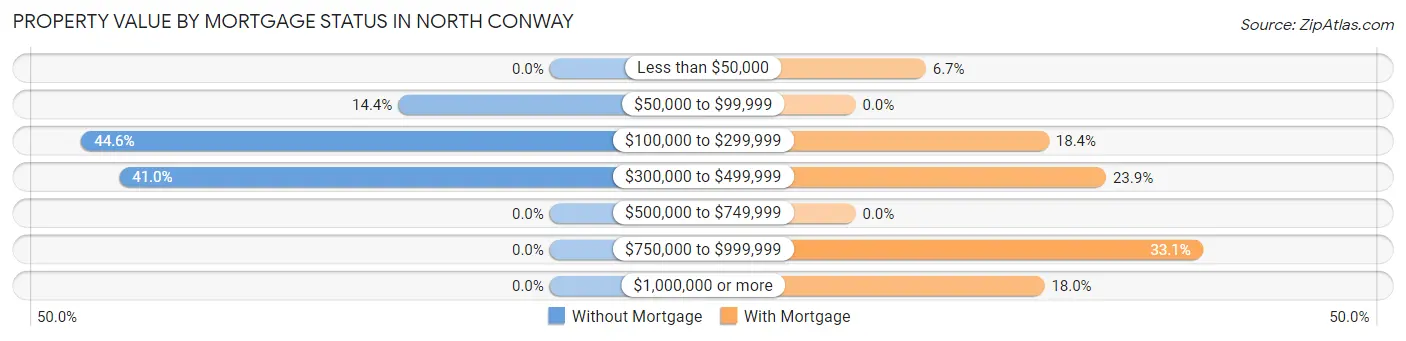
| Property Value | Without Mortgage | With Mortgage |
| Less than $50,000 | 0 (0.0%) | 16 (6.7%) |
| $50,000 to $99,999 | 44 (14.4%) | 0 (0.0%) |
| $100,000 to $299,999 | 136 (44.6%) | 44 (18.4%) |
| $300,000 to $499,999 | 125 (41.0%) | 57 (23.8%) |
| $500,000 to $749,999 | 0 (0.0%) | 0 (0.0%) |
| $750,000 to $999,999 | 0 (0.0%) | 79 (33.1%) |
| $1,000,000 or more | 0 (0.0%) | 43 (18.0%) |
| Total | 305 (100.0%) | 239 (100.0%) |
Household Income by Mortgage Status in North Conway
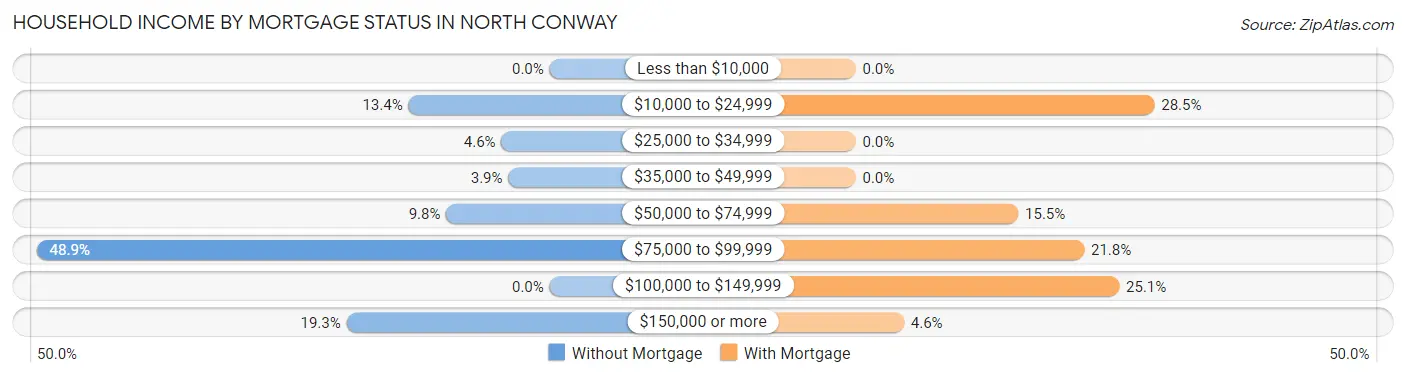
| Household Income | Without Mortgage | With Mortgage |
| Less than $10,000 | 0 (0.0%) | 0 (0.0%) |
| $10,000 to $24,999 | 41 (13.4%) | 68 (28.4%) |
| $25,000 to $34,999 | 14 (4.6%) | 0 (0.0%) |
| $35,000 to $49,999 | 12 (3.9%) | 0 (0.0%) |
| $50,000 to $74,999 | 30 (9.8%) | 37 (15.5%) |
| $75,000 to $99,999 | 149 (48.8%) | 52 (21.8%) |
| $100,000 to $149,999 | 0 (0.0%) | 60 (25.1%) |
| $150,000 or more | 59 (19.3%) | 11 (4.6%) |
| Total | 305 (100.0%) | 239 (100.0%) |
Property Value to Household Income Ratio in North Conway
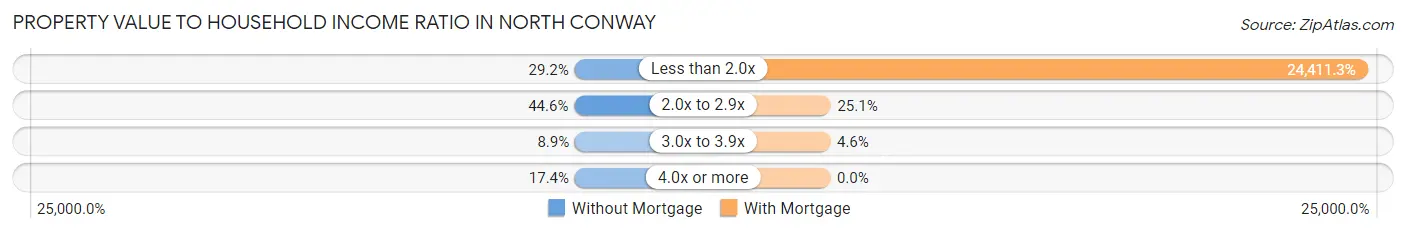
| Value-to-Income Ratio | Without Mortgage | With Mortgage |
| Less than 2.0x | 89 (29.2%) | 58,343 (24,411.3%) |
| 2.0x to 2.9x | 136 (44.6%) | 60 (25.1%) |
| 3.0x to 3.9x | 27 (8.8%) | 11 (4.6%) |
| 4.0x or more | 53 (17.4%) | 0 (0.0%) |
| Total | 305 (100.0%) | 239 (100.0%) |
Real Estate Taxes by Mortgage Status in North Conway
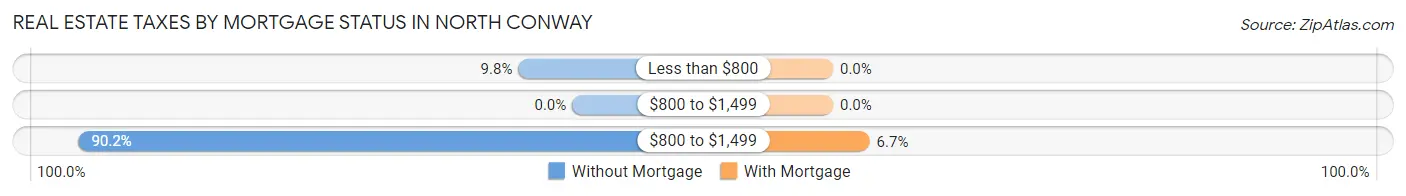
| Property Taxes | Without Mortgage | With Mortgage |
| Less than $800 | 30 (9.8%) | 0 (0.0%) |
| $800 to $1,499 | 0 (0.0%) | 0 (0.0%) |
| $800 to $1,499 | 275 (90.2%) | 16 (6.7%) |
| Total | 305 (100.0%) | 239 (100.0%) |
Health & Disability in North Conway
Health Insurance Coverage by Age in North Conway
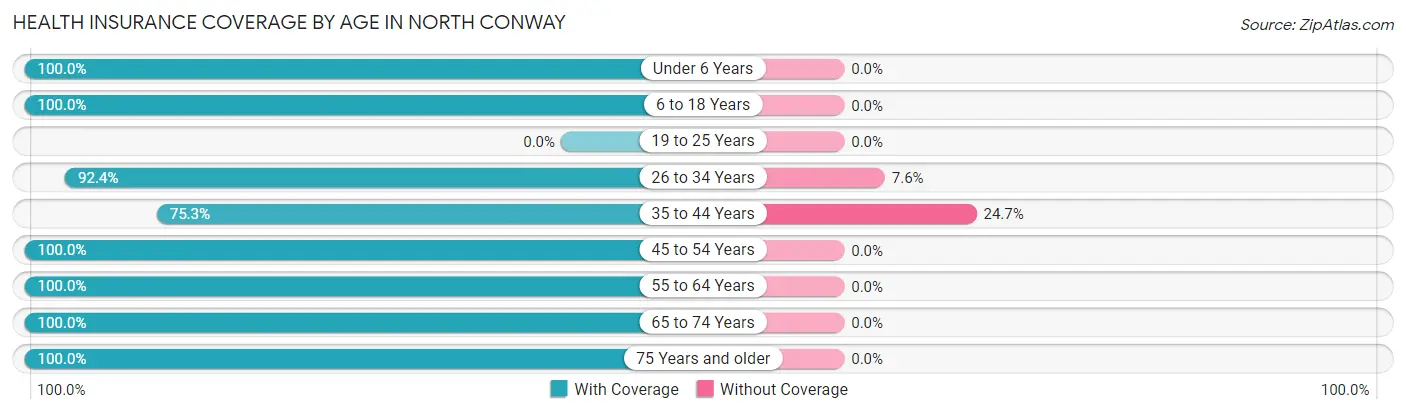
| Age Bracket | With Coverage | Without Coverage |
| Under 6 Years | 89 (100.0%) | 0 (0.0%) |
| 6 to 18 Years | 243 (100.0%) | 0 (0.0%) |
| 19 to 25 Years | 0 (0.0%) | 0 (0.0%) |
| 26 to 34 Years | 330 (92.4%) | 27 (7.6%) |
| 35 to 44 Years | 168 (75.3%) | 55 (24.7%) |
| 45 to 54 Years | 98 (100.0%) | 0 (0.0%) |
| 55 to 64 Years | 518 (100.0%) | 0 (0.0%) |
| 65 to 74 Years | 248 (100.0%) | 0 (0.0%) |
| 75 Years and older | 184 (100.0%) | 0 (0.0%) |
| Total | 1,878 (95.8%) | 82 (4.2%) |
Health Insurance Coverage by Citizenship Status in North Conway
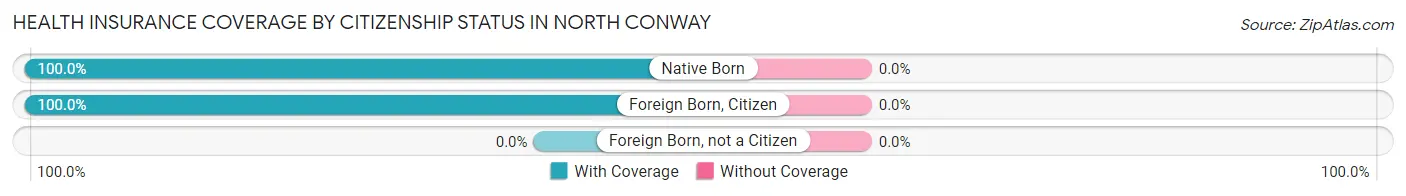
| Citizenship Status | With Coverage | Without Coverage |
| Native Born | 89 (100.0%) | 0 (0.0%) |
| Foreign Born, Citizen | 243 (100.0%) | 0 (0.0%) |
| Foreign Born, not a Citizen | 0 (0.0%) | 0 (0.0%) |
Health Insurance Coverage by Household Income in North Conway
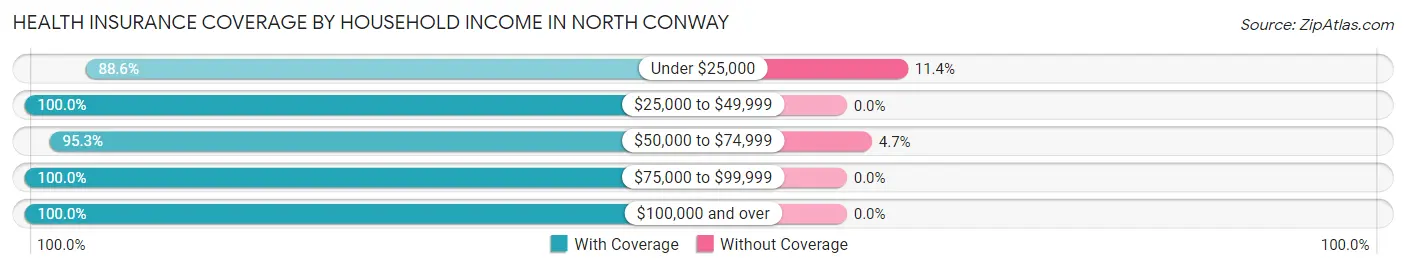
| Household Income | With Coverage | Without Coverage |
| Under $25,000 | 426 (88.6%) | 55 (11.4%) |
| $25,000 to $49,999 | 191 (100.0%) | 0 (0.0%) |
| $50,000 to $74,999 | 547 (95.3%) | 27 (4.7%) |
| $75,000 to $99,999 | 595 (100.0%) | 0 (0.0%) |
| $100,000 and over | 119 (100.0%) | 0 (0.0%) |
Public vs Private Health Insurance Coverage by Age in North Conway
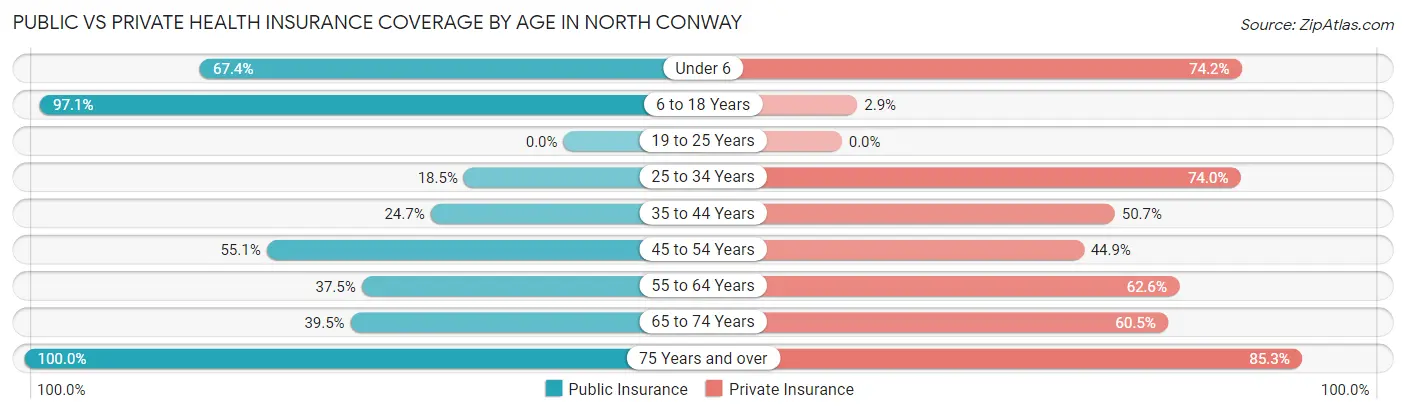
| Age Bracket | Public Insurance | Private Insurance |
| Under 6 | 60 (67.4%) | 66 (74.2%) |
| 6 to 18 Years | 236 (97.1%) | 7 (2.9%) |
| 19 to 25 Years | 0 (0.0%) | 0 (0.0%) |
| 25 to 34 Years | 66 (18.5%) | 264 (74.0%) |
| 35 to 44 Years | 55 (24.7%) | 113 (50.7%) |
| 45 to 54 Years | 54 (55.1%) | 44 (44.9%) |
| 55 to 64 Years | 194 (37.4%) | 324 (62.5%) |
| 65 to 74 Years | 98 (39.5%) | 150 (60.5%) |
| 75 Years and over | 184 (100.0%) | 157 (85.3%) |
| Total | 947 (48.3%) | 1,125 (57.4%) |
Disability Status by Sex by Age in North Conway
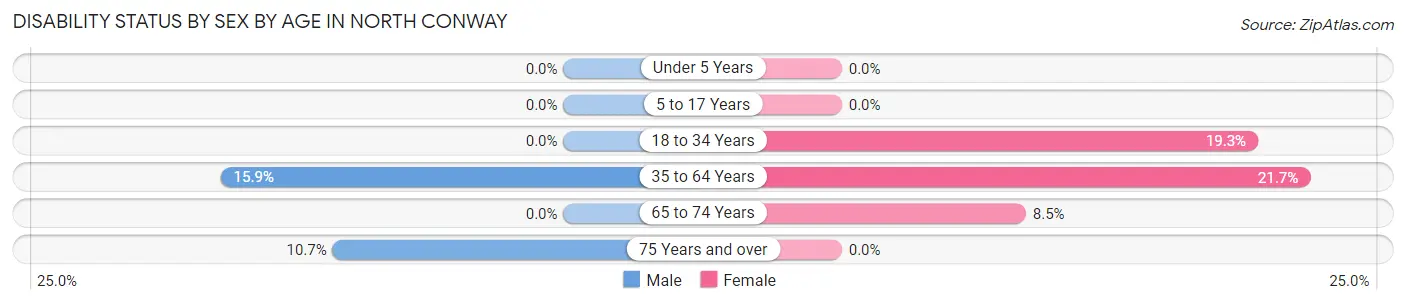
| Age Bracket | Male | Female |
| Under 5 Years | 0 (0.0%) | 0 (0.0%) |
| 5 to 17 Years | 0 (0.0%) | 0 (0.0%) |
| 18 to 34 Years | 0 (0.0%) | 28 (19.3%) |
| 35 to 64 Years | 80 (15.9%) | 73 (21.7%) |
| 65 to 74 Years | 0 (0.0%) | 14 (8.5%) |
| 75 Years and over | 6 (10.7%) | 0 (0.0%) |
Disability Class by Sex by Age in North Conway
Disability Class: Hearing Difficulty
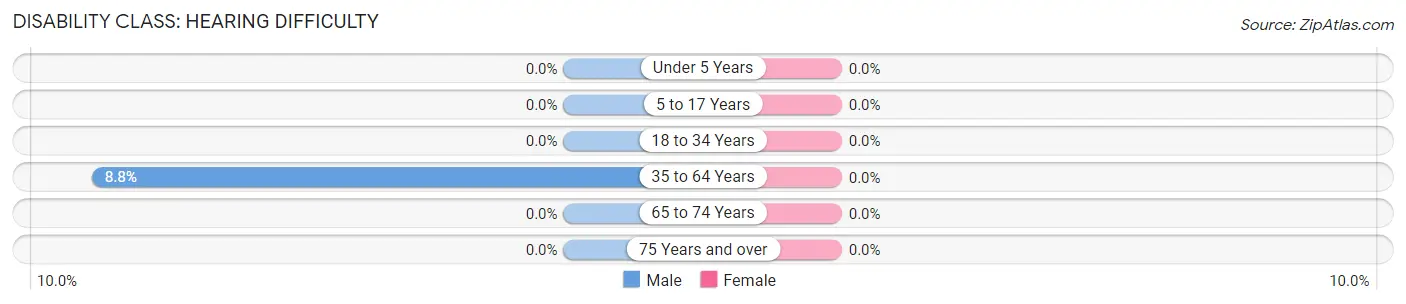
| Age Bracket | Male | Female |
| Under 5 Years | 0 (0.0%) | 0 (0.0%) |
| 5 to 17 Years | 0 (0.0%) | 0 (0.0%) |
| 18 to 34 Years | 0 (0.0%) | 0 (0.0%) |
| 35 to 64 Years | 44 (8.7%) | 0 (0.0%) |
| 65 to 74 Years | 0 (0.0%) | 0 (0.0%) |
| 75 Years and over | 0 (0.0%) | 0 (0.0%) |
Disability Class: Vision Difficulty
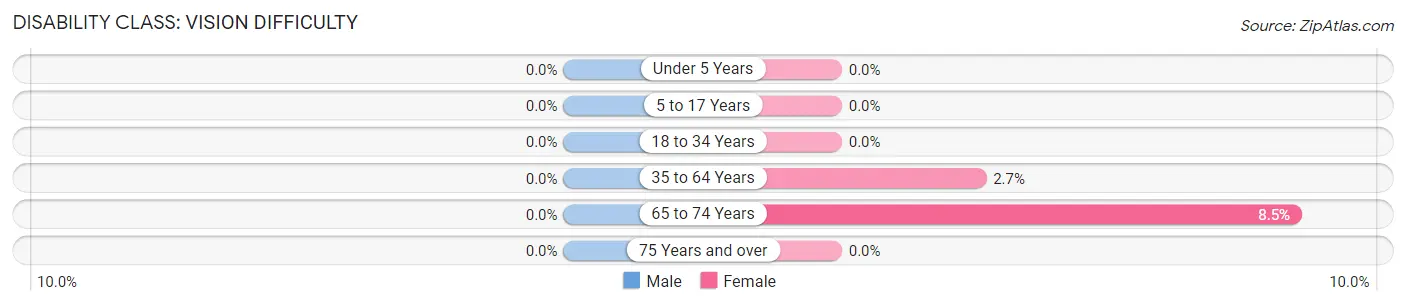
| Age Bracket | Male | Female |
| Under 5 Years | 0 (0.0%) | 0 (0.0%) |
| 5 to 17 Years | 0 (0.0%) | 0 (0.0%) |
| 18 to 34 Years | 0 (0.0%) | 0 (0.0%) |
| 35 to 64 Years | 0 (0.0%) | 9 (2.7%) |
| 65 to 74 Years | 0 (0.0%) | 14 (8.5%) |
| 75 Years and over | 0 (0.0%) | 0 (0.0%) |
Disability Class: Cognitive Difficulty
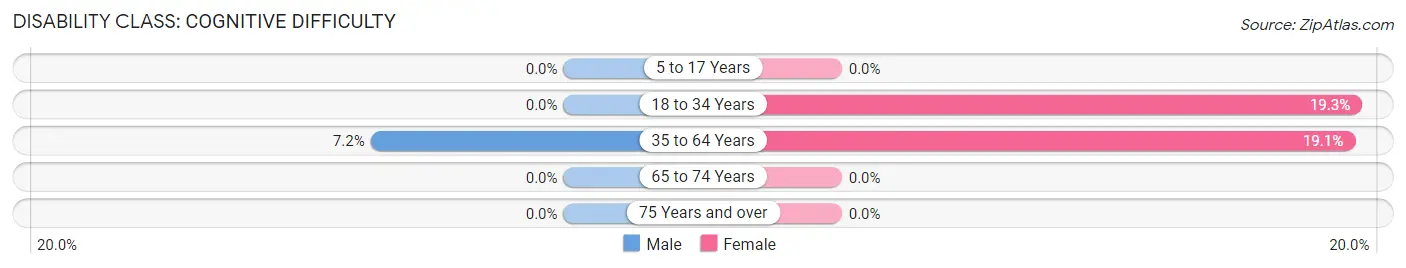
| Age Bracket | Male | Female |
| 5 to 17 Years | 0 (0.0%) | 0 (0.0%) |
| 18 to 34 Years | 0 (0.0%) | 28 (19.3%) |
| 35 to 64 Years | 36 (7.2%) | 64 (19.1%) |
| 65 to 74 Years | 0 (0.0%) | 0 (0.0%) |
| 75 Years and over | 0 (0.0%) | 0 (0.0%) |
Disability Class: Ambulatory Difficulty
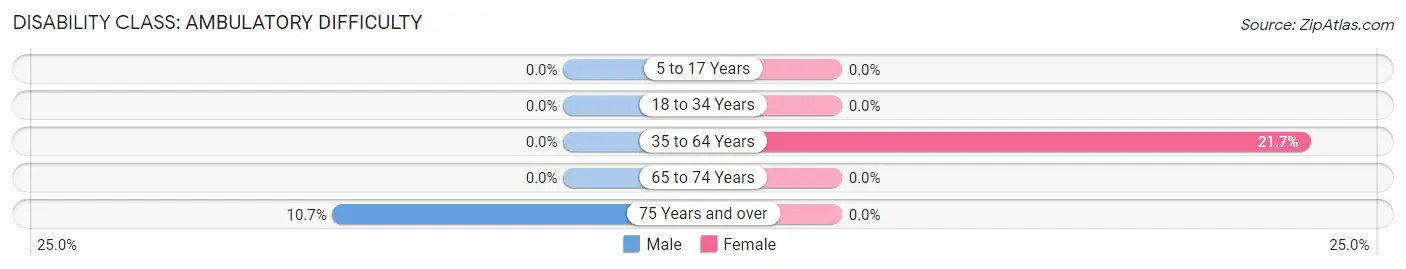
| Age Bracket | Male | Female |
| 5 to 17 Years | 0 (0.0%) | 0 (0.0%) |
| 18 to 34 Years | 0 (0.0%) | 0 (0.0%) |
| 35 to 64 Years | 0 (0.0%) | 73 (21.7%) |
| 65 to 74 Years | 0 (0.0%) | 0 (0.0%) |
| 75 Years and over | 6 (10.7%) | 0 (0.0%) |
Disability Class: Self-Care Difficulty
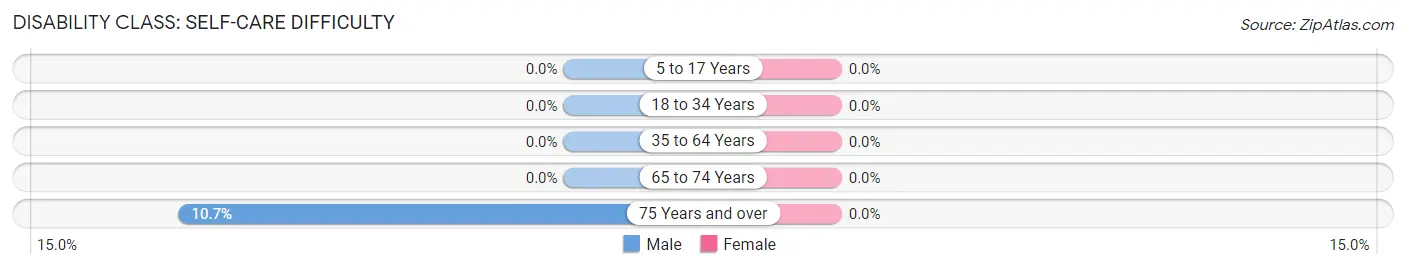
| Age Bracket | Male | Female |
| 5 to 17 Years | 0 (0.0%) | 0 (0.0%) |
| 18 to 34 Years | 0 (0.0%) | 0 (0.0%) |
| 35 to 64 Years | 0 (0.0%) | 0 (0.0%) |
| 65 to 74 Years | 0 (0.0%) | 0 (0.0%) |
| 75 Years and over | 6 (10.7%) | 0 (0.0%) |
Technology Access in North Conway
Computing Device Access in North Conway
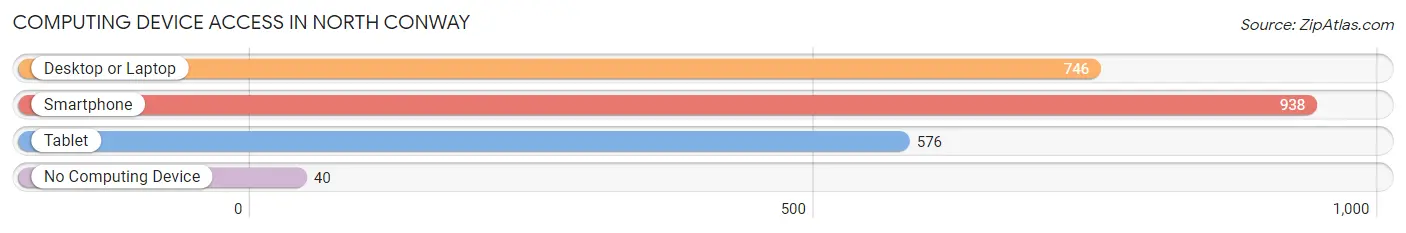
| Device Type | # Households | % Households |
| Desktop or Laptop | 746 | 65.4% |
| Smartphone | 938 | 82.2% |
| Tablet | 576 | 50.5% |
| No Computing Device | 40 | 3.5% |
| Total | 1,141 | 100.0% |
Internet Access in North Conway
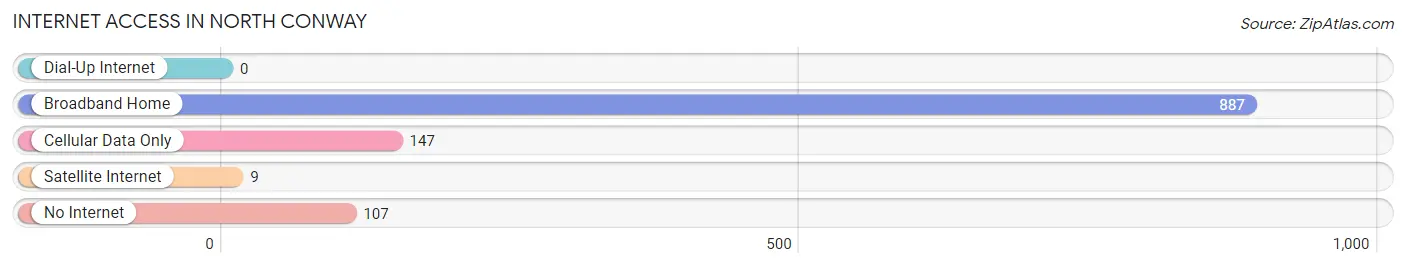
| Internet Type | # Households | % Households |
| Dial-Up Internet | 0 | 0.0% |
| Broadband Home | 887 | 77.7% |
| Cellular Data Only | 147 | 12.9% |
| Satellite Internet | 9 | 0.8% |
| No Internet | 107 | 9.4% |
| Total | 1,141 | 100.0% |
North Conway Summary
Conway, New Hampshire is a small town located in the White Mountains of New Hampshire. It is a popular tourist destination due to its proximity to the White Mountains National Forest and the many outdoor activities available in the area. The town has a population of 2,349 as of the 2010 census, and is part of the Mount Washington Valley region.
History
The area that is now Conway was first settled in 1765 by a group of settlers from Massachusetts. The town was originally called Pequawket, after the local Native American tribe. The town was renamed Conway in 1767, after General Henry Seymour Conway, a British general who served in the American Revolution.
The town was an important stop on the stagecoach route between Portland, Maine and Montreal, Canada. The stagecoach route was replaced by the Portland and Ogdensburg Railroad in 1851, which connected Conway to Portland and Montreal. The railroad was later replaced by the Conway Scenic Railroad, which is still in operation today.
The town was also an important stop on the Underground Railroad, which was used by escaped slaves to travel to freedom in Canada. The town was home to several prominent abolitionists, including Reverend John Murray, who was a leader in the movement.
Geography
Conway is located in the White Mountains of New Hampshire, in the Mount Washington Valley region. The town is bordered by the towns of Albany to the north, Bartlett to the east, Madison to the south, and Fryeburg, Maine to the west.
The town is located in the Saco River Valley, and is surrounded by the White Mountains. The highest point in the town is Mount Kearsarge, which has an elevation of 2,937 feet.
The town is home to several lakes, including Conway Lake, Silver Lake, and Echo Lake. The town is also home to several ski resorts, including Cranmore Mountain Resort, Attitash Mountain Resort, and King Pine Ski Area.
Economy
The economy of Conway is largely based on tourism. The town is a popular destination for outdoor activities, such as skiing, snowmobiling, hiking, and camping. The town is also home to several ski resorts, which attract visitors from all over the world.
The town is also home to several businesses, including restaurants, hotels, and retail stores. The town is also home to several manufacturing companies, including a paper mill and a furniture factory.
Demographics
As of the 2010 census, the population of Conway was 2,349. The racial makeup of the town was 97.3% White, 0.3% African American, 0.3% Native American, 0.7% Asian, 0.1% Pacific Islander, 0.2% from other races, and 1.2% from two or more races. Hispanic or Latino of any race were 1.2% of the population.
The median income for a household in the town was $45,938, and the median income for a family was $51,938. The per capita income for the town was $22,938. About 8.3% of families and 11.2% of the population were below the poverty line, including 16.2% of those under age 18 and 5.2% of those age 65 or over.
Common Questions
What is Per Capita Income in North Conway?
Per Capita income in North Conway is $46,610.
What is the Median Family Income in North Conway?
Median Family Income in North Conway is $66,776.
What is the Median Household income in North Conway?
Median Household Income in North Conway is $59,041.
What is Inequality or Gini Index in North Conway?
Inequality or Gini Index in North Conway is 0.57.
What is the Total Population of North Conway?
Total Population of North Conway is 2,079.
What is the Total Male Population of North Conway?
Total Male Population of North Conway is 1,127.
What is the Total Female Population of North Conway?
Total Female Population of North Conway is 952.
What is the Ratio of Males per 100 Females in North Conway?
There are 118.38 Males per 100 Females in North Conway.
What is the Ratio of Females per 100 Males in North Conway?
There are 84.47 Females per 100 Males in North Conway.
What is the Median Population Age in North Conway?
Median Population Age in North Conway is 57.1 Years.
What is the Average Family Size in North Conway
Average Family Size in North Conway is 2.6 People.
What is the Average Household Size in North Conway
Average Household Size in North Conway is 1.7 People.
How Large is the Labor Force in North Conway?
There are 1,272 People in the Labor Forcein in North Conway.
What is the Percentage of People in the Labor Force in North Conway?
68.4% of People are in the Labor Force in North Conway.
What is the Unemployment Rate in North Conway?
Unemployment Rate in North Conway is 5.2%.