Warner, NH Map & Demographics
Warner Map
Warner Overview
$39,876
PER CAPITA INCOME
$40,887
AVG HOUSEHOLD INCOME
49.2%
WAGE / INCOME GAP [ % ]
50.8¢/ $1
WAGE / INCOME GAP [ $ ]
0.49
INEQUALITY / GINI INDEX
425
TOTAL POPULATION
130
MALE POPULATION
295
FEMALE POPULATION
44.07
MALES / 100 FEMALES
226.92
FEMALES / 100 MALES
47.0
MEDIAN AGE
2.0
AVG FAMILY SIZE
1.5
AVG HOUSEHOLD SIZE
170
LABOR FORCE [ PEOPLE ]
46.7%
PERCENT IN LABOR FORCE
Warner Zip Codes
Warner Area Codes
Income in Warner
Income Overview in Warner
| Characteristic | Number | Measure |
| Per Capita Income | 425 | $39,876 |
| Median Family Income | 127 | $0 |
| Mean Family Income | 127 | $100,416 |
| Median Household Income | 280 | $40,887 |
| Mean Household Income | 280 | $65,196 |
| Income Deficit | 127 | $0 |
| Wage / Income Gap (%) | 425 | 49.21% |
| Wage / Income Gap ($) | 425 | 50.79¢ per $1 |
| Gini / Inequality Index | 425 | 0.49 |
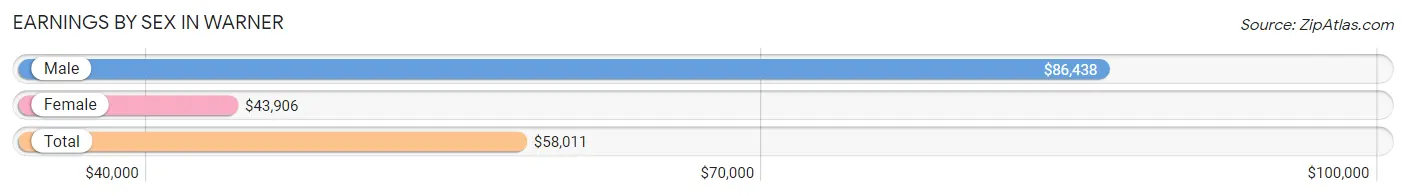
Earnings by Sex in Warner
Average Earnings in Warner are $58,011, $86,438 for men and $43,906 for women, a difference of 49.2%.
| Sex | Number | Average Earnings |
| Male | 71 (35.3%) | $86,438 |
| Female | 130 (64.7%) | $43,906 |
| Total | 201 (100.0%) | $58,011 |
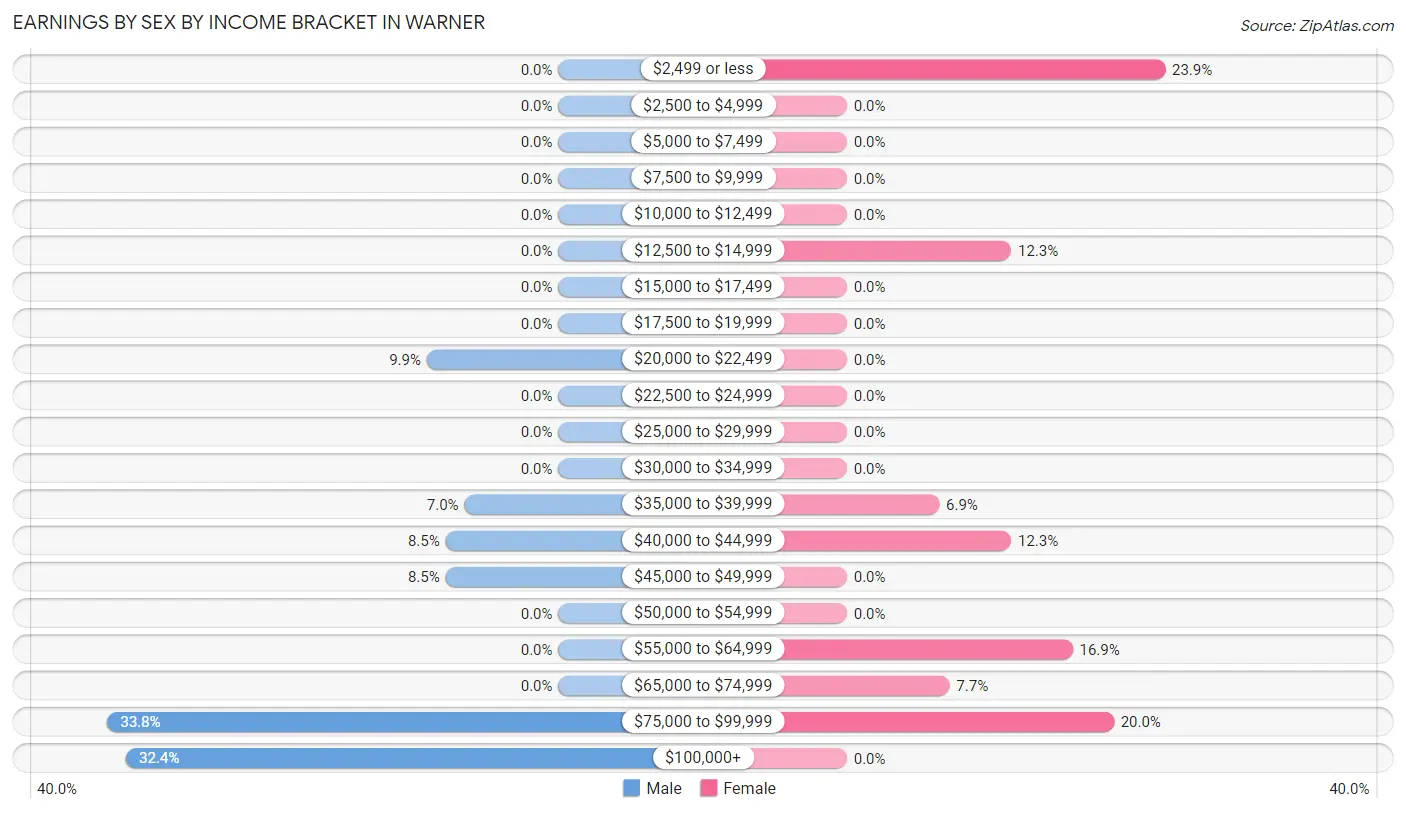
Earnings by Sex by Income Bracket in Warner
The most common earnings brackets in Warner are $75,000 to $99,999 for men (24 | 33.8%) and $2,499 or less for women (31 | 23.8%).
| Income | Male | Female |
| $2,499 or less | 0 (0.0%) | 31 (23.8%) |
| $2,500 to $4,999 | 0 (0.0%) | 0 (0.0%) |
| $5,000 to $7,499 | 0 (0.0%) | 0 (0.0%) |
| $7,500 to $9,999 | 0 (0.0%) | 0 (0.0%) |
| $10,000 to $12,499 | 0 (0.0%) | 0 (0.0%) |
| $12,500 to $14,999 | 0 (0.0%) | 16 (12.3%) |
| $15,000 to $17,499 | 0 (0.0%) | 0 (0.0%) |
| $17,500 to $19,999 | 0 (0.0%) | 0 (0.0%) |
| $20,000 to $22,499 | 7 (9.9%) | 0 (0.0%) |
| $22,500 to $24,999 | 0 (0.0%) | 0 (0.0%) |
| $25,000 to $29,999 | 0 (0.0%) | 0 (0.0%) |
| $30,000 to $34,999 | 0 (0.0%) | 0 (0.0%) |
| $35,000 to $39,999 | 5 (7.0%) | 9 (6.9%) |
| $40,000 to $44,999 | 6 (8.5%) | 16 (12.3%) |
| $45,000 to $49,999 | 6 (8.5%) | 0 (0.0%) |
| $50,000 to $54,999 | 0 (0.0%) | 0 (0.0%) |
| $55,000 to $64,999 | 0 (0.0%) | 22 (16.9%) |
| $65,000 to $74,999 | 0 (0.0%) | 10 (7.7%) |
| $75,000 to $99,999 | 24 (33.8%) | 26 (20.0%) |
| $100,000+ | 23 (32.4%) | 0 (0.0%) |
| Total | 71 (100.0%) | 130 (100.0%) |
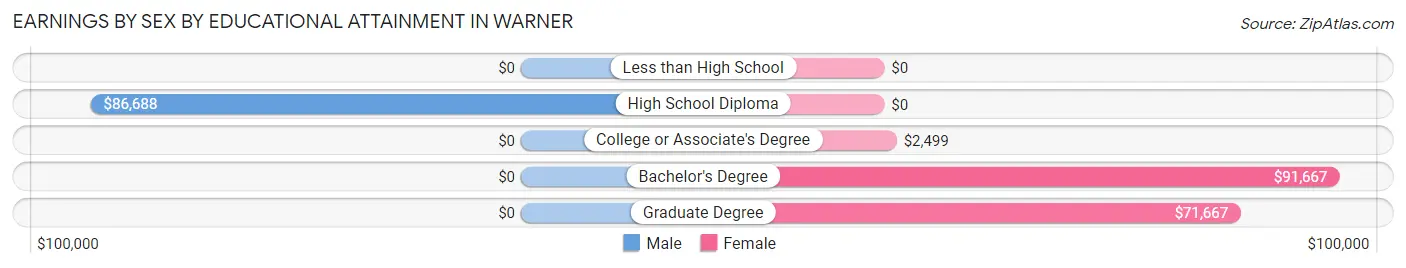
Earnings by Sex by Educational Attainment in Warner
Average earnings in Warner are $86,438 for men and $43,906 for women, a difference of 49.2%. Men with an educational attainment of high school diploma enjoy the highest average annual earnings of $86,688, while those with high school diploma education earn the least with $86,688. Women with an educational attainment of bachelor's degree earn the most with the average annual earnings of $91,667, while those with college or associate's degree education have the smallest earnings of $2,499.
| Educational Attainment | Male Income | Female Income |
| Less than High School | - | - |
| High School Diploma | $86,688 | $0 |
| College or Associate's Degree | - | - |
| Bachelor's Degree | - | - |
| Graduate Degree | - | - |
| Total | $86,438 | $43,906 |
Family Income in Warner
Family Income Brackets in Warner
According to the Warner family income data, there are 60 families falling into the $35,000 to $49,999 income range, which is the most common income bracket and makes up 47.2% of all families.
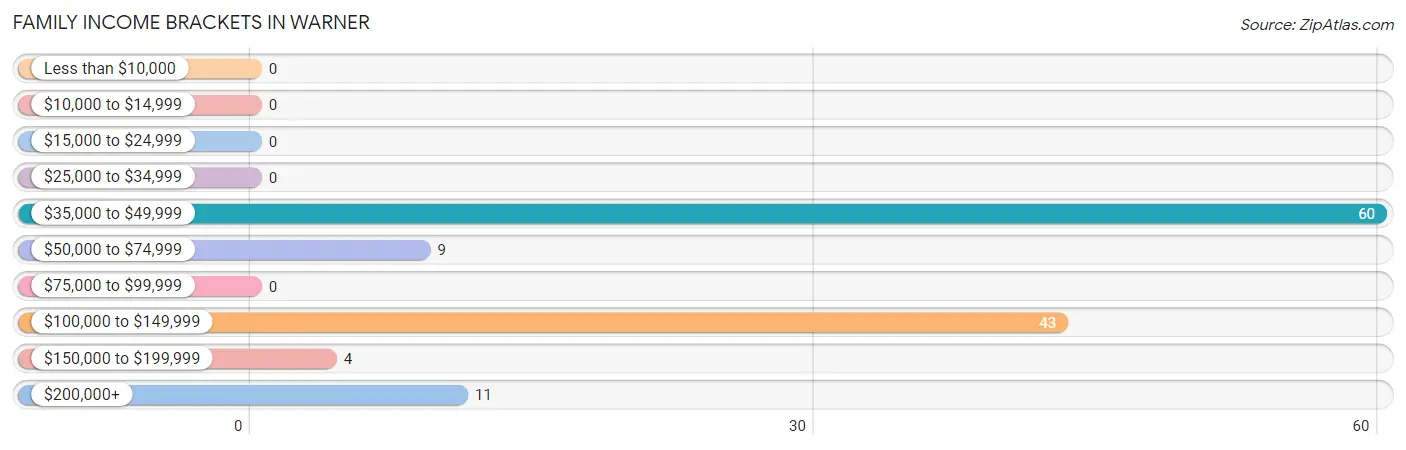
| Income Bracket | # Families | % Families |
| Less than $10,000 | 0 | 0.0% |
| $10,000 to $14,999 | 0 | 0.0% |
| $15,000 to $24,999 | 0 | 0.0% |
| $25,000 to $34,999 | 0 | 0.0% |
| $35,000 to $49,999 | 60 | 47.2% |
| $50,000 to $74,999 | 9 | 7.1% |
| $75,000 to $99,999 | 0 | 0.0% |
| $100,000 to $149,999 | 43 | 33.9% |
| $150,000 to $199,999 | 4 | 3.1% |
| $200,000+ | 11 | 8.7% |
Family Income by Famaliy Size in Warner
2-person families (69 | 54.3%) account for the highest median family income in Warner with $71,042 per family, while 2-person families (69 | 54.3%) have the highest median income of $35,521 per family member.
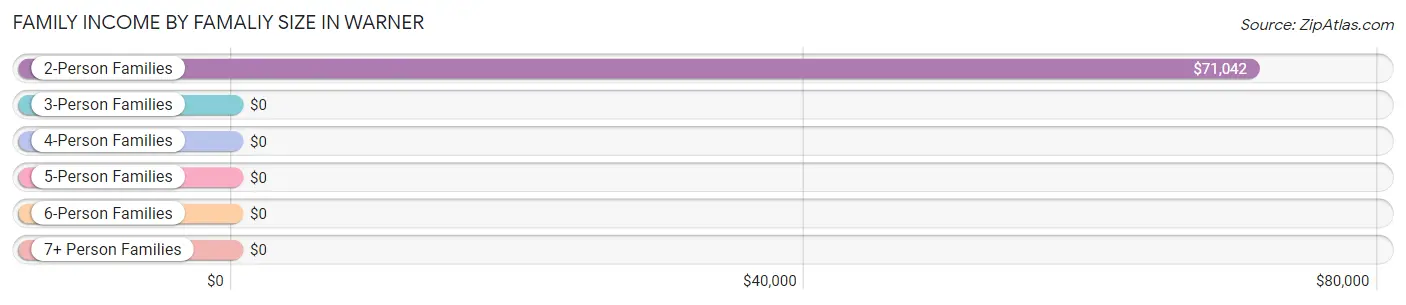
| Income Bracket | # Families | Median Income |
| 2-Person Families | 69 (54.3%) | $71,042 |
| 3-Person Families | 58 (45.7%) | $0 |
| 4-Person Families | 0 (0.0%) | $0 |
| 5-Person Families | 0 (0.0%) | $0 |
| 6-Person Families | 0 (0.0%) | $0 |
| 7+ Person Families | 0 (0.0%) | $0 |
| Total | 127 (100.0%) | $0 |
Family Income by Number of Earners in Warner
| Number of Earners | # Families | Median Income |
| No Earners | 7 (5.5%) | $0 |
| 1 Earner | 50 (39.4%) | $0 |
| 2 Earners | 70 (55.1%) | $0 |
| 3+ Earners | 0 (0.0%) | $0 |
| Total | 127 (100.0%) | $0 |
Household Income in Warner
Household Income Brackets in Warner
With 66 households falling in the category, the $35,000 to $49,999 income range is the most frequent in Warner, accounting for 23.6% of all households.
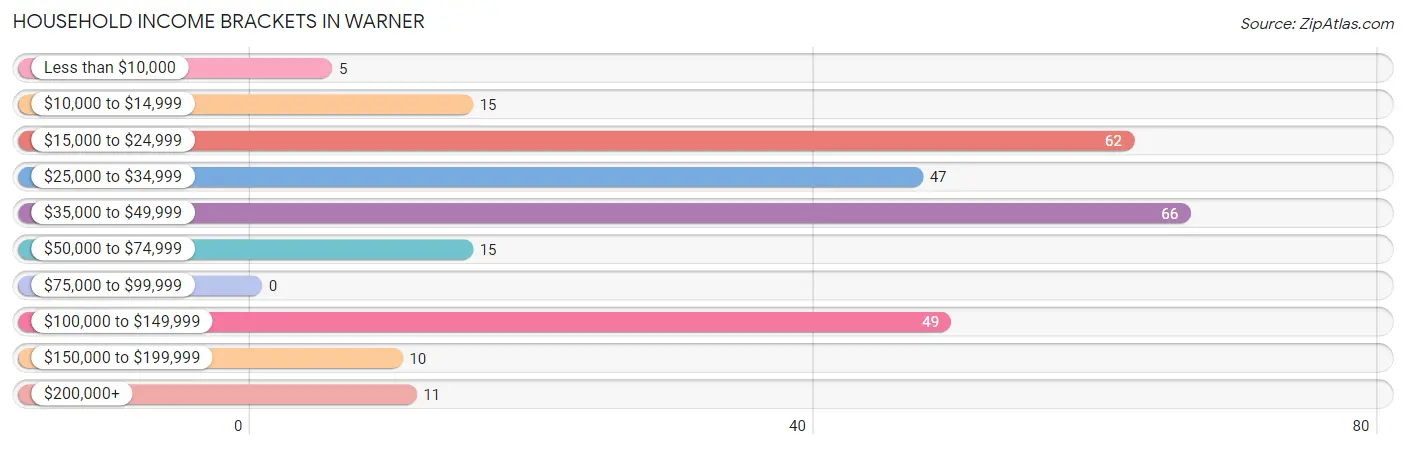
| Income Bracket | # Households | % Households |
| Less than $10,000 | 5 | 1.8% |
| $10,000 to $14,999 | 15 | 5.4% |
| $15,000 to $24,999 | 62 | 22.1% |
| $25,000 to $34,999 | 47 | 16.8% |
| $35,000 to $49,999 | 66 | 23.6% |
| $50,000 to $74,999 | 15 | 5.4% |
| $75,000 to $99,999 | 0 | 0.0% |
| $100,000 to $149,999 | 49 | 17.5% |
| $150,000 to $199,999 | 10 | 3.6% |
| $200,000+ | 11 | 3.9% |
Household Income by Householder Age in Warner
The median household income in Warner is $40,887, with the highest median household income of $24,904 found in the 65+ years age bracket for the primary householder. A total of 143 households (51.1%) fall into this category.
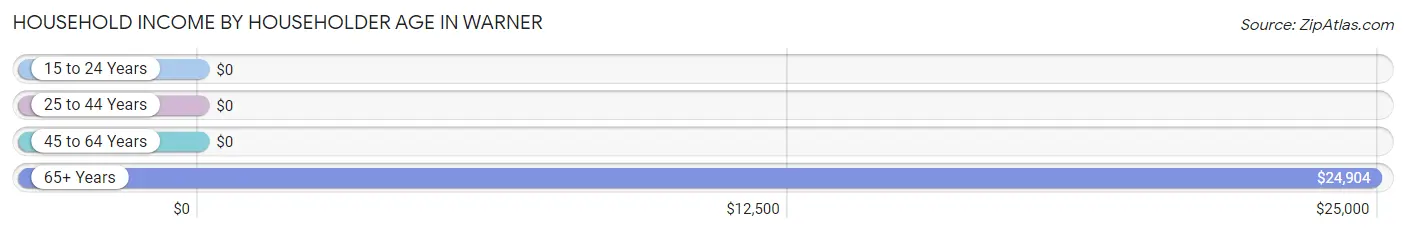
| Income Bracket | # Households | Median Income |
| 15 to 24 Years | 0 (0.0%) | $0 |
| 25 to 44 Years | 81 (28.9%) | $0 |
| 45 to 64 Years | 56 (20.0%) | $0 |
| 65+ Years | 143 (51.1%) | $24,904 |
| Total | 280 (100.0%) | $40,887 |
Poverty in Warner
Income Below Poverty by Sex and Age in Warner
With 3.8% poverty level for males and 5.1% for females among the residents of Warner, 55 to 64 year old males and 75 year old and over females are the most vulnerable to poverty, with 5 males (19.2%) and 15 females (17.2%) in their respective age groups living below the poverty level.
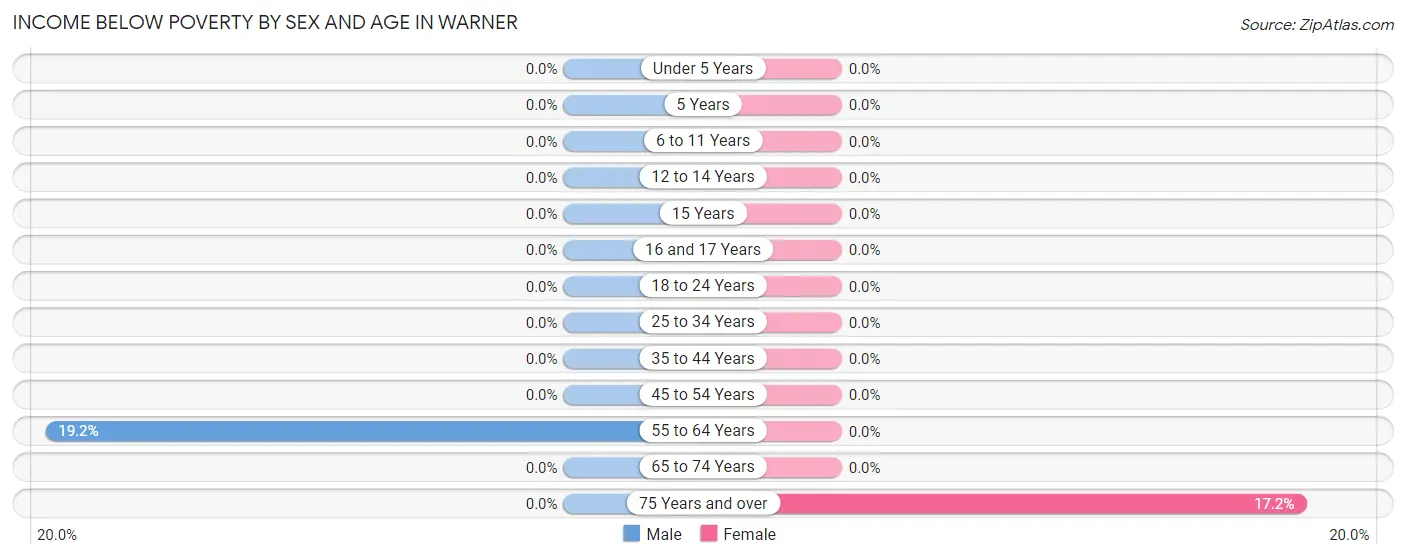
| Age Bracket | Male | Female |
| Under 5 Years | 0 (0.0%) | 0 (0.0%) |
| 5 Years | 0 (0.0%) | 0 (0.0%) |
| 6 to 11 Years | 0 (0.0%) | 0 (0.0%) |
| 12 to 14 Years | 0 (0.0%) | 0 (0.0%) |
| 15 Years | 0 (0.0%) | 0 (0.0%) |
| 16 and 17 Years | 0 (0.0%) | 0 (0.0%) |
| 18 to 24 Years | 0 (0.0%) | 0 (0.0%) |
| 25 to 34 Years | 0 (0.0%) | 0 (0.0%) |
| 35 to 44 Years | 0 (0.0%) | 0 (0.0%) |
| 45 to 54 Years | 0 (0.0%) | 0 (0.0%) |
| 55 to 64 Years | 5 (19.2%) | 0 (0.0%) |
| 65 to 74 Years | 0 (0.0%) | 0 (0.0%) |
| 75 Years and over | 0 (0.0%) | 15 (17.2%) |
| Total | 5 (3.8%) | 15 (5.1%) |
Income Above Poverty by Sex and Age in Warner
According to the poverty statistics in Warner, males aged under 5 years and females aged under 5 years are the age groups that are most secure financially, with 100.0% of males and 100.0% of females in these age groups living above the poverty line.
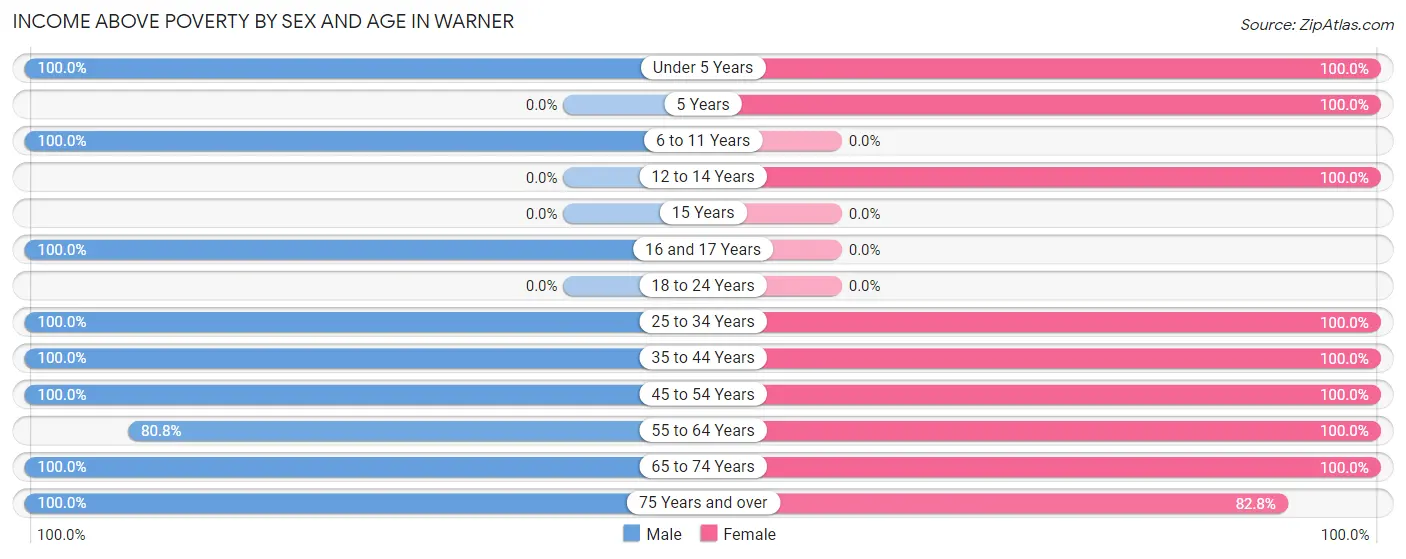
| Age Bracket | Male | Female |
| Under 5 Years | 16 (100.0%) | 21 (100.0%) |
| 5 Years | 0 (0.0%) | 5 (100.0%) |
| 6 to 11 Years | 4 (100.0%) | 0 (0.0%) |
| 12 to 14 Years | 0 (0.0%) | 15 (100.0%) |
| 15 Years | 0 (0.0%) | 0 (0.0%) |
| 16 and 17 Years | 12 (100.0%) | 0 (0.0%) |
| 18 to 24 Years | 0 (0.0%) | 0 (0.0%) |
| 25 to 34 Years | 38 (100.0%) | 68 (100.0%) |
| 35 to 44 Years | 7 (100.0%) | 12 (100.0%) |
| 45 to 54 Years | 12 (100.0%) | 24 (100.0%) |
| 55 to 64 Years | 21 (80.8%) | 15 (100.0%) |
| 65 to 74 Years | 12 (100.0%) | 48 (100.0%) |
| 75 Years and over | 3 (100.0%) | 72 (82.8%) |
| Total | 125 (96.2%) | 280 (94.9%) |
Income Below Poverty Among Married-Couple Families in Warner
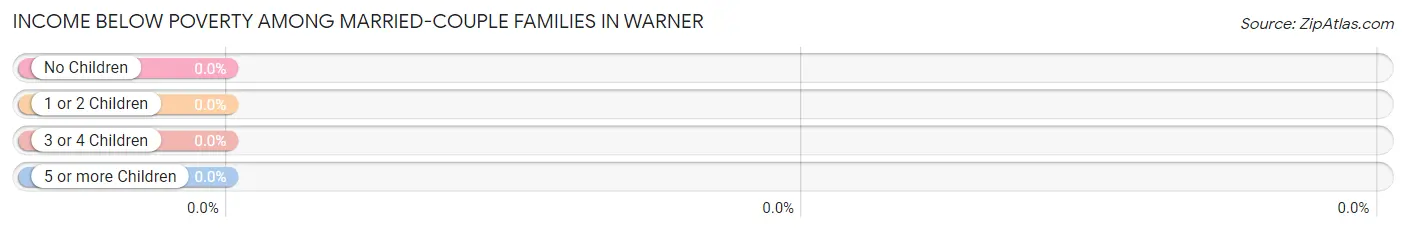
| Children | Above Poverty | Below Poverty |
| No Children | 29 (100.0%) | 0 (0.0%) |
| 1 or 2 Children | 53 (100.0%) | 0 (0.0%) |
| 3 or 4 Children | 0 (0.0%) | 0 (0.0%) |
| 5 or more Children | 0 (0.0%) | 0 (0.0%) |
| Total | 82 (100.0%) | 0 (0.0%) |
Income Below Poverty Among Single-Parent Households in Warner
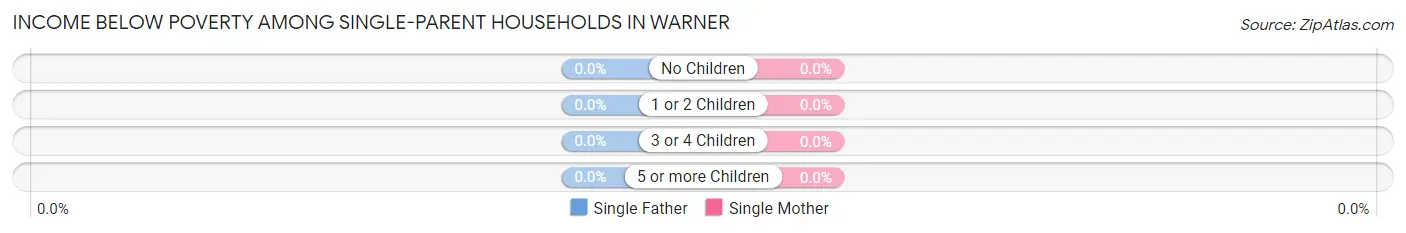
| Children | Single Father | Single Mother |
| No Children | 0 (0.0%) | 0 (0.0%) |
| 1 or 2 Children | 0 (0.0%) | 0 (0.0%) |
| 3 or 4 Children | 0 (0.0%) | 0 (0.0%) |
| 5 or more Children | 0 (0.0%) | 0 (0.0%) |
| Total | 0 (0.0%) | 0 (0.0%) |
Income Below Poverty Among Married-Couple vs Single-Parent Households in Warner
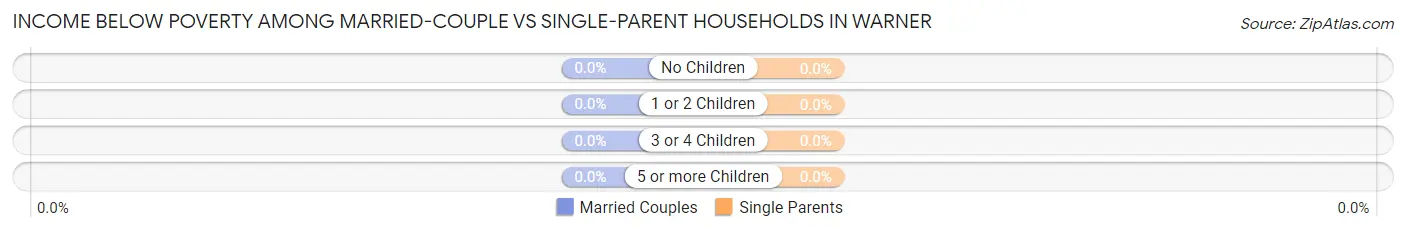
| Children | Married-Couple Families | Single-Parent Households |
| No Children | 0 (0.0%) | 0 (0.0%) |
| 1 or 2 Children | 0 (0.0%) | 0 (0.0%) |
| 3 or 4 Children | 0 (0.0%) | 0 (0.0%) |
| 5 or more Children | 0 (0.0%) | 0 (0.0%) |
| Total | 0 (0.0%) | 0 (0.0%) |
Race in Warner
The most populous races in Warner are White / Caucasian (400 | 94.1%), Hispanic or Latino (29 | 6.8%), and Two or more Races (21 | 4.9%).
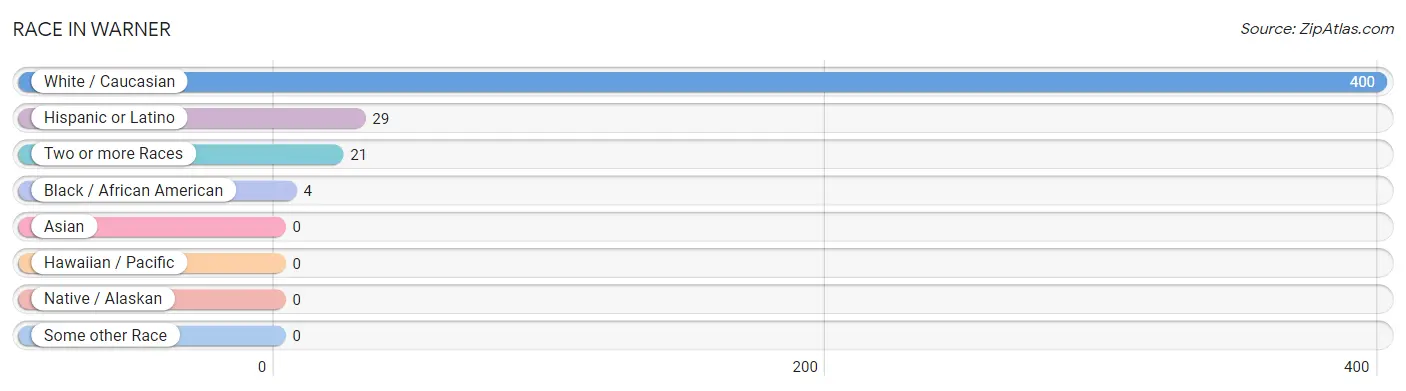
| Race | # Population | % Population |
| Asian | 0 | 0.0% |
| Black / African American | 4 | 0.9% |
| Hawaiian / Pacific | 0 | 0.0% |
| Hispanic or Latino | 29 | 6.8% |
| Native / Alaskan | 0 | 0.0% |
| White / Caucasian | 400 | 94.1% |
| Two or more Races | 21 | 4.9% |
| Some other Race | 0 | 0.0% |
| Total | 425 | 100.0% |
Ancestry in Warner
The most populous ancestries reported in Warner are English (105 | 24.7%), German (64 | 15.1%), American (63 | 14.8%), Irish (59 | 13.9%), and Scottish (45 | 10.6%), together accounting for 79.1% of all Warner residents.
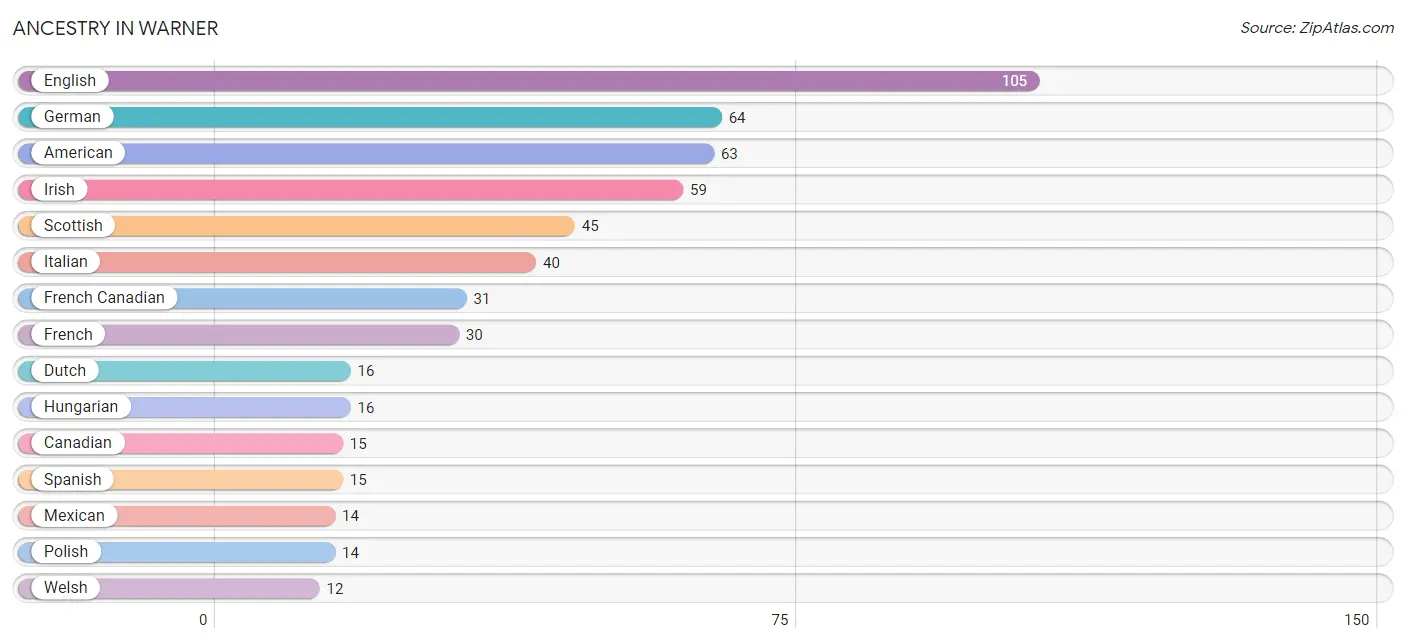
| Ancestry | # Population | % Population |
| American | 63 | 14.8% |
| Armenian | 7 | 1.7% |
| Canadian | 15 | 3.5% |
| Dutch | 16 | 3.8% |
| Eastern European | 6 | 1.4% |
| English | 105 | 24.7% |
| Ethiopian | 4 | 0.9% |
| French | 30 | 7.1% |
| French Canadian | 31 | 7.3% |
| German | 64 | 15.1% |
| Hungarian | 16 | 3.8% |
| Irish | 59 | 13.9% |
| Italian | 40 | 9.4% |
| Mexican | 14 | 3.3% |
| Northern European | 6 | 1.4% |
| Polish | 14 | 3.3% |
| Scottish | 45 | 10.6% |
| Spanish | 15 | 3.5% |
| Subsaharan African | 4 | 0.9% |
| Swedish | 6 | 1.4% |
| Welsh | 12 | 2.8% | View All 21 Rows |
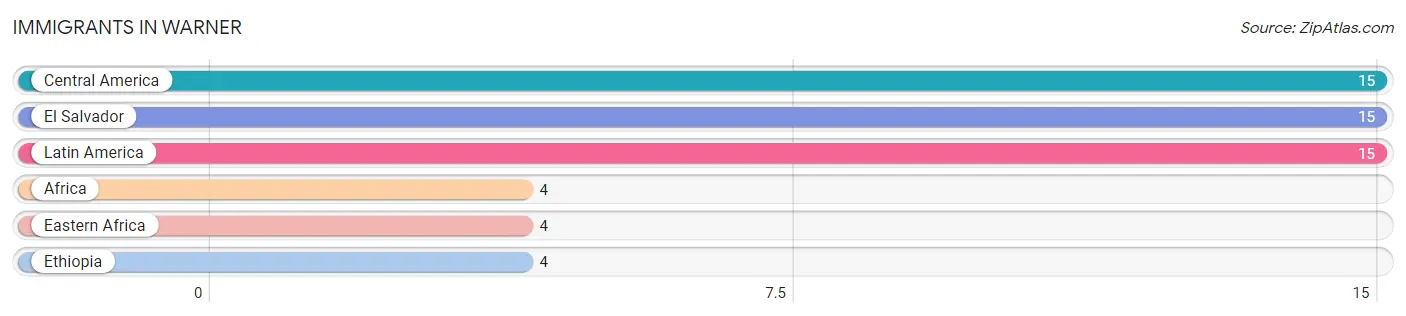
Immigrants in Warner
The most numerous immigrant groups reported in Warner came from Central America (15 | 3.5%), El Salvador (15 | 3.5%), Latin America (15 | 3.5%), Africa (4 | 0.9%), and Eastern Africa (4 | 0.9%), together accounting for 12.5% of all Warner residents.
| Immigration Origin | # Population | % Population |
| Africa | 4 | 0.9% |
| Central America | 15 | 3.5% |
| Eastern Africa | 4 | 0.9% |
| El Salvador | 15 | 3.5% |
| Ethiopia | 4 | 0.9% |
| Latin America | 15 | 3.5% | View All 6 Rows |
Sex and Age in Warner
Sex and Age in Warner
The most populous age groups in Warner are 30 to 34 Years (20 | 15.4%) for men and 25 to 29 Years (62 | 21.0%) for women.
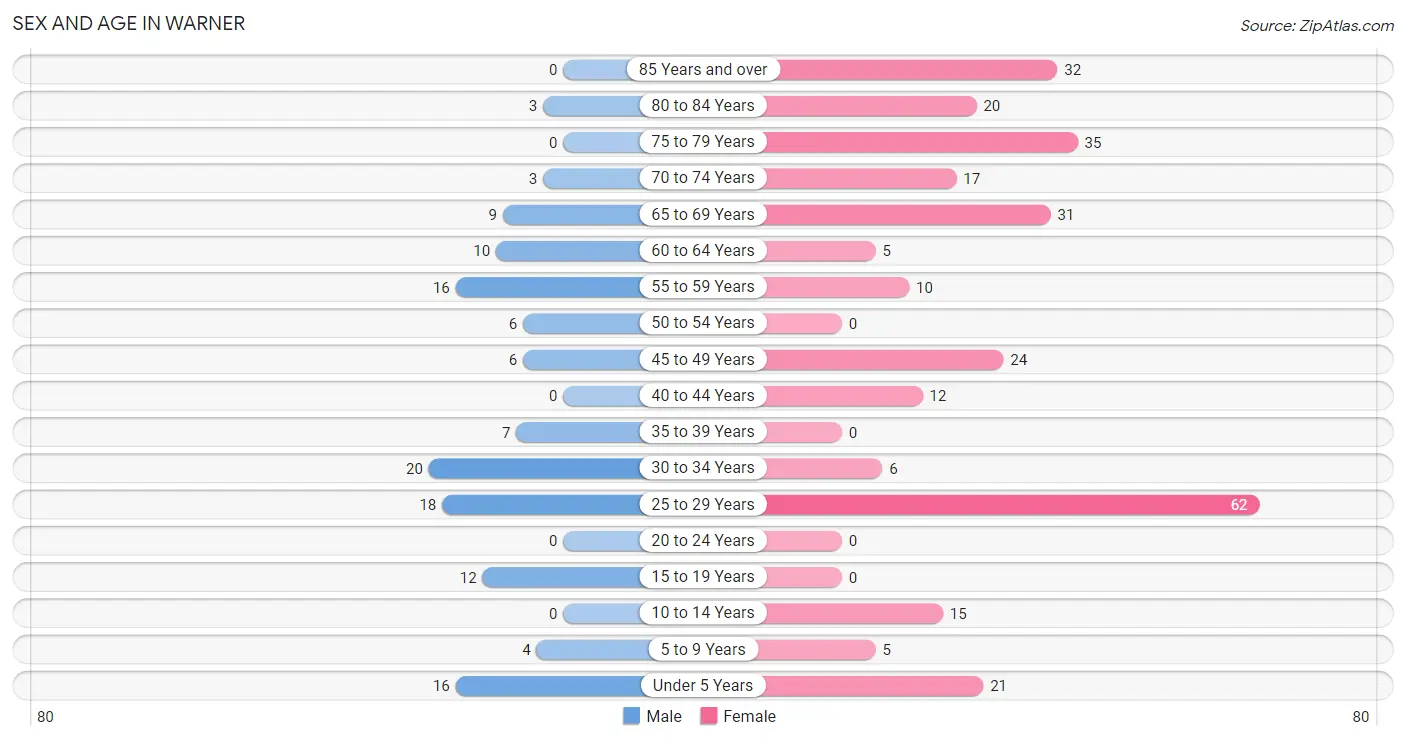
| Age Bracket | Male | Female |
| Under 5 Years | 16 (12.3%) | 21 (7.1%) |
| 5 to 9 Years | 4 (3.1%) | 5 (1.7%) |
| 10 to 14 Years | 0 (0.0%) | 15 (5.1%) |
| 15 to 19 Years | 12 (9.2%) | 0 (0.0%) |
| 20 to 24 Years | 0 (0.0%) | 0 (0.0%) |
| 25 to 29 Years | 18 (13.9%) | 62 (21.0%) |
| 30 to 34 Years | 20 (15.4%) | 6 (2.0%) |
| 35 to 39 Years | 7 (5.4%) | 0 (0.0%) |
| 40 to 44 Years | 0 (0.0%) | 12 (4.1%) |
| 45 to 49 Years | 6 (4.6%) | 24 (8.1%) |
| 50 to 54 Years | 6 (4.6%) | 0 (0.0%) |
| 55 to 59 Years | 16 (12.3%) | 10 (3.4%) |
| 60 to 64 Years | 10 (7.7%) | 5 (1.7%) |
| 65 to 69 Years | 9 (6.9%) | 31 (10.5%) |
| 70 to 74 Years | 3 (2.3%) | 17 (5.8%) |
| 75 to 79 Years | 0 (0.0%) | 35 (11.9%) |
| 80 to 84 Years | 3 (2.3%) | 20 (6.8%) |
| 85 Years and over | 0 (0.0%) | 32 (10.8%) |
| Total | 130 (100.0%) | 295 (100.0%) |
Families and Households in Warner
Median Family Size in Warner
The median family size in Warner is 2.05 persons per family, with married-couple families (82 | 64.6%) accounting for the largest median family size of 2.18 persons per family. On the other hand, single female/mother families (39 | 30.7%) represent the smallest median family size with 1.77 persons per family.
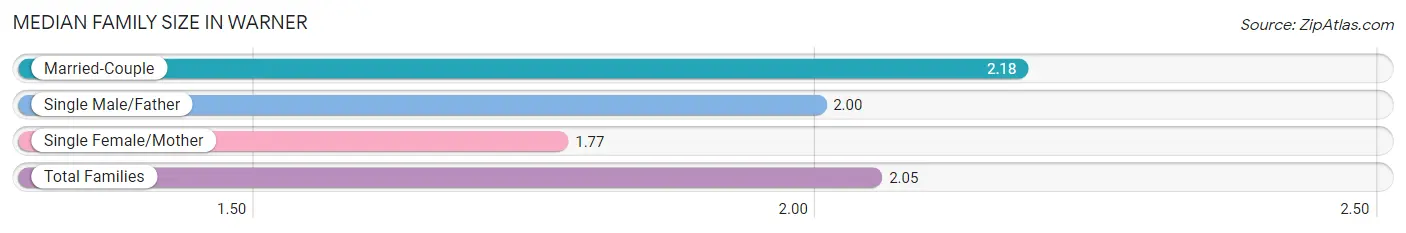
| Family Type | # Families | Family Size |
| Married-Couple | 82 (64.6%) | 2.18 |
| Single Male/Father | 6 (4.7%) | 2.00 |
| Single Female/Mother | 39 (30.7%) | 1.77 |
| Total Families | 127 (100.0%) | 2.05 |
Median Household Size in Warner
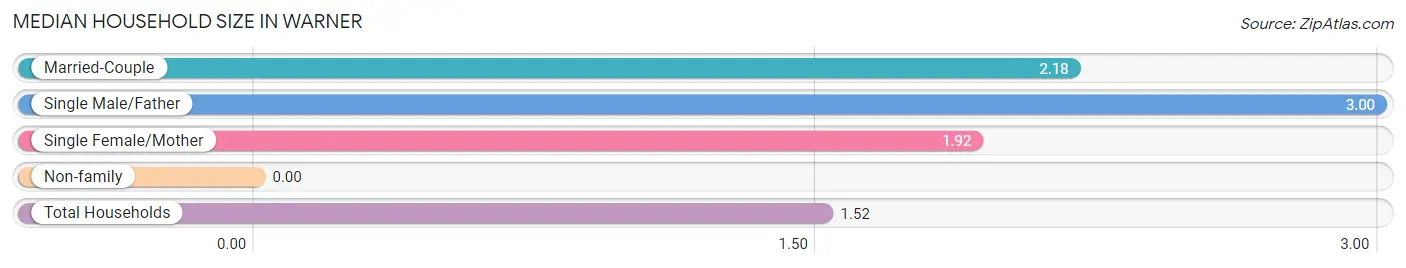
| Household Type | # Households | Household Size |
| Married-Couple | 82 (29.3%) | 2.18 |
| Single Male/Father | 6 (2.1%) | 3.00 |
| Single Female/Mother | 39 (13.9%) | 1.92 |
| Non-family | 153 (54.6%) | - |
| Total Households | 280 (100.0%) | 1.52 |
Household Size by Marriage Status in Warner
Out of a total of 280 households in Warner, 127 (45.4%) are family households, while 153 (54.6%) are nonfamily households. The most numerous type of family households are 3-person households, comprising 70, and the most common type of nonfamily households are 1-person households, comprising 153.
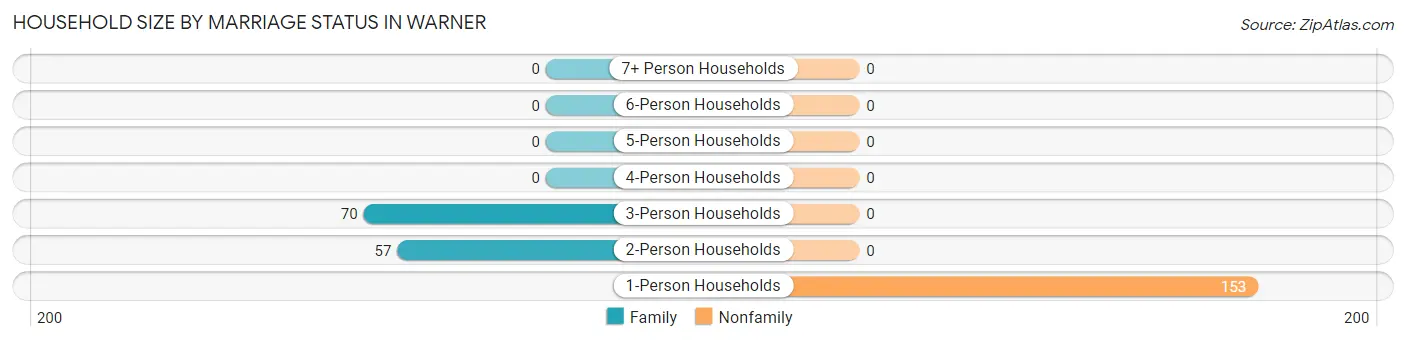
| Household Size | Family Households | Nonfamily Households |
| 1-Person Households | - | 153 (54.6%) |
| 2-Person Households | 57 (20.4%) | 0 (0.0%) |
| 3-Person Households | 70 (25.0%) | 0 (0.0%) |
| 4-Person Households | 0 (0.0%) | 0 (0.0%) |
| 5-Person Households | 0 (0.0%) | 0 (0.0%) |
| 6-Person Households | 0 (0.0%) | 0 (0.0%) |
| 7+ Person Households | 0 (0.0%) | 0 (0.0%) |
| Total | 127 (45.4%) | 153 (54.6%) |
Female Fertility in Warner
Fertility by Age in Warner
| Age Bracket | Women with Births | Births / 1,000 Women |
| 15 to 19 years | 0 (0.0%) | 0.0 |
| 20 to 34 years | 0 (0.0%) | 0.0 |
| 35 to 50 years | 0 (0.0%) | 0.0 |
| Total | 0 (0.0%) | 0.0 |
Fertility by Age by Marriage Status in Warner
| Age Bracket | Married | Unmarried |
| 15 to 19 years | 0 (0.0%) | 0 (0.0%) |
| 20 to 34 years | 0 (0.0%) | 0 (0.0%) |
| 35 to 50 years | 0 (0.0%) | 0 (0.0%) |
| Total | 0 (0.0%) | 0 (0.0%) |
Fertility by Education in Warner
| Educational Attainment | Women with Births | Births / 1,000 Women |
| Less than High School | 0 (0.0%) | 0.0 |
| High School Diploma | 0 (0.0%) | 0.0 |
| College or Associate's Degree | 0 (0.0%) | 0.0 |
| Bachelor's Degree | 0 (0.0%) | 0.0 |
| Graduate Degree | 0 (0.0%) | 0.0 |
| Total | 0 (0.0%) | 0.0 |
Fertility by Education by Marriage Status in Warner
| Educational Attainment | Married | Unmarried |
| Less than High School | 0 (0.0%) | 0 (0.0%) |
| High School Diploma | 0 (0.0%) | 0 (0.0%) |
| College or Associate's Degree | 0 (0.0%) | 0 (0.0%) |
| Bachelor's Degree | 0 (0.0%) | 0 (0.0%) |
| Graduate Degree | 0 (0.0%) | 0 (0.0%) |
| Total | 0 (0.0%) | 0 (0.0%) |
Employment Characteristics in Warner
Employment by Class of Employer in Warner
Among the 170 employed individuals in Warner, private company employees (118 | 69.4%), local government employees (24 | 14.1%), and not-for-profit organizations (16 | 9.4%) make up the most common classes of employment.
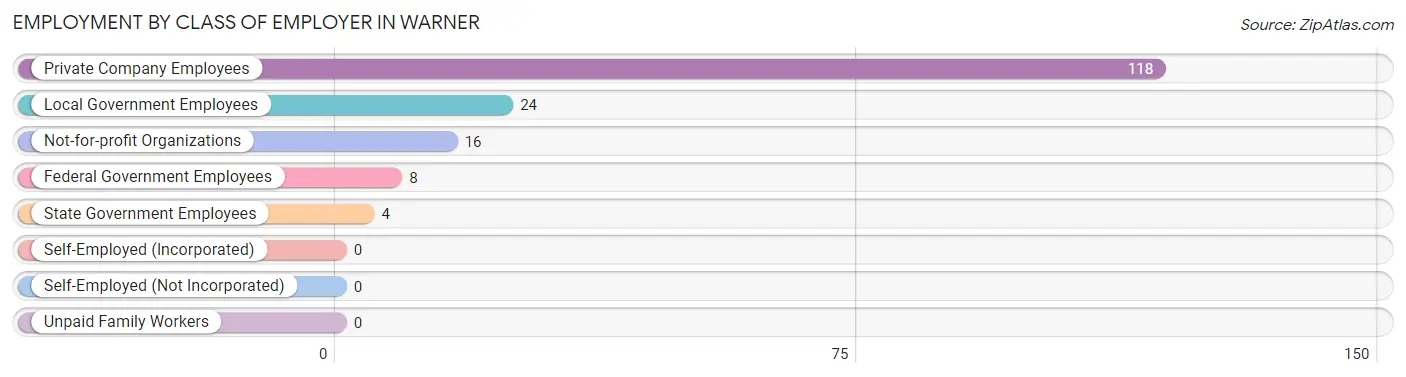
| Employer Class | # Employees | % Employees |
| Private Company Employees | 118 | 69.4% |
| Self-Employed (Incorporated) | 0 | 0.0% |
| Self-Employed (Not Incorporated) | 0 | 0.0% |
| Not-for-profit Organizations | 16 | 9.4% |
| Local Government Employees | 24 | 14.1% |
| State Government Employees | 4 | 2.4% |
| Federal Government Employees | 8 | 4.7% |
| Unpaid Family Workers | 0 | 0.0% |
| Total | 170 | 100.0% |
Employment Status by Age in Warner
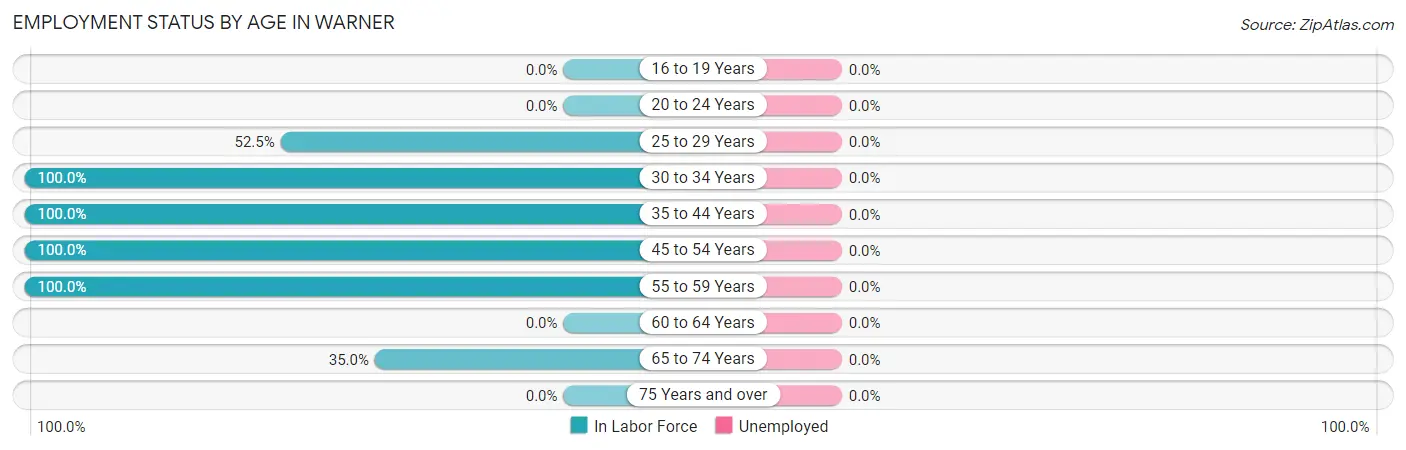
| Age Bracket | In Labor Force | Unemployed |
| 16 to 19 Years | 0 (0.0%) | 0 (0.0%) |
| 20 to 24 Years | 0 (0.0%) | 0 (0.0%) |
| 25 to 29 Years | 42 (52.5%) | 0 (0.0%) |
| 30 to 34 Years | 26 (100.0%) | 0 (0.0%) |
| 35 to 44 Years | 19 (100.0%) | 0 (0.0%) |
| 45 to 54 Years | 36 (100.0%) | 0 (0.0%) |
| 55 to 59 Years | 26 (100.0%) | 0 (0.0%) |
| 60 to 64 Years | 0 (0.0%) | 0 (0.0%) |
| 65 to 74 Years | 21 (35.0%) | 0 (0.0%) |
| 75 Years and over | 0 (0.0%) | 0 (0.0%) |
| Total | 170 (46.7%) | 0 (0.0%) |
Employment Status by Educational Attainment in Warner
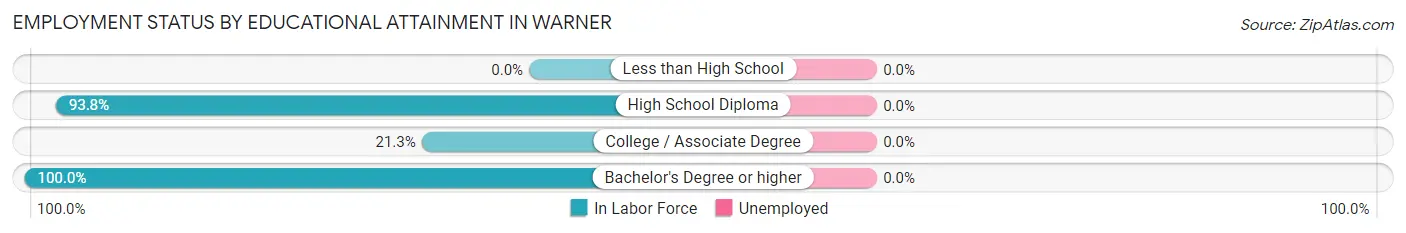
| Educational Attainment | In Labor Force | Unemployed |
| Less than High School | 0 (0.0%) | 0 (0.0%) |
| High School Diploma | 75 (93.8%) | 0 (0.0%) |
| College / Associate Degree | 13 (21.3%) | 0 (0.0%) |
| Bachelor's Degree or higher | 61 (100.0%) | 0 (0.0%) |
| Total | 149 (73.8%) | 0 (0.0%) |
Employment Occupations by Sex in Warner
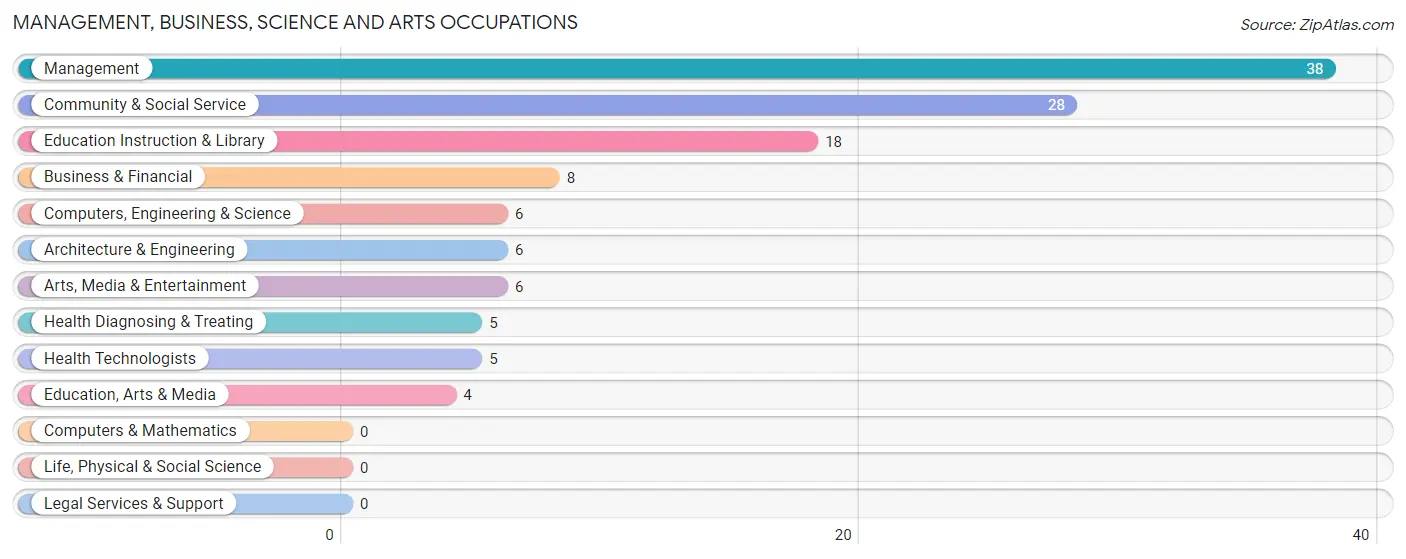
Management, Business, Science and Arts Occupations
The most common Management, Business, Science and Arts occupations in Warner are Management (38 | 22.4%), Community & Social Service (28 | 16.5%), Education Instruction & Library (18 | 10.6%), Business & Financial (8 | 4.7%), and Computers, Engineering & Science (6 | 3.5%).
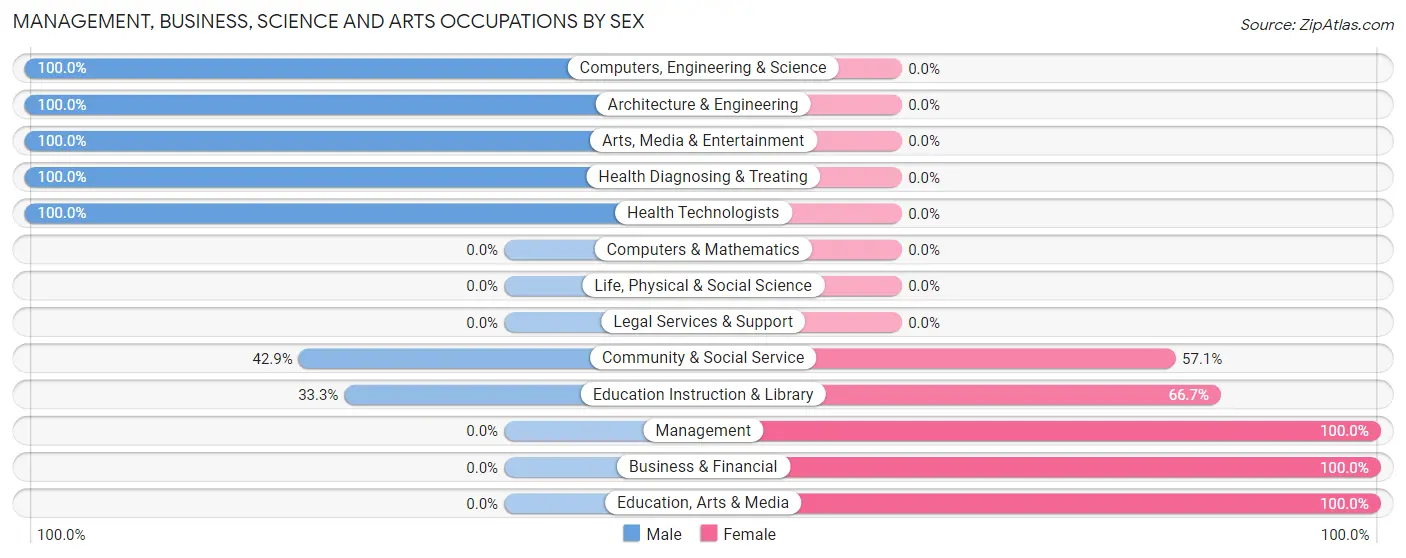
Management, Business, Science and Arts Occupations by Sex
Within the Management, Business, Science and Arts occupations in Warner, the most male-oriented occupations are Computers, Engineering & Science (100.0%), Architecture & Engineering (100.0%), and Arts, Media & Entertainment (100.0%), while the most female-oriented occupations are Management (100.0%), Business & Financial (100.0%), and Education, Arts & Media (100.0%).
| Occupation | Male | Female |
| Management | 0 (0.0%) | 38 (100.0%) |
| Business & Financial | 0 (0.0%) | 8 (100.0%) |
| Computers, Engineering & Science | 6 (100.0%) | 0 (0.0%) |
| Computers & Mathematics | 0 (0.0%) | 0 (0.0%) |
| Architecture & Engineering | 6 (100.0%) | 0 (0.0%) |
| Life, Physical & Social Science | 0 (0.0%) | 0 (0.0%) |
| Community & Social Service | 12 (42.9%) | 16 (57.1%) |
| Education, Arts & Media | 0 (0.0%) | 4 (100.0%) |
| Legal Services & Support | 0 (0.0%) | 0 (0.0%) |
| Education Instruction & Library | 6 (33.3%) | 12 (66.7%) |
| Arts, Media & Entertainment | 6 (100.0%) | 0 (0.0%) |
| Health Diagnosing & Treating | 5 (100.0%) | 0 (0.0%) |
| Health Technologists | 5 (100.0%) | 0 (0.0%) |
| Total (Category) | 23 (27.1%) | 62 (72.9%) |
| Total (Overall) | 71 (41.8%) | 99 (58.2%) |
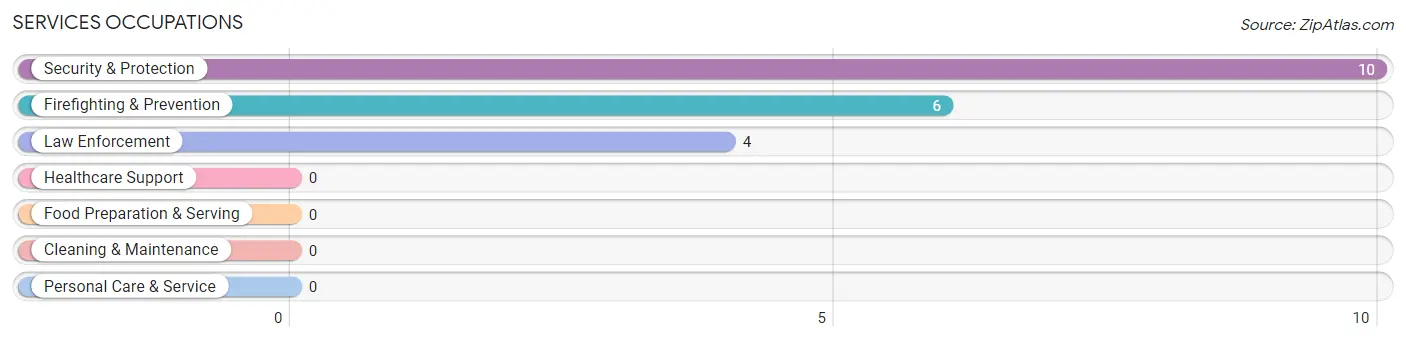
Services Occupations
The most common Services occupations in Warner are Security & Protection (10 | 5.9%), Firefighting & Prevention (6 | 3.5%), and Law Enforcement (4 | 2.4%).
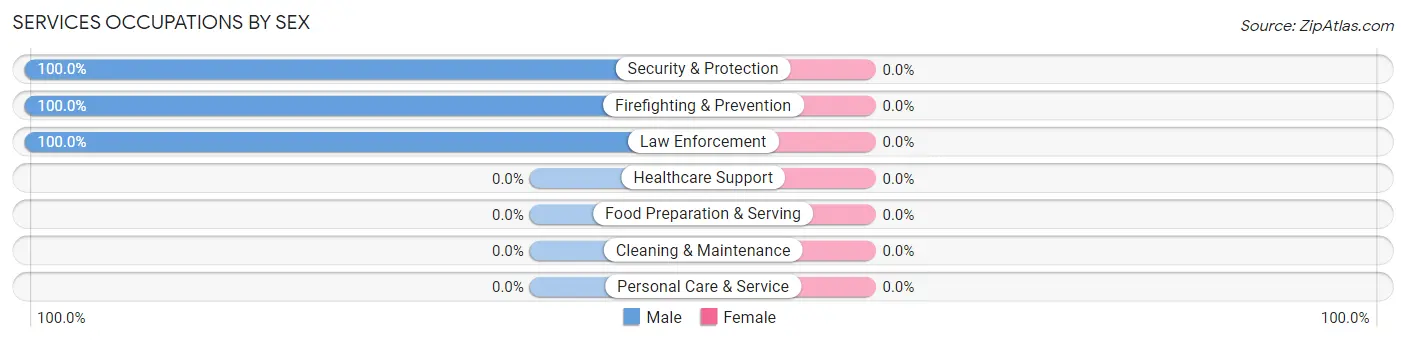
Services Occupations by Sex
| Occupation | Male | Female |
| Healthcare Support | 0 (0.0%) | 0 (0.0%) |
| Security & Protection | 10 (100.0%) | 0 (0.0%) |
| Firefighting & Prevention | 6 (100.0%) | 0 (0.0%) |
| Law Enforcement | 4 (100.0%) | 0 (0.0%) |
| Food Preparation & Serving | 0 (0.0%) | 0 (0.0%) |
| Cleaning & Maintenance | 0 (0.0%) | 0 (0.0%) |
| Personal Care & Service | 0 (0.0%) | 0 (0.0%) |
| Total (Category) | 10 (100.0%) | 0 (0.0%) |
| Total (Overall) | 71 (41.8%) | 99 (58.2%) |
Sales and Office Occupations
The most common Sales and Office occupations in Warner are Office & Administration (16 | 9.4%), and Sales & Related (12 | 7.1%).
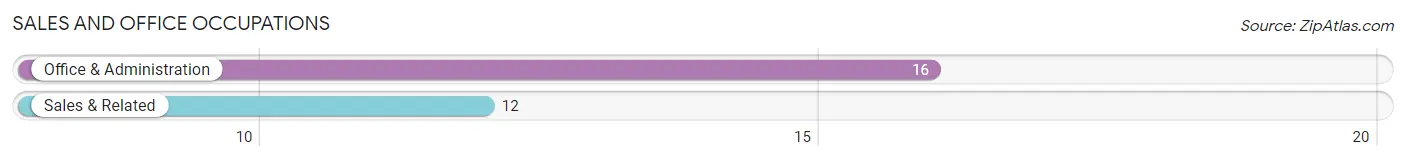
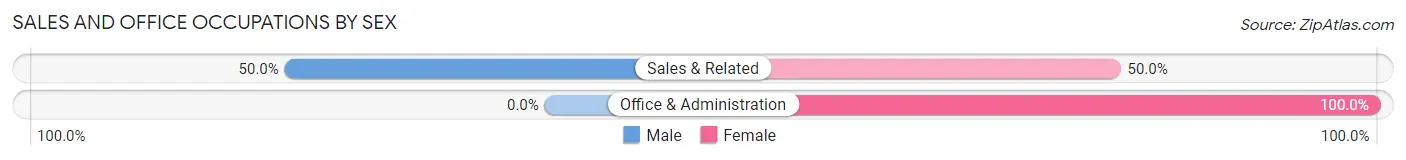
Sales and Office Occupations by Sex
| Occupation | Male | Female |
| Sales & Related | 6 (50.0%) | 6 (50.0%) |
| Office & Administration | 0 (0.0%) | 16 (100.0%) |
| Total (Category) | 6 (21.4%) | 22 (78.6%) |
| Total (Overall) | 71 (41.8%) | 99 (58.2%) |
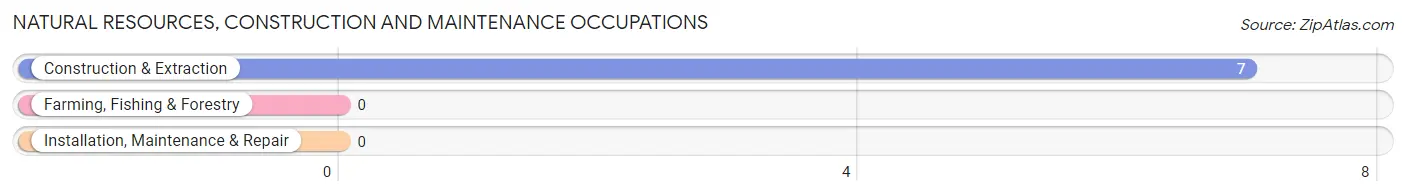
Natural Resources, Construction and Maintenance Occupations
The most common Natural Resources, Construction and Maintenance occupations in Warner are , and Construction & Extraction (7 | 4.1%).
Natural Resources, Construction and Maintenance Occupations by Sex
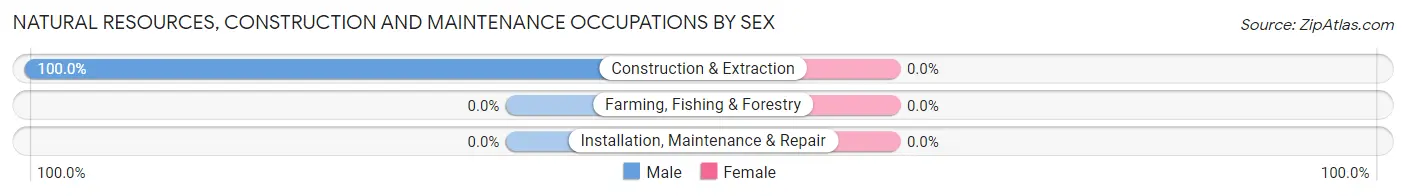
| Occupation | Male | Female |
| Farming, Fishing & Forestry | 0 (0.0%) | 0 (0.0%) |
| Construction & Extraction | 7 (100.0%) | 0 (0.0%) |
| Installation, Maintenance & Repair | 0 (0.0%) | 0 (0.0%) |
| Total (Category) | 7 (100.0%) | 0 (0.0%) |
| Total (Overall) | 71 (41.8%) | 99 (58.2%) |
Production, Transportation and Moving Occupations
The most common Production, Transportation and Moving occupations in Warner are Production (25 | 14.7%), and Material Moving (15 | 8.8%).
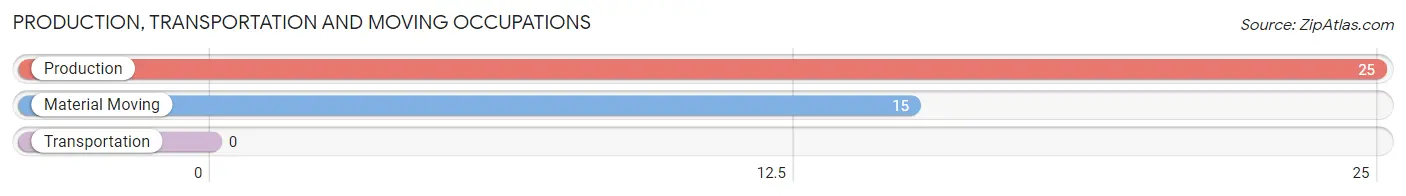
Production, Transportation and Moving Occupations by Sex
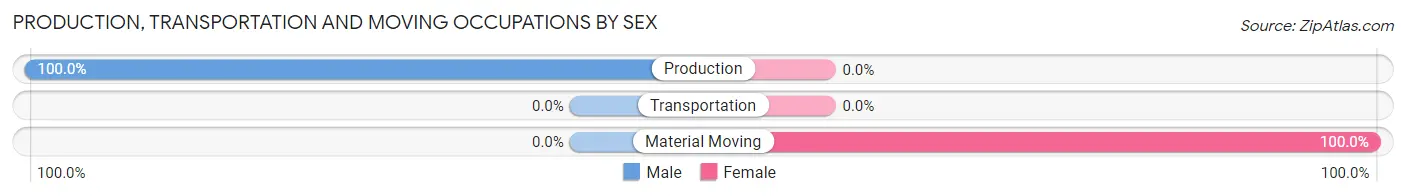
| Occupation | Male | Female |
| Production | 25 (100.0%) | 0 (0.0%) |
| Transportation | 0 (0.0%) | 0 (0.0%) |
| Material Moving | 0 (0.0%) | 15 (100.0%) |
| Total (Category) | 25 (62.5%) | 15 (37.5%) |
| Total (Overall) | 71 (41.8%) | 99 (58.2%) |
Employment Industries by Sex in Warner
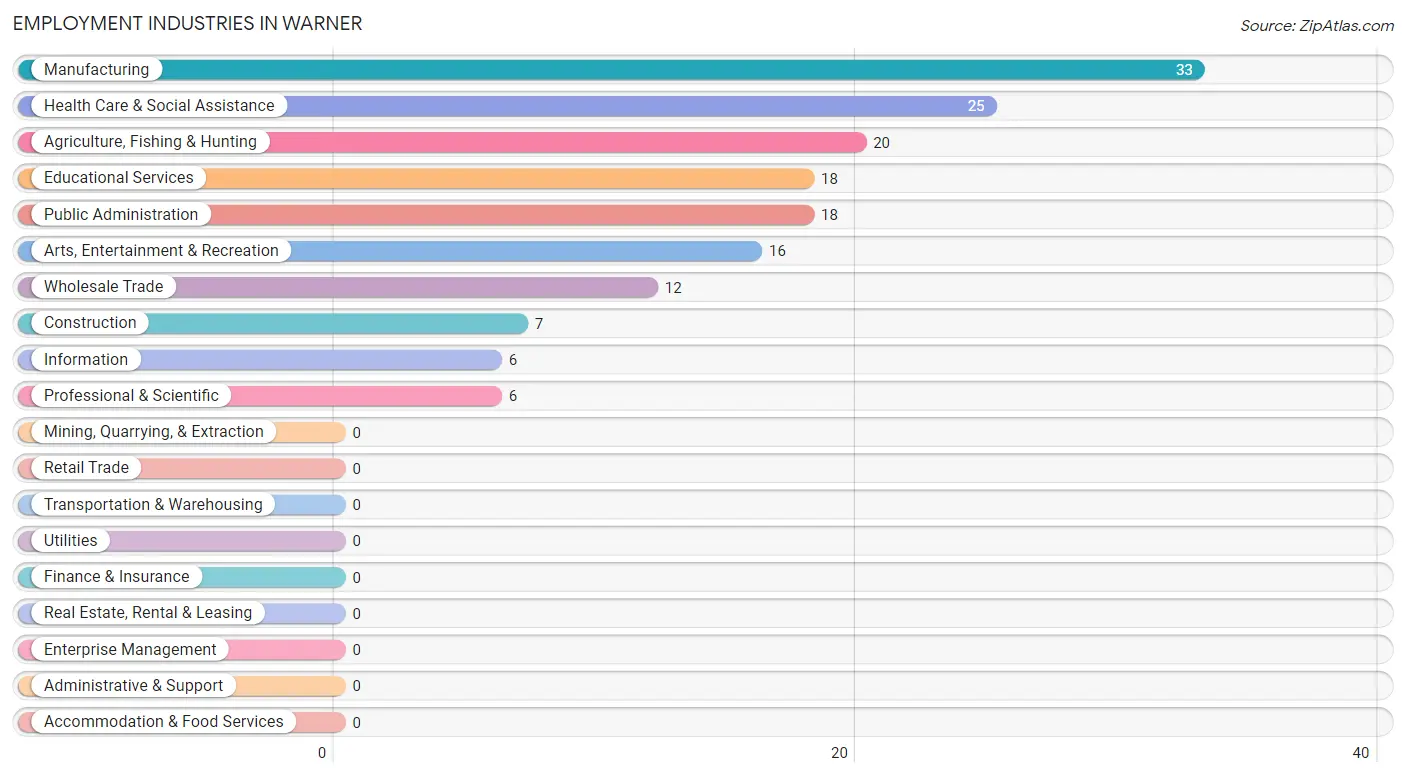
Employment Industries in Warner
The major employment industries in Warner include Manufacturing (33 | 19.4%), Health Care & Social Assistance (25 | 14.7%), Agriculture, Fishing & Hunting (20 | 11.8%), Educational Services (18 | 10.6%), and Public Administration (18 | 10.6%).
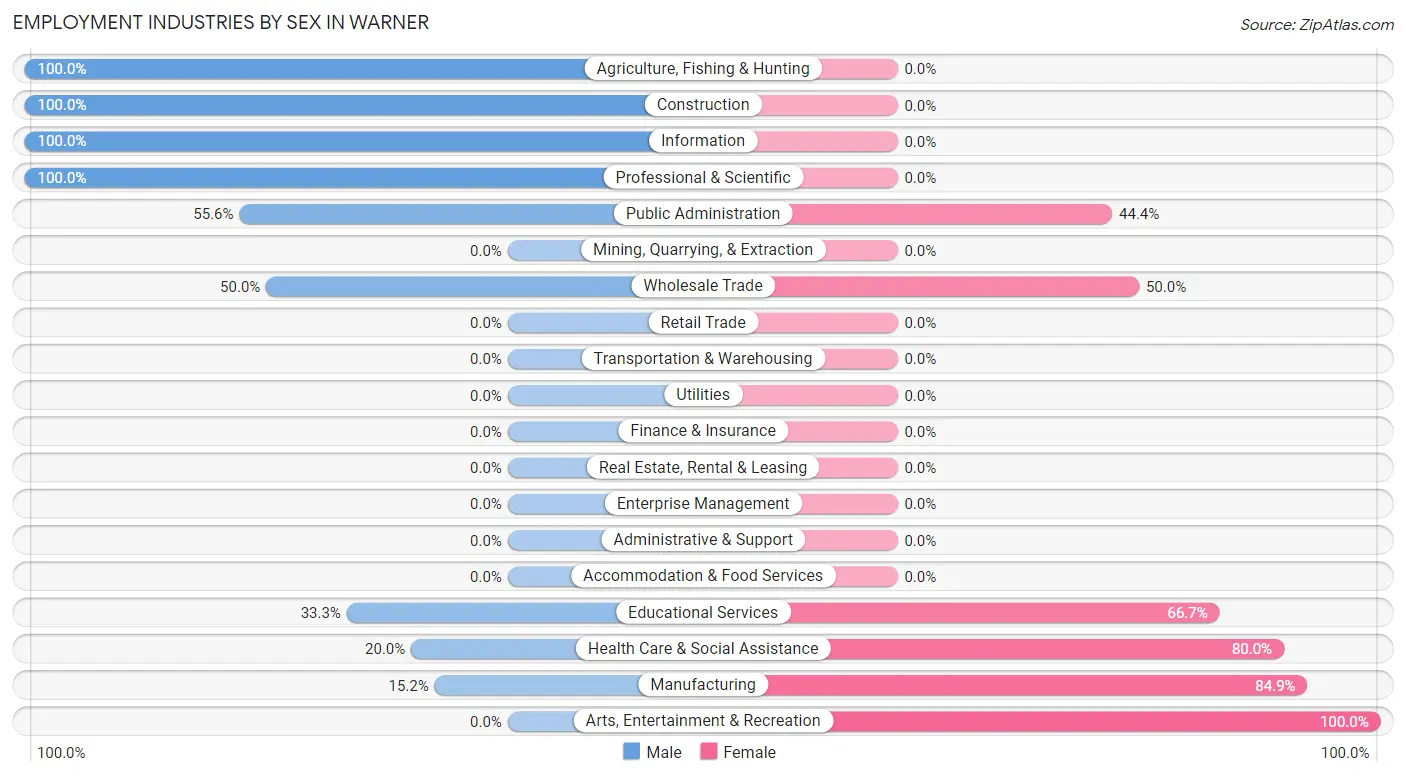
Employment Industries by Sex in Warner
The Warner industries that see more men than women are Agriculture, Fishing & Hunting (100.0%), Construction (100.0%), and Information (100.0%), whereas the industries that tend to have a higher number of women are Arts, Entertainment & Recreation (100.0%), Manufacturing (84.9%), and Health Care & Social Assistance (80.0%).
| Industry | Male | Female |
| Agriculture, Fishing & Hunting | 20 (100.0%) | 0 (0.0%) |
| Mining, Quarrying, & Extraction | 0 (0.0%) | 0 (0.0%) |
| Construction | 7 (100.0%) | 0 (0.0%) |
| Manufacturing | 5 (15.1%) | 28 (84.9%) |
| Wholesale Trade | 6 (50.0%) | 6 (50.0%) |
| Retail Trade | 0 (0.0%) | 0 (0.0%) |
| Transportation & Warehousing | 0 (0.0%) | 0 (0.0%) |
| Utilities | 0 (0.0%) | 0 (0.0%) |
| Information | 6 (100.0%) | 0 (0.0%) |
| Finance & Insurance | 0 (0.0%) | 0 (0.0%) |
| Real Estate, Rental & Leasing | 0 (0.0%) | 0 (0.0%) |
| Professional & Scientific | 6 (100.0%) | 0 (0.0%) |
| Enterprise Management | 0 (0.0%) | 0 (0.0%) |
| Administrative & Support | 0 (0.0%) | 0 (0.0%) |
| Educational Services | 6 (33.3%) | 12 (66.7%) |
| Health Care & Social Assistance | 5 (20.0%) | 20 (80.0%) |
| Arts, Entertainment & Recreation | 0 (0.0%) | 16 (100.0%) |
| Accommodation & Food Services | 0 (0.0%) | 0 (0.0%) |
| Public Administration | 10 (55.6%) | 8 (44.4%) |
| Total | 71 (41.8%) | 99 (58.2%) |
Education in Warner
School Enrollment in Warner
The most common levels of schooling among the 30 students in Warner are high school (12 | 40.0%), college / undergraduate (9 | 30.0%), and nursery / preschool (5 | 16.7%).
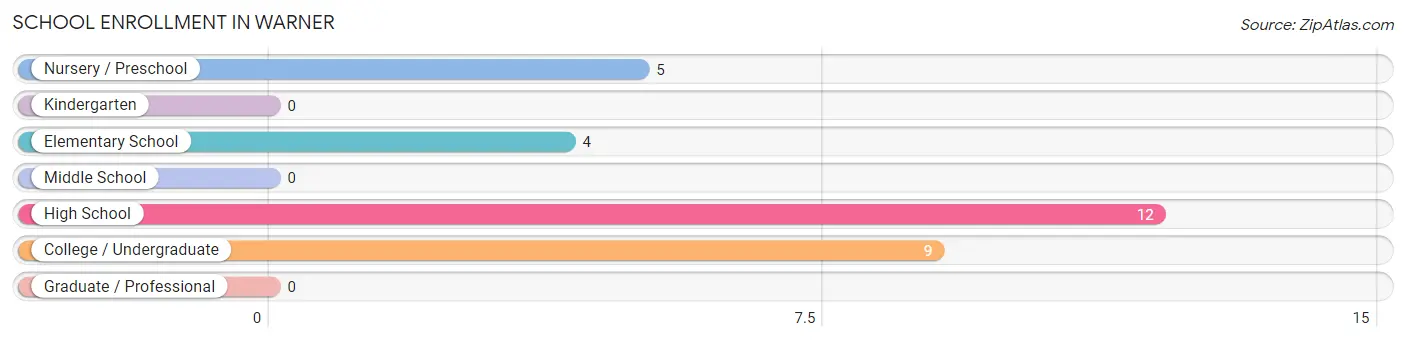
| School Level | # Students | % Students |
| Nursery / Preschool | 5 | 16.7% |
| Kindergarten | 0 | 0.0% |
| Elementary School | 4 | 13.3% |
| Middle School | 0 | 0.0% |
| High School | 12 | 40.0% |
| College / Undergraduate | 9 | 30.0% |
| Graduate / Professional | 0 | 0.0% |
| Total | 30 | 100.0% |
School Enrollment by Age by Funding Source in Warner
Out of a total of 30 students who are enrolled in schools in Warner, 14 (46.7%) attend a private institution, while the remaining 16 (53.3%) are enrolled in public schools. The age group of 25 to 34 year olds has the highest likelihood of being enrolled in private schools, with 9 (100.0% in the age bracket) enrolled. Conversely, the age group of 15 to 17 year olds has the lowest likelihood of being enrolled in a private school, with 12 (100.0% in the age bracket) attending a public institution.
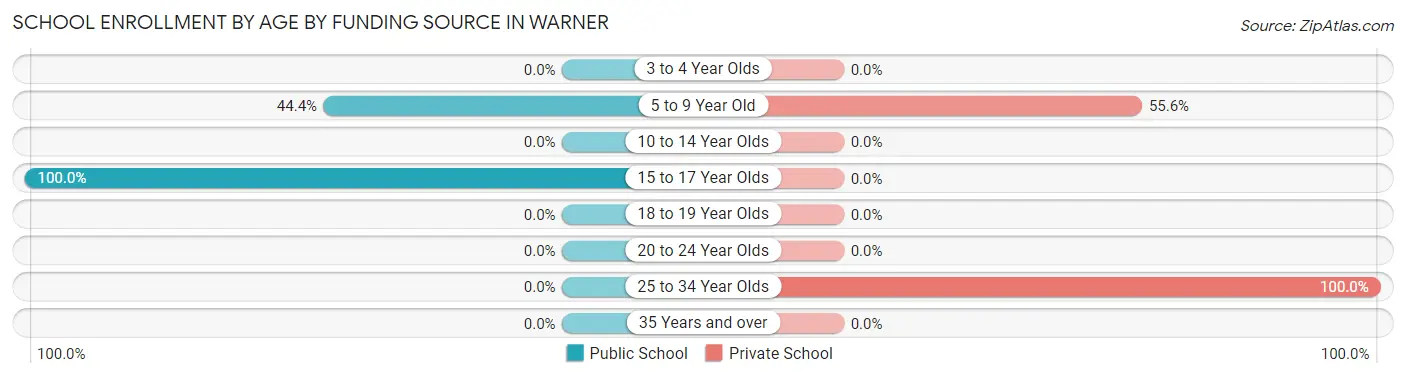
| Age Bracket | Public School | Private School |
| 3 to 4 Year Olds | 0 (0.0%) | 0 (0.0%) |
| 5 to 9 Year Old | 4 (44.4%) | 5 (55.6%) |
| 10 to 14 Year Olds | 0 (0.0%) | 0 (0.0%) |
| 15 to 17 Year Olds | 12 (100.0%) | 0 (0.0%) |
| 18 to 19 Year Olds | 0 (0.0%) | 0 (0.0%) |
| 20 to 24 Year Olds | 0 (0.0%) | 0 (0.0%) |
| 25 to 34 Year Olds | 0 (0.0%) | 9 (100.0%) |
| 35 Years and over | 0 (0.0%) | 0 (0.0%) |
| Total | 16 (53.3%) | 14 (46.7%) |
Educational Attainment by Field of Study in Warner
Social sciences (26 | 34.2%), bio, nature & agricultural (19 | 25.0%), communications (12 | 15.8%), physical & health sciences (6 | 7.9%), and education (6 | 7.9%) are the most common fields of study among 76 individuals in Warner who have obtained a bachelor's degree or higher.
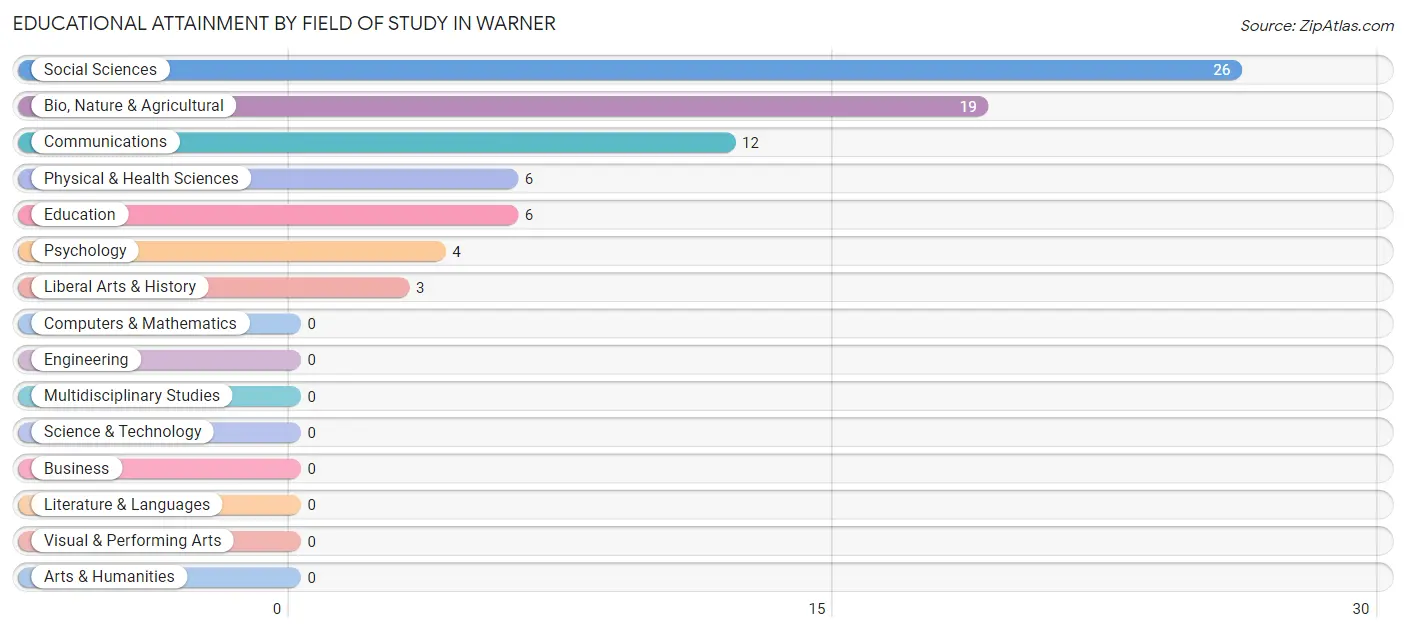
| Field of Study | # Graduates | % Graduates |
| Computers & Mathematics | 0 | 0.0% |
| Bio, Nature & Agricultural | 19 | 25.0% |
| Physical & Health Sciences | 6 | 7.9% |
| Psychology | 4 | 5.3% |
| Social Sciences | 26 | 34.2% |
| Engineering | 0 | 0.0% |
| Multidisciplinary Studies | 0 | 0.0% |
| Science & Technology | 0 | 0.0% |
| Business | 0 | 0.0% |
| Education | 6 | 7.9% |
| Literature & Languages | 0 | 0.0% |
| Liberal Arts & History | 3 | 4.0% |
| Visual & Performing Arts | 0 | 0.0% |
| Communications | 12 | 15.8% |
| Arts & Humanities | 0 | 0.0% |
| Total | 76 | 100.0% |
Transportation & Commute in Warner
Vehicle Availability by Sex in Warner
The most prevalent vehicle ownership categories in Warner are males with 2 vehicles (48, accounting for 67.6%) and females with 2 vehicles (38, making up 48.5%).
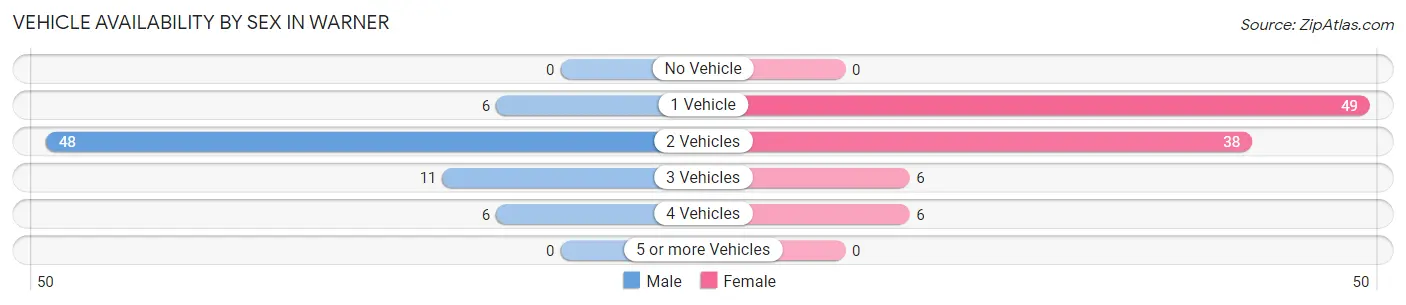
| Vehicles Available | Male | Female |
| No Vehicle | 0 (0.0%) | 0 (0.0%) |
| 1 Vehicle | 6 (8.5%) | 49 (49.5%) |
| 2 Vehicles | 48 (67.6%) | 38 (38.4%) |
| 3 Vehicles | 11 (15.5%) | 6 (6.1%) |
| 4 Vehicles | 6 (8.5%) | 6 (6.1%) |
| 5 or more Vehicles | 0 (0.0%) | 0 (0.0%) |
| Total | 71 (100.0%) | 99 (100.0%) |
Commute Time in Warner
The most frequently occuring commute durations in Warner are 60 to 89 minutes (61 commuters, 38.6%), 35 to 39 minutes (25 commuters, 15.8%), and 45 to 59 minutes (20 commuters, 12.7%).
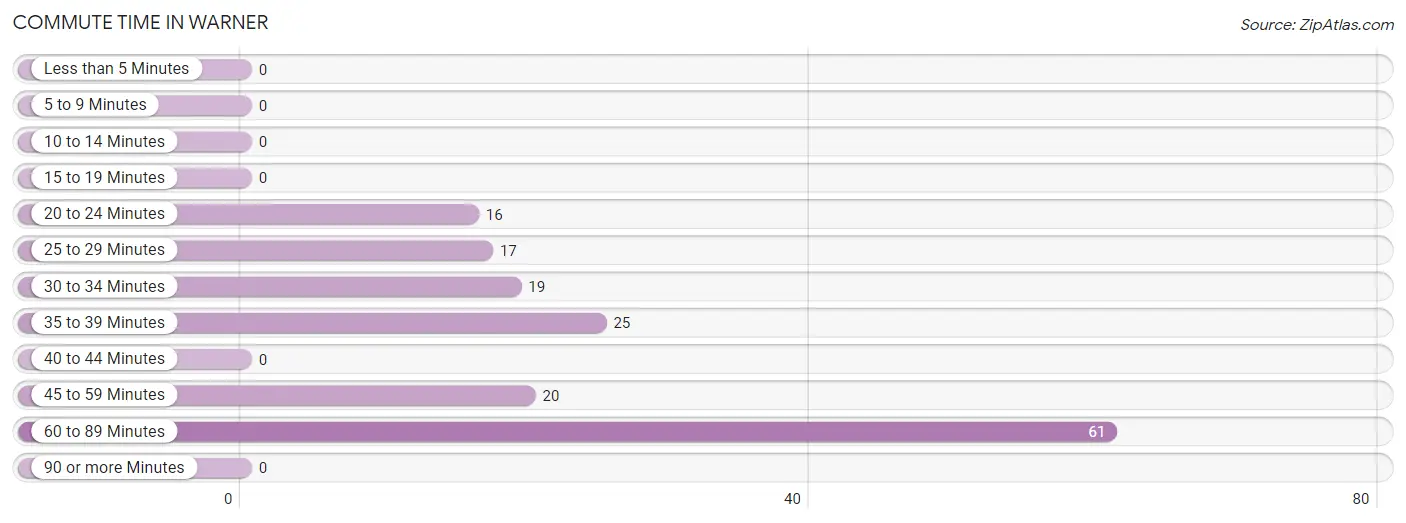
| Commute Time | # Commuters | % Commuters |
| Less than 5 Minutes | 0 | 0.0% |
| 5 to 9 Minutes | 0 | 0.0% |
| 10 to 14 Minutes | 0 | 0.0% |
| 15 to 19 Minutes | 0 | 0.0% |
| 20 to 24 Minutes | 16 | 10.1% |
| 25 to 29 Minutes | 17 | 10.8% |
| 30 to 34 Minutes | 19 | 12.0% |
| 35 to 39 Minutes | 25 | 15.8% |
| 40 to 44 Minutes | 0 | 0.0% |
| 45 to 59 Minutes | 20 | 12.7% |
| 60 to 89 Minutes | 61 | 38.6% |
| 90 or more Minutes | 0 | 0.0% |
Commute Time by Sex in Warner
The most common commute times in Warner are 60 to 89 minutes (33 commuters, 50.8%) for males and 60 to 89 minutes (28 commuters, 30.1%) for females.
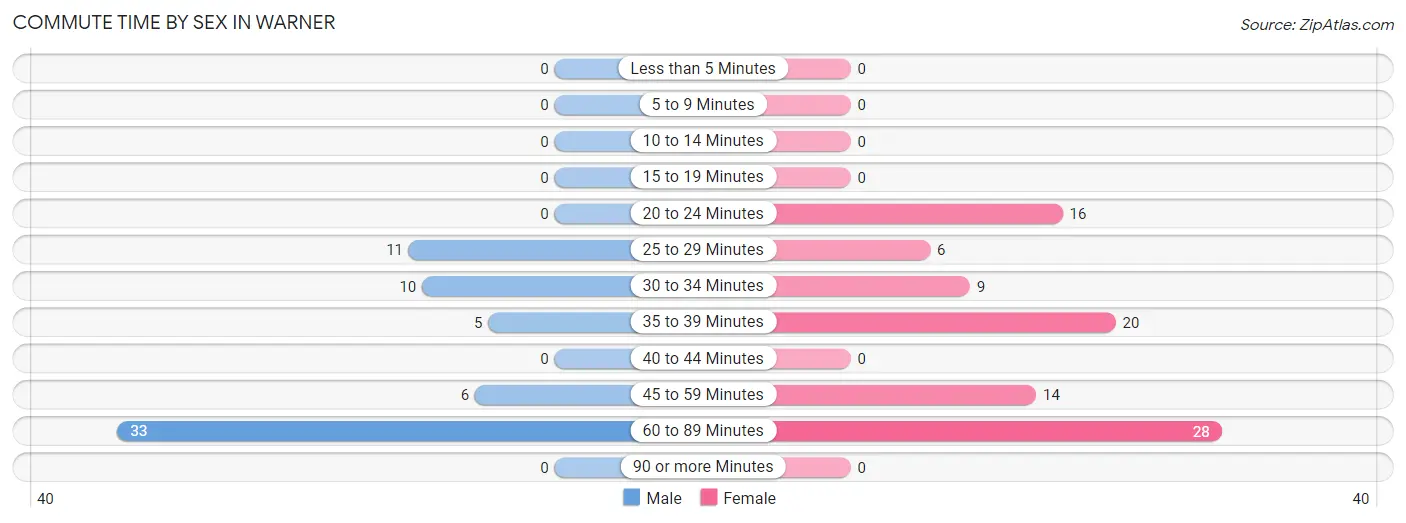
| Commute Time | Male | Female |
| Less than 5 Minutes | 0 (0.0%) | 0 (0.0%) |
| 5 to 9 Minutes | 0 (0.0%) | 0 (0.0%) |
| 10 to 14 Minutes | 0 (0.0%) | 0 (0.0%) |
| 15 to 19 Minutes | 0 (0.0%) | 0 (0.0%) |
| 20 to 24 Minutes | 0 (0.0%) | 16 (17.2%) |
| 25 to 29 Minutes | 11 (16.9%) | 6 (6.5%) |
| 30 to 34 Minutes | 10 (15.4%) | 9 (9.7%) |
| 35 to 39 Minutes | 5 (7.7%) | 20 (21.5%) |
| 40 to 44 Minutes | 0 (0.0%) | 0 (0.0%) |
| 45 to 59 Minutes | 6 (9.2%) | 14 (15.0%) |
| 60 to 89 Minutes | 33 (50.8%) | 28 (30.1%) |
| 90 or more Minutes | 0 (0.0%) | 0 (0.0%) |
Time of Departure to Work by Sex in Warner
The most frequent times of departure to work in Warner are 12:00 AM to 4:59 AM (26, 40.0%) for males and 7:30 AM to 7:59 AM (28, 30.1%) for females.
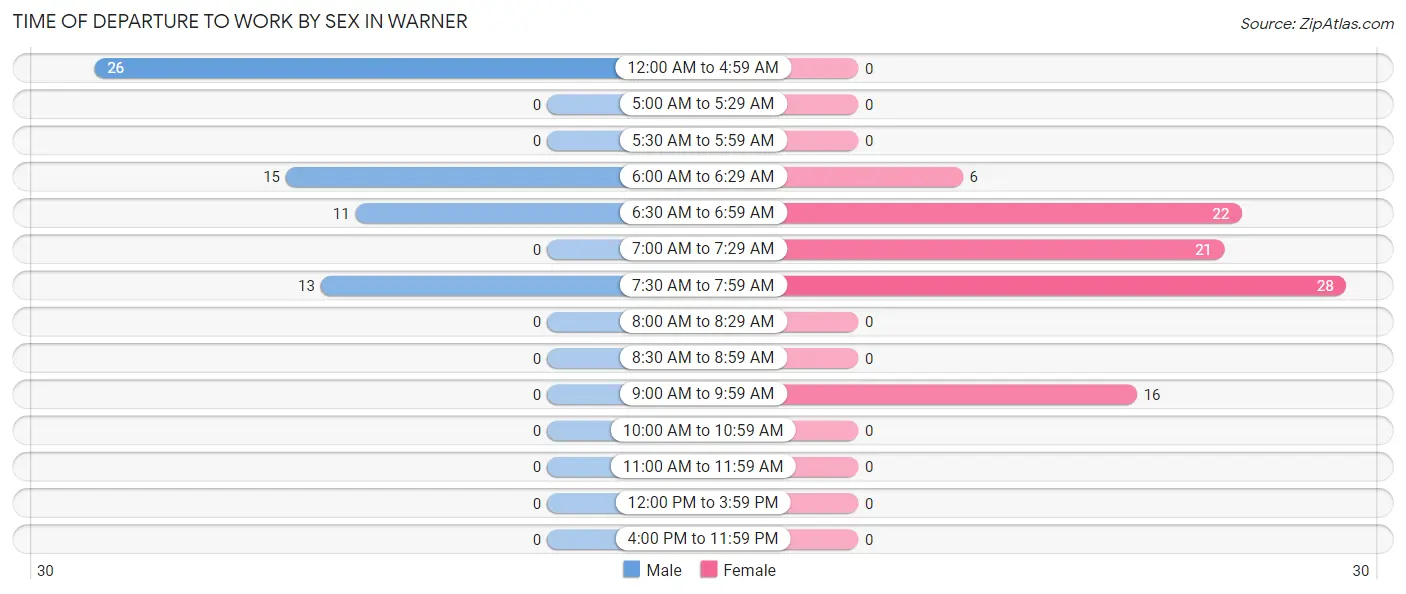
| Time of Departure | Male | Female |
| 12:00 AM to 4:59 AM | 26 (40.0%) | 0 (0.0%) |
| 5:00 AM to 5:29 AM | 0 (0.0%) | 0 (0.0%) |
| 5:30 AM to 5:59 AM | 0 (0.0%) | 0 (0.0%) |
| 6:00 AM to 6:29 AM | 15 (23.1%) | 6 (6.5%) |
| 6:30 AM to 6:59 AM | 11 (16.9%) | 22 (23.7%) |
| 7:00 AM to 7:29 AM | 0 (0.0%) | 21 (22.6%) |
| 7:30 AM to 7:59 AM | 13 (20.0%) | 28 (30.1%) |
| 8:00 AM to 8:29 AM | 0 (0.0%) | 0 (0.0%) |
| 8:30 AM to 8:59 AM | 0 (0.0%) | 0 (0.0%) |
| 9:00 AM to 9:59 AM | 0 (0.0%) | 16 (17.2%) |
| 10:00 AM to 10:59 AM | 0 (0.0%) | 0 (0.0%) |
| 11:00 AM to 11:59 AM | 0 (0.0%) | 0 (0.0%) |
| 12:00 PM to 3:59 PM | 0 (0.0%) | 0 (0.0%) |
| 4:00 PM to 11:59 PM | 0 (0.0%) | 0 (0.0%) |
| Total | 65 (100.0%) | 93 (100.0%) |
Housing Occupancy in Warner
Occupancy by Ownership in Warner
Of the total 280 dwellings in Warner, owner-occupied units account for 80 (28.6%), while renter-occupied units make up 200 (71.4%).
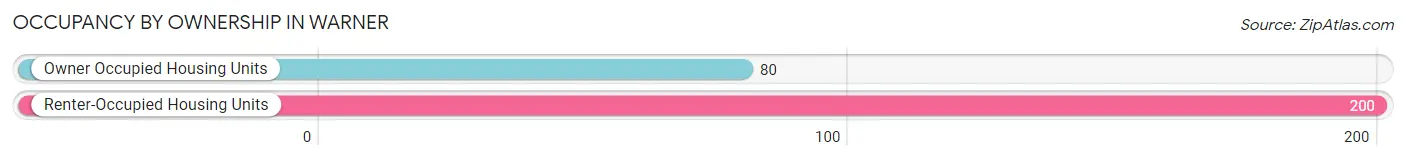
| Occupancy | # Housing Units | % Housing Units |
| Owner Occupied Housing Units | 80 | 28.6% |
| Renter-Occupied Housing Units | 200 | 71.4% |
| Total Occupied Housing Units | 280 | 100.0% |
Occupancy by Household Size in Warner
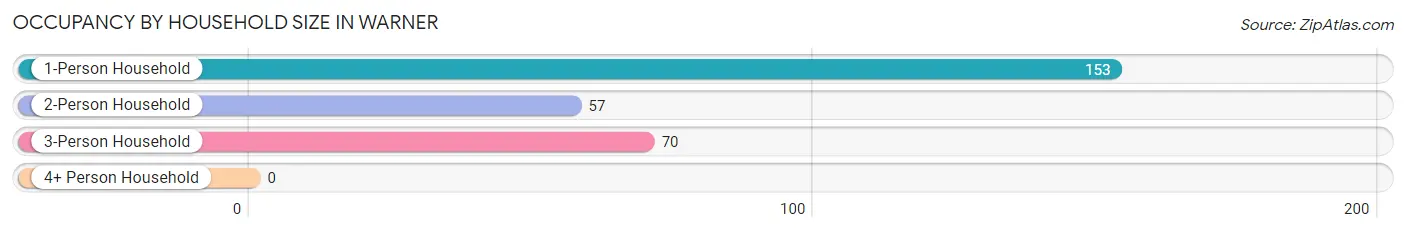
| Household Size | # Housing Units | % Housing Units |
| 1-Person Household | 153 | 54.6% |
| 2-Person Household | 57 | 20.4% |
| 3-Person Household | 70 | 25.0% |
| 4+ Person Household | 0 | 0.0% |
| Total Housing Units | 280 | 100.0% |
Occupancy by Ownership by Household Size in Warner
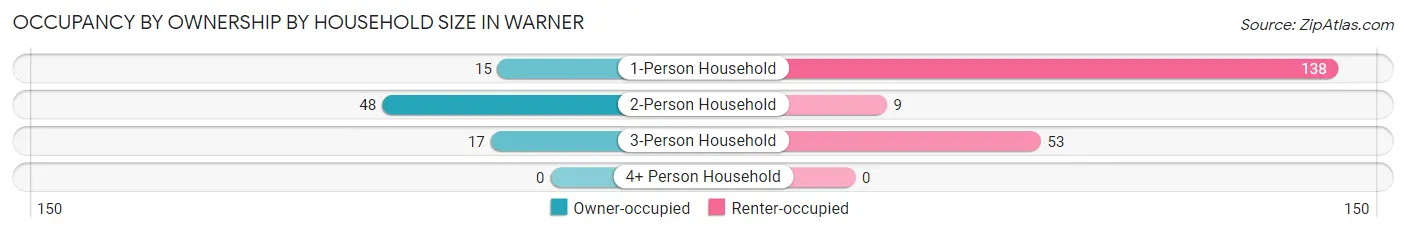
| Household Size | Owner-occupied | Renter-occupied |
| 1-Person Household | 15 (9.8%) | 138 (90.2%) |
| 2-Person Household | 48 (84.2%) | 9 (15.8%) |
| 3-Person Household | 17 (24.3%) | 53 (75.7%) |
| 4+ Person Household | 0 (0.0%) | 0 (0.0%) |
| Total Housing Units | 80 (28.6%) | 200 (71.4%) |
Occupancy by Educational Attainment in Warner
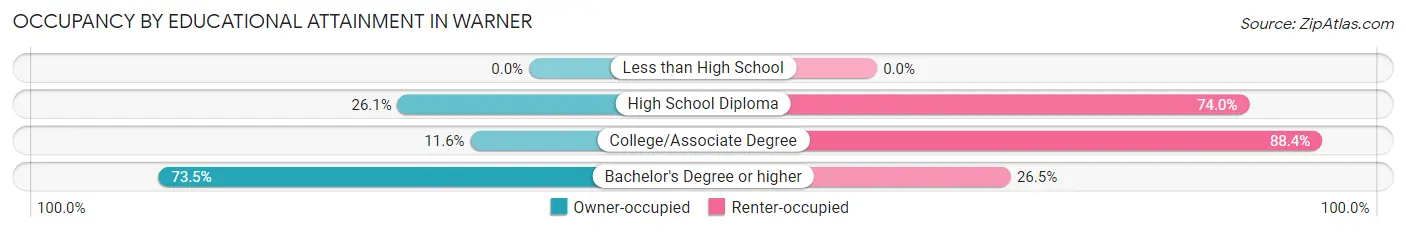
| Household Size | Owner-occupied | Renter-occupied |
| Less than High School | 0 (0.0%) | 0 (0.0%) |
| High School Diploma | 31 (26.1%) | 88 (74.0%) |
| College/Associate Degree | 13 (11.6%) | 99 (88.4%) |
| Bachelor's Degree or higher | 36 (73.5%) | 13 (26.5%) |
Occupancy by Age of Householder in Warner
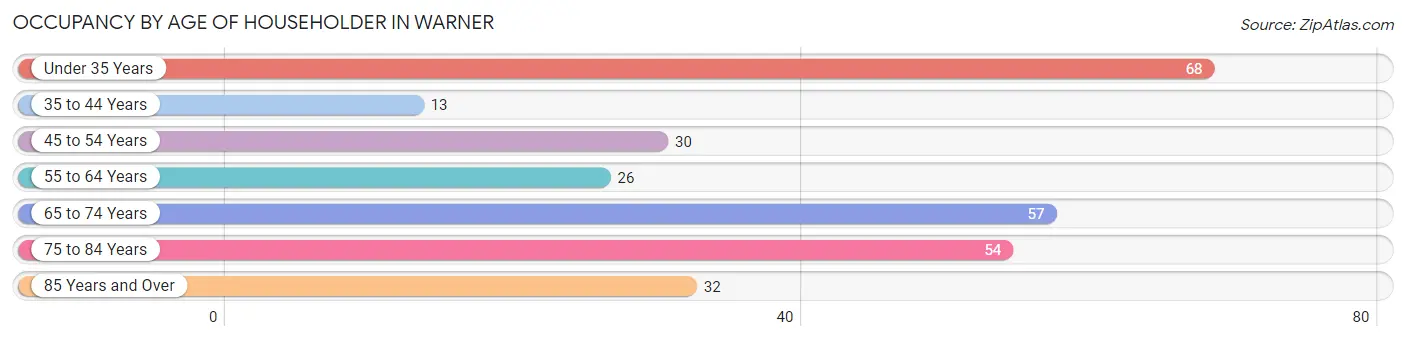
| Age Bracket | # Households | % Households |
| Under 35 Years | 68 | 24.3% |
| 35 to 44 Years | 13 | 4.6% |
| 45 to 54 Years | 30 | 10.7% |
| 55 to 64 Years | 26 | 9.3% |
| 65 to 74 Years | 57 | 20.4% |
| 75 to 84 Years | 54 | 19.3% |
| 85 Years and Over | 32 | 11.4% |
| Total | 280 | 100.0% |
Housing Finances in Warner
Median Income by Occupancy in Warner
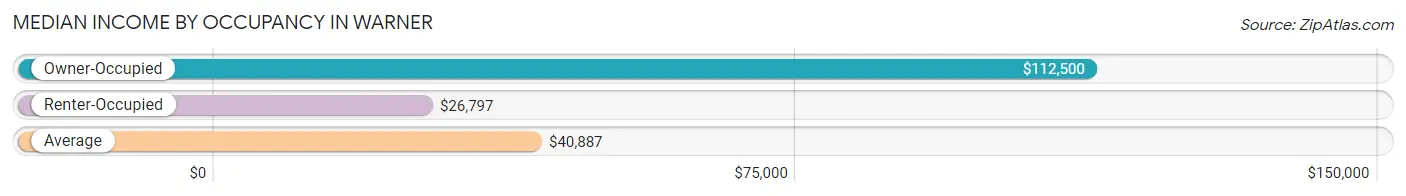
| Occupancy Type | # Households | Median Income |
| Owner-Occupied | 80 (28.6%) | $112,500 |
| Renter-Occupied | 200 (71.4%) | $26,797 |
| Average | 280 (100.0%) | $40,887 |
Occupancy by Householder Income Bracket in Warner
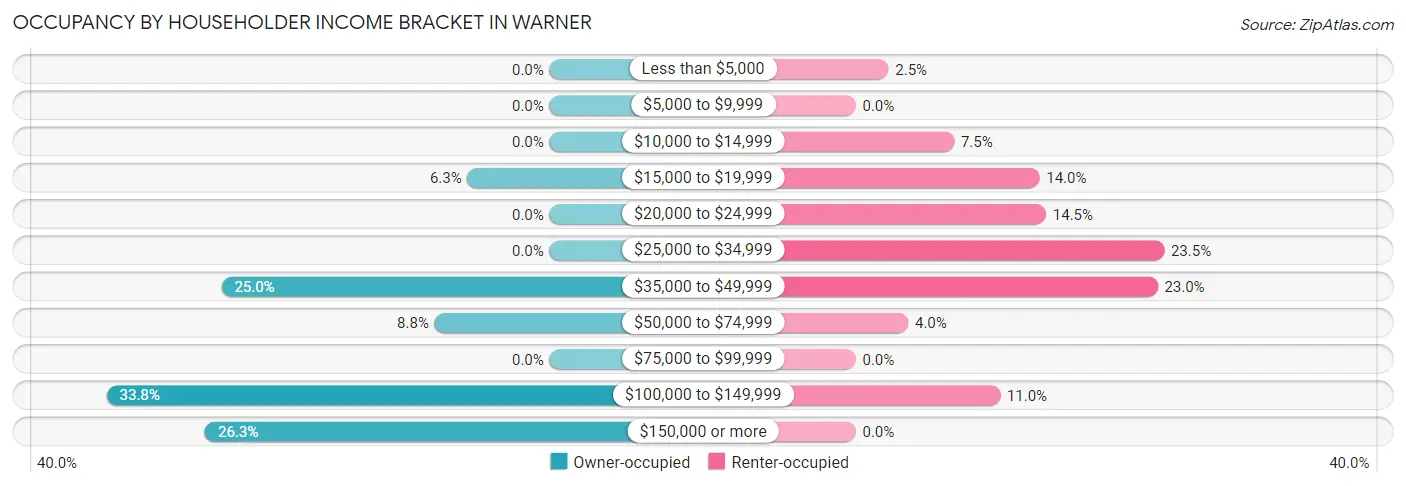
| Income Bracket | Owner-occupied | Renter-occupied |
| Less than $5,000 | 0 (0.0%) | 5 (2.5%) |
| $5,000 to $9,999 | 0 (0.0%) | 0 (0.0%) |
| $10,000 to $14,999 | 0 (0.0%) | 15 (7.5%) |
| $15,000 to $19,999 | 5 (6.2%) | 28 (14.0%) |
| $20,000 to $24,999 | 0 (0.0%) | 29 (14.5%) |
| $25,000 to $34,999 | 0 (0.0%) | 47 (23.5%) |
| $35,000 to $49,999 | 20 (25.0%) | 46 (23.0%) |
| $50,000 to $74,999 | 7 (8.7%) | 8 (4.0%) |
| $75,000 to $99,999 | 0 (0.0%) | 0 (0.0%) |
| $100,000 to $149,999 | 27 (33.8%) | 22 (11.0%) |
| $150,000 or more | 21 (26.3%) | 0 (0.0%) |
| Total | 80 (100.0%) | 200 (100.0%) |
Monthly Housing Cost Tiers in Warner
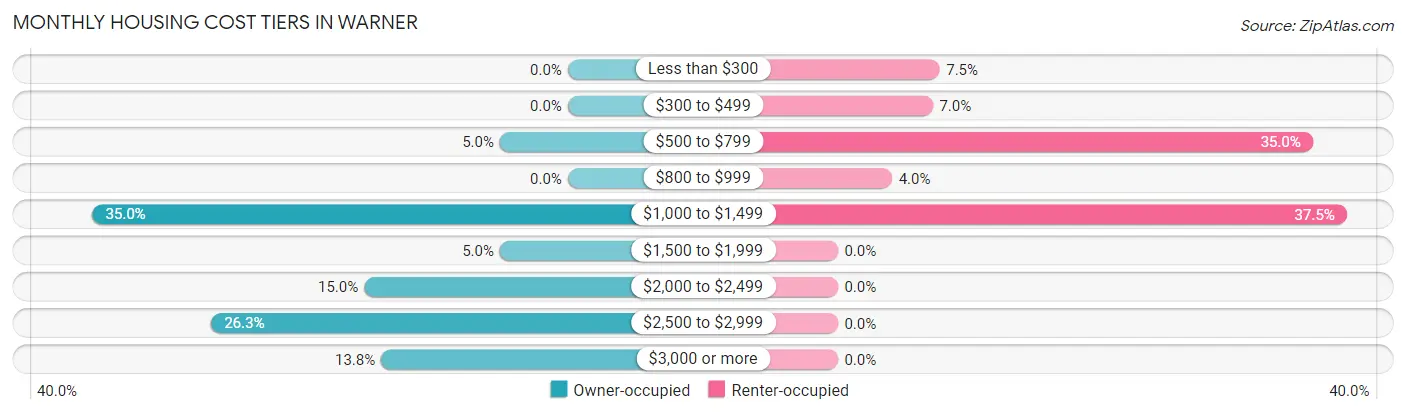
| Monthly Cost | Owner-occupied | Renter-occupied |
| Less than $300 | 0 (0.0%) | 15 (7.5%) |
| $300 to $499 | 0 (0.0%) | 14 (7.0%) |
| $500 to $799 | 4 (5.0%) | 70 (35.0%) |
| $800 to $999 | 0 (0.0%) | 8 (4.0%) |
| $1,000 to $1,499 | 28 (35.0%) | 75 (37.5%) |
| $1,500 to $1,999 | 4 (5.0%) | 0 (0.0%) |
| $2,000 to $2,499 | 12 (15.0%) | 0 (0.0%) |
| $2,500 to $2,999 | 21 (26.3%) | 0 (0.0%) |
| $3,000 or more | 11 (13.8%) | 0 (0.0%) |
| Total | 80 (100.0%) | 200 (100.0%) |
Physical Housing Characteristics in Warner
Housing Structures in Warner
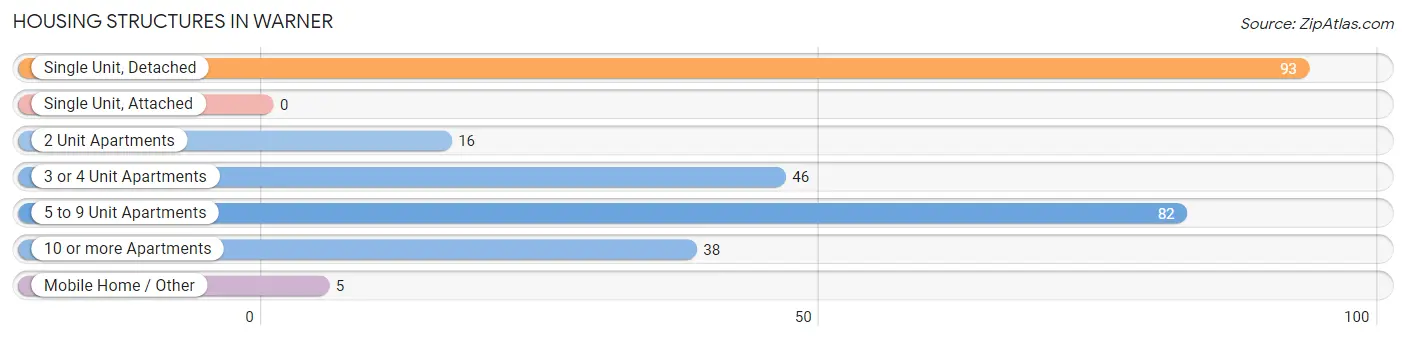
| Structure Type | # Housing Units | % Housing Units |
| Single Unit, Detached | 93 | 33.2% |
| Single Unit, Attached | 0 | 0.0% |
| 2 Unit Apartments | 16 | 5.7% |
| 3 or 4 Unit Apartments | 46 | 16.4% |
| 5 to 9 Unit Apartments | 82 | 29.3% |
| 10 or more Apartments | 38 | 13.6% |
| Mobile Home / Other | 5 | 1.8% |
| Total | 280 | 100.0% |
Housing Structures by Occupancy in Warner
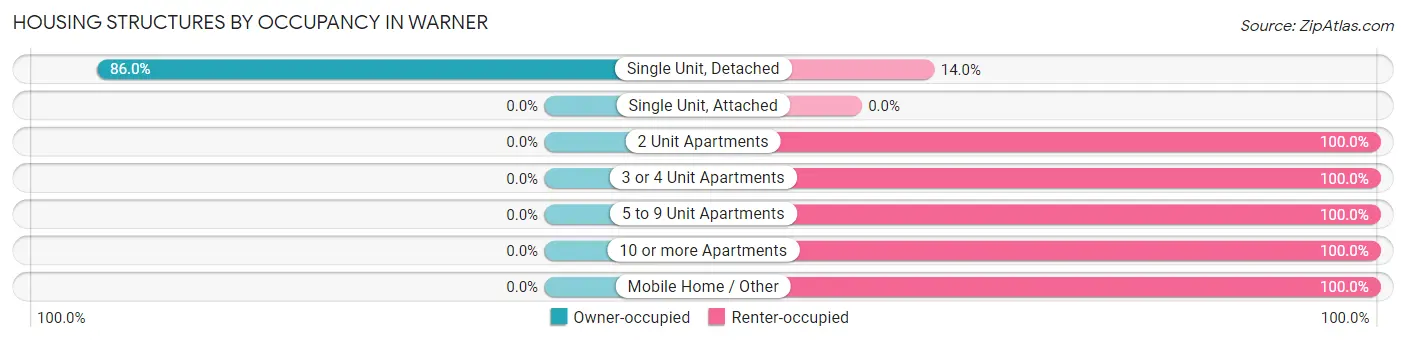
| Structure Type | Owner-occupied | Renter-occupied |
| Single Unit, Detached | 80 (86.0%) | 13 (14.0%) |
| Single Unit, Attached | 0 (0.0%) | 0 (0.0%) |
| 2 Unit Apartments | 0 (0.0%) | 16 (100.0%) |
| 3 or 4 Unit Apartments | 0 (0.0%) | 46 (100.0%) |
| 5 to 9 Unit Apartments | 0 (0.0%) | 82 (100.0%) |
| 10 or more Apartments | 0 (0.0%) | 38 (100.0%) |
| Mobile Home / Other | 0 (0.0%) | 5 (100.0%) |
| Total | 80 (28.6%) | 200 (71.4%) |
Housing Structures by Number of Rooms in Warner
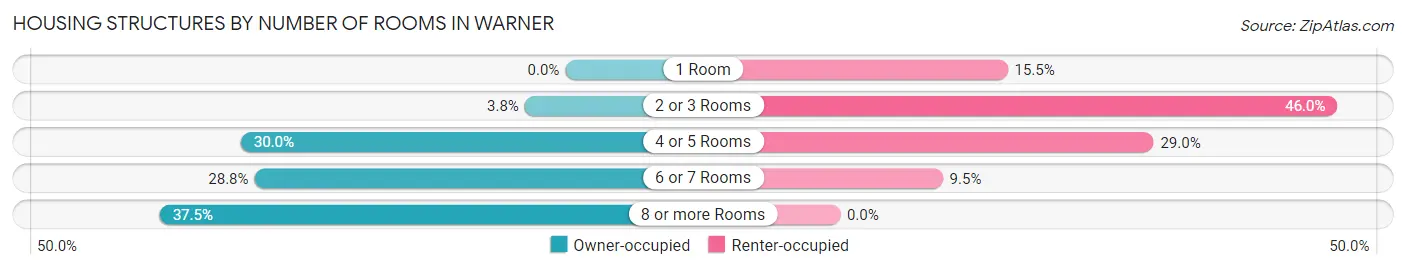
| Number of Rooms | Owner-occupied | Renter-occupied |
| 1 Room | 0 (0.0%) | 31 (15.5%) |
| 2 or 3 Rooms | 3 (3.7%) | 92 (46.0%) |
| 4 or 5 Rooms | 24 (30.0%) | 58 (29.0%) |
| 6 or 7 Rooms | 23 (28.7%) | 19 (9.5%) |
| 8 or more Rooms | 30 (37.5%) | 0 (0.0%) |
| Total | 80 (100.0%) | 200 (100.0%) |
Housing Structure by Heating Type in Warner
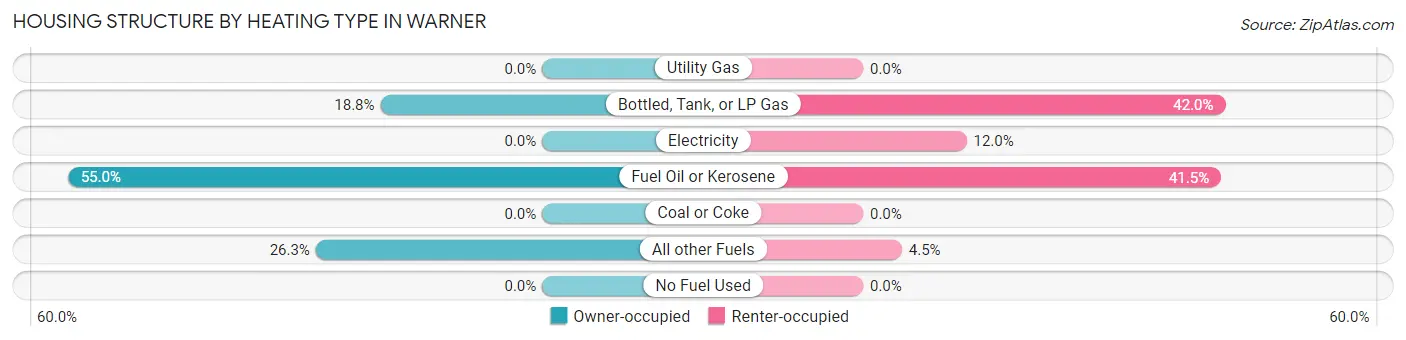
| Heating Type | Owner-occupied | Renter-occupied |
| Utility Gas | 0 (0.0%) | 0 (0.0%) |
| Bottled, Tank, or LP Gas | 15 (18.8%) | 84 (42.0%) |
| Electricity | 0 (0.0%) | 24 (12.0%) |
| Fuel Oil or Kerosene | 44 (55.0%) | 83 (41.5%) |
| Coal or Coke | 0 (0.0%) | 0 (0.0%) |
| All other Fuels | 21 (26.3%) | 9 (4.5%) |
| No Fuel Used | 0 (0.0%) | 0 (0.0%) |
| Total | 80 (100.0%) | 200 (100.0%) |
Household Vehicle Usage in Warner
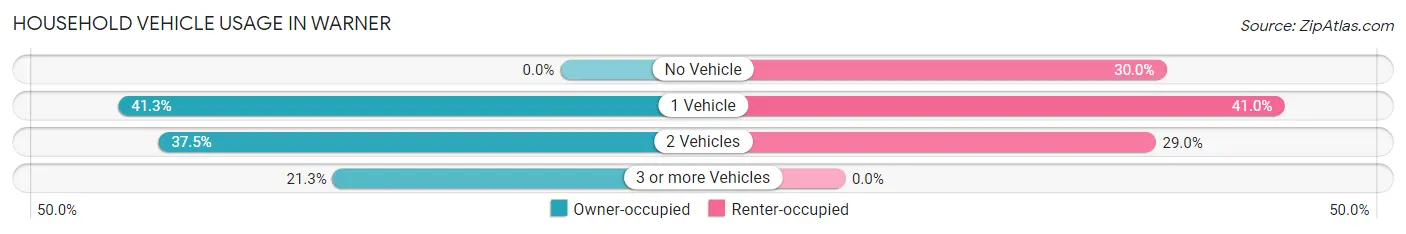
| Vehicles per Household | Owner-occupied | Renter-occupied |
| No Vehicle | 0 (0.0%) | 60 (30.0%) |
| 1 Vehicle | 33 (41.2%) | 82 (41.0%) |
| 2 Vehicles | 30 (37.5%) | 58 (29.0%) |
| 3 or more Vehicles | 17 (21.2%) | 0 (0.0%) |
| Total | 80 (100.0%) | 200 (100.0%) |
Real Estate & Mortgages in Warner
Real Estate and Mortgage Overview in Warner
| Characteristic | Without Mortgage | With Mortgage |
| Housing Units | 16 | 64 |
| Median Property Value | $311,100 | $312,900 |
| Median Household Income | $49,375 | $21 |
| Monthly Housing Costs | $1,100 | $11 |
| Real Estate Taxes | $6,818 | $0 |
Property Value by Mortgage Status in Warner
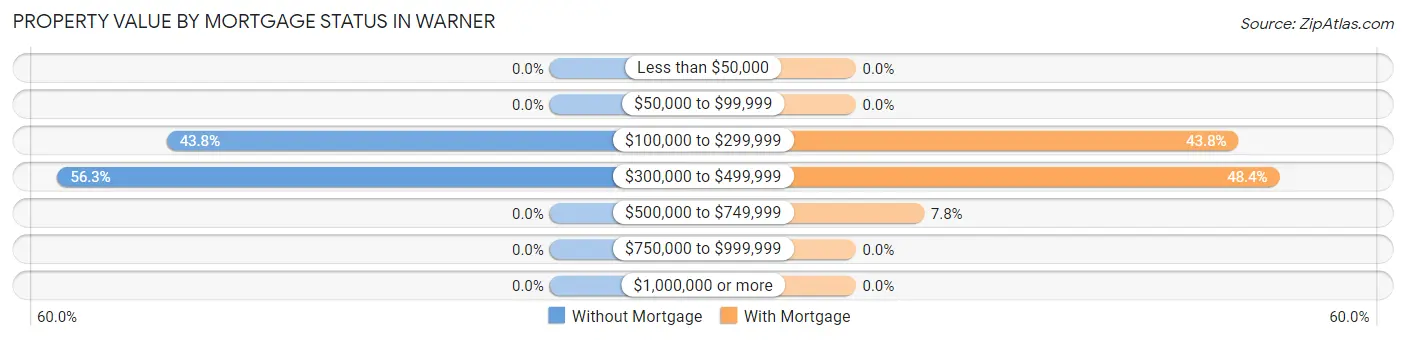
| Property Value | Without Mortgage | With Mortgage |
| Less than $50,000 | 0 (0.0%) | 0 (0.0%) |
| $50,000 to $99,999 | 0 (0.0%) | 0 (0.0%) |
| $100,000 to $299,999 | 7 (43.8%) | 28 (43.8%) |
| $300,000 to $499,999 | 9 (56.2%) | 31 (48.4%) |
| $500,000 to $749,999 | 0 (0.0%) | 5 (7.8%) |
| $750,000 to $999,999 | 0 (0.0%) | 0 (0.0%) |
| $1,000,000 or more | 0 (0.0%) | 0 (0.0%) |
| Total | 16 (100.0%) | 64 (100.0%) |
Household Income by Mortgage Status in Warner
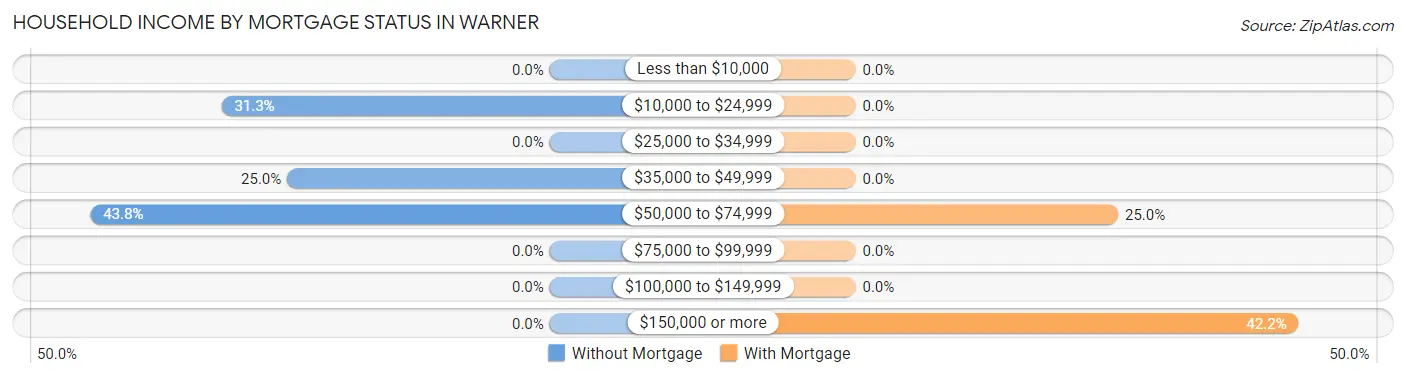
| Household Income | Without Mortgage | With Mortgage |
| Less than $10,000 | 0 (0.0%) | 0 (0.0%) |
| $10,000 to $24,999 | 5 (31.2%) | 0 (0.0%) |
| $25,000 to $34,999 | 0 (0.0%) | 0 (0.0%) |
| $35,000 to $49,999 | 4 (25.0%) | 0 (0.0%) |
| $50,000 to $74,999 | 7 (43.8%) | 16 (25.0%) |
| $75,000 to $99,999 | 0 (0.0%) | 0 (0.0%) |
| $100,000 to $149,999 | 0 (0.0%) | 0 (0.0%) |
| $150,000 or more | 0 (0.0%) | 27 (42.2%) |
| Total | 16 (100.0%) | 64 (100.0%) |
Property Value to Household Income Ratio in Warner
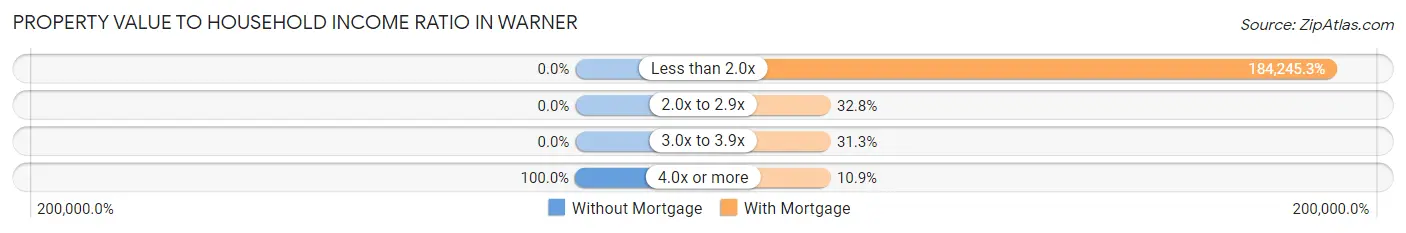
| Value-to-Income Ratio | Without Mortgage | With Mortgage |
| Less than 2.0x | 0 (0.0%) | 117,917 (184,245.3%) |
| 2.0x to 2.9x | 0 (0.0%) | 21 (32.8%) |
| 3.0x to 3.9x | 0 (0.0%) | 20 (31.2%) |
| 4.0x or more | 16 (100.0%) | 7 (10.9%) |
| Total | 16 (100.0%) | 64 (100.0%) |
Real Estate Taxes by Mortgage Status in Warner
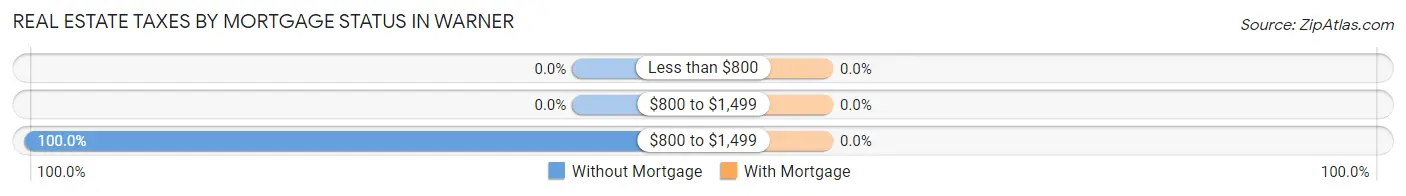
| Property Taxes | Without Mortgage | With Mortgage |
| Less than $800 | 0 (0.0%) | 0 (0.0%) |
| $800 to $1,499 | 0 (0.0%) | 0 (0.0%) |
| $800 to $1,499 | 16 (100.0%) | 0 (0.0%) |
| Total | 16 (100.0%) | 64 (100.0%) |
Health & Disability in Warner
Health Insurance Coverage by Age in Warner
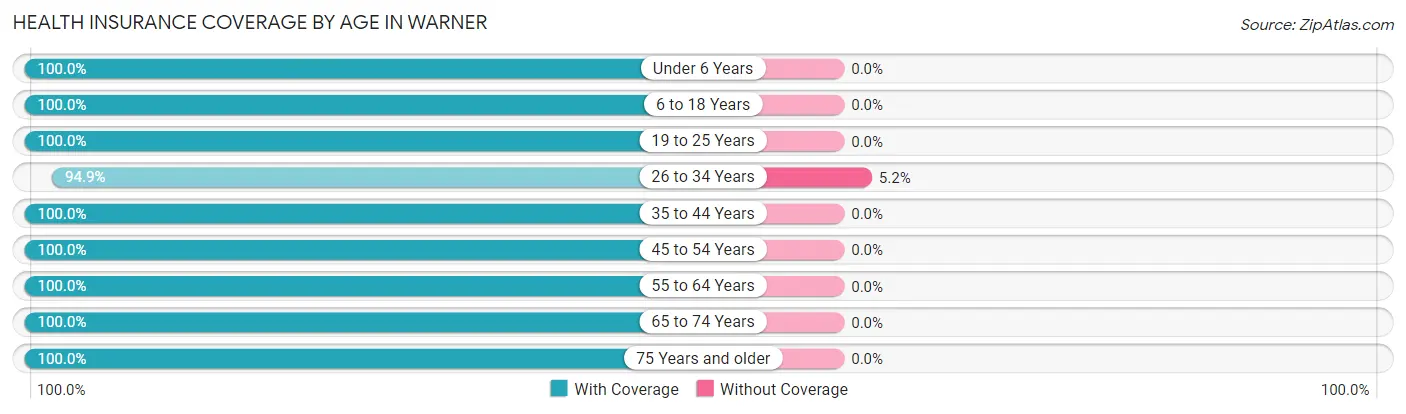
| Age Bracket | With Coverage | Without Coverage |
| Under 6 Years | 42 (100.0%) | 0 (0.0%) |
| 6 to 18 Years | 31 (100.0%) | 0 (0.0%) |
| 19 to 25 Years | 9 (100.0%) | 0 (0.0%) |
| 26 to 34 Years | 92 (94.9%) | 5 (5.1%) |
| 35 to 44 Years | 19 (100.0%) | 0 (0.0%) |
| 45 to 54 Years | 36 (100.0%) | 0 (0.0%) |
| 55 to 64 Years | 41 (100.0%) | 0 (0.0%) |
| 65 to 74 Years | 60 (100.0%) | 0 (0.0%) |
| 75 Years and older | 90 (100.0%) | 0 (0.0%) |
| Total | 420 (98.8%) | 5 (1.2%) |
Health Insurance Coverage by Citizenship Status in Warner
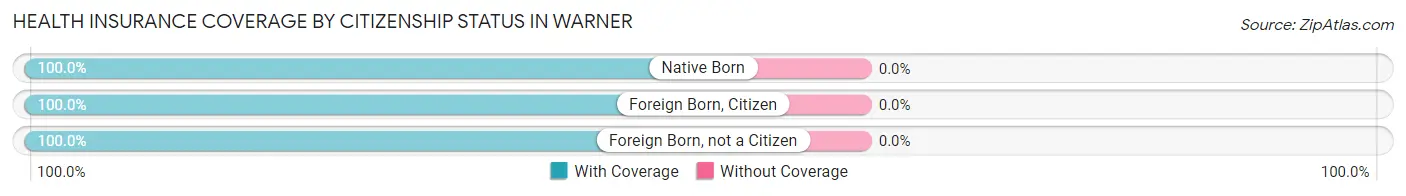
| Citizenship Status | With Coverage | Without Coverage |
| Native Born | 42 (100.0%) | 0 (0.0%) |
| Foreign Born, Citizen | 31 (100.0%) | 0 (0.0%) |
| Foreign Born, not a Citizen | 9 (100.0%) | 0 (0.0%) |
Health Insurance Coverage by Household Income in Warner
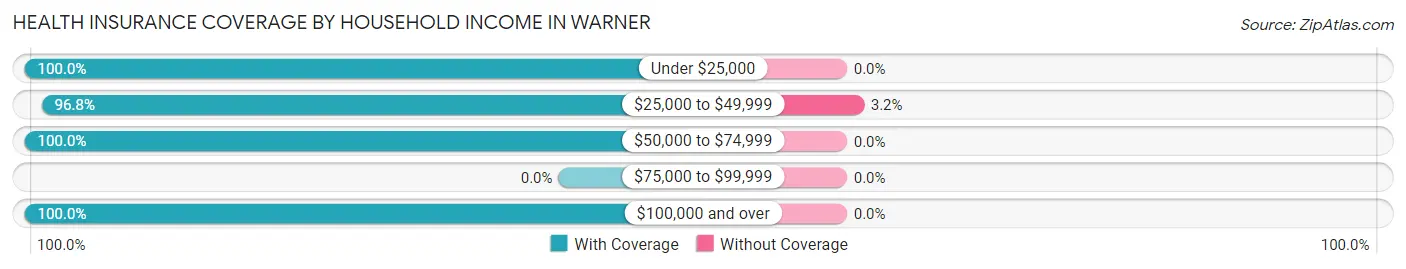
| Household Income | With Coverage | Without Coverage |
| Under $25,000 | 82 (100.0%) | 0 (0.0%) |
| $25,000 to $49,999 | 152 (96.8%) | 5 (3.2%) |
| $50,000 to $74,999 | 19 (100.0%) | 0 (0.0%) |
| $75,000 to $99,999 | 0 (0.0%) | 0 (0.0%) |
| $100,000 and over | 167 (100.0%) | 0 (0.0%) |
Public vs Private Health Insurance Coverage by Age in Warner
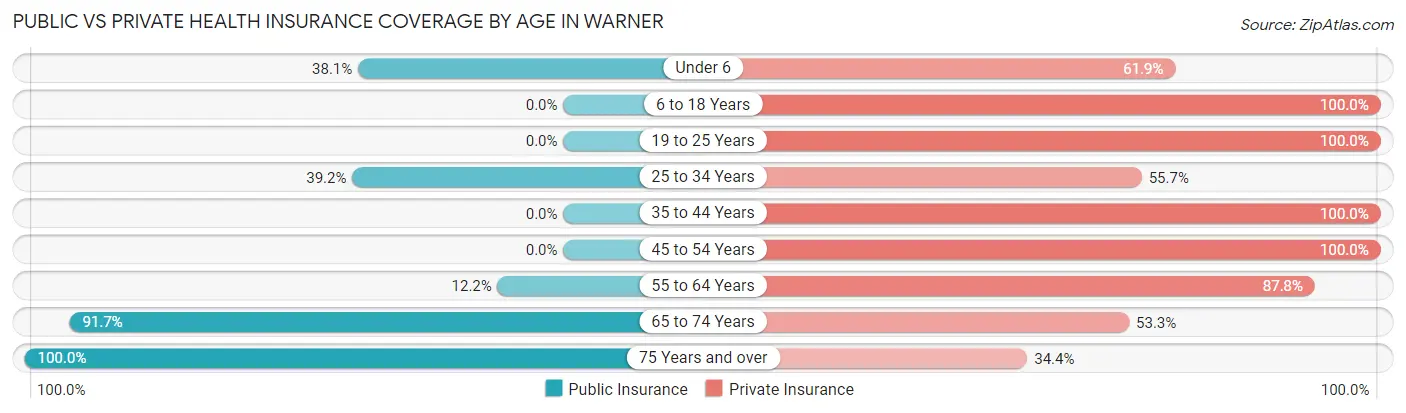
| Age Bracket | Public Insurance | Private Insurance |
| Under 6 | 16 (38.1%) | 26 (61.9%) |
| 6 to 18 Years | 0 (0.0%) | 31 (100.0%) |
| 19 to 25 Years | 0 (0.0%) | 9 (100.0%) |
| 25 to 34 Years | 38 (39.2%) | 54 (55.7%) |
| 35 to 44 Years | 0 (0.0%) | 19 (100.0%) |
| 45 to 54 Years | 0 (0.0%) | 36 (100.0%) |
| 55 to 64 Years | 5 (12.2%) | 36 (87.8%) |
| 65 to 74 Years | 55 (91.7%) | 32 (53.3%) |
| 75 Years and over | 90 (100.0%) | 31 (34.4%) |
| Total | 204 (48.0%) | 274 (64.5%) |
Disability Status by Sex by Age in Warner
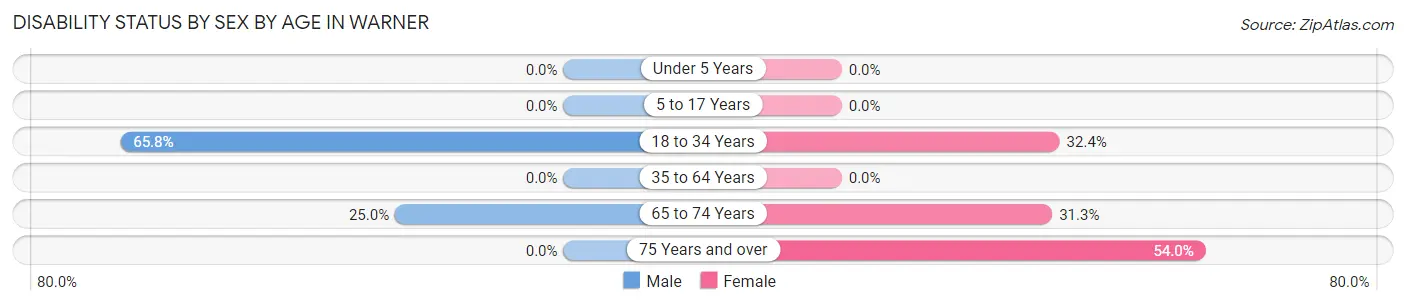
| Age Bracket | Male | Female |
| Under 5 Years | 0 (0.0%) | 0 (0.0%) |
| 5 to 17 Years | 0 (0.0%) | 0 (0.0%) |
| 18 to 34 Years | 25 (65.8%) | 22 (32.4%) |
| 35 to 64 Years | 0 (0.0%) | 0 (0.0%) |
| 65 to 74 Years | 3 (25.0%) | 15 (31.2%) |
| 75 Years and over | 0 (0.0%) | 47 (54.0%) |
Disability Class by Sex by Age in Warner
Disability Class: Hearing Difficulty
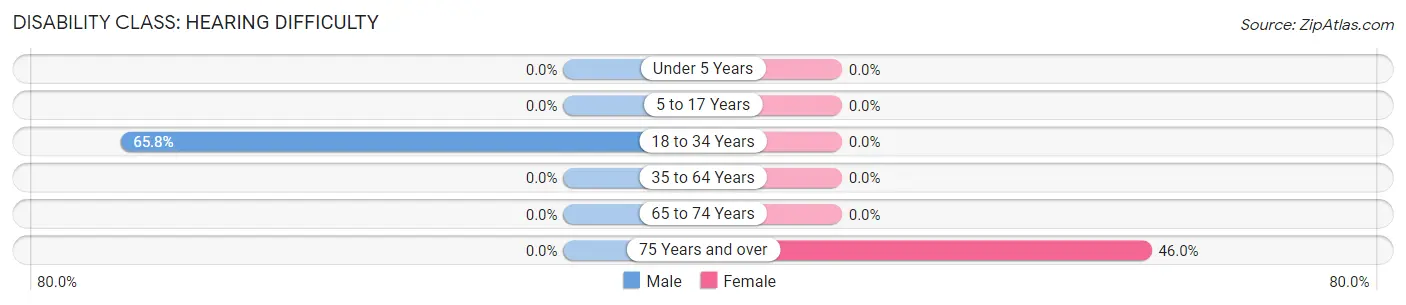
| Age Bracket | Male | Female |
| Under 5 Years | 0 (0.0%) | 0 (0.0%) |
| 5 to 17 Years | 0 (0.0%) | 0 (0.0%) |
| 18 to 34 Years | 25 (65.8%) | 0 (0.0%) |
| 35 to 64 Years | 0 (0.0%) | 0 (0.0%) |
| 65 to 74 Years | 0 (0.0%) | 0 (0.0%) |
| 75 Years and over | 0 (0.0%) | 40 (46.0%) |
Disability Class: Vision Difficulty
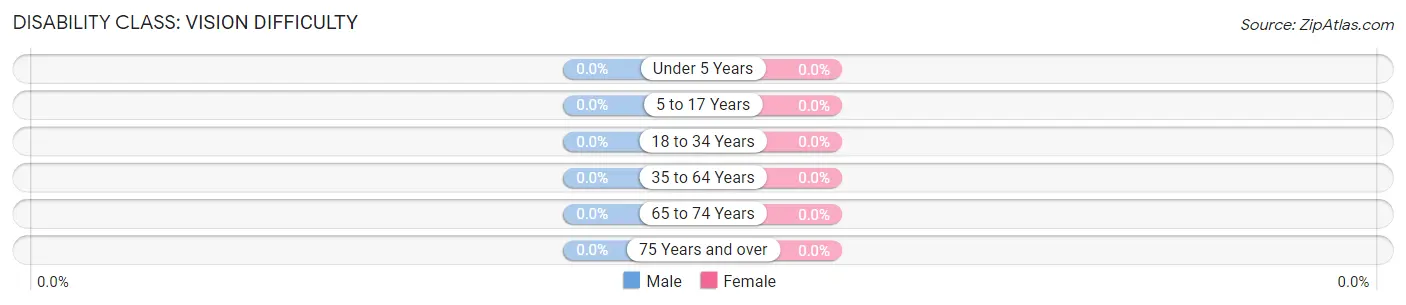
| Age Bracket | Male | Female |
| Under 5 Years | 0 (0.0%) | 0 (0.0%) |
| 5 to 17 Years | 0 (0.0%) | 0 (0.0%) |
| 18 to 34 Years | 0 (0.0%) | 0 (0.0%) |
| 35 to 64 Years | 0 (0.0%) | 0 (0.0%) |
| 65 to 74 Years | 0 (0.0%) | 0 (0.0%) |
| 75 Years and over | 0 (0.0%) | 0 (0.0%) |
Disability Class: Cognitive Difficulty

| Age Bracket | Male | Female |
| 5 to 17 Years | 0 (0.0%) | 0 (0.0%) |
| 18 to 34 Years | 0 (0.0%) | 0 (0.0%) |
| 35 to 64 Years | 0 (0.0%) | 0 (0.0%) |
| 65 to 74 Years | 3 (25.0%) | 0 (0.0%) |
| 75 Years and over | 0 (0.0%) | 0 (0.0%) |
Disability Class: Ambulatory Difficulty
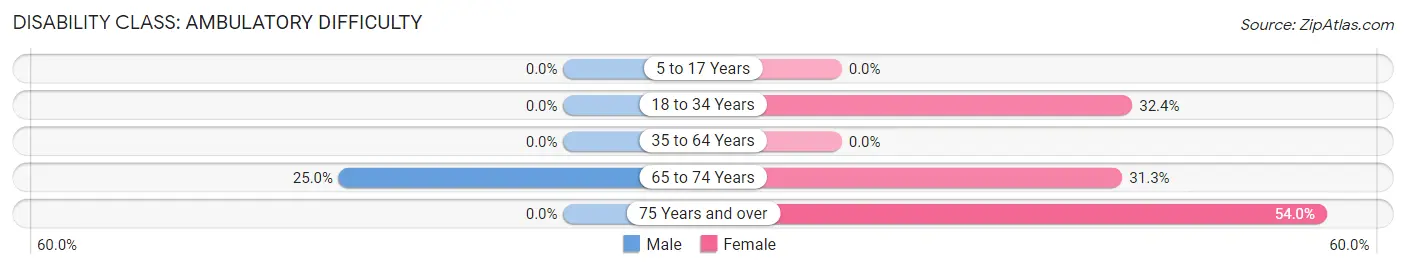
| Age Bracket | Male | Female |
| 5 to 17 Years | 0 (0.0%) | 0 (0.0%) |
| 18 to 34 Years | 0 (0.0%) | 22 (32.4%) |
| 35 to 64 Years | 0 (0.0%) | 0 (0.0%) |
| 65 to 74 Years | 3 (25.0%) | 15 (31.2%) |
| 75 Years and over | 0 (0.0%) | 47 (54.0%) |
Disability Class: Self-Care Difficulty
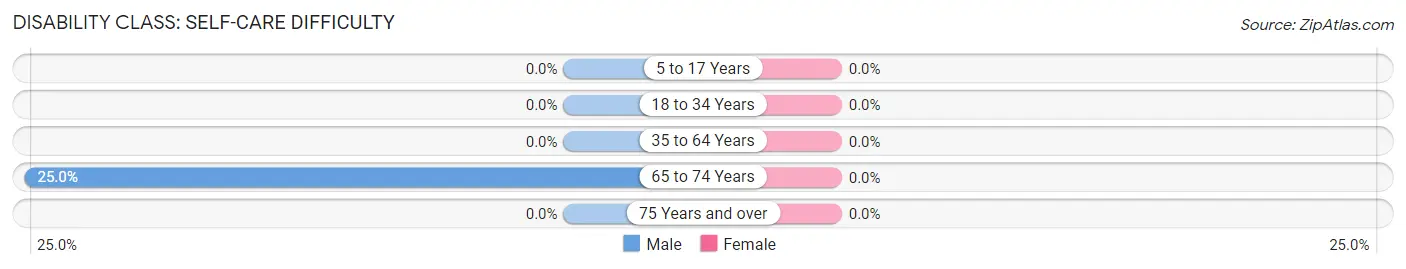
| Age Bracket | Male | Female |
| 5 to 17 Years | 0 (0.0%) | 0 (0.0%) |
| 18 to 34 Years | 0 (0.0%) | 0 (0.0%) |
| 35 to 64 Years | 0 (0.0%) | 0 (0.0%) |
| 65 to 74 Years | 3 (25.0%) | 0 (0.0%) |
| 75 Years and over | 0 (0.0%) | 0 (0.0%) |
Technology Access in Warner
Computing Device Access in Warner
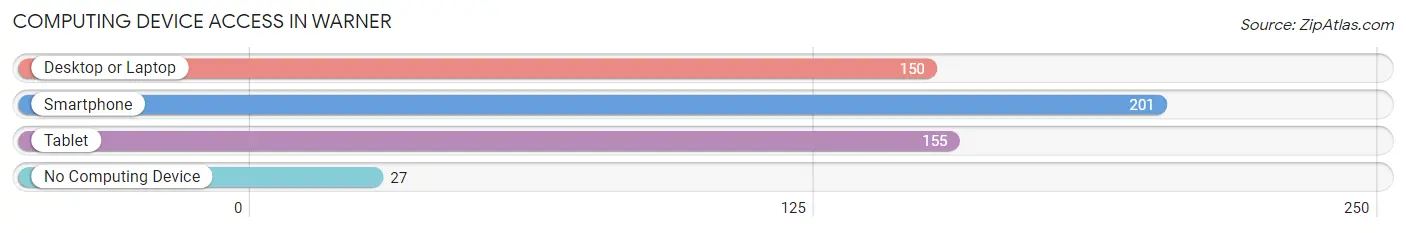
| Device Type | # Households | % Households |
| Desktop or Laptop | 150 | 53.6% |
| Smartphone | 201 | 71.8% |
| Tablet | 155 | 55.4% |
| No Computing Device | 27 | 9.6% |
| Total | 280 | 100.0% |
Internet Access in Warner
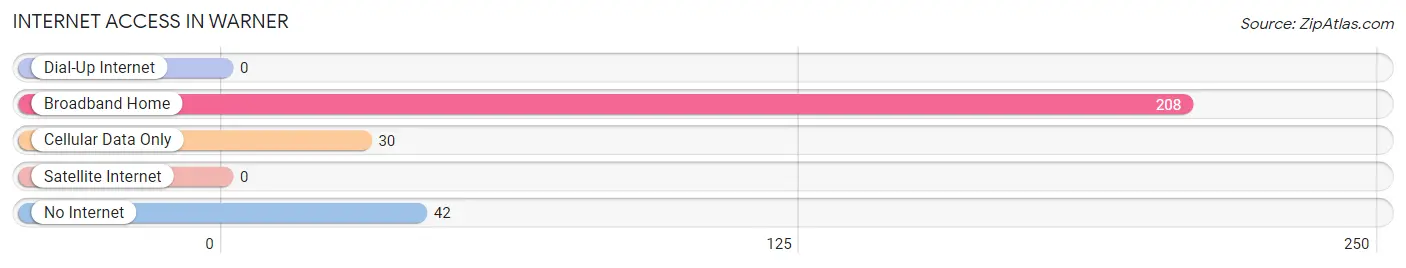
| Internet Type | # Households | % Households |
| Dial-Up Internet | 0 | 0.0% |
| Broadband Home | 208 | 74.3% |
| Cellular Data Only | 30 | 10.7% |
| Satellite Internet | 0 | 0.0% |
| No Internet | 42 | 15.0% |
| Total | 280 | 100.0% |
Warner Summary
Warner is a town located in Merrimack County, New Hampshire. It is situated in the southeastern part of the state, about 25 miles from the state capital of Concord. The town has a population of approximately 2,500 people, and covers an area of approximately 33 square miles.
Geography
Warner is located in the Merrimack Valley region of New Hampshire. The town is bordered by Hopkinton to the north, Webster to the east, Bradford to the south, and Sutton to the west. The Warner River flows through the town, and the Warner River State Park is located in the northern part of the town. The highest point in Warner is located at the summit of Mount Kearsarge, which has an elevation of 2,937 feet.
Climate
Warner has a humid continental climate, with cold winters and warm summers. The average annual temperature is around 43 degrees Fahrenheit, and the average annual precipitation is around 40 inches.
Economy
The economy of Warner is largely based on agriculture and tourism. The town is home to several farms, which produce a variety of crops, including apples, corn, and hay. The town is also home to several small businesses, including restaurants, retail stores, and a variety of service-based businesses. Tourism is also an important part of the local economy, as the town is home to several attractions, including the Warner River State Park, the Warner Historical Society, and the Warner Town Hall.
Demographics
As of the 2010 census, the population of Warner was 2,543. The racial makeup of the town was 97.3% White, 0.4% African American, 0.3% Native American, 0.3% Asian, 0.1% Pacific Islander, 0.3% from other races, and 1.2% from two or more races. The median household income in Warner was $50,938, and the median family income was $60,938. The per capita income in Warner was $25,938.
Education
Warner is served by the Kearsarge Regional School District, which includes the towns of Warner, Hopkinton, and Sutton. The district operates two elementary schools, one middle school, and one high school. The town is also home to the Kearsarge Regional High School, which serves students from all three towns.
Conclusion
Warner is a small town located in Merrimack County, New Hampshire. The town has a population of approximately 2,500 people, and covers an area of approximately 33 square miles. The economy of Warner is largely based on agriculture and tourism, and the town is served by the Kearsarge Regional School District. Warner is a beautiful town with a rich history and a vibrant economy, making it an ideal place to live and work.
Common Questions
What is Per Capita Income in Warner?
Per Capita income in Warner is $39,876.
What is the Median Household income in Warner?
Median Household Income in Warner is $40,887.
What is Income or Wage Gap in Warner?
Income or Wage Gap in Warner is 49.2%.
Women in Warner earn 50.8 cents for every dollar earned by a man.
What is Inequality or Gini Index in Warner?
Inequality or Gini Index in Warner is 0.49.
What is the Total Population of Warner?
Total Population of Warner is 425.
What is the Total Male Population of Warner?
Total Male Population of Warner is 130.
What is the Total Female Population of Warner?
Total Female Population of Warner is 295.
What is the Ratio of Males per 100 Females in Warner?
There are 44.07 Males per 100 Females in Warner.
What is the Ratio of Females per 100 Males in Warner?
There are 226.92 Females per 100 Males in Warner.
What is the Median Population Age in Warner?
Median Population Age in Warner is 47.0 Years.
What is the Average Family Size in Warner
Average Family Size in Warner is 2.0 People.
What is the Average Household Size in Warner
Average Household Size in Warner is 1.5 People.
How Large is the Labor Force in Warner?
There are 170 People in the Labor Forcein in Warner.
What is the Percentage of People in the Labor Force in Warner?
46.7% of People are in the Labor Force in Warner.