Center Ossipee, NH Map & Demographics
Center Ossipee Map
Center Ossipee Overview
$22,549
PER CAPITA INCOME
$50,096
AVG HOUSEHOLD INCOME
4.6%
WAGE / INCOME GAP [ % ]
95.4¢/ $1
WAGE / INCOME GAP [ $ ]
0.36
INEQUALITY / GINI INDEX
679
TOTAL POPULATION
346
MALE POPULATION
333
FEMALE POPULATION
103.90
MALES / 100 FEMALES
96.24
FEMALES / 100 MALES
41.5
MEDIAN AGE
3.7
AVG FAMILY SIZE
3.0
AVG HOUSEHOLD SIZE
456
LABOR FORCE [ PEOPLE ]
78.5%
PERCENT IN LABOR FORCE
13.4%
UNEMPLOYMENT RATE
Center Ossipee Zip Codes
Center Ossipee Area Codes
Income in Center Ossipee
Income Overview in Center Ossipee
| Characteristic | Number | Measure |
| Per Capita Income | 679 | $22,549 |
| Median Family Income | 162 | $0 |
| Mean Family Income | 162 | $75,565 |
| Median Household Income | 221 | $50,096 |
| Mean Household Income | 221 | $64,177 |
| Income Deficit | 162 | $0 |
| Wage / Income Gap (%) | 679 | 4.61% |
| Wage / Income Gap ($) | 679 | 95.39¢ per $1 |
| Gini / Inequality Index | 679 | 0.36 |
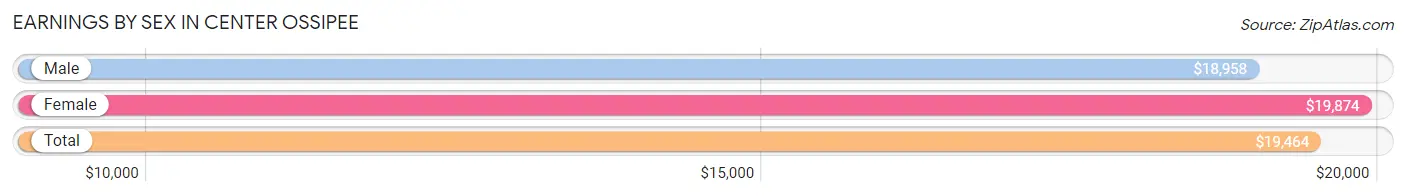
Earnings by Sex in Center Ossipee
Average Earnings in Center Ossipee are $19,464, $18,958 for men and $19,874 for women, a difference of 4.6%.
| Sex | Number | Average Earnings |
| Male | 228 (48.8%) | $18,958 |
| Female | 239 (51.2%) | $19,874 |
| Total | 467 (100.0%) | $19,464 |
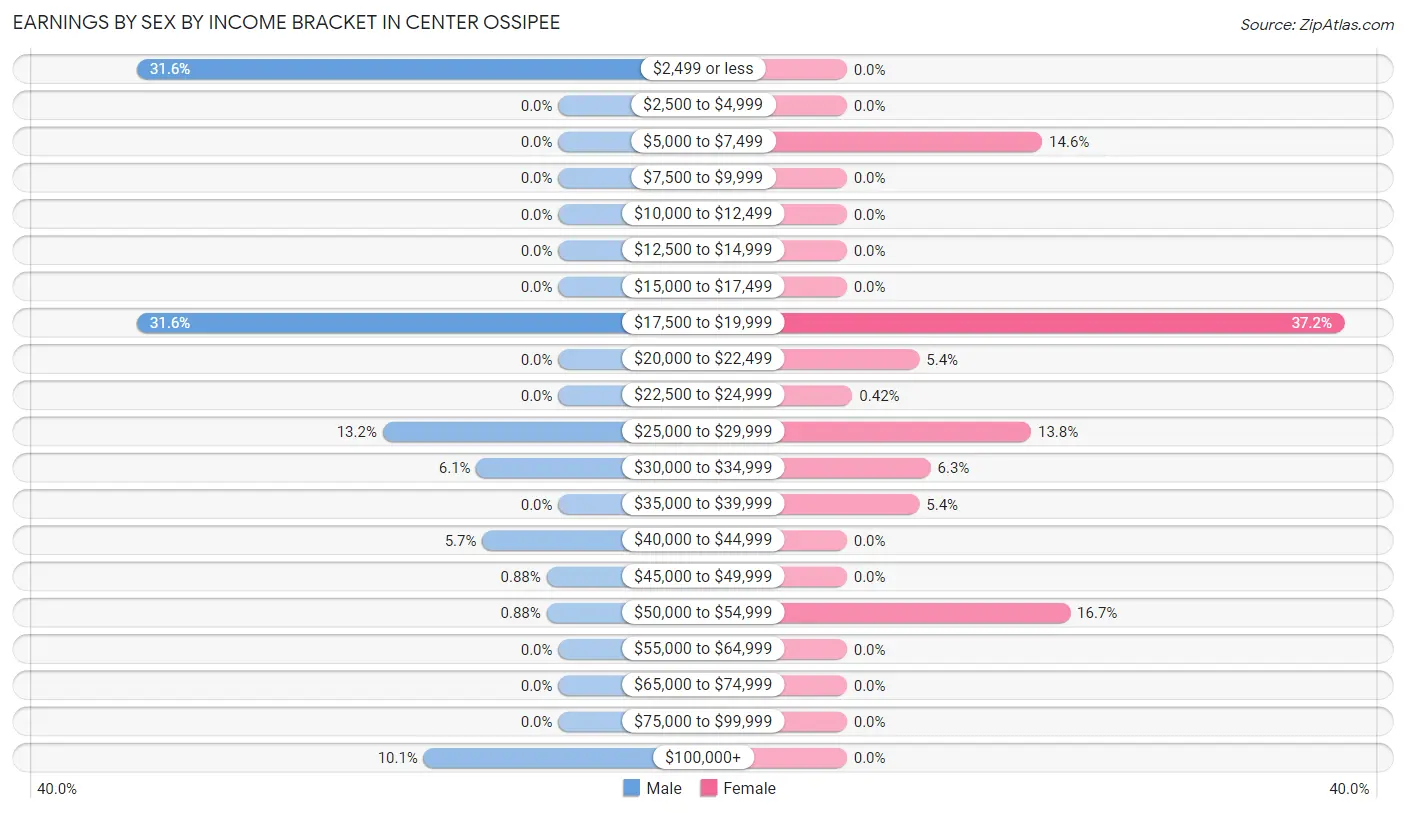
Earnings by Sex by Income Bracket in Center Ossipee
The most common earnings brackets in Center Ossipee are $2,499 or less for men (72 | 31.6%) and $17,500 to $19,999 for women (89 | 37.2%).
| Income | Male | Female |
| $2,499 or less | 72 (31.6%) | 0 (0.0%) |
| $2,500 to $4,999 | 0 (0.0%) | 0 (0.0%) |
| $5,000 to $7,499 | 0 (0.0%) | 35 (14.6%) |
| $7,500 to $9,999 | 0 (0.0%) | 0 (0.0%) |
| $10,000 to $12,499 | 0 (0.0%) | 0 (0.0%) |
| $12,500 to $14,999 | 0 (0.0%) | 0 (0.0%) |
| $15,000 to $17,499 | 0 (0.0%) | 0 (0.0%) |
| $17,500 to $19,999 | 72 (31.6%) | 89 (37.2%) |
| $20,000 to $22,499 | 0 (0.0%) | 13 (5.4%) |
| $22,500 to $24,999 | 0 (0.0%) | 1 (0.4%) |
| $25,000 to $29,999 | 30 (13.2%) | 33 (13.8%) |
| $30,000 to $34,999 | 14 (6.1%) | 15 (6.3%) |
| $35,000 to $39,999 | 0 (0.0%) | 13 (5.4%) |
| $40,000 to $44,999 | 13 (5.7%) | 0 (0.0%) |
| $45,000 to $49,999 | 2 (0.9%) | 0 (0.0%) |
| $50,000 to $54,999 | 2 (0.9%) | 40 (16.7%) |
| $55,000 to $64,999 | 0 (0.0%) | 0 (0.0%) |
| $65,000 to $74,999 | 0 (0.0%) | 0 (0.0%) |
| $75,000 to $99,999 | 0 (0.0%) | 0 (0.0%) |
| $100,000+ | 23 (10.1%) | 0 (0.0%) |
| Total | 228 (100.0%) | 239 (100.0%) |
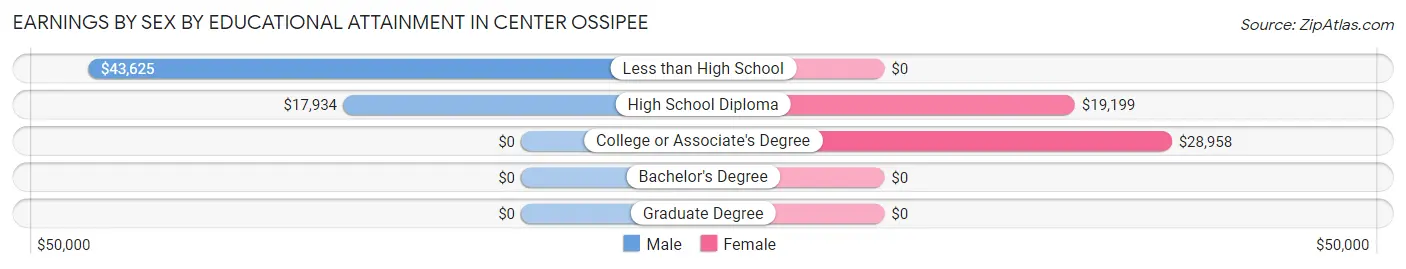
Earnings by Sex by Educational Attainment in Center Ossipee
Average earnings in Center Ossipee are $18,958 for men and $19,874 for women, a difference of 4.6%. Men with an educational attainment of less than high school enjoy the highest average annual earnings of $43,625, while those with high school diploma education earn the least with $17,934. Women with an educational attainment of college or associate's degree earn the most with the average annual earnings of $28,958, while those with high school diploma education have the smallest earnings of $19,199.
| Educational Attainment | Male Income | Female Income |
| Less than High School | $43,625 | $0 |
| High School Diploma | $17,934 | $19,199 |
| College or Associate's Degree | - | - |
| Bachelor's Degree | - | - |
| Graduate Degree | - | - |
| Total | $18,958 | $19,874 |
Family Income in Center Ossipee
Family Income Brackets in Center Ossipee
According to the Center Ossipee family income data, there are 67 families falling into the $100,000 to $149,999 income range, which is the most common income bracket and makes up 41.4% of all families.
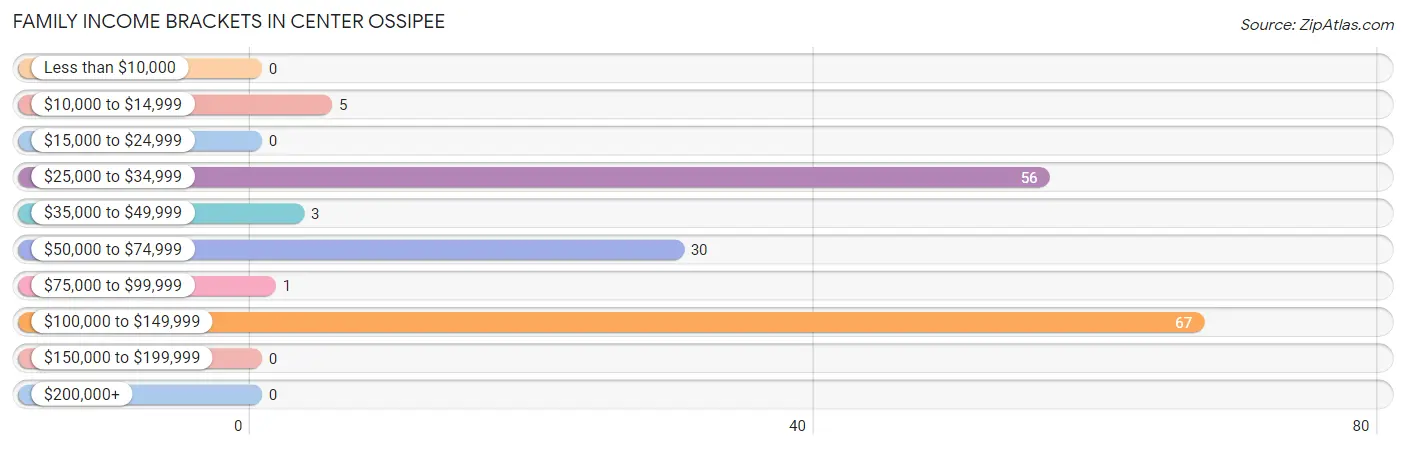
| Income Bracket | # Families | % Families |
| Less than $10,000 | 0 | 0.0% |
| $10,000 to $14,999 | 5 | 3.1% |
| $15,000 to $24,999 | 0 | 0.0% |
| $25,000 to $34,999 | 56 | 34.6% |
| $35,000 to $49,999 | 3 | 1.9% |
| $50,000 to $74,999 | 30 | 18.5% |
| $75,000 to $99,999 | 1 | 0.6% |
| $100,000 to $149,999 | 67 | 41.4% |
| $150,000 to $199,999 | 0 | 0.0% |
| $200,000+ | 0 | 0.0% |
Family Income by Famaliy Size in Center Ossipee
3-person families (39 | 24.1%) account for the highest median family income in Center Ossipee with $65,875 per family, while 3-person families (39 | 24.1%) have the highest median income of $21,958 per family member.
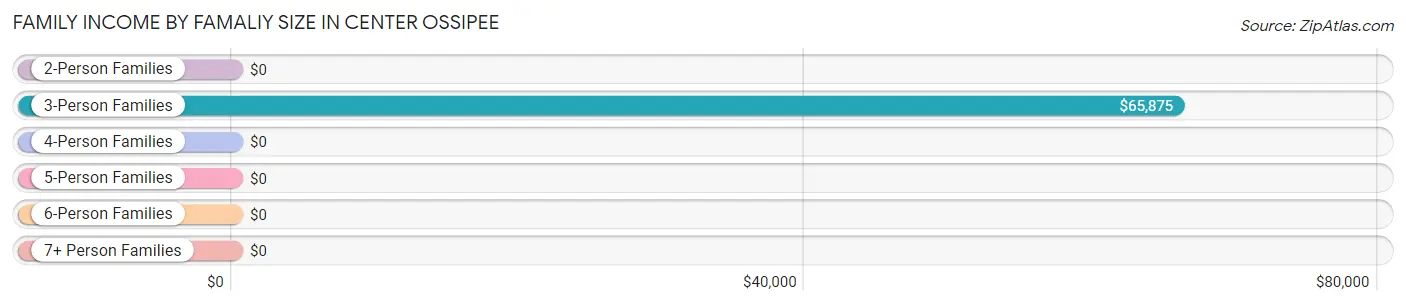
| Income Bracket | # Families | Median Income |
| 2-Person Families | 78 (48.1%) | $0 |
| 3-Person Families | 39 (24.1%) | $65,875 |
| 4-Person Families | 5 (3.1%) | $0 |
| 5-Person Families | 40 (24.7%) | $0 |
| 6-Person Families | 0 (0.0%) | $0 |
| 7+ Person Families | 0 (0.0%) | $0 |
| Total | 162 (100.0%) | $0 |
Family Income by Number of Earners in Center Ossipee
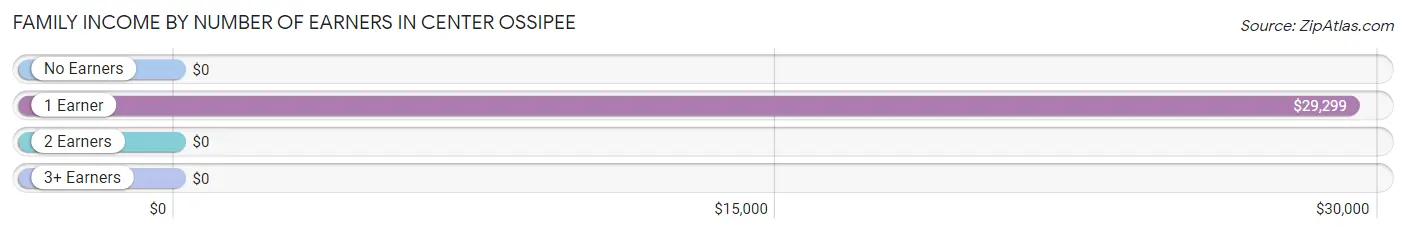
| Number of Earners | # Families | Median Income |
| No Earners | 5 (3.1%) | $0 |
| 1 Earner | 59 (36.4%) | $29,299 |
| 2 Earners | 58 (35.8%) | $0 |
| 3+ Earners | 40 (24.7%) | $0 |
| Total | 162 (100.0%) | $0 |
Household Income in Center Ossipee
Household Income Brackets in Center Ossipee
With 67 households falling in the category, the $100,000 to $149,999 income range is the most frequent in Center Ossipee, accounting for 30.3% of all households.
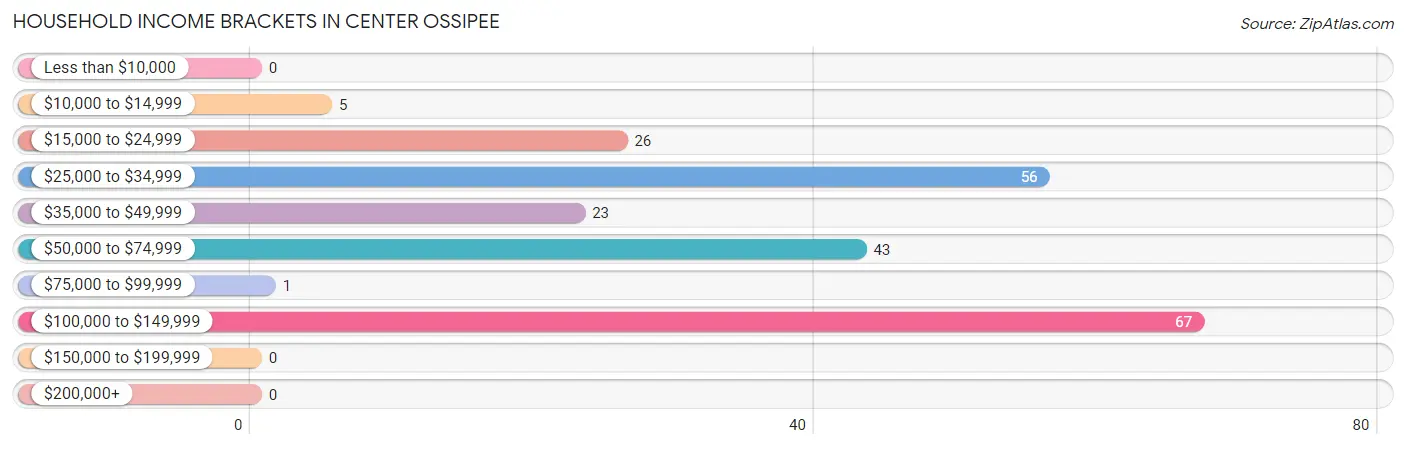
| Income Bracket | # Households | % Households |
| Less than $10,000 | 0 | 0.0% |
| $10,000 to $14,999 | 5 | 2.3% |
| $15,000 to $24,999 | 26 | 11.8% |
| $25,000 to $34,999 | 56 | 25.3% |
| $35,000 to $49,999 | 23 | 10.4% |
| $50,000 to $74,999 | 43 | 19.5% |
| $75,000 to $99,999 | 1 | 0.5% |
| $100,000 to $149,999 | 67 | 30.3% |
| $150,000 to $199,999 | 0 | 0.0% |
| $200,000+ | 0 | 0.0% |
Household Income by Householder Age in Center Ossipee
The median household income in Center Ossipee is $50,096, with the highest median household income of $29,543 found in the 25 to 44 years age bracket for the primary householder. A total of 77 households (34.8%) fall into this category.
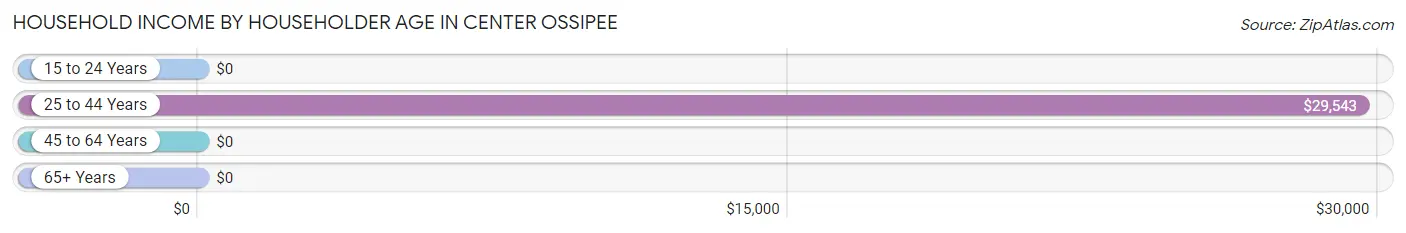
| Income Bracket | # Households | Median Income |
| 15 to 24 Years | 0 (0.0%) | $0 |
| 25 to 44 Years | 77 (34.8%) | $29,543 |
| 45 to 64 Years | 68 (30.8%) | $0 |
| 65+ Years | 76 (34.4%) | $0 |
| Total | 221 (100.0%) | $50,096 |
Poverty in Center Ossipee
Income Below Poverty by Sex and Age in Center Ossipee
With 2.0% poverty level for males and 4.2% for females among the residents of Center Ossipee, 12 to 14 year old males and 6 to 11 year old females are the most vulnerable to poverty, with 4 males (40.0%) and 9 females (23.1%) in their respective age groups living below the poverty level.
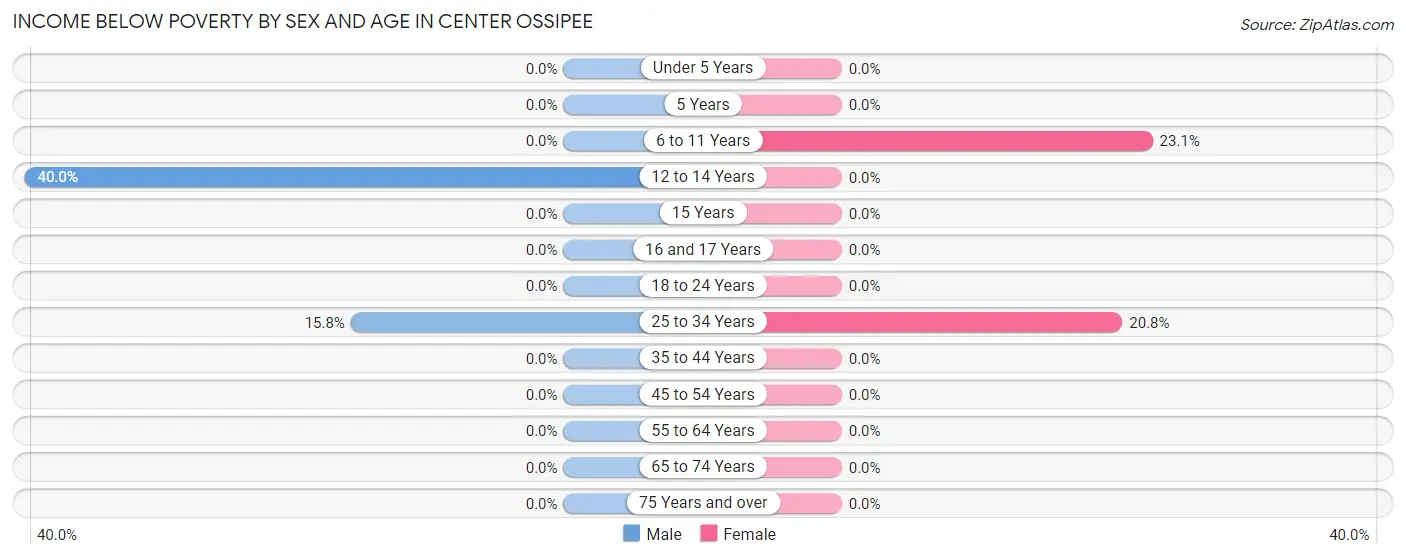
| Age Bracket | Male | Female |
| Under 5 Years | 0 (0.0%) | 0 (0.0%) |
| 5 Years | 0 (0.0%) | 0 (0.0%) |
| 6 to 11 Years | 0 (0.0%) | 9 (23.1%) |
| 12 to 14 Years | 4 (40.0%) | 0 (0.0%) |
| 15 Years | 0 (0.0%) | 0 (0.0%) |
| 16 and 17 Years | 0 (0.0%) | 0 (0.0%) |
| 18 to 24 Years | 0 (0.0%) | 0 (0.0%) |
| 25 to 34 Years | 3 (15.8%) | 5 (20.8%) |
| 35 to 44 Years | 0 (0.0%) | 0 (0.0%) |
| 45 to 54 Years | 0 (0.0%) | 0 (0.0%) |
| 55 to 64 Years | 0 (0.0%) | 0 (0.0%) |
| 65 to 74 Years | 0 (0.0%) | 0 (0.0%) |
| 75 Years and over | 0 (0.0%) | 0 (0.0%) |
| Total | 7 (2.0%) | 14 (4.2%) |
Income Above Poverty by Sex and Age in Center Ossipee
According to the poverty statistics in Center Ossipee, males aged under 5 years and females aged 12 to 14 years are the age groups that are most secure financially, with 100.0% of males and 100.0% of females in these age groups living above the poverty line.
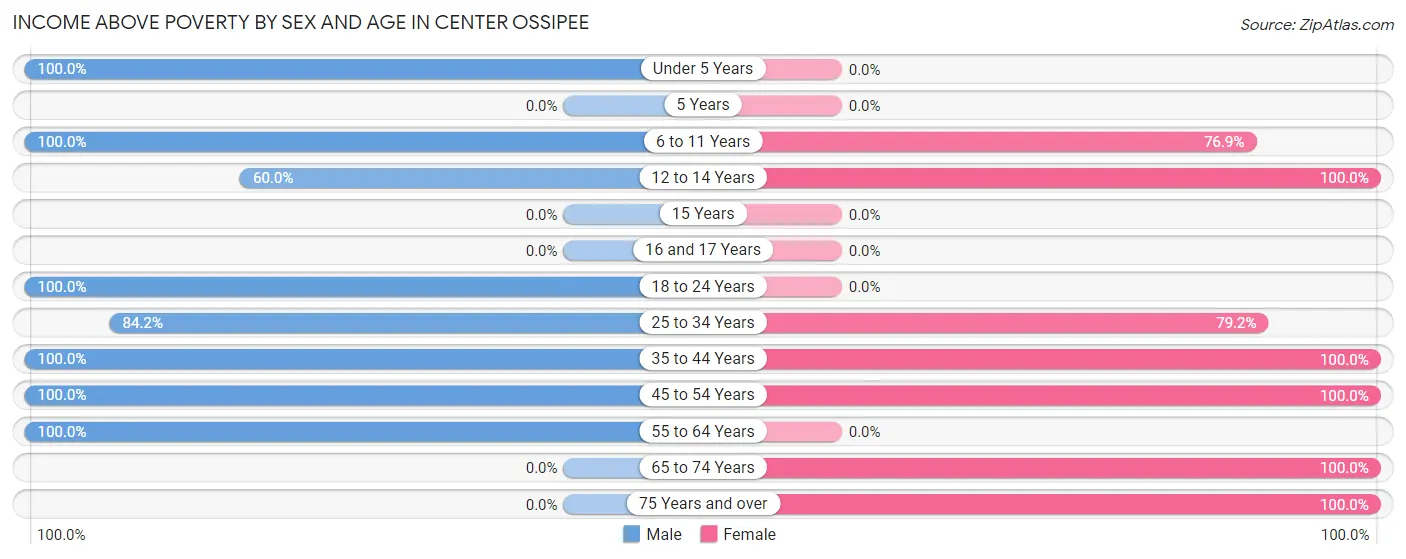
| Age Bracket | Male | Female |
| Under 5 Years | 6 (100.0%) | 0 (0.0%) |
| 5 Years | 0 (0.0%) | 0 (0.0%) |
| 6 to 11 Years | 38 (100.0%) | 30 (76.9%) |
| 12 to 14 Years | 6 (60.0%) | 5 (100.0%) |
| 15 Years | 0 (0.0%) | 0 (0.0%) |
| 16 and 17 Years | 0 (0.0%) | 0 (0.0%) |
| 18 to 24 Years | 61 (100.0%) | 0 (0.0%) |
| 25 to 34 Years | 16 (84.2%) | 19 (79.2%) |
| 35 to 44 Years | 147 (100.0%) | 152 (100.0%) |
| 45 to 54 Years | 40 (100.0%) | 29 (100.0%) |
| 55 to 64 Years | 25 (100.0%) | 0 (0.0%) |
| 65 to 74 Years | 0 (0.0%) | 66 (100.0%) |
| 75 Years and over | 0 (0.0%) | 18 (100.0%) |
| Total | 339 (98.0%) | 319 (95.8%) |
Income Below Poverty Among Married-Couple Families in Center Ossipee
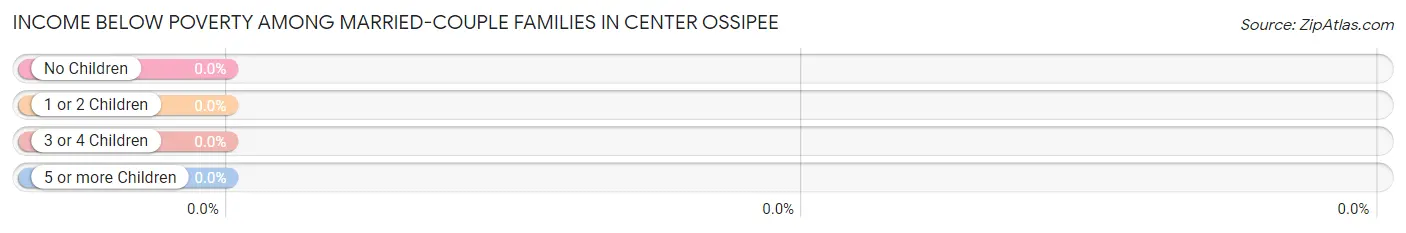
| Children | Above Poverty | Below Poverty |
| No Children | 28 (100.0%) | 0 (0.0%) |
| 1 or 2 Children | 33 (100.0%) | 0 (0.0%) |
| 3 or 4 Children | 0 (0.0%) | 0 (0.0%) |
| 5 or more Children | 0 (0.0%) | 0 (0.0%) |
| Total | 61 (100.0%) | 0 (0.0%) |
Income Below Poverty Among Single-Parent Households in Center Ossipee
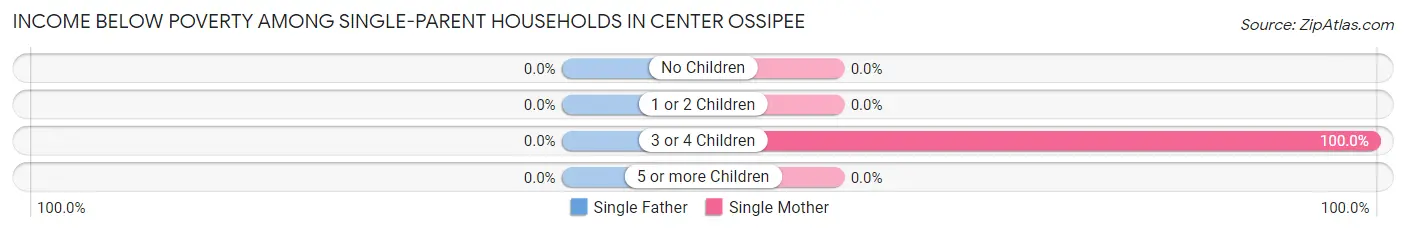
| Children | Single Father | Single Mother |
| No Children | 0 (0.0%) | 0 (0.0%) |
| 1 or 2 Children | 0 (0.0%) | 0 (0.0%) |
| 3 or 4 Children | 0 (0.0%) | 5 (100.0%) |
| 5 or more Children | 0 (0.0%) | 0 (0.0%) |
| Total | 0 (0.0%) | 5 (5.0%) |
Income Below Poverty Among Married-Couple vs Single-Parent Households in Center Ossipee
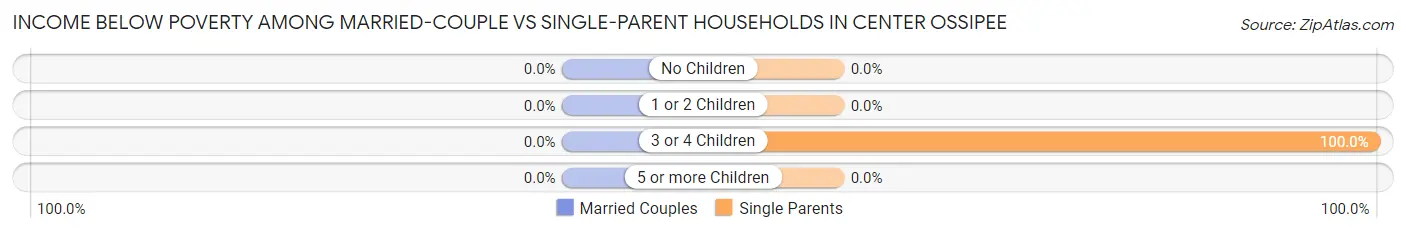
| Children | Married-Couple Families | Single-Parent Households |
| No Children | 0 (0.0%) | 0 (0.0%) |
| 1 or 2 Children | 0 (0.0%) | 0 (0.0%) |
| 3 or 4 Children | 0 (0.0%) | 5 (100.0%) |
| 5 or more Children | 0 (0.0%) | 0 (0.0%) |
| Total | 0 (0.0%) | 5 (5.0%) |
Race in Center Ossipee
The most populous races in Center Ossipee are White / Caucasian (669 | 98.5%), Two or more Races (7 | 1.0%), and Black / African American (3 | 0.4%).
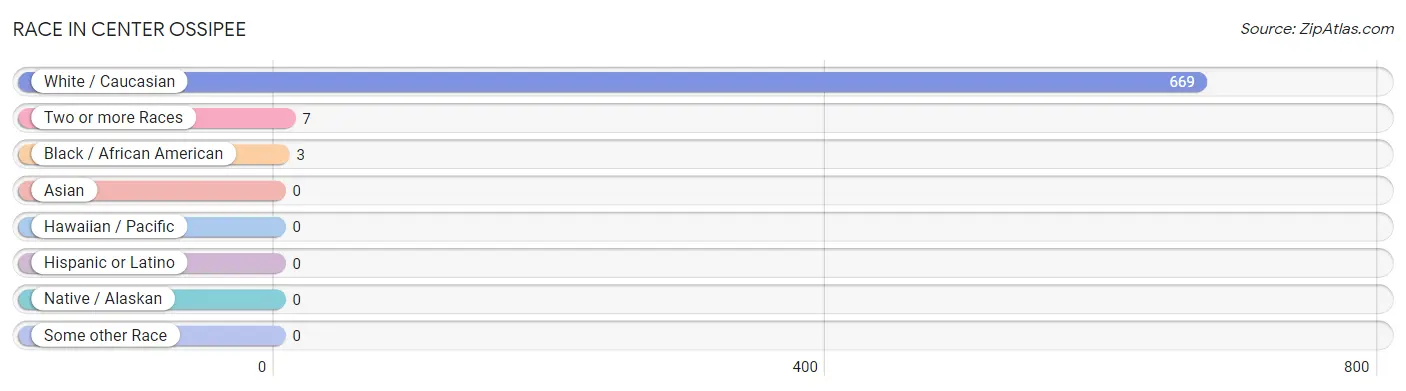
| Race | # Population | % Population |
| Asian | 0 | 0.0% |
| Black / African American | 3 | 0.4% |
| Hawaiian / Pacific | 0 | 0.0% |
| Hispanic or Latino | 0 | 0.0% |
| Native / Alaskan | 0 | 0.0% |
| White / Caucasian | 669 | 98.5% |
| Two or more Races | 7 | 1.0% |
| Some other Race | 0 | 0.0% |
| Total | 679 | 100.0% |
Ancestry in Center Ossipee
The most populous ancestries reported in Center Ossipee are American (323 | 47.6%), English (80 | 11.8%), Italian (80 | 11.8%), Scottish (43 | 6.3%), and French (30 | 4.4%), together accounting for 81.9% of all Center Ossipee residents.
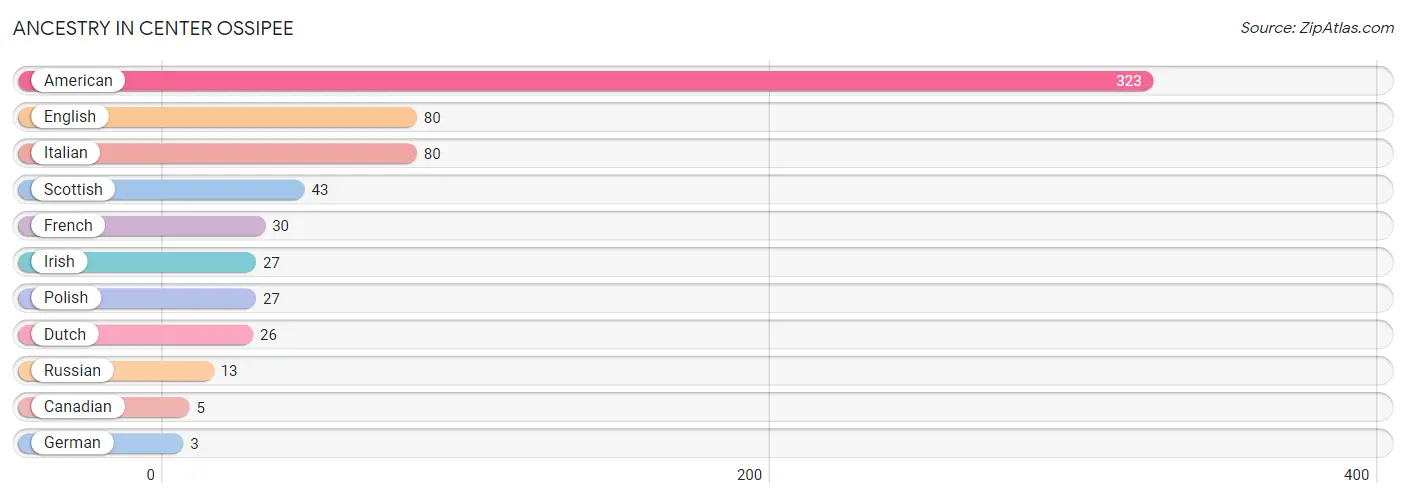
| Ancestry | # Population | % Population |
| American | 323 | 47.6% |
| Canadian | 5 | 0.7% |
| Dutch | 26 | 3.8% |
| English | 80 | 11.8% |
| French | 30 | 4.4% |
| German | 3 | 0.4% |
| Irish | 27 | 4.0% |
| Italian | 80 | 11.8% |
| Polish | 27 | 4.0% |
| Russian | 13 | 1.9% |
| Scottish | 43 | 6.3% | View All 11 Rows |
Immigrants in Center Ossipee

| Immigration Origin | # Population | % Population | View All 0 Rows |
Sex and Age in Center Ossipee
Sex and Age in Center Ossipee
The most populous age groups in Center Ossipee are 35 to 39 Years (75 | 21.7%) for men and 40 to 44 Years (137 | 41.1%) for women.
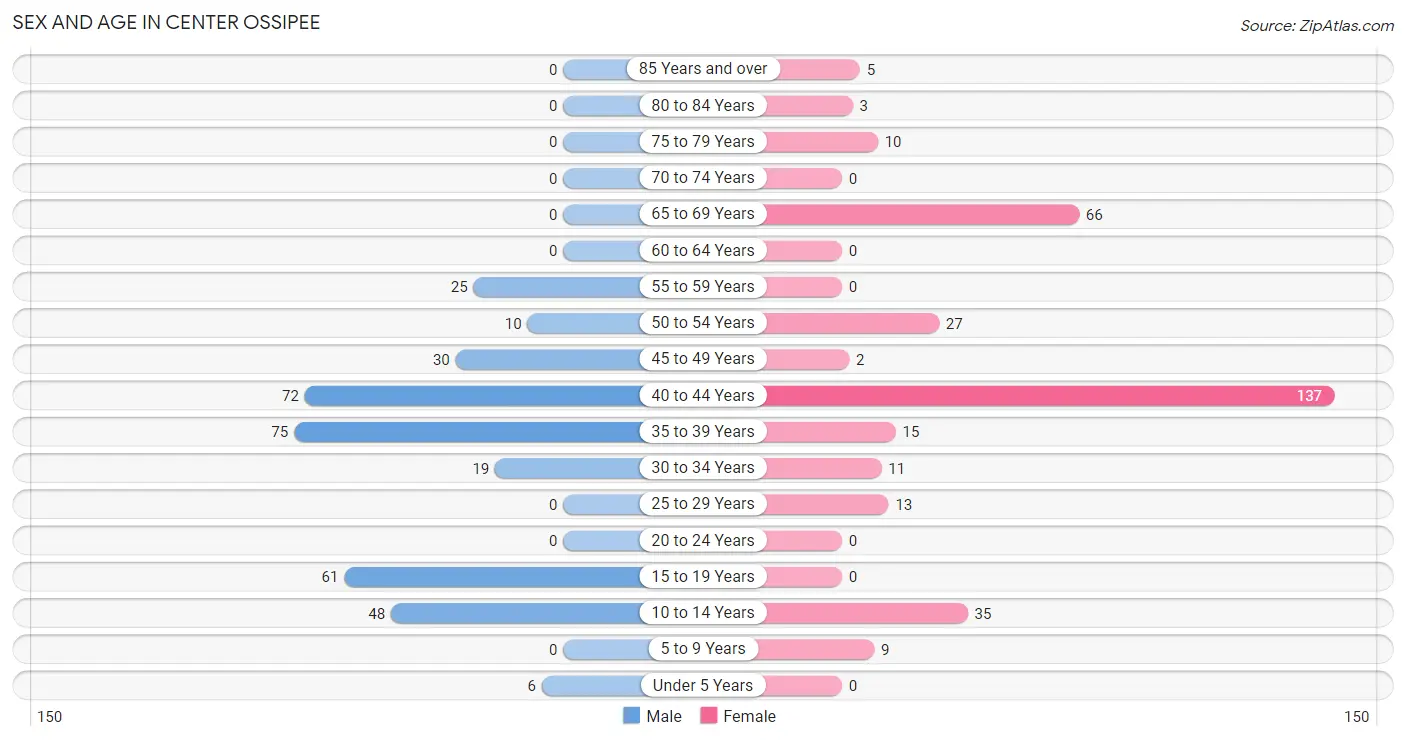
| Age Bracket | Male | Female |
| Under 5 Years | 6 (1.7%) | 0 (0.0%) |
| 5 to 9 Years | 0 (0.0%) | 9 (2.7%) |
| 10 to 14 Years | 48 (13.9%) | 35 (10.5%) |
| 15 to 19 Years | 61 (17.6%) | 0 (0.0%) |
| 20 to 24 Years | 0 (0.0%) | 0 (0.0%) |
| 25 to 29 Years | 0 (0.0%) | 13 (3.9%) |
| 30 to 34 Years | 19 (5.5%) | 11 (3.3%) |
| 35 to 39 Years | 75 (21.7%) | 15 (4.5%) |
| 40 to 44 Years | 72 (20.8%) | 137 (41.1%) |
| 45 to 49 Years | 30 (8.7%) | 2 (0.6%) |
| 50 to 54 Years | 10 (2.9%) | 27 (8.1%) |
| 55 to 59 Years | 25 (7.2%) | 0 (0.0%) |
| 60 to 64 Years | 0 (0.0%) | 0 (0.0%) |
| 65 to 69 Years | 0 (0.0%) | 66 (19.8%) |
| 70 to 74 Years | 0 (0.0%) | 0 (0.0%) |
| 75 to 79 Years | 0 (0.0%) | 10 (3.0%) |
| 80 to 84 Years | 0 (0.0%) | 3 (0.9%) |
| 85 Years and over | 0 (0.0%) | 5 (1.5%) |
| Total | 346 (100.0%) | 333 (100.0%) |
Families and Households in Center Ossipee
Median Family Size in Center Ossipee
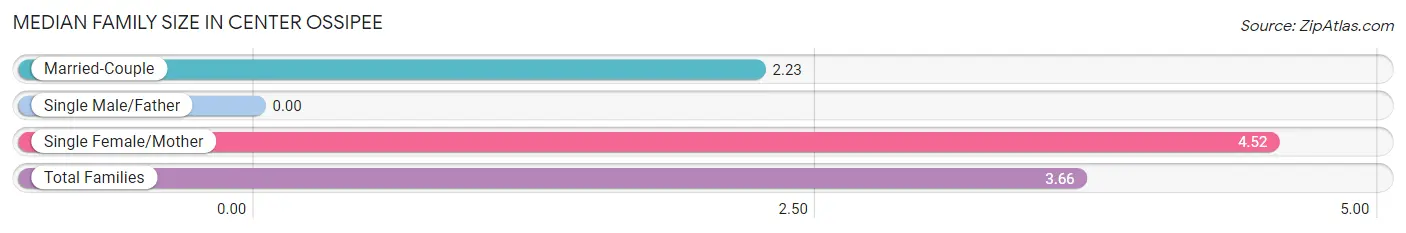
| Family Type | # Families | Family Size |
| Married-Couple | 61 (37.7%) | 2.23 |
| Single Male/Father | 0 (0.0%) | - |
| Single Female/Mother | 101 (62.4%) | 4.52 |
| Total Families | 162 (100.0%) | 3.66 |
Median Household Size in Center Ossipee
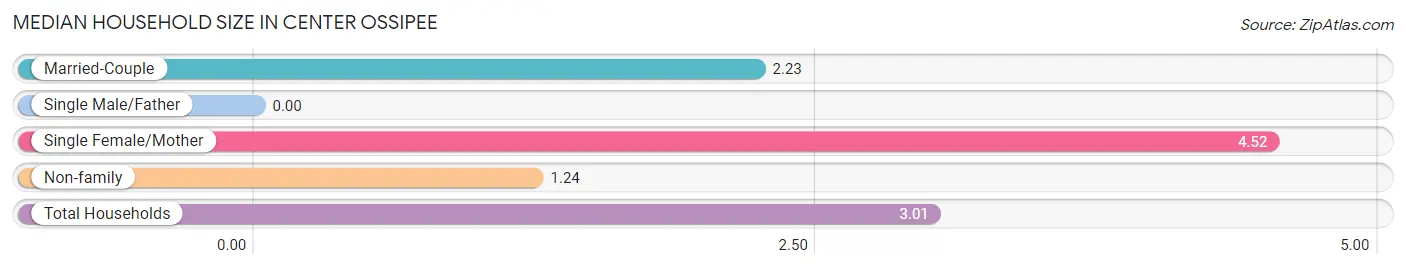
| Household Type | # Households | Household Size |
| Married-Couple | 61 (27.6%) | 2.23 |
| Single Male/Father | 0 (0.0%) | - |
| Single Female/Mother | 101 (45.7%) | 4.52 |
| Non-family | 59 (26.7%) | 1.24 |
| Total Households | 221 (100.0%) | 3.01 |
Household Size by Marriage Status in Center Ossipee
Out of a total of 221 households in Center Ossipee, 162 (73.3%) are family households, while 59 (26.7%) are nonfamily households. The most numerous type of family households are 2-person households, comprising 78, and the most common type of nonfamily households are 1-person households, comprising 46.
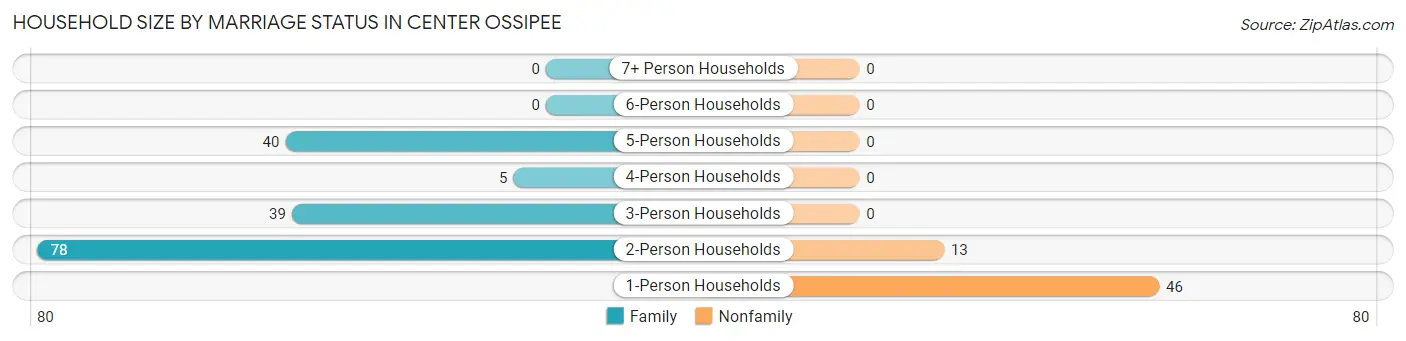
| Household Size | Family Households | Nonfamily Households |
| 1-Person Households | - | 46 (20.8%) |
| 2-Person Households | 78 (35.3%) | 13 (5.9%) |
| 3-Person Households | 39 (17.6%) | 0 (0.0%) |
| 4-Person Households | 5 (2.3%) | 0 (0.0%) |
| 5-Person Households | 40 (18.1%) | 0 (0.0%) |
| 6-Person Households | 0 (0.0%) | 0 (0.0%) |
| 7+ Person Households | 0 (0.0%) | 0 (0.0%) |
| Total | 162 (73.3%) | 59 (26.7%) |
Female Fertility in Center Ossipee
Fertility by Age in Center Ossipee
| Age Bracket | Women with Births | Births / 1,000 Women |
| 15 to 19 years | 0 (0.0%) | 0.0 |
| 20 to 34 years | 0 (0.0%) | 0.0 |
| 35 to 50 years | 0 (0.0%) | 0.0 |
| Total | 0 (0.0%) | 0.0 |
Fertility by Age by Marriage Status in Center Ossipee
| Age Bracket | Married | Unmarried |
| 15 to 19 years | 0 (0.0%) | 0 (0.0%) |
| 20 to 34 years | 0 (0.0%) | 0 (0.0%) |
| 35 to 50 years | 0 (0.0%) | 0 (0.0%) |
| Total | 0 (0.0%) | 0 (0.0%) |
Fertility by Education in Center Ossipee
| Educational Attainment | Women with Births | Births / 1,000 Women |
| Less than High School | 0 (0.0%) | 0.0 |
| High School Diploma | 0 (0.0%) | 0.0 |
| College or Associate's Degree | 0 (0.0%) | 0.0 |
| Bachelor's Degree | 0 (0.0%) | 0.0 |
| Graduate Degree | 0 (0.0%) | 0.0 |
| Total | 0 (0.0%) | 0.0 |
Fertility by Education by Marriage Status in Center Ossipee
| Educational Attainment | Married | Unmarried |
| Less than High School | 0 (0.0%) | 0 (0.0%) |
| High School Diploma | 0 (0.0%) | 0 (0.0%) |
| College or Associate's Degree | 0 (0.0%) | 0 (0.0%) |
| Bachelor's Degree | 0 (0.0%) | 0 (0.0%) |
| Graduate Degree | 0 (0.0%) | 0 (0.0%) |
| Total | 0 (0.0%) | 0 (0.0%) |
Employment Characteristics in Center Ossipee
Employment by Class of Employer in Center Ossipee
Among the 383 employed individuals in Center Ossipee, private company employees (340 | 88.8%), federal government employees (27 | 7.0%), and not-for-profit organizations (15 | 3.9%) make up the most common classes of employment.
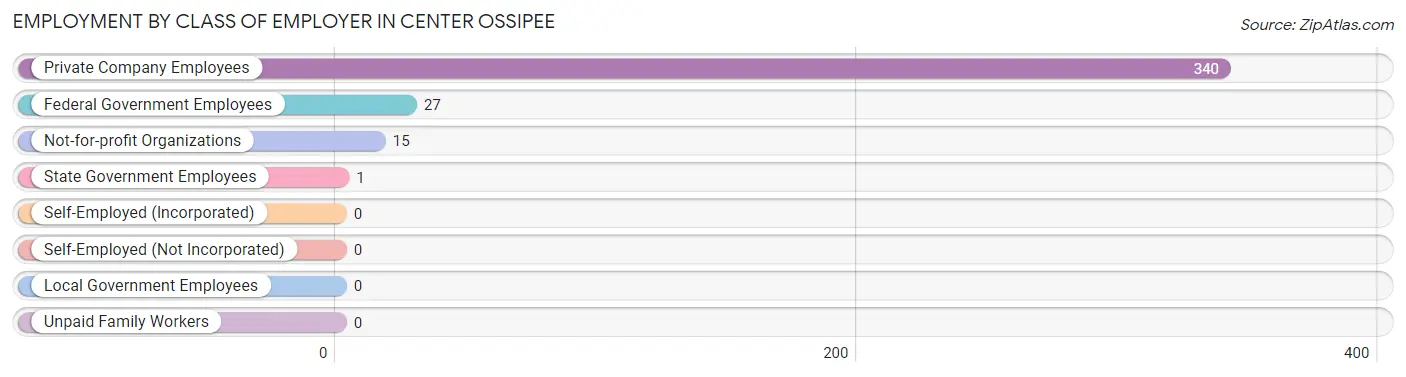
| Employer Class | # Employees | % Employees |
| Private Company Employees | 340 | 88.8% |
| Self-Employed (Incorporated) | 0 | 0.0% |
| Self-Employed (Not Incorporated) | 0 | 0.0% |
| Not-for-profit Organizations | 15 | 3.9% |
| Local Government Employees | 0 | 0.0% |
| State Government Employees | 1 | 0.3% |
| Federal Government Employees | 27 | 7.0% |
| Unpaid Family Workers | 0 | 0.0% |
| Total | 383 | 100.0% |
Employment Status by Age in Center Ossipee
According to the labor force statistics for Center Ossipee, out of the total population over 16 years of age (581), 78.5% or 456 individuals are in the labor force, with 13.4% or 61 of them unemployed. The age group with the highest labor force participation rate is 16 to 19 years, with 100.0% or 61 individuals in the labor force. Within the labor force, the 16 to 19 years age range has the highest percentage of unemployed individuals, with 100.0% or 61 of them being unemployed.
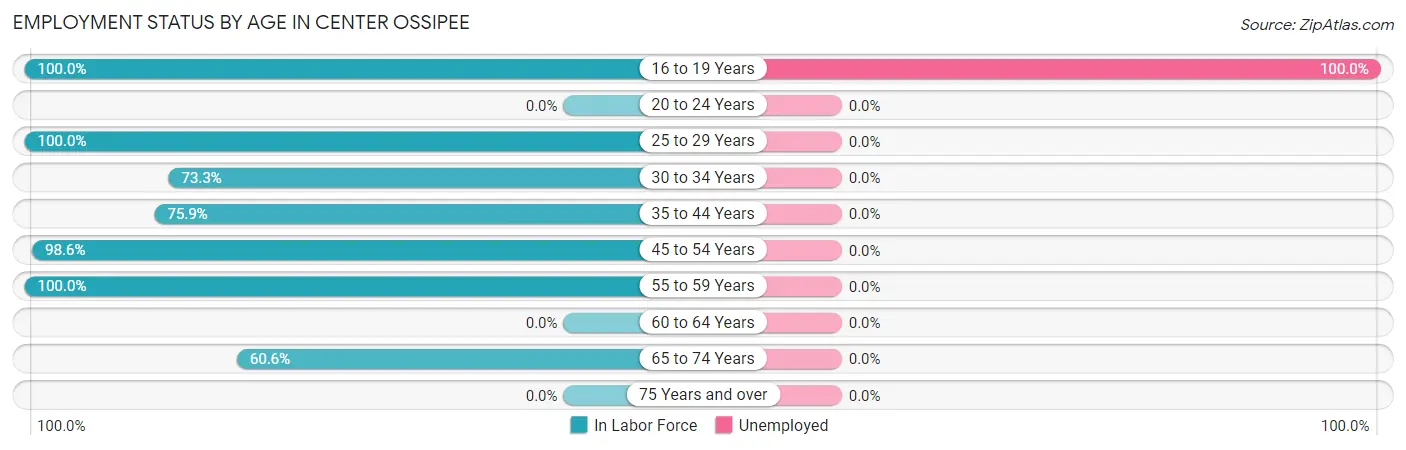
| Age Bracket | In Labor Force | Unemployed |
| 16 to 19 Years | 61 (100.0%) | 61 (100.0%) |
| 20 to 24 Years | 0 (0.0%) | 0 (0.0%) |
| 25 to 29 Years | 13 (100.0%) | 0 (0.0%) |
| 30 to 34 Years | 22 (73.3%) | 0 (0.0%) |
| 35 to 44 Years | 227 (75.9%) | 0 (0.0%) |
| 45 to 54 Years | 68 (98.6%) | 0 (0.0%) |
| 55 to 59 Years | 25 (100.0%) | 0 (0.0%) |
| 60 to 64 Years | 0 (0.0%) | 0 (0.0%) |
| 65 to 74 Years | 40 (60.6%) | 0 (0.0%) |
| 75 Years and over | 0 (0.0%) | 0 (0.0%) |
| Total | 456 (78.5%) | 61 (13.4%) |
Employment Status by Educational Attainment in Center Ossipee
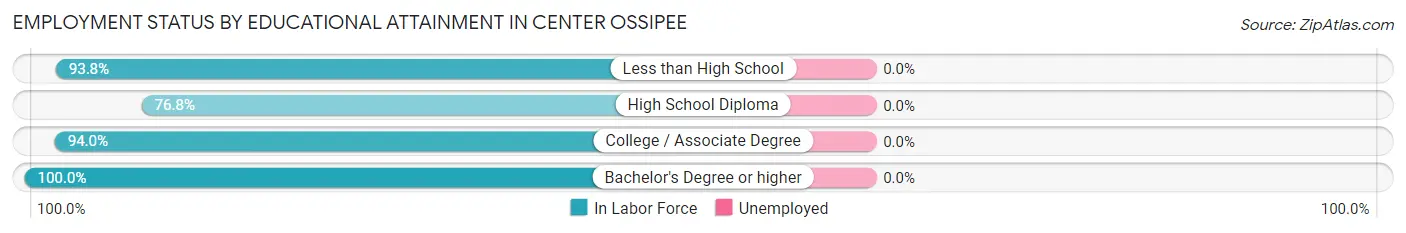
| Educational Attainment | In Labor Force | Unemployed |
| Less than High School | 15 (93.8%) | 0 (0.0%) |
| High School Diploma | 248 (76.8%) | 0 (0.0%) |
| College / Associate Degree | 79 (94.0%) | 0 (0.0%) |
| Bachelor's Degree or higher | 13 (100.0%) | 0 (0.0%) |
| Total | 355 (81.4%) | 0 (0.0%) |
Employment Occupations by Sex in Center Ossipee
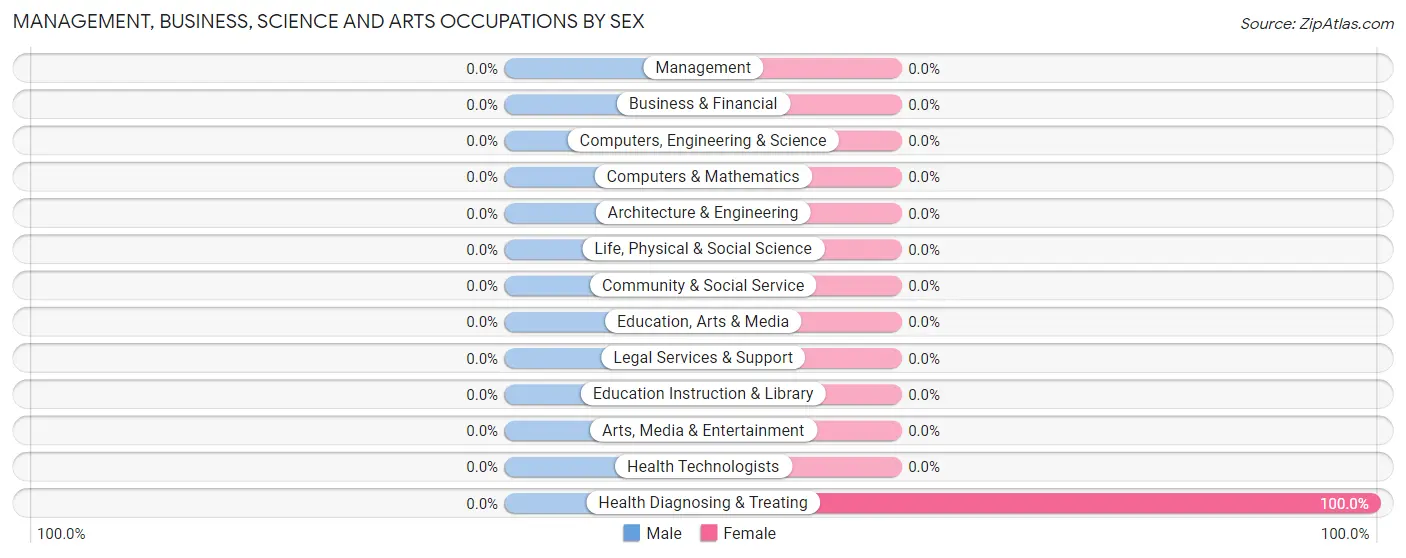
Management, Business, Science and Arts Occupations
The most common Management, Business, Science and Arts occupations in Center Ossipee are , and Health Diagnosing & Treating (13 | 3.3%).
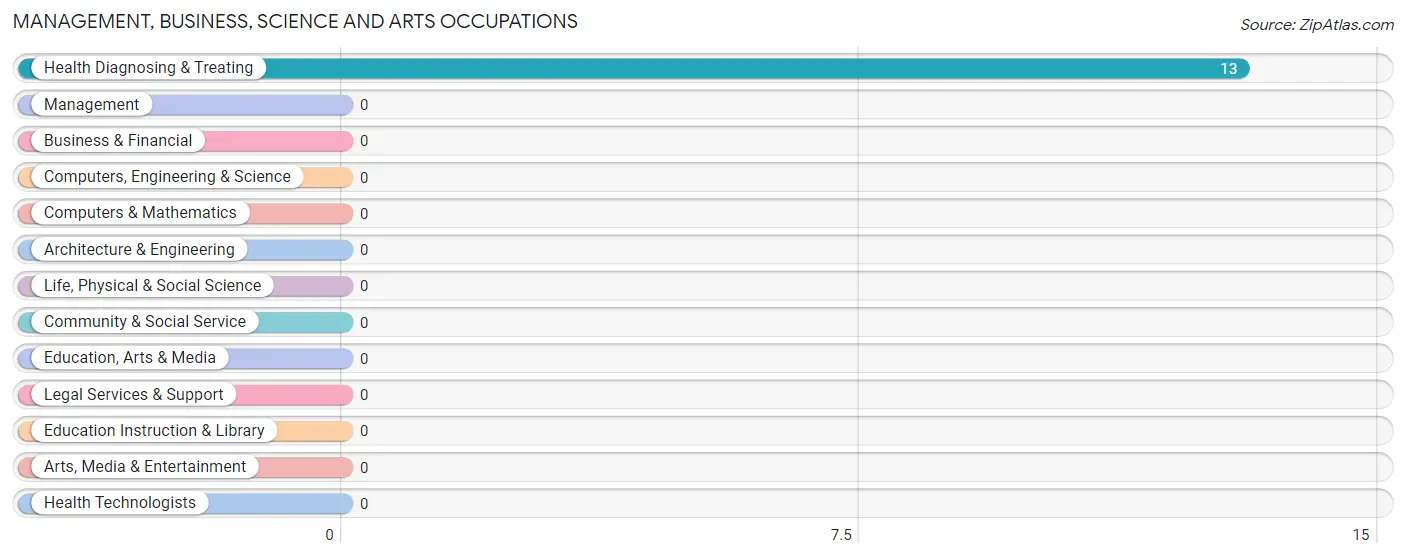
Management, Business, Science and Arts Occupations by Sex
| Occupation | Male | Female |
| Management | 0 (0.0%) | 0 (0.0%) |
| Business & Financial | 0 (0.0%) | 0 (0.0%) |
| Computers, Engineering & Science | 0 (0.0%) | 0 (0.0%) |
| Computers & Mathematics | 0 (0.0%) | 0 (0.0%) |
| Architecture & Engineering | 0 (0.0%) | 0 (0.0%) |
| Life, Physical & Social Science | 0 (0.0%) | 0 (0.0%) |
| Community & Social Service | 0 (0.0%) | 0 (0.0%) |
| Education, Arts & Media | 0 (0.0%) | 0 (0.0%) |
| Legal Services & Support | 0 (0.0%) | 0 (0.0%) |
| Education Instruction & Library | 0 (0.0%) | 0 (0.0%) |
| Arts, Media & Entertainment | 0 (0.0%) | 0 (0.0%) |
| Health Diagnosing & Treating | 0 (0.0%) | 13 (100.0%) |
| Health Technologists | 0 (0.0%) | 0 (0.0%) |
| Total (Category) | 0 (0.0%) | 13 (100.0%) |
| Total (Overall) | 156 (39.5%) | 239 (60.5%) |
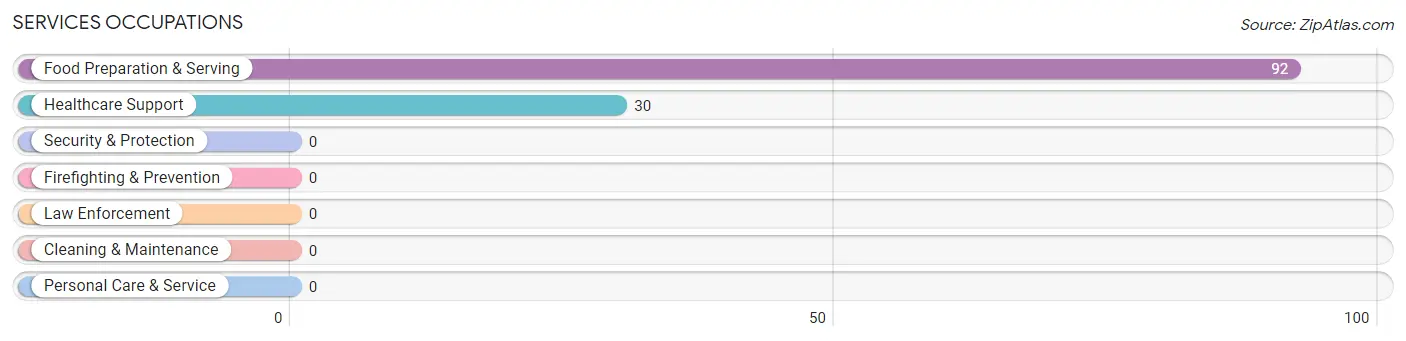
Services Occupations
The most common Services occupations in Center Ossipee are Food Preparation & Serving (92 | 23.3%), and Healthcare Support (30 | 7.6%).
Services Occupations by Sex
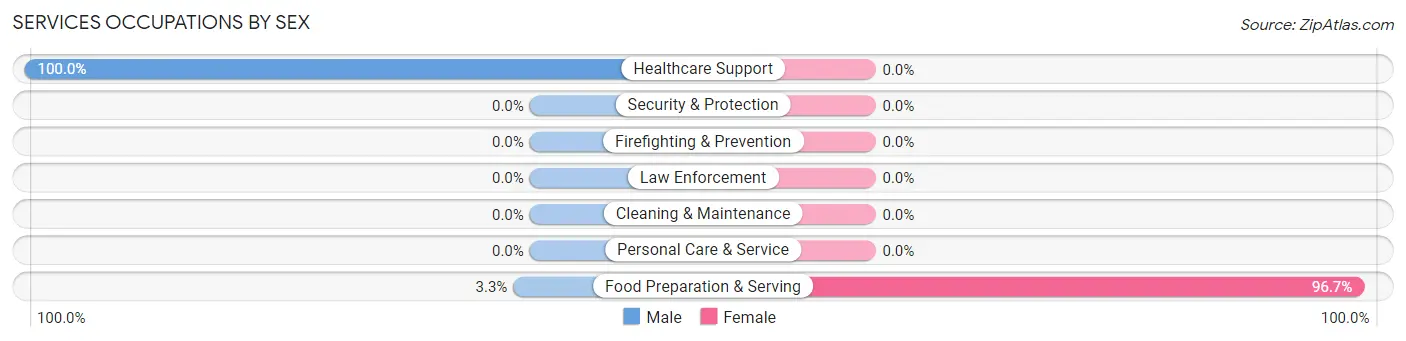
| Occupation | Male | Female |
| Healthcare Support | 30 (100.0%) | 0 (0.0%) |
| Security & Protection | 0 (0.0%) | 0 (0.0%) |
| Firefighting & Prevention | 0 (0.0%) | 0 (0.0%) |
| Law Enforcement | 0 (0.0%) | 0 (0.0%) |
| Food Preparation & Serving | 3 (3.3%) | 89 (96.7%) |
| Cleaning & Maintenance | 0 (0.0%) | 0 (0.0%) |
| Personal Care & Service | 0 (0.0%) | 0 (0.0%) |
| Total (Category) | 33 (27.1%) | 89 (73.0%) |
| Total (Overall) | 156 (39.5%) | 239 (60.5%) |
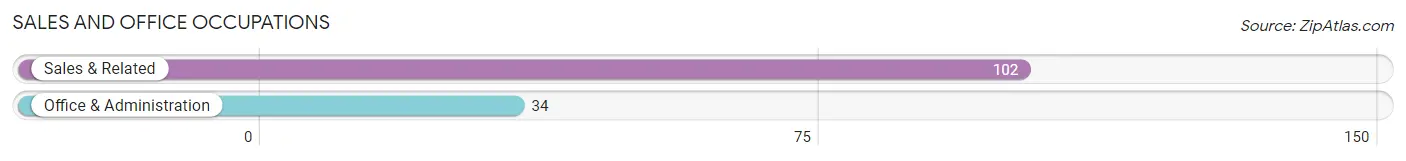
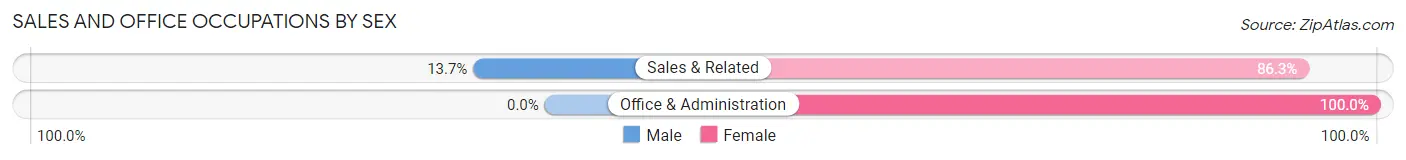
Sales and Office Occupations
The most common Sales and Office occupations in Center Ossipee are Sales & Related (102 | 25.8%), and Office & Administration (34 | 8.6%).
Sales and Office Occupations by Sex
| Occupation | Male | Female |
| Sales & Related | 14 (13.7%) | 88 (86.3%) |
| Office & Administration | 0 (0.0%) | 34 (100.0%) |
| Total (Category) | 14 (10.3%) | 122 (89.7%) |
| Total (Overall) | 156 (39.5%) | 239 (60.5%) |
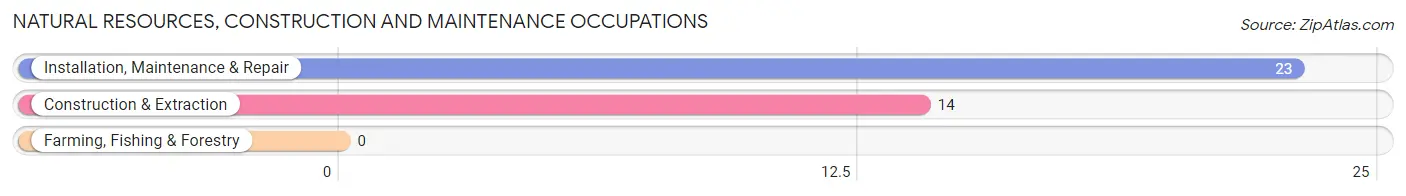
Natural Resources, Construction and Maintenance Occupations
The most common Natural Resources, Construction and Maintenance occupations in Center Ossipee are Installation, Maintenance & Repair (23 | 5.8%), and Construction & Extraction (14 | 3.5%).
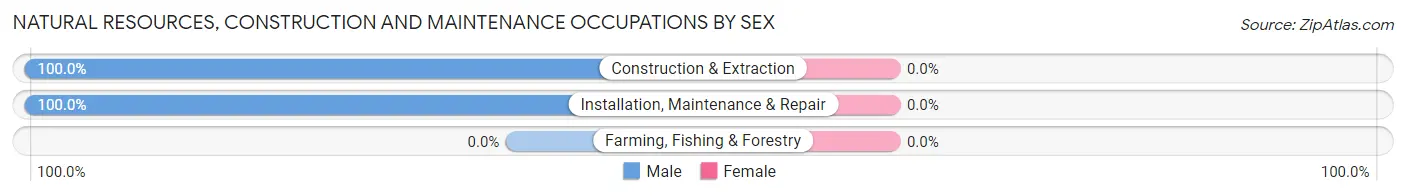
Natural Resources, Construction and Maintenance Occupations by Sex
| Occupation | Male | Female |
| Farming, Fishing & Forestry | 0 (0.0%) | 0 (0.0%) |
| Construction & Extraction | 14 (100.0%) | 0 (0.0%) |
| Installation, Maintenance & Repair | 23 (100.0%) | 0 (0.0%) |
| Total (Category) | 37 (100.0%) | 0 (0.0%) |
| Total (Overall) | 156 (39.5%) | 239 (60.5%) |
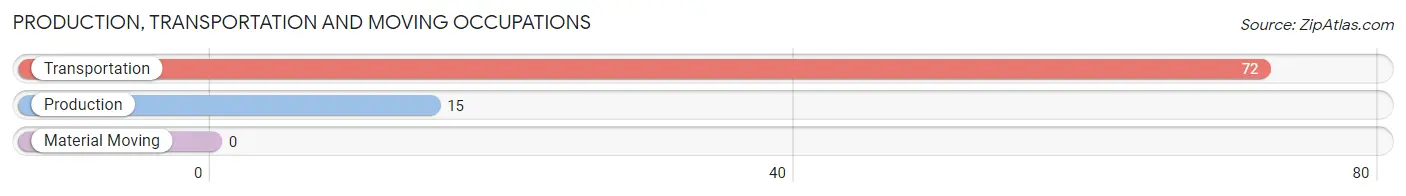
Production, Transportation and Moving Occupations
The most common Production, Transportation and Moving occupations in Center Ossipee are Transportation (72 | 18.2%), and Production (15 | 3.8%).
Production, Transportation and Moving Occupations by Sex
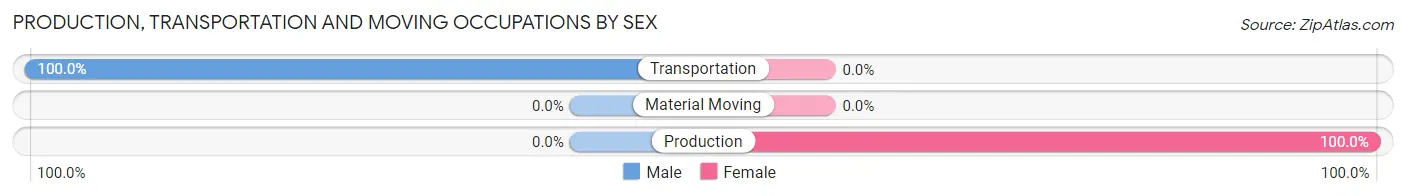
| Occupation | Male | Female |
| Production | 0 (0.0%) | 15 (100.0%) |
| Transportation | 72 (100.0%) | 0 (0.0%) |
| Material Moving | 0 (0.0%) | 0 (0.0%) |
| Total (Category) | 72 (82.8%) | 15 (17.2%) |
| Total (Overall) | 156 (39.5%) | 239 (60.5%) |
Employment Industries by Sex in Center Ossipee
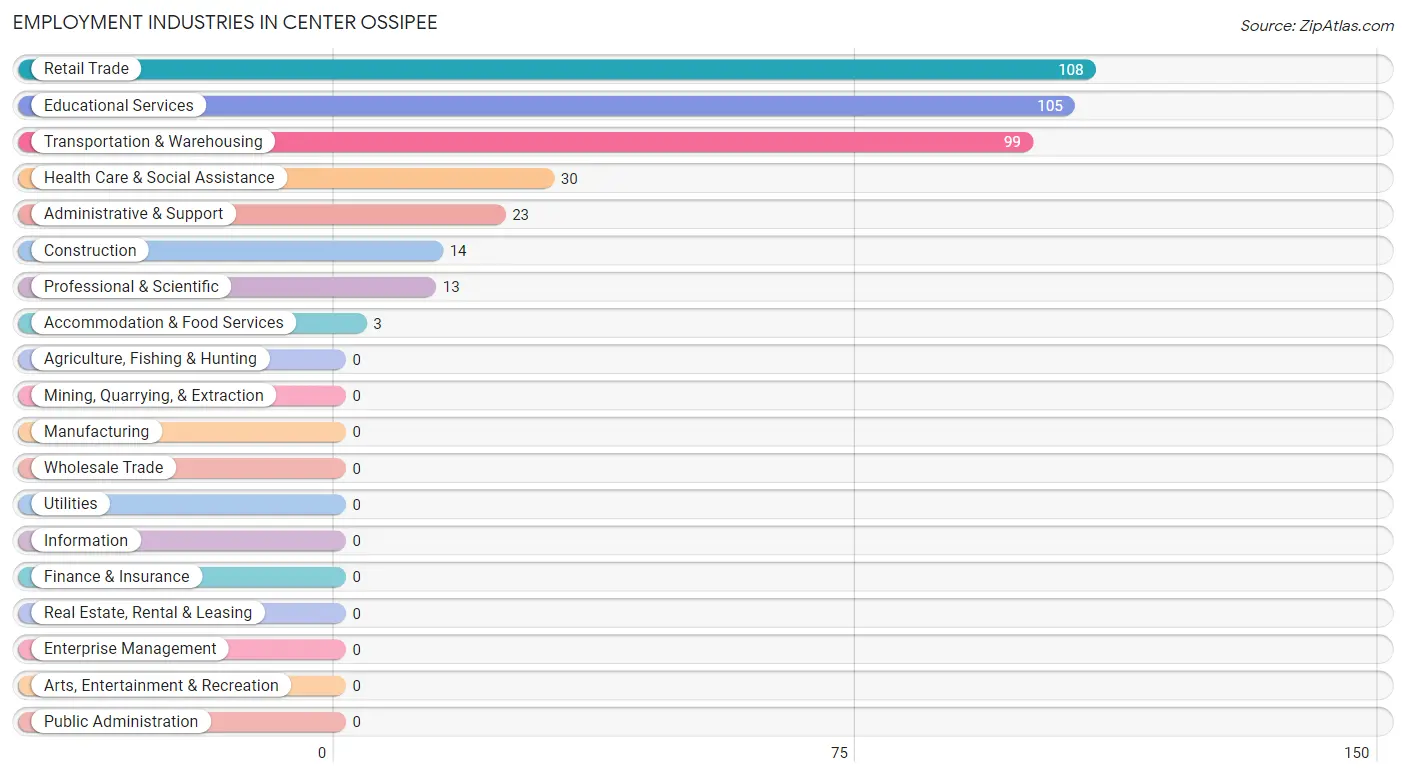
Employment Industries in Center Ossipee
The major employment industries in Center Ossipee include Retail Trade (108 | 27.3%), Educational Services (105 | 26.6%), Transportation & Warehousing (99 | 25.1%), Health Care & Social Assistance (30 | 7.6%), and Administrative & Support (23 | 5.8%).
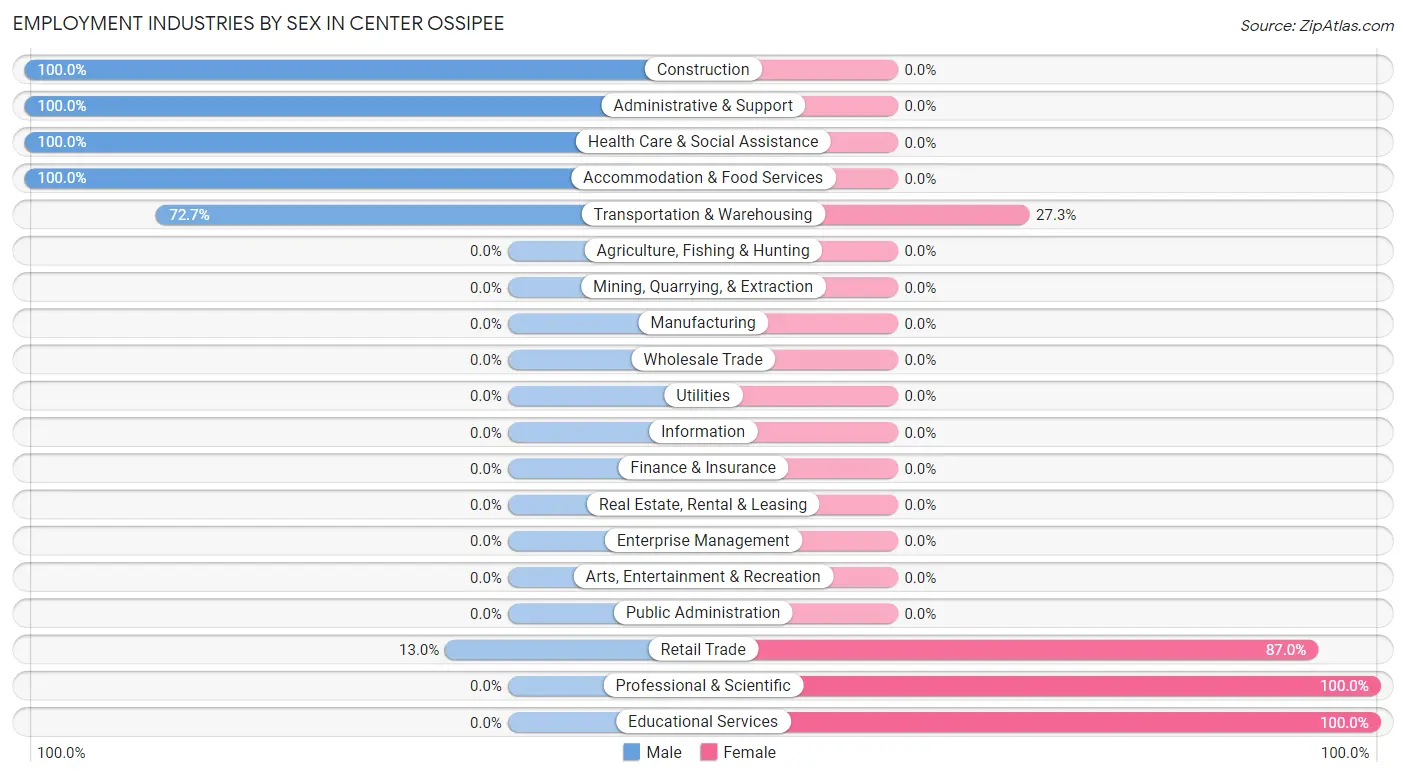
Employment Industries by Sex in Center Ossipee
The Center Ossipee industries that see more men than women are Construction (100.0%), Administrative & Support (100.0%), and Health Care & Social Assistance (100.0%), whereas the industries that tend to have a higher number of women are Professional & Scientific (100.0%), Educational Services (100.0%), and Retail Trade (87.0%).
| Industry | Male | Female |
| Agriculture, Fishing & Hunting | 0 (0.0%) | 0 (0.0%) |
| Mining, Quarrying, & Extraction | 0 (0.0%) | 0 (0.0%) |
| Construction | 14 (100.0%) | 0 (0.0%) |
| Manufacturing | 0 (0.0%) | 0 (0.0%) |
| Wholesale Trade | 0 (0.0%) | 0 (0.0%) |
| Retail Trade | 14 (13.0%) | 94 (87.0%) |
| Transportation & Warehousing | 72 (72.7%) | 27 (27.3%) |
| Utilities | 0 (0.0%) | 0 (0.0%) |
| Information | 0 (0.0%) | 0 (0.0%) |
| Finance & Insurance | 0 (0.0%) | 0 (0.0%) |
| Real Estate, Rental & Leasing | 0 (0.0%) | 0 (0.0%) |
| Professional & Scientific | 0 (0.0%) | 13 (100.0%) |
| Enterprise Management | 0 (0.0%) | 0 (0.0%) |
| Administrative & Support | 23 (100.0%) | 0 (0.0%) |
| Educational Services | 0 (0.0%) | 105 (100.0%) |
| Health Care & Social Assistance | 30 (100.0%) | 0 (0.0%) |
| Arts, Entertainment & Recreation | 0 (0.0%) | 0 (0.0%) |
| Accommodation & Food Services | 3 (100.0%) | 0 (0.0%) |
| Public Administration | 0 (0.0%) | 0 (0.0%) |
| Total | 156 (39.5%) | 239 (60.5%) |
Education in Center Ossipee
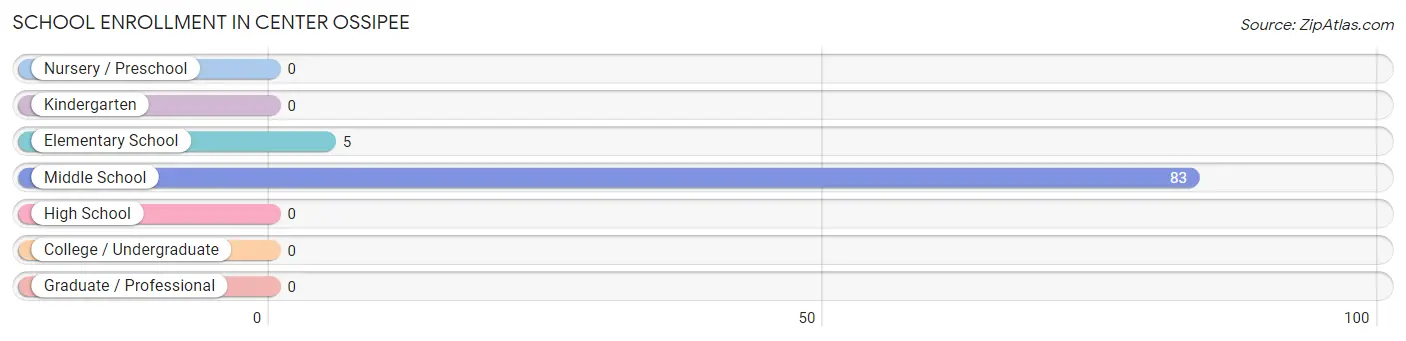
School Enrollment in Center Ossipee
The most common levels of schooling among the 88 students in Center Ossipee are middle school (83 | 94.3%), and elementary school (5 | 5.7%).
| School Level | # Students | % Students |
| Nursery / Preschool | 0 | 0.0% |
| Kindergarten | 0 | 0.0% |
| Elementary School | 5 | 5.7% |
| Middle School | 83 | 94.3% |
| High School | 0 | 0.0% |
| College / Undergraduate | 0 | 0.0% |
| Graduate / Professional | 0 | 0.0% |
| Total | 88 | 100.0% |
School Enrollment by Age by Funding Source in Center Ossipee
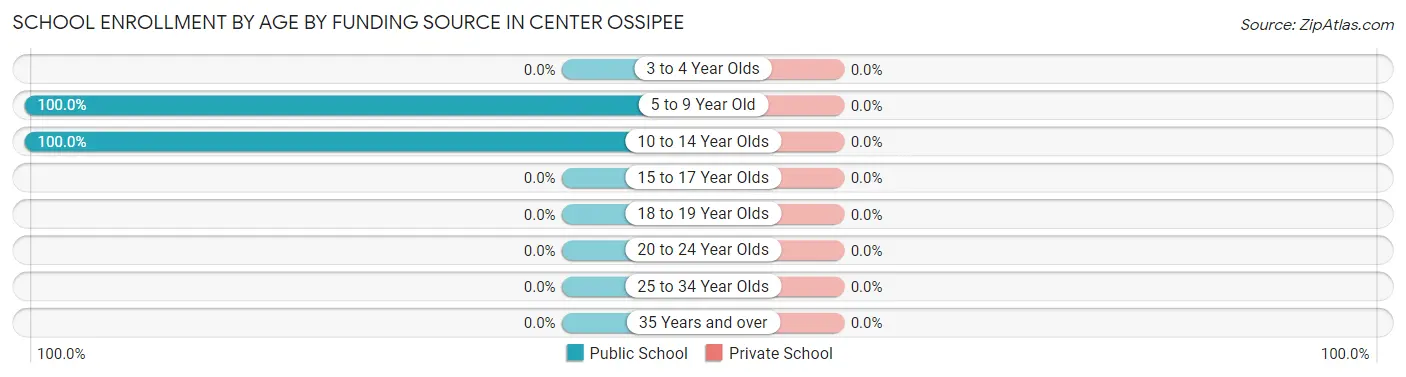
| Age Bracket | Public School | Private School |
| 3 to 4 Year Olds | 0 (0.0%) | 0 (0.0%) |
| 5 to 9 Year Old | 5 (100.0%) | 0 (0.0%) |
| 10 to 14 Year Olds | 83 (100.0%) | 0 (0.0%) |
| 15 to 17 Year Olds | 0 (0.0%) | 0 (0.0%) |
| 18 to 19 Year Olds | 0 (0.0%) | 0 (0.0%) |
| 20 to 24 Year Olds | 0 (0.0%) | 0 (0.0%) |
| 25 to 34 Year Olds | 0 (0.0%) | 0 (0.0%) |
| 35 Years and over | 0 (0.0%) | 0 (0.0%) |
| Total | 88 (100.0%) | 0 (0.0%) |
Educational Attainment by Field of Study in Center Ossipee
Bio, nature & agricultural (13 | 50.0%), and business (13 | 50.0%) are the most common fields of study among 26 individuals in Center Ossipee who have obtained a bachelor's degree or higher.
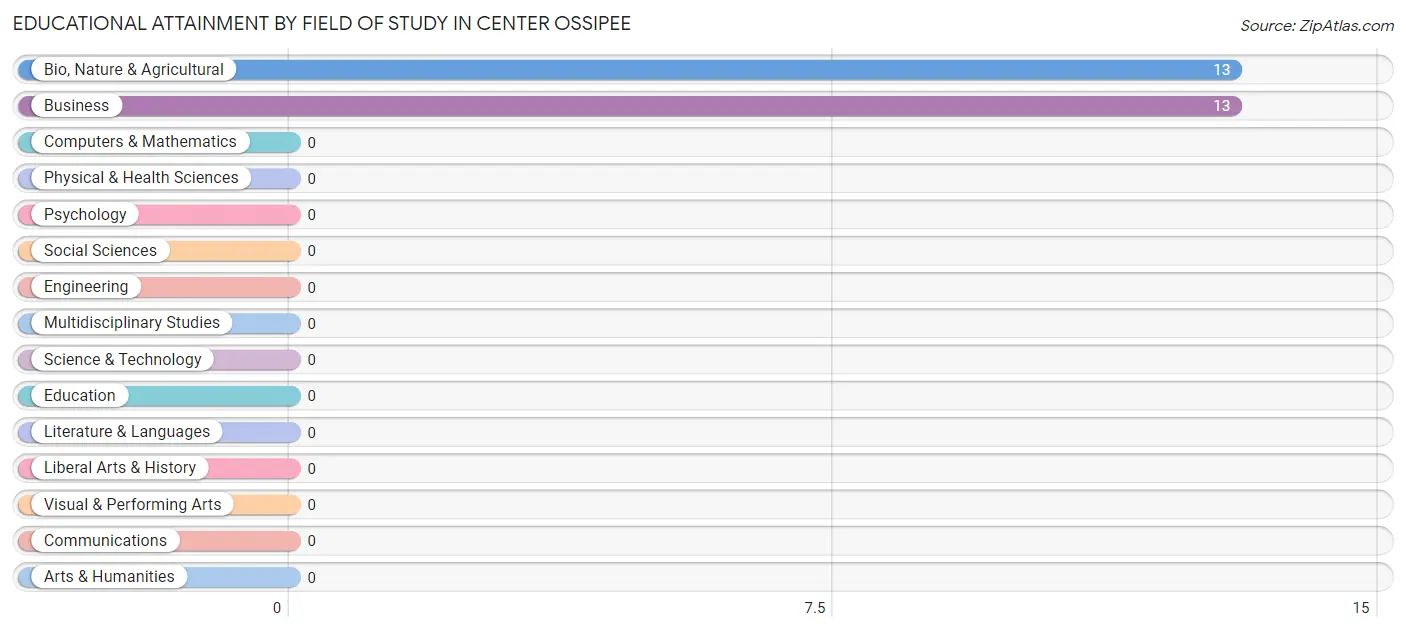
| Field of Study | # Graduates | % Graduates |
| Computers & Mathematics | 0 | 0.0% |
| Bio, Nature & Agricultural | 13 | 50.0% |
| Physical & Health Sciences | 0 | 0.0% |
| Psychology | 0 | 0.0% |
| Social Sciences | 0 | 0.0% |
| Engineering | 0 | 0.0% |
| Multidisciplinary Studies | 0 | 0.0% |
| Science & Technology | 0 | 0.0% |
| Business | 13 | 50.0% |
| Education | 0 | 0.0% |
| Literature & Languages | 0 | 0.0% |
| Liberal Arts & History | 0 | 0.0% |
| Visual & Performing Arts | 0 | 0.0% |
| Communications | 0 | 0.0% |
| Arts & Humanities | 0 | 0.0% |
| Total | 26 | 100.0% |
Transportation & Commute in Center Ossipee
Vehicle Availability by Sex in Center Ossipee
The most prevalent vehicle ownership categories in Center Ossipee are males with 2 vehicles (72, accounting for 50.0%) and females with 2 vehicles (54, making up 30.1%).
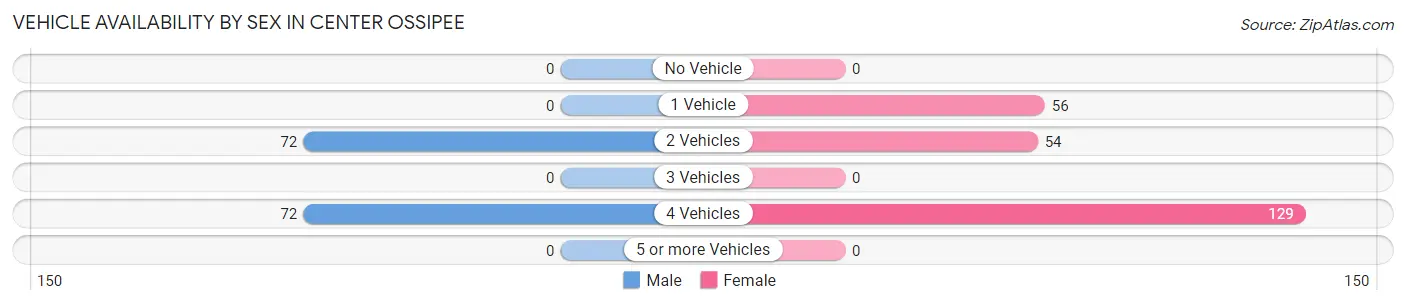
| Vehicles Available | Male | Female |
| No Vehicle | 0 (0.0%) | 0 (0.0%) |
| 1 Vehicle | 0 (0.0%) | 56 (23.4%) |
| 2 Vehicles | 72 (50.0%) | 54 (22.6%) |
| 3 Vehicles | 0 (0.0%) | 0 (0.0%) |
| 4 Vehicles | 72 (50.0%) | 129 (54.0%) |
| 5 or more Vehicles | 0 (0.0%) | 0 (0.0%) |
| Total | 144 (100.0%) | 239 (100.0%) |
Commute Time in Center Ossipee
The most frequently occuring commute durations in Center Ossipee are 30 to 34 minutes (158 commuters, 41.2%), 40 to 44 minutes (105 commuters, 27.4%), and 25 to 29 minutes (35 commuters, 9.1%).
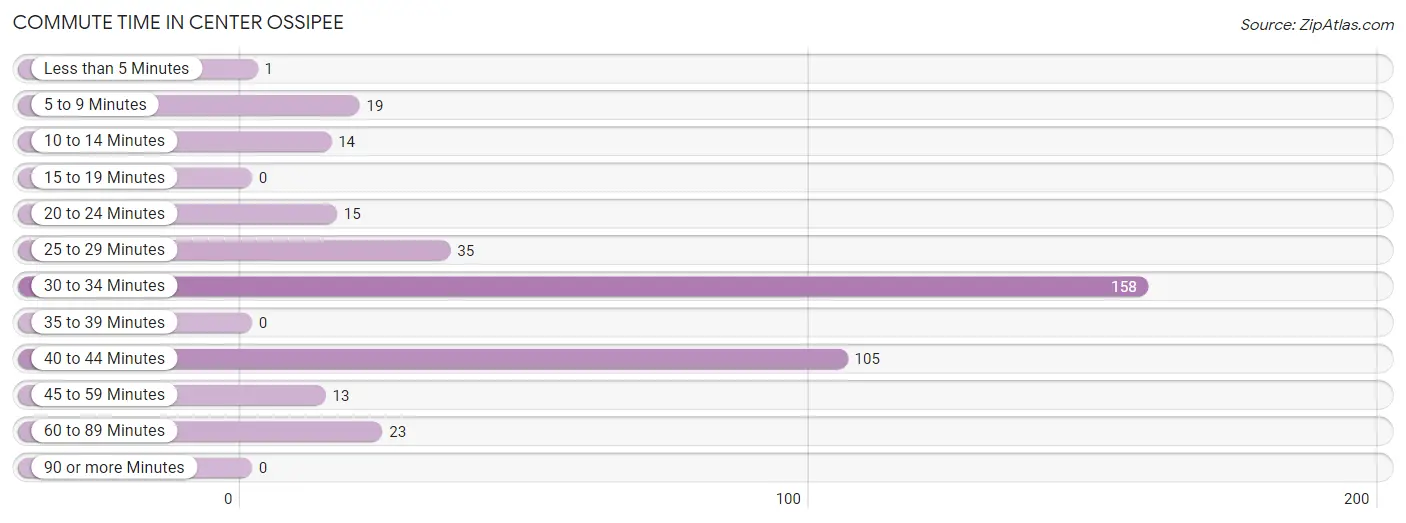
| Commute Time | # Commuters | % Commuters |
| Less than 5 Minutes | 1 | 0.3% |
| 5 to 9 Minutes | 19 | 5.0% |
| 10 to 14 Minutes | 14 | 3.7% |
| 15 to 19 Minutes | 0 | 0.0% |
| 20 to 24 Minutes | 15 | 3.9% |
| 25 to 29 Minutes | 35 | 9.1% |
| 30 to 34 Minutes | 158 | 41.2% |
| 35 to 39 Minutes | 0 | 0.0% |
| 40 to 44 Minutes | 105 | 27.4% |
| 45 to 59 Minutes | 13 | 3.4% |
| 60 to 89 Minutes | 23 | 6.0% |
| 90 or more Minutes | 0 | 0.0% |
Commute Time by Sex in Center Ossipee
The most common commute times in Center Ossipee are 40 to 44 minutes (105 commuters, 72.9%) for males and 30 to 34 minutes (156 commuters, 65.3%) for females.
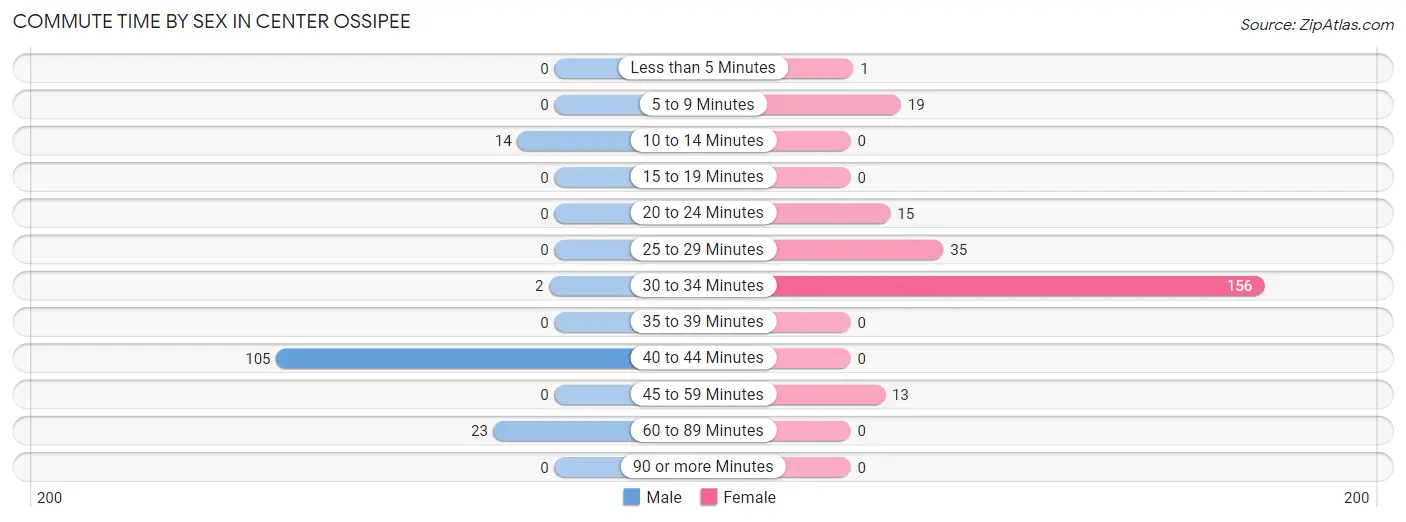
| Commute Time | Male | Female |
| Less than 5 Minutes | 0 (0.0%) | 1 (0.4%) |
| 5 to 9 Minutes | 0 (0.0%) | 19 (8.0%) |
| 10 to 14 Minutes | 14 (9.7%) | 0 (0.0%) |
| 15 to 19 Minutes | 0 (0.0%) | 0 (0.0%) |
| 20 to 24 Minutes | 0 (0.0%) | 15 (6.3%) |
| 25 to 29 Minutes | 0 (0.0%) | 35 (14.6%) |
| 30 to 34 Minutes | 2 (1.4%) | 156 (65.3%) |
| 35 to 39 Minutes | 0 (0.0%) | 0 (0.0%) |
| 40 to 44 Minutes | 105 (72.9%) | 0 (0.0%) |
| 45 to 59 Minutes | 0 (0.0%) | 13 (5.4%) |
| 60 to 89 Minutes | 23 (16.0%) | 0 (0.0%) |
| 90 or more Minutes | 0 (0.0%) | 0 (0.0%) |
Time of Departure to Work by Sex in Center Ossipee
The most frequent times of departure to work in Center Ossipee are 12:00 AM to 4:59 AM (95, 66.0%) for males and 12:00 AM to 4:59 AM (129, 54.0%) for females.
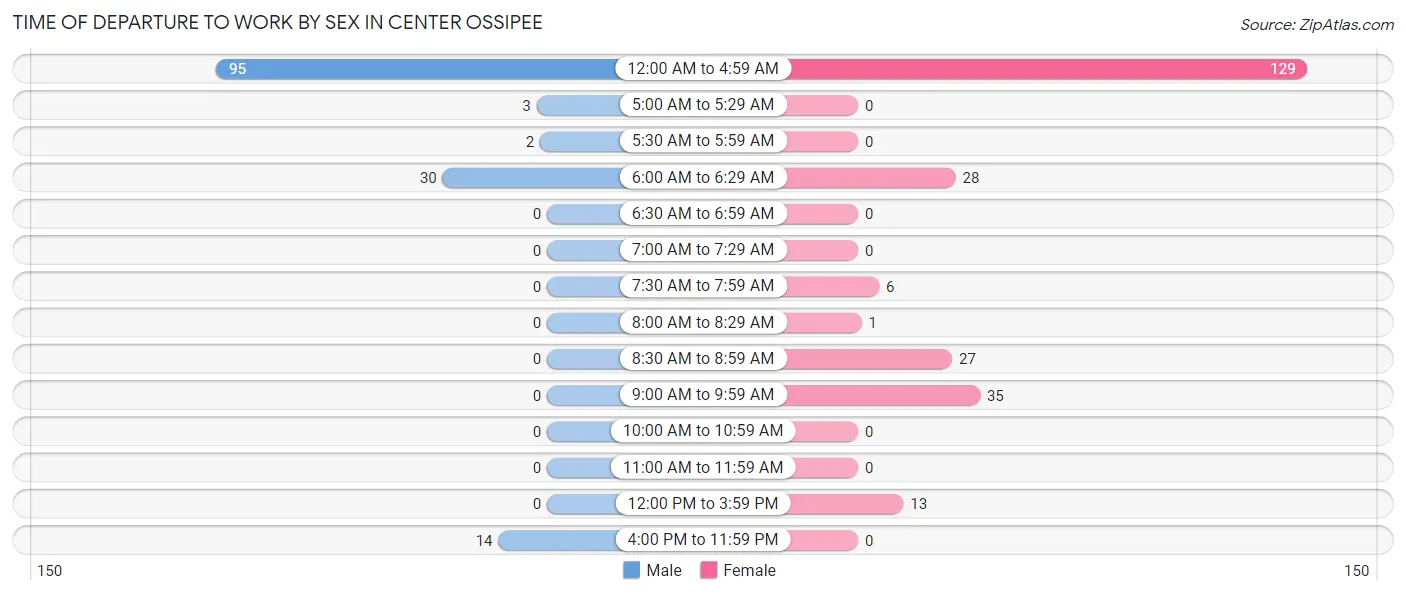
| Time of Departure | Male | Female |
| 12:00 AM to 4:59 AM | 95 (66.0%) | 129 (54.0%) |
| 5:00 AM to 5:29 AM | 3 (2.1%) | 0 (0.0%) |
| 5:30 AM to 5:59 AM | 2 (1.4%) | 0 (0.0%) |
| 6:00 AM to 6:29 AM | 30 (20.8%) | 28 (11.7%) |
| 6:30 AM to 6:59 AM | 0 (0.0%) | 0 (0.0%) |
| 7:00 AM to 7:29 AM | 0 (0.0%) | 0 (0.0%) |
| 7:30 AM to 7:59 AM | 0 (0.0%) | 6 (2.5%) |
| 8:00 AM to 8:29 AM | 0 (0.0%) | 1 (0.4%) |
| 8:30 AM to 8:59 AM | 0 (0.0%) | 27 (11.3%) |
| 9:00 AM to 9:59 AM | 0 (0.0%) | 35 (14.6%) |
| 10:00 AM to 10:59 AM | 0 (0.0%) | 0 (0.0%) |
| 11:00 AM to 11:59 AM | 0 (0.0%) | 0 (0.0%) |
| 12:00 PM to 3:59 PM | 0 (0.0%) | 13 (5.4%) |
| 4:00 PM to 11:59 PM | 14 (9.7%) | 0 (0.0%) |
| Total | 144 (100.0%) | 239 (100.0%) |
Housing Occupancy in Center Ossipee
Occupancy by Ownership in Center Ossipee
Of the total 221 dwellings in Center Ossipee, owner-occupied units account for 124 (56.1%), while renter-occupied units make up 97 (43.9%).
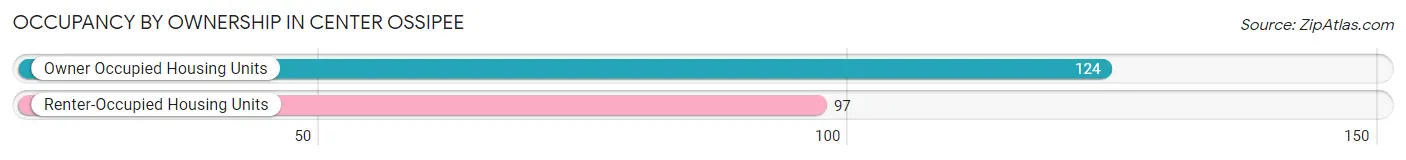
| Occupancy | # Housing Units | % Housing Units |
| Owner Occupied Housing Units | 124 | 56.1% |
| Renter-Occupied Housing Units | 97 | 43.9% |
| Total Occupied Housing Units | 221 | 100.0% |
Occupancy by Household Size in Center Ossipee
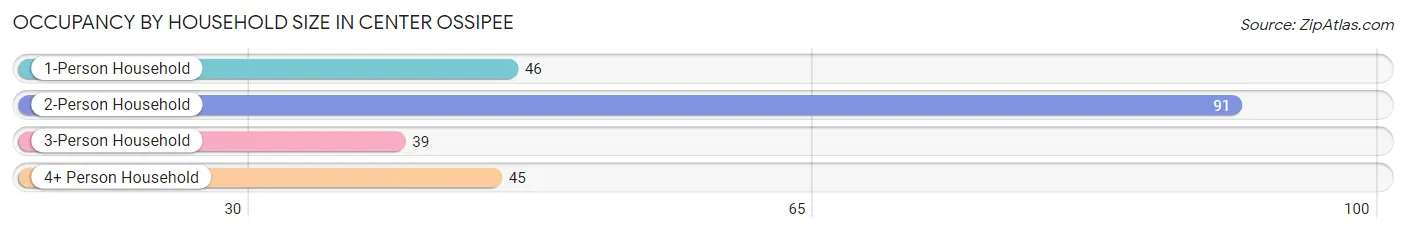
| Household Size | # Housing Units | % Housing Units |
| 1-Person Household | 46 | 20.8% |
| 2-Person Household | 91 | 41.2% |
| 3-Person Household | 39 | 17.6% |
| 4+ Person Household | 45 | 20.4% |
| Total Housing Units | 221 | 100.0% |
Occupancy by Ownership by Household Size in Center Ossipee
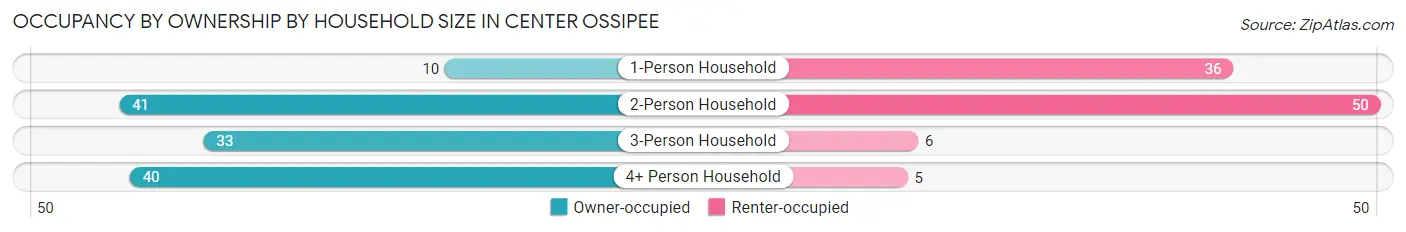
| Household Size | Owner-occupied | Renter-occupied |
| 1-Person Household | 10 (21.7%) | 36 (78.3%) |
| 2-Person Household | 41 (45.1%) | 50 (54.9%) |
| 3-Person Household | 33 (84.6%) | 6 (15.4%) |
| 4+ Person Household | 40 (88.9%) | 5 (11.1%) |
| Total Housing Units | 124 (56.1%) | 97 (43.9%) |
Occupancy by Educational Attainment in Center Ossipee
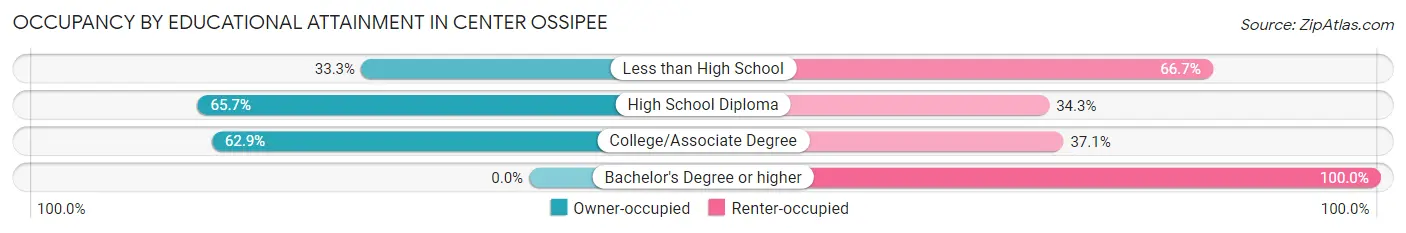
| Household Size | Owner-occupied | Renter-occupied |
| Less than High School | 13 (33.3%) | 26 (66.7%) |
| High School Diploma | 67 (65.7%) | 35 (34.3%) |
| College/Associate Degree | 44 (62.9%) | 26 (37.1%) |
| Bachelor's Degree or higher | 0 (0.0%) | 10 (100.0%) |
Occupancy by Age of Householder in Center Ossipee
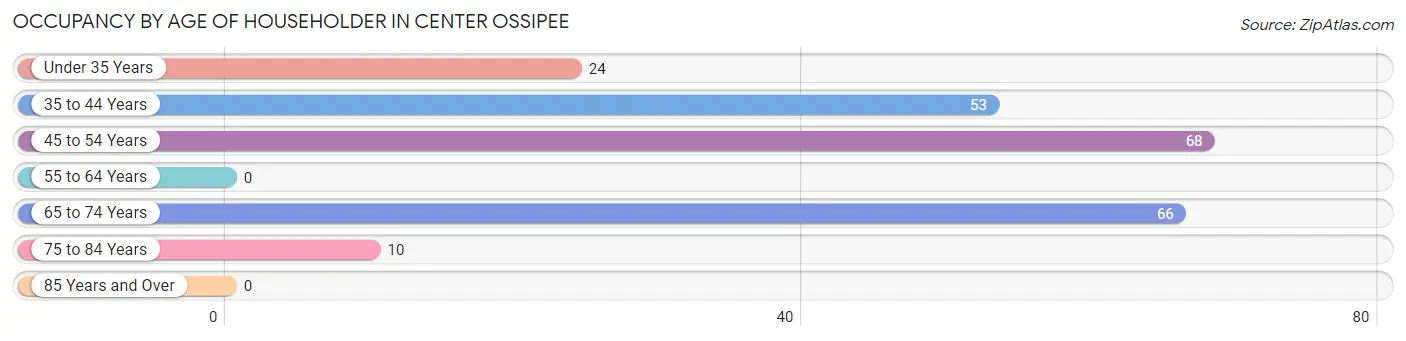
| Age Bracket | # Households | % Households |
| Under 35 Years | 24 | 10.9% |
| 35 to 44 Years | 53 | 24.0% |
| 45 to 54 Years | 68 | 30.8% |
| 55 to 64 Years | 0 | 0.0% |
| 65 to 74 Years | 66 | 29.9% |
| 75 to 84 Years | 10 | 4.5% |
| 85 Years and Over | 0 | 0.0% |
| Total | 221 | 100.0% |
Housing Finances in Center Ossipee
Median Income by Occupancy in Center Ossipee
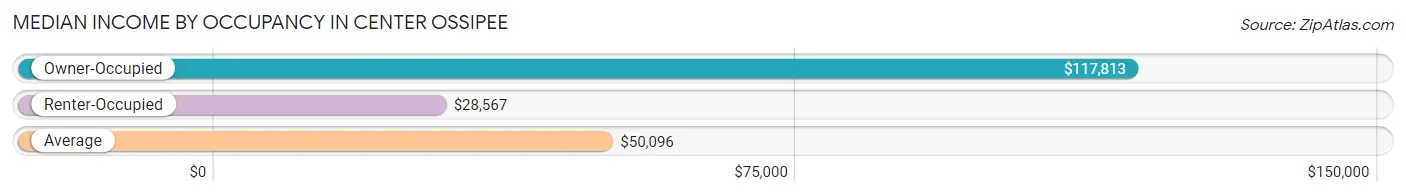
| Occupancy Type | # Households | Median Income |
| Owner-Occupied | 124 (56.1%) | $117,813 |
| Renter-Occupied | 97 (43.9%) | $28,567 |
| Average | 221 (100.0%) | $50,096 |
Occupancy by Householder Income Bracket in Center Ossipee
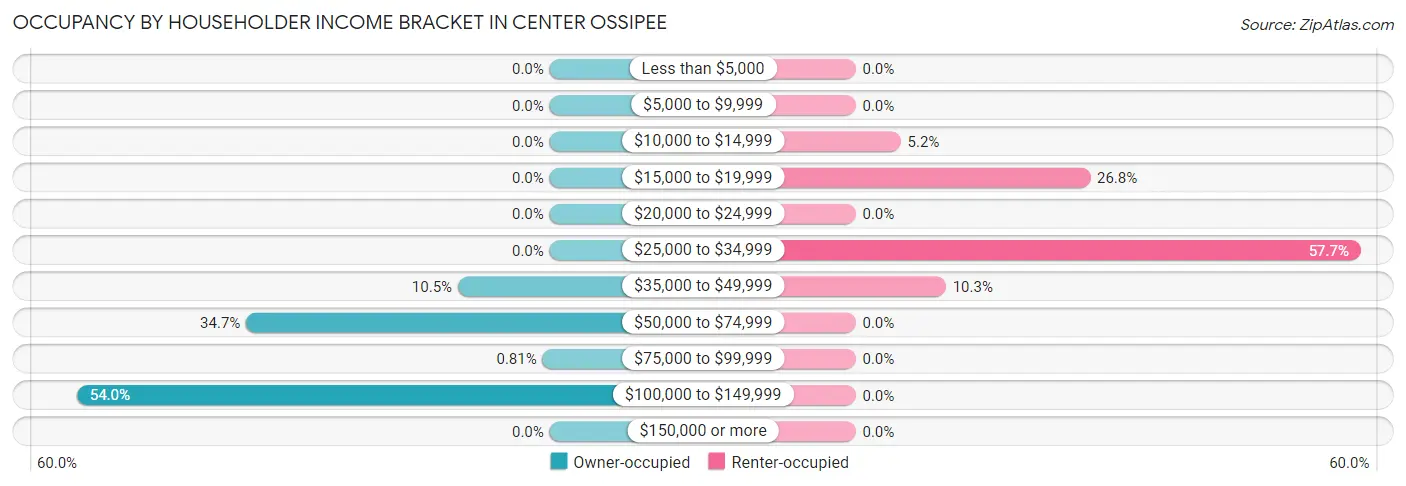
| Income Bracket | Owner-occupied | Renter-occupied |
| Less than $5,000 | 0 (0.0%) | 0 (0.0%) |
| $5,000 to $9,999 | 0 (0.0%) | 0 (0.0%) |
| $10,000 to $14,999 | 0 (0.0%) | 5 (5.1%) |
| $15,000 to $19,999 | 0 (0.0%) | 26 (26.8%) |
| $20,000 to $24,999 | 0 (0.0%) | 0 (0.0%) |
| $25,000 to $34,999 | 0 (0.0%) | 56 (57.7%) |
| $35,000 to $49,999 | 13 (10.5%) | 10 (10.3%) |
| $50,000 to $74,999 | 43 (34.7%) | 0 (0.0%) |
| $75,000 to $99,999 | 1 (0.8%) | 0 (0.0%) |
| $100,000 to $149,999 | 67 (54.0%) | 0 (0.0%) |
| $150,000 or more | 0 (0.0%) | 0 (0.0%) |
| Total | 124 (100.0%) | 97 (100.0%) |
Monthly Housing Cost Tiers in Center Ossipee
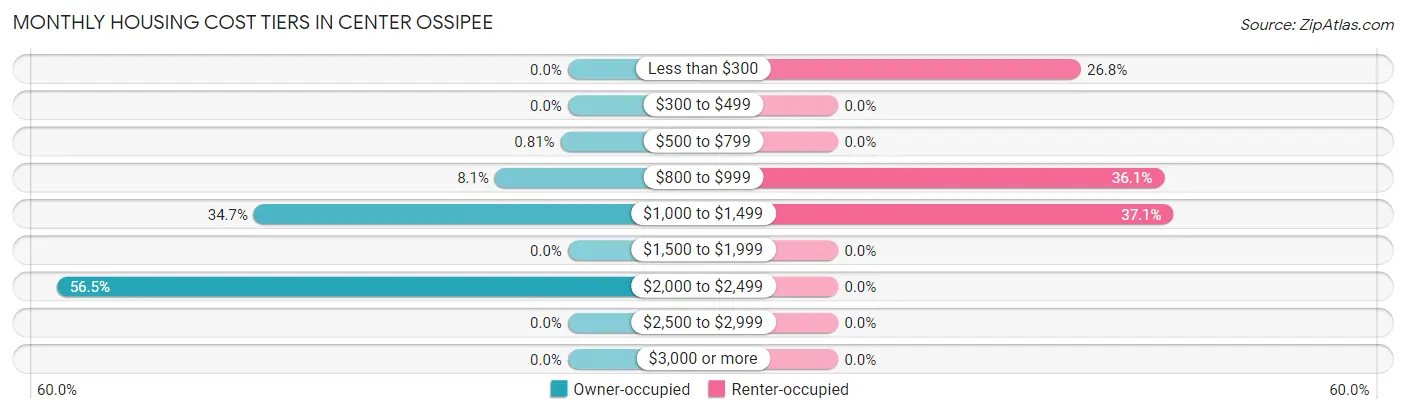
| Monthly Cost | Owner-occupied | Renter-occupied |
| Less than $300 | 0 (0.0%) | 26 (26.8%) |
| $300 to $499 | 0 (0.0%) | 0 (0.0%) |
| $500 to $799 | 1 (0.8%) | 0 (0.0%) |
| $800 to $999 | 10 (8.1%) | 35 (36.1%) |
| $1,000 to $1,499 | 43 (34.7%) | 36 (37.1%) |
| $1,500 to $1,999 | 0 (0.0%) | 0 (0.0%) |
| $2,000 to $2,499 | 70 (56.5%) | 0 (0.0%) |
| $2,500 to $2,999 | 0 (0.0%) | 0 (0.0%) |
| $3,000 or more | 0 (0.0%) | 0 (0.0%) |
| Total | 124 (100.0%) | 97 (100.0%) |
Physical Housing Characteristics in Center Ossipee
Housing Structures in Center Ossipee
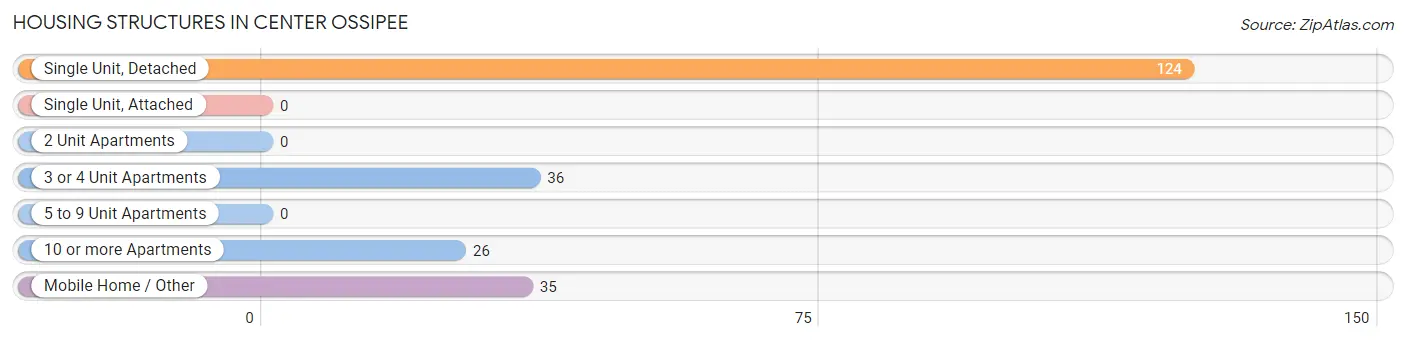
| Structure Type | # Housing Units | % Housing Units |
| Single Unit, Detached | 124 | 56.1% |
| Single Unit, Attached | 0 | 0.0% |
| 2 Unit Apartments | 0 | 0.0% |
| 3 or 4 Unit Apartments | 36 | 16.3% |
| 5 to 9 Unit Apartments | 0 | 0.0% |
| 10 or more Apartments | 26 | 11.8% |
| Mobile Home / Other | 35 | 15.8% |
| Total | 221 | 100.0% |
Housing Structures by Occupancy in Center Ossipee
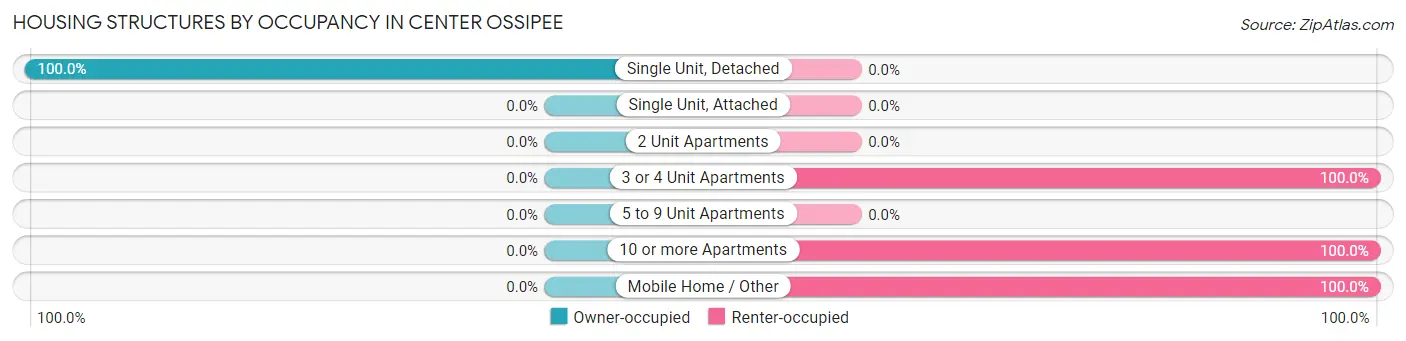
| Structure Type | Owner-occupied | Renter-occupied |
| Single Unit, Detached | 124 (100.0%) | 0 (0.0%) |
| Single Unit, Attached | 0 (0.0%) | 0 (0.0%) |
| 2 Unit Apartments | 0 (0.0%) | 0 (0.0%) |
| 3 or 4 Unit Apartments | 0 (0.0%) | 36 (100.0%) |
| 5 to 9 Unit Apartments | 0 (0.0%) | 0 (0.0%) |
| 10 or more Apartments | 0 (0.0%) | 26 (100.0%) |
| Mobile Home / Other | 0 (0.0%) | 35 (100.0%) |
| Total | 124 (56.1%) | 97 (43.9%) |
Housing Structures by Number of Rooms in Center Ossipee
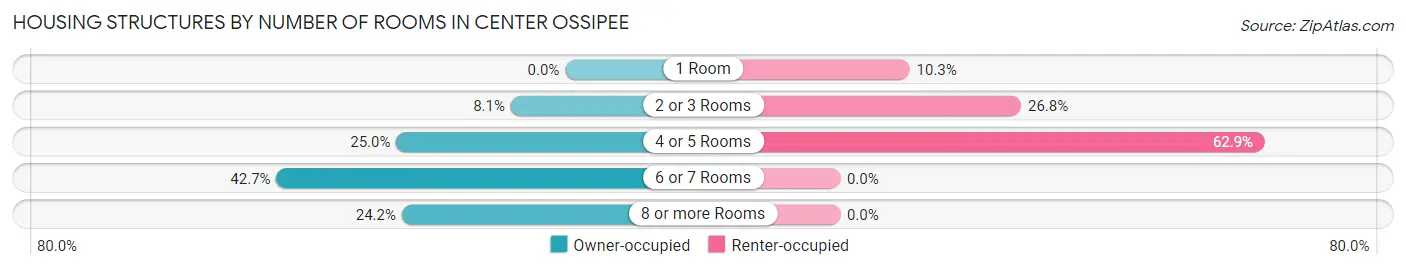
| Number of Rooms | Owner-occupied | Renter-occupied |
| 1 Room | 0 (0.0%) | 10 (10.3%) |
| 2 or 3 Rooms | 10 (8.1%) | 26 (26.8%) |
| 4 or 5 Rooms | 31 (25.0%) | 61 (62.9%) |
| 6 or 7 Rooms | 53 (42.7%) | 0 (0.0%) |
| 8 or more Rooms | 30 (24.2%) | 0 (0.0%) |
| Total | 124 (100.0%) | 97 (100.0%) |
Housing Structure by Heating Type in Center Ossipee
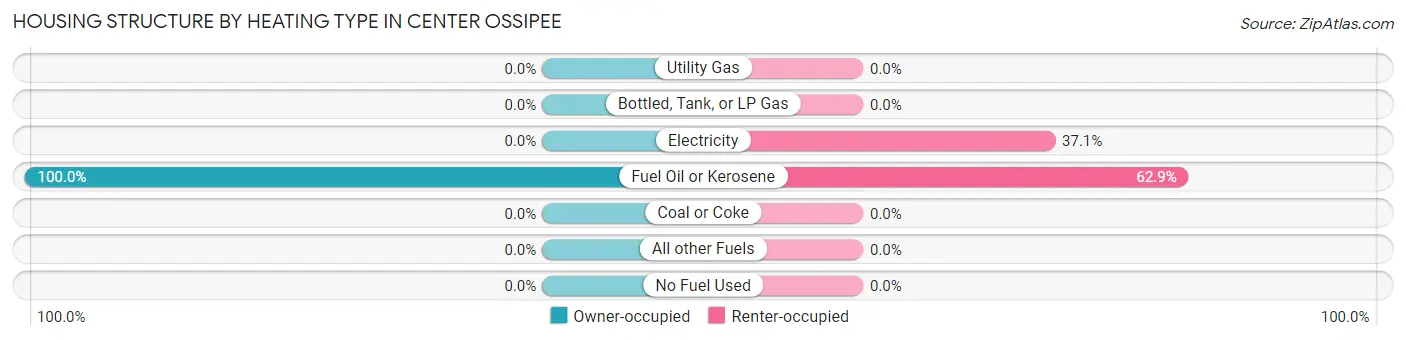
| Heating Type | Owner-occupied | Renter-occupied |
| Utility Gas | 0 (0.0%) | 0 (0.0%) |
| Bottled, Tank, or LP Gas | 0 (0.0%) | 0 (0.0%) |
| Electricity | 0 (0.0%) | 36 (37.1%) |
| Fuel Oil or Kerosene | 124 (100.0%) | 61 (62.9%) |
| Coal or Coke | 0 (0.0%) | 0 (0.0%) |
| All other Fuels | 0 (0.0%) | 0 (0.0%) |
| No Fuel Used | 0 (0.0%) | 0 (0.0%) |
| Total | 124 (100.0%) | 97 (100.0%) |
Household Vehicle Usage in Center Ossipee
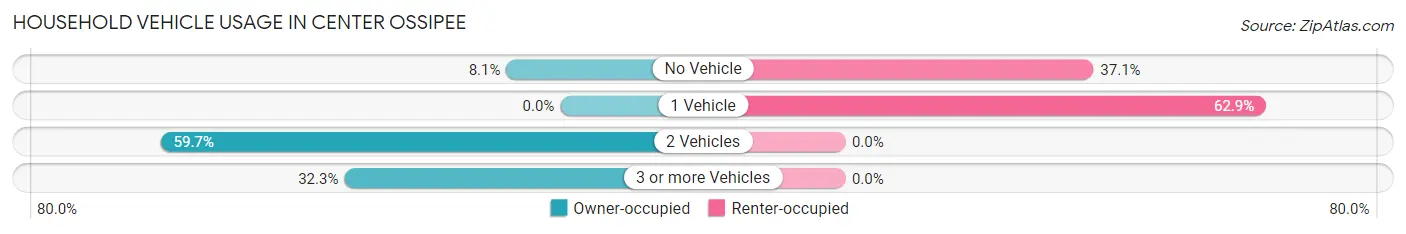
| Vehicles per Household | Owner-occupied | Renter-occupied |
| No Vehicle | 10 (8.1%) | 36 (37.1%) |
| 1 Vehicle | 0 (0.0%) | 61 (62.9%) |
| 2 Vehicles | 74 (59.7%) | 0 (0.0%) |
| 3 or more Vehicles | 40 (32.3%) | 0 (0.0%) |
| Total | 124 (100.0%) | 97 (100.0%) |
Real Estate & Mortgages in Center Ossipee
Real Estate and Mortgage Overview in Center Ossipee
| Characteristic | Without Mortgage | With Mortgage |
| Housing Units | 1 | 123 |
| Median Property Value | - | - |
| Median Household Income | - | - |
| Monthly Housing Costs | - | - |
| Real Estate Taxes | - | - |
Property Value by Mortgage Status in Center Ossipee
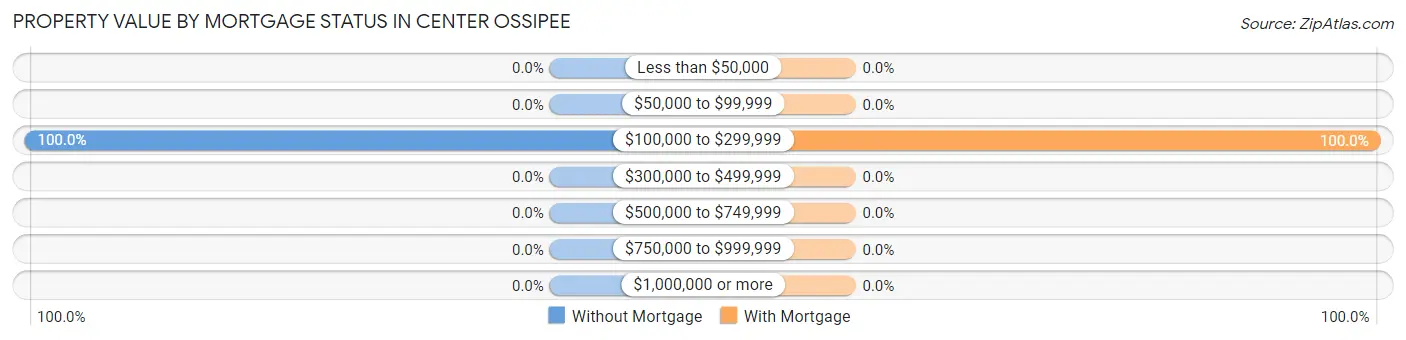
| Property Value | Without Mortgage | With Mortgage |
| Less than $50,000 | 0 (0.0%) | 0 (0.0%) |
| $50,000 to $99,999 | 0 (0.0%) | 0 (0.0%) |
| $100,000 to $299,999 | 1 (100.0%) | 123 (100.0%) |
| $300,000 to $499,999 | 0 (0.0%) | 0 (0.0%) |
| $500,000 to $749,999 | 0 (0.0%) | 0 (0.0%) |
| $750,000 to $999,999 | 0 (0.0%) | 0 (0.0%) |
| $1,000,000 or more | 0 (0.0%) | 0 (0.0%) |
| Total | 1 (100.0%) | 123 (100.0%) |
Household Income by Mortgage Status in Center Ossipee
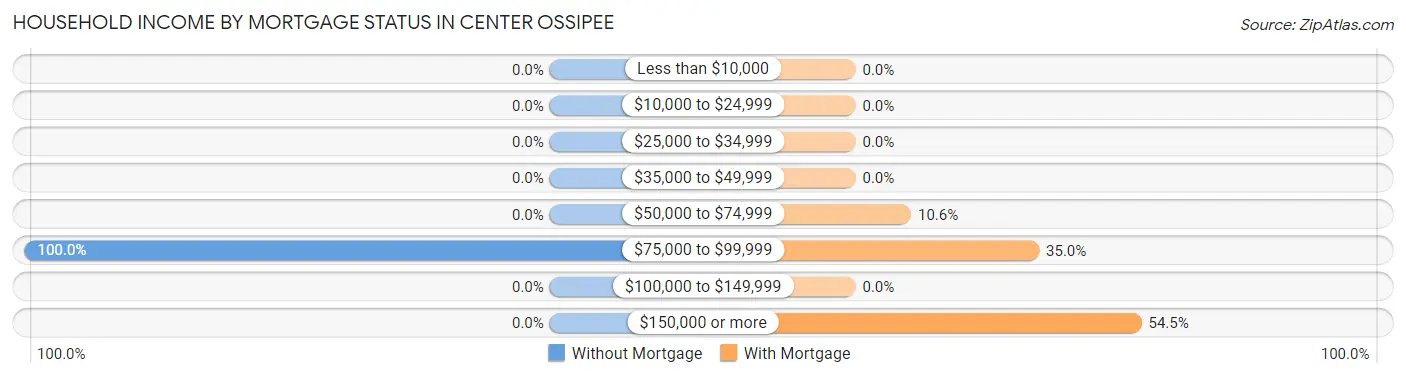
| Household Income | Without Mortgage | With Mortgage |
| Less than $10,000 | 0 (0.0%) | 0 (0.0%) |
| $10,000 to $24,999 | 0 (0.0%) | 0 (0.0%) |
| $25,000 to $34,999 | 0 (0.0%) | 0 (0.0%) |
| $35,000 to $49,999 | 0 (0.0%) | 0 (0.0%) |
| $50,000 to $74,999 | 0 (0.0%) | 13 (10.6%) |
| $75,000 to $99,999 | 1 (100.0%) | 43 (35.0%) |
| $100,000 to $149,999 | 0 (0.0%) | 0 (0.0%) |
| $150,000 or more | 0 (0.0%) | 67 (54.5%) |
| Total | 1 (100.0%) | 123 (100.0%) |
Property Value to Household Income Ratio in Center Ossipee
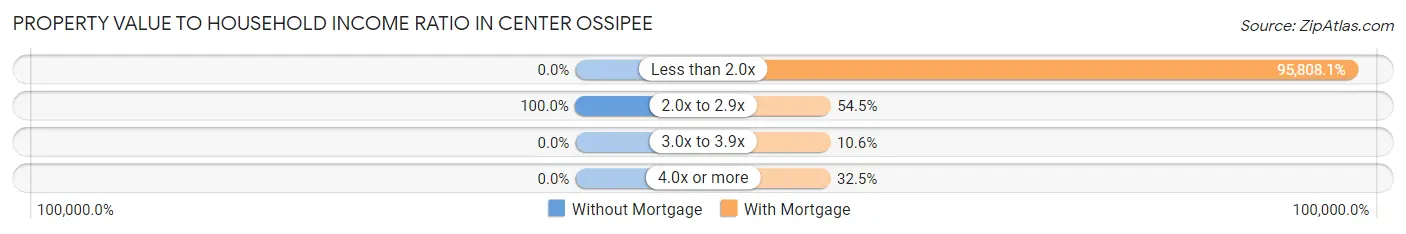
| Value-to-Income Ratio | Without Mortgage | With Mortgage |
| Less than 2.0x | 0 (0.0%) | 117,844 (95,808.1%) |
| 2.0x to 2.9x | 1 (100.0%) | 67 (54.5%) |
| 3.0x to 3.9x | 0 (0.0%) | 13 (10.6%) |
| 4.0x or more | 0 (0.0%) | 40 (32.5%) |
| Total | 1 (100.0%) | 123 (100.0%) |
Real Estate Taxes by Mortgage Status in Center Ossipee
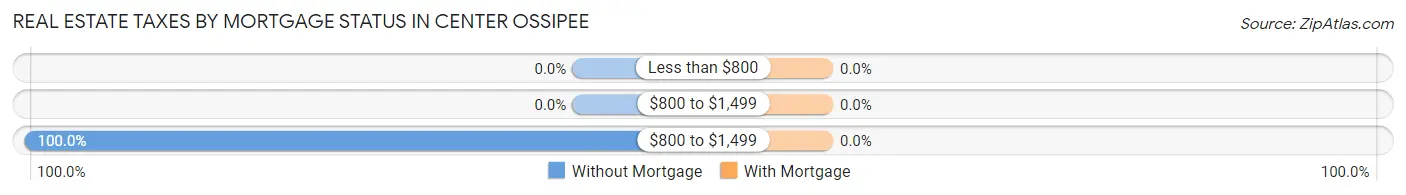
| Property Taxes | Without Mortgage | With Mortgage |
| Less than $800 | 0 (0.0%) | 0 (0.0%) |
| $800 to $1,499 | 0 (0.0%) | 0 (0.0%) |
| $800 to $1,499 | 1 (100.0%) | 0 (0.0%) |
| Total | 1 (100.0%) | 123 (100.0%) |
Health & Disability in Center Ossipee
Health Insurance Coverage by Age in Center Ossipee
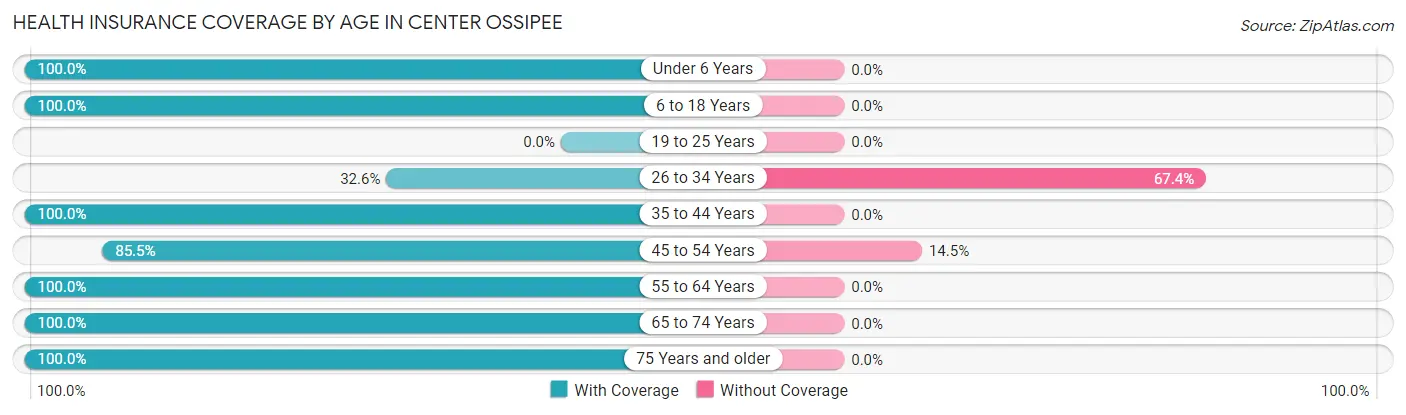
| Age Bracket | With Coverage | Without Coverage |
| Under 6 Years | 6 (100.0%) | 0 (0.0%) |
| 6 to 18 Years | 153 (100.0%) | 0 (0.0%) |
| 19 to 25 Years | 0 (0.0%) | 0 (0.0%) |
| 26 to 34 Years | 14 (32.6%) | 29 (67.4%) |
| 35 to 44 Years | 299 (100.0%) | 0 (0.0%) |
| 45 to 54 Years | 59 (85.5%) | 10 (14.5%) |
| 55 to 64 Years | 25 (100.0%) | 0 (0.0%) |
| 65 to 74 Years | 66 (100.0%) | 0 (0.0%) |
| 75 Years and older | 18 (100.0%) | 0 (0.0%) |
| Total | 640 (94.3%) | 39 (5.7%) |
Health Insurance Coverage by Citizenship Status in Center Ossipee
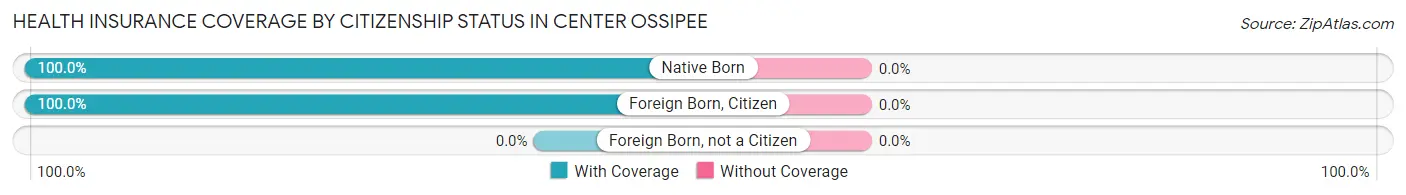
| Citizenship Status | With Coverage | Without Coverage |
| Native Born | 6 (100.0%) | 0 (0.0%) |
| Foreign Born, Citizen | 153 (100.0%) | 0 (0.0%) |
| Foreign Born, not a Citizen | 0 (0.0%) | 0 (0.0%) |
Health Insurance Coverage by Household Income in Center Ossipee
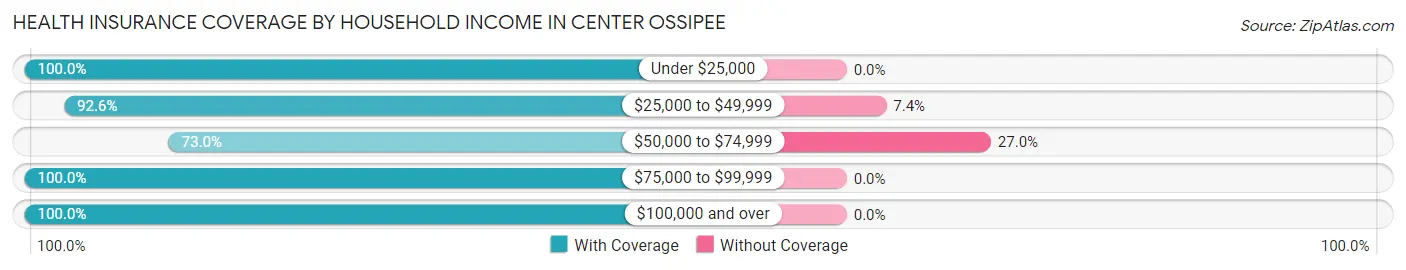
| Household Income | With Coverage | Without Coverage |
| Under $25,000 | 44 (100.0%) | 0 (0.0%) |
| $25,000 to $49,999 | 125 (92.6%) | 10 (7.4%) |
| $50,000 to $74,999 | 73 (73.0%) | 27 (27.0%) |
| $75,000 to $99,999 | 3 (100.0%) | 0 (0.0%) |
| $100,000 and over | 384 (100.0%) | 0 (0.0%) |
Public vs Private Health Insurance Coverage by Age in Center Ossipee
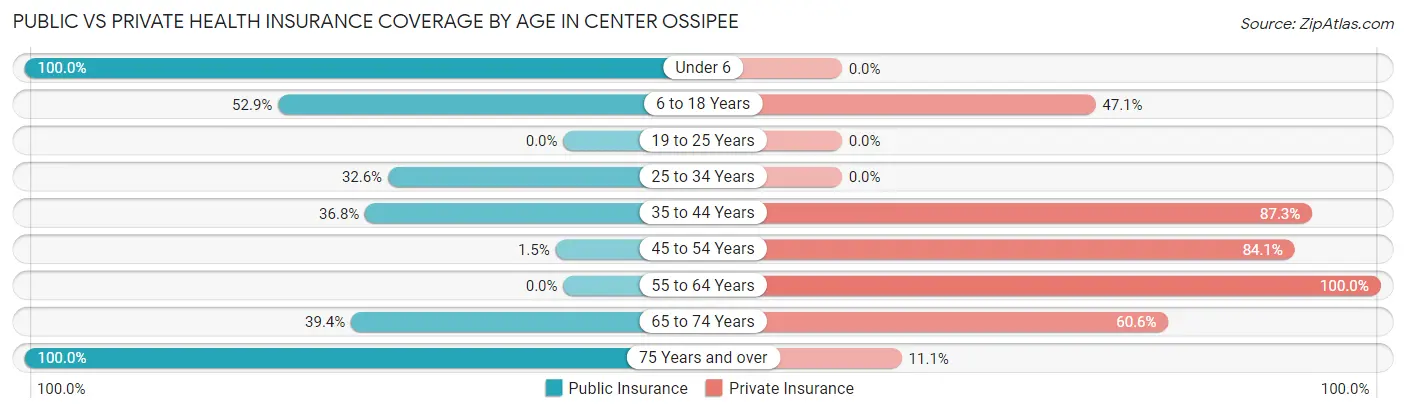
| Age Bracket | Public Insurance | Private Insurance |
| Under 6 | 6 (100.0%) | 0 (0.0%) |
| 6 to 18 Years | 81 (52.9%) | 72 (47.1%) |
| 19 to 25 Years | 0 (0.0%) | 0 (0.0%) |
| 25 to 34 Years | 14 (32.6%) | 0 (0.0%) |
| 35 to 44 Years | 110 (36.8%) | 261 (87.3%) |
| 45 to 54 Years | 1 (1.5%) | 58 (84.1%) |
| 55 to 64 Years | 0 (0.0%) | 25 (100.0%) |
| 65 to 74 Years | 26 (39.4%) | 40 (60.6%) |
| 75 Years and over | 18 (100.0%) | 2 (11.1%) |
| Total | 256 (37.7%) | 458 (67.4%) |
Disability Status by Sex by Age in Center Ossipee
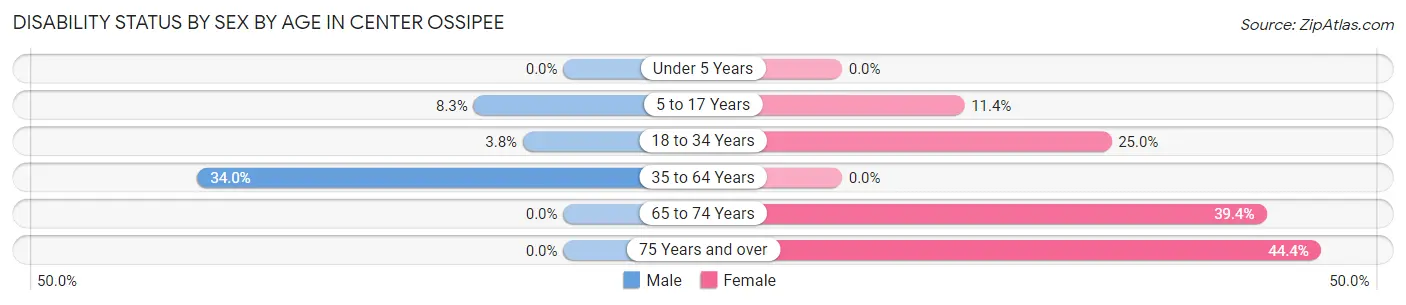
| Age Bracket | Male | Female |
| Under 5 Years | 0 (0.0%) | 0 (0.0%) |
| 5 to 17 Years | 4 (8.3%) | 5 (11.4%) |
| 18 to 34 Years | 3 (3.7%) | 6 (25.0%) |
| 35 to 64 Years | 72 (34.0%) | 0 (0.0%) |
| 65 to 74 Years | 0 (0.0%) | 26 (39.4%) |
| 75 Years and over | 0 (0.0%) | 8 (44.4%) |
Disability Class by Sex by Age in Center Ossipee
Disability Class: Hearing Difficulty
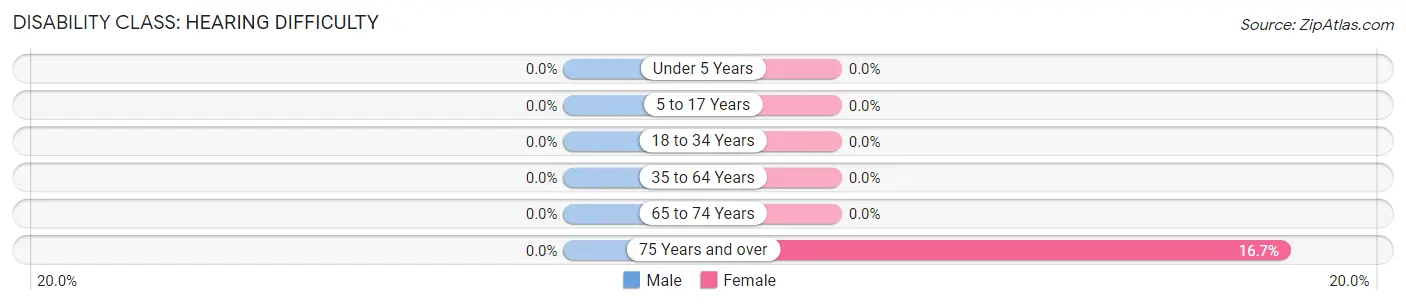
| Age Bracket | Male | Female |
| Under 5 Years | 0 (0.0%) | 0 (0.0%) |
| 5 to 17 Years | 0 (0.0%) | 0 (0.0%) |
| 18 to 34 Years | 0 (0.0%) | 0 (0.0%) |
| 35 to 64 Years | 0 (0.0%) | 0 (0.0%) |
| 65 to 74 Years | 0 (0.0%) | 0 (0.0%) |
| 75 Years and over | 0 (0.0%) | 3 (16.7%) |
Disability Class: Vision Difficulty
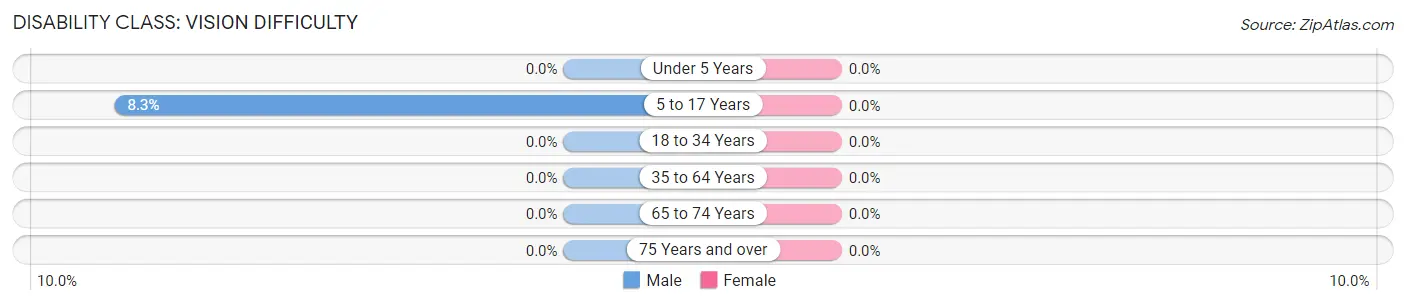
| Age Bracket | Male | Female |
| Under 5 Years | 0 (0.0%) | 0 (0.0%) |
| 5 to 17 Years | 4 (8.3%) | 0 (0.0%) |
| 18 to 34 Years | 0 (0.0%) | 0 (0.0%) |
| 35 to 64 Years | 0 (0.0%) | 0 (0.0%) |
| 65 to 74 Years | 0 (0.0%) | 0 (0.0%) |
| 75 Years and over | 0 (0.0%) | 0 (0.0%) |
Disability Class: Cognitive Difficulty
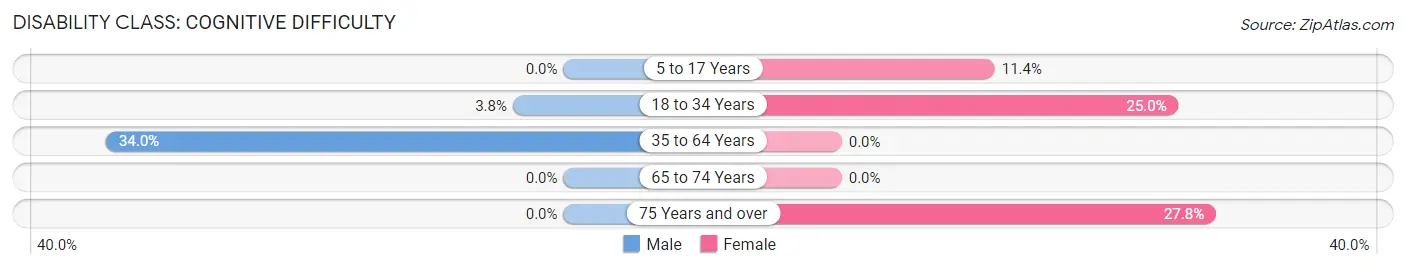
| Age Bracket | Male | Female |
| 5 to 17 Years | 0 (0.0%) | 5 (11.4%) |
| 18 to 34 Years | 3 (3.7%) | 6 (25.0%) |
| 35 to 64 Years | 72 (34.0%) | 0 (0.0%) |
| 65 to 74 Years | 0 (0.0%) | 0 (0.0%) |
| 75 Years and over | 0 (0.0%) | 5 (27.8%) |
Disability Class: Ambulatory Difficulty
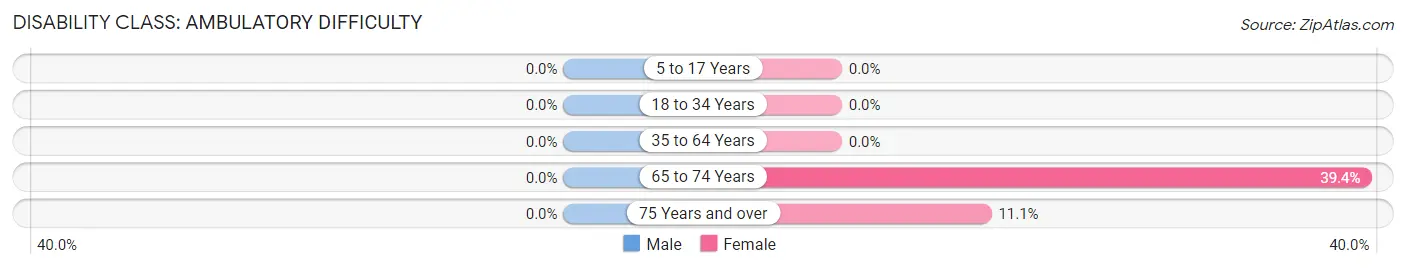
| Age Bracket | Male | Female |
| 5 to 17 Years | 0 (0.0%) | 0 (0.0%) |
| 18 to 34 Years | 0 (0.0%) | 0 (0.0%) |
| 35 to 64 Years | 0 (0.0%) | 0 (0.0%) |
| 65 to 74 Years | 0 (0.0%) | 26 (39.4%) |
| 75 Years and over | 0 (0.0%) | 2 (11.1%) |
Disability Class: Self-Care Difficulty
| Age Bracket | Male | Female |
| 5 to 17 Years | 0 (0.0%) | 0 (0.0%) |
| 18 to 34 Years | 0 (0.0%) | 0 (0.0%) |
| 35 to 64 Years | 0 (0.0%) | 0 (0.0%) |
| 65 to 74 Years | 0 (0.0%) | 0 (0.0%) |
| 75 Years and over | 0 (0.0%) | 0 (0.0%) |
Technology Access in Center Ossipee
Computing Device Access in Center Ossipee
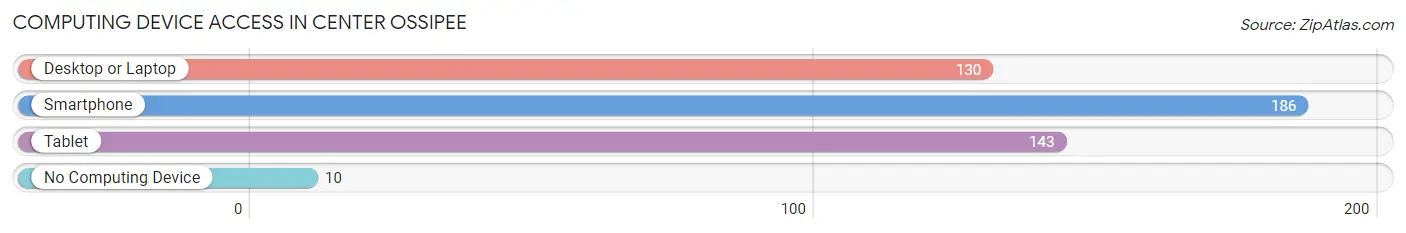
| Device Type | # Households | % Households |
| Desktop or Laptop | 130 | 58.8% |
| Smartphone | 186 | 84.2% |
| Tablet | 143 | 64.7% |
| No Computing Device | 10 | 4.5% |
| Total | 221 | 100.0% |
Internet Access in Center Ossipee
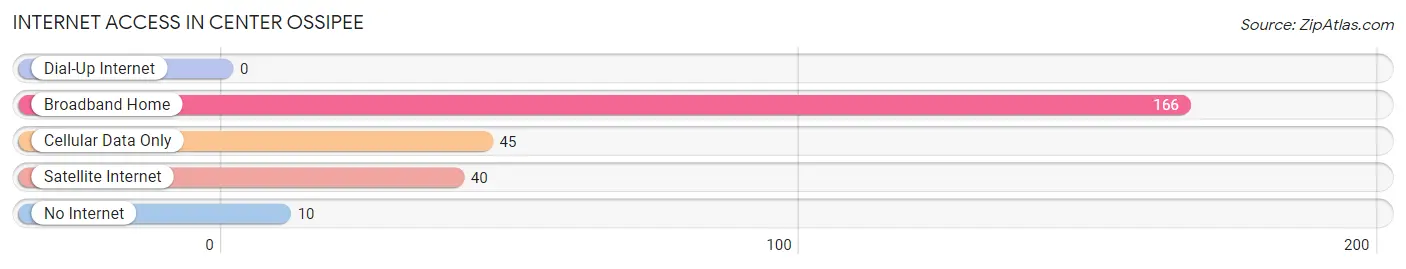
| Internet Type | # Households | % Households |
| Dial-Up Internet | 0 | 0.0% |
| Broadband Home | 166 | 75.1% |
| Cellular Data Only | 45 | 20.4% |
| Satellite Internet | 40 | 18.1% |
| No Internet | 10 | 4.5% |
| Total | 221 | 100.0% |
Center Ossipee Summary
History
The town of Center Ossipee is located in the eastern part of the state of New Hampshire, in the foothills of the White Mountains. It is part of the larger Ossipee Lake region, which is known for its natural beauty and recreational opportunities. The town was first settled in 1768 by a group of settlers from Massachusetts, led by Captain John Smith. The town was originally called Smithtown, but was later changed to Center Ossipee in 1820.
The town was an important stop on the stagecoach route between Portland, Maine and Boston, Massachusetts. It was also a popular destination for tourists, who came to enjoy the area’s natural beauty and recreational activities. The town was home to several mills, including a sawmill, gristmill, and a woolen mill.
The town was also home to a number of prominent citizens, including Governor John Langdon, who served as the first governor of New Hampshire. The town was also home to the first post office in the state, which was established in 1790.
Geography
Center Ossipee is located in the eastern part of the state of New Hampshire, in the foothills of the White Mountains. It is part of the larger Ossipee Lake region, which is known for its natural beauty and recreational opportunities. The town is bordered by the towns of Freedom, Effingham, and Wakefield.
The town is located at the intersection of two major highways, Route 16 and Route 25. The town is also located near the junction of the Ossipee River and the Saco River. The town is located in the White Mountain National Forest, and is home to several state parks, including the Ossipee Lake State Park and the White Mountain National Forest.
Economy
The economy of Center Ossipee is largely based on tourism and recreation. The town is home to several resorts and campgrounds, as well as a number of restaurants and other businesses catering to tourists. The town is also home to several small businesses, including a lumber mill, a sawmill, and a gristmill.
The town is also home to a number of manufacturing companies, including a paper mill, a plastics factory, and a furniture factory. The town is also home to a number of farms, which produce a variety of crops, including apples, potatoes, and hay.
Demographics
As of the 2010 census, the town of Center Ossipee had a population of 2,845. The population was spread out with a median age of 44.7 years. The racial makeup of the town was 97.3% White, 0.7% African American, 0.2% Native American, 0.3% Asian, 0.1% Pacific Islander, 0.3% from other races, and 1.2% from two or more races. Hispanic or Latino of any race were 1.2% of the population.
The town had a median household income of $50,938, and the per capita income was $25,945. About 8.3% of the population was below the poverty line. The town had a high rate of homeownership, with 81.3% of the population owning their own homes.
Conclusion
Center Ossipee is a small town located in the eastern part of the state of New Hampshire, in the foothills of the White Mountains. The town is known for its natural beauty and recreational opportunities, and is home to several resorts and campgrounds. The town is also home to a number of small businesses, including a lumber mill, a sawmill, and a gristmill. The town has a population of 2,845, with a median age of 44.7 years. The town has a median household income of $50,938, and the per capita income was $25,945. The town has a high rate of homeownership, with 81.3% of the population owning their own homes.
Common Questions
What is Per Capita Income in Center Ossipee?
Per Capita income in Center Ossipee is $22,549.
What is the Median Household income in Center Ossipee?
Median Household Income in Center Ossipee is $50,096.
What is Income or Wage Gap in Center Ossipee?
Income or Wage Gap in Center Ossipee is 4.6%.
Women in Center Ossipee earn 95.4 cents for every dollar earned by a man.
What is Inequality or Gini Index in Center Ossipee?
Inequality or Gini Index in Center Ossipee is 0.36.
What is the Total Population of Center Ossipee?
Total Population of Center Ossipee is 679.
What is the Total Male Population of Center Ossipee?
Total Male Population of Center Ossipee is 346.
What is the Total Female Population of Center Ossipee?
Total Female Population of Center Ossipee is 333.
What is the Ratio of Males per 100 Females in Center Ossipee?
There are 103.90 Males per 100 Females in Center Ossipee.
What is the Ratio of Females per 100 Males in Center Ossipee?
There are 96.24 Females per 100 Males in Center Ossipee.
What is the Median Population Age in Center Ossipee?
Median Population Age in Center Ossipee is 41.5 Years.
What is the Average Family Size in Center Ossipee
Average Family Size in Center Ossipee is 3.7 People.
What is the Average Household Size in Center Ossipee
Average Household Size in Center Ossipee is 3.0 People.
How Large is the Labor Force in Center Ossipee?
There are 456 People in the Labor Forcein in Center Ossipee.
What is the Percentage of People in the Labor Force in Center Ossipee?
78.5% of People are in the Labor Force in Center Ossipee.
What is the Unemployment Rate in Center Ossipee?
Unemployment Rate in Center Ossipee is 13.4%.