Peterborough, NH Map & Demographics
Peterborough Map
Peterborough Overview
$72,177
PER CAPITA INCOME
$99,904
AVG FAMILY INCOME
$83,906
AVG HOUSEHOLD INCOME
22.3%
WAGE / INCOME GAP [ % ]
77.7¢/ $1
WAGE / INCOME GAP [ $ ]
0.45
INEQUALITY / GINI INDEX
2,247
TOTAL POPULATION
1,013
MALE POPULATION
1,234
FEMALE POPULATION
82.09
MALES / 100 FEMALES
121.82
FEMALES / 100 MALES
60.7
MEDIAN AGE
2.2
AVG FAMILY SIZE
1.7
AVG HOUSEHOLD SIZE
1,358
LABOR FORCE [ PEOPLE ]
62.7%
PERCENT IN LABOR FORCE
2.9%
UNEMPLOYMENT RATE
Peterborough Zip Codes
Peterborough Area Codes
Income in Peterborough
Income Overview in Peterborough
Per Capita Income in Peterborough is $72,177, while median incomes of families and households are $99,904 and $83,906 respectively.
| Characteristic | Number | Measure |
| Per Capita Income | 2,247 | $72,177 |
| Median Family Income | 626 | $99,904 |
| Mean Family Income | 626 | $159,678 |
| Median Household Income | 1,279 | $83,906 |
| Mean Household Income | 1,279 | $124,624 |
| Income Deficit | 626 | $0 |
| Wage / Income Gap (%) | 2,247 | 22.29% |
| Wage / Income Gap ($) | 2,247 | 77.71¢ per $1 |
| Gini / Inequality Index | 2,247 | 0.45 |
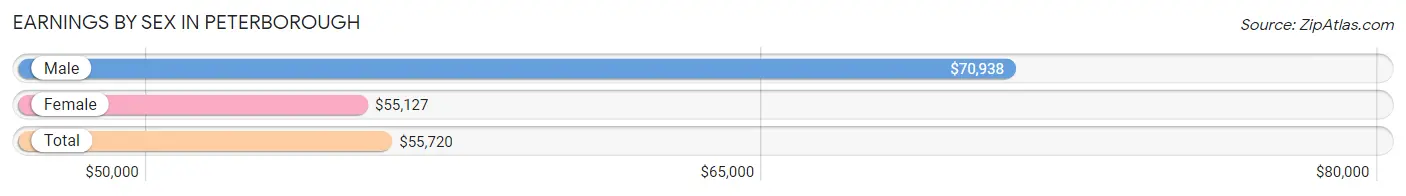
Earnings by Sex in Peterborough
Average Earnings in Peterborough are $55,720, $70,938 for men and $55,127 for women, a difference of 22.3%.
| Sex | Number | Average Earnings |
| Male | 676 (48.0%) | $70,938 |
| Female | 732 (52.0%) | $55,127 |
| Total | 1,408 (100.0%) | $55,720 |
Earnings by Sex by Income Bracket in Peterborough
The most common earnings brackets in Peterborough are $100,000+ for men (189 | 28.0%) and $100,000+ for women (144 | 19.7%).
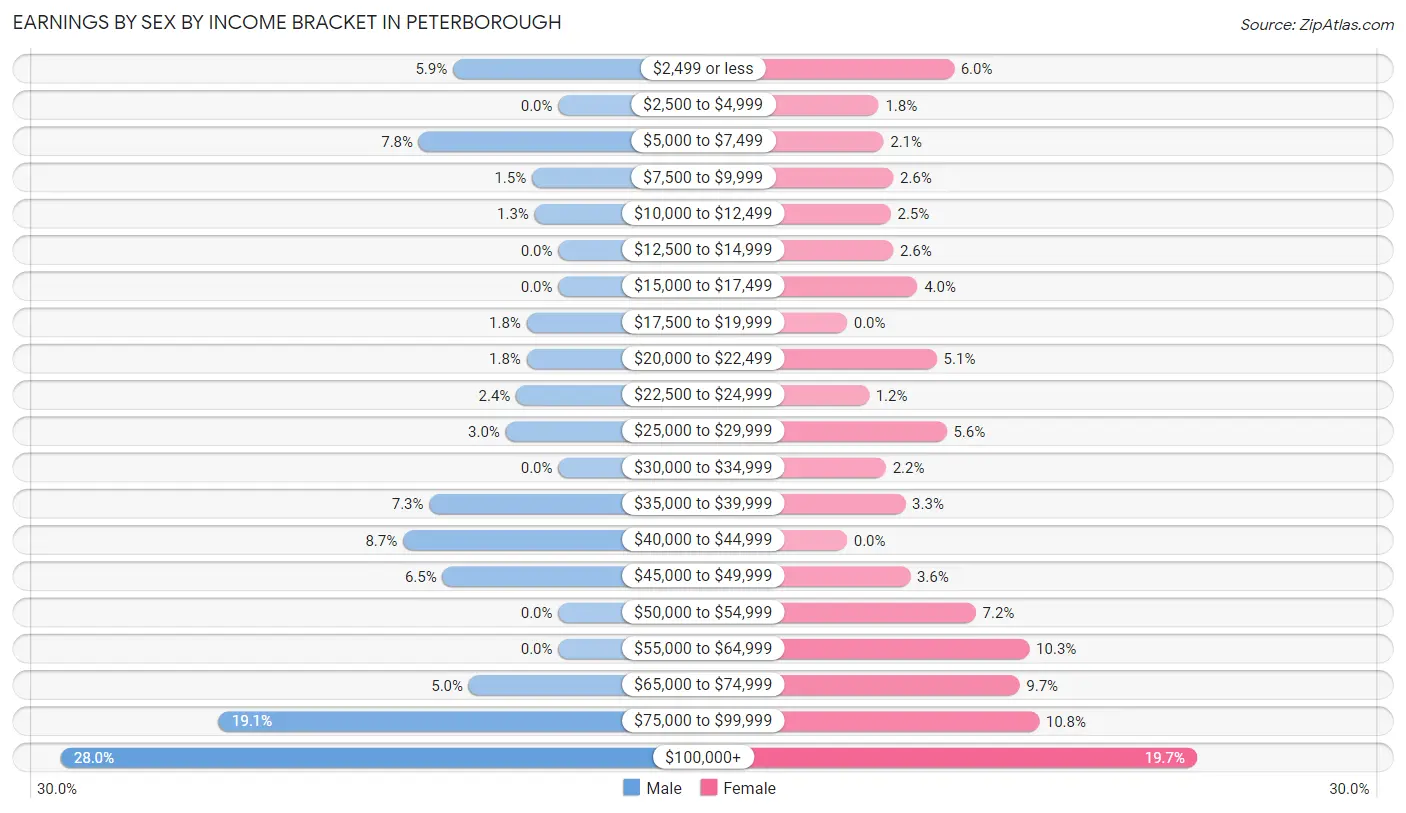
| Income | Male | Female |
| $2,499 or less | 40 (5.9%) | 44 (6.0%) |
| $2,500 to $4,999 | 0 (0.0%) | 13 (1.8%) |
| $5,000 to $7,499 | 53 (7.8%) | 15 (2.1%) |
| $7,500 to $9,999 | 10 (1.5%) | 19 (2.6%) |
| $10,000 to $12,499 | 9 (1.3%) | 18 (2.5%) |
| $12,500 to $14,999 | 0 (0.0%) | 19 (2.6%) |
| $15,000 to $17,499 | 0 (0.0%) | 29 (4.0%) |
| $17,500 to $19,999 | 12 (1.8%) | 0 (0.0%) |
| $20,000 to $22,499 | 12 (1.8%) | 37 (5.1%) |
| $22,500 to $24,999 | 16 (2.4%) | 9 (1.2%) |
| $25,000 to $29,999 | 20 (3.0%) | 41 (5.6%) |
| $30,000 to $34,999 | 0 (0.0%) | 16 (2.2%) |
| $35,000 to $39,999 | 49 (7.2%) | 24 (3.3%) |
| $40,000 to $44,999 | 59 (8.7%) | 0 (0.0%) |
| $45,000 to $49,999 | 44 (6.5%) | 26 (3.5%) |
| $50,000 to $54,999 | 0 (0.0%) | 53 (7.2%) |
| $55,000 to $64,999 | 0 (0.0%) | 75 (10.2%) |
| $65,000 to $74,999 | 34 (5.0%) | 71 (9.7%) |
| $75,000 to $99,999 | 129 (19.1%) | 79 (10.8%) |
| $100,000+ | 189 (28.0%) | 144 (19.7%) |
| Total | 676 (100.0%) | 732 (100.0%) |
Earnings by Sex by Educational Attainment in Peterborough
Average earnings in Peterborough are $71,641 for men and $56,653 for women, a difference of 20.9%. Men with an educational attainment of bachelor's degree enjoy the highest average annual earnings of $112,622, while those with college or associate's degree education earn the least with $45,101. Women with an educational attainment of graduate degree earn the most with the average annual earnings of $57,273, while those with bachelor's degree education have the smallest earnings of $51,477.
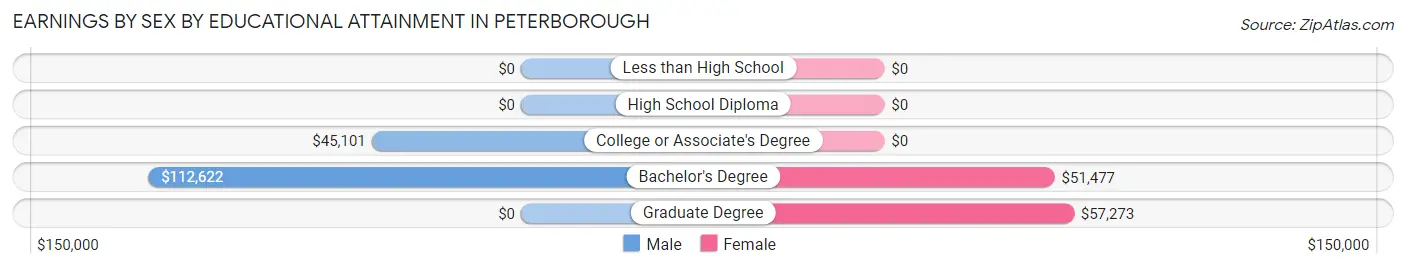
| Educational Attainment | Male Income | Female Income |
| Less than High School | - | - |
| High School Diploma | - | - |
| College or Associate's Degree | $45,101 | $0 |
| Bachelor's Degree | $112,622 | $51,477 |
| Graduate Degree | - | - |
| Total | $71,641 | $56,653 |
Family Income in Peterborough
Family Income Brackets in Peterborough
According to the Peterborough family income data, there are 169 families falling into the $200,000+ income range, which is the most common income bracket and makes up 27.0% of all families.
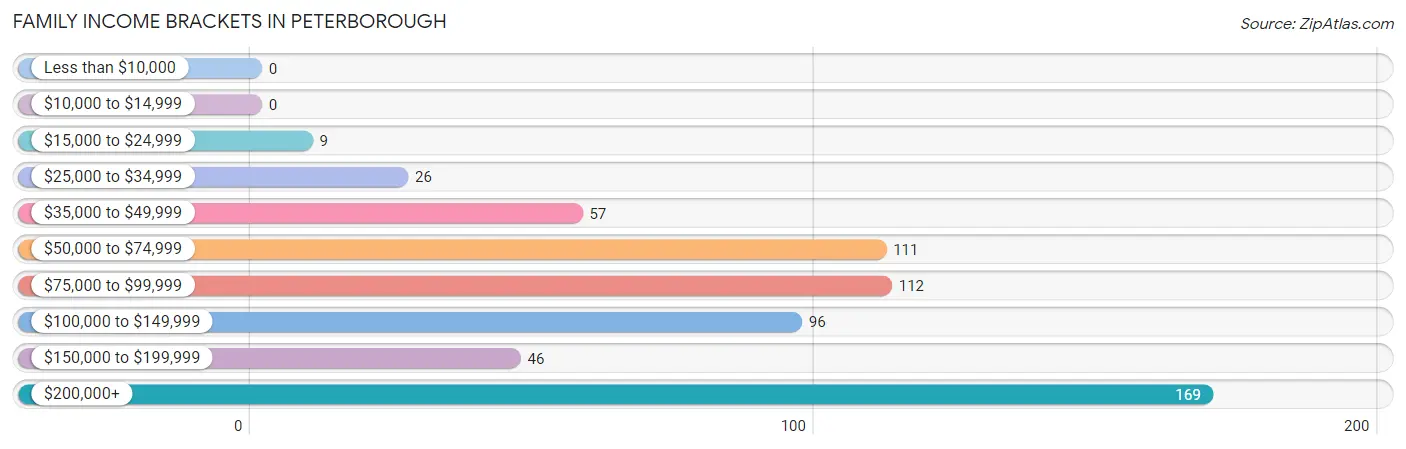
| Income Bracket | # Families | % Families |
| Less than $10,000 | 0 | 0.0% |
| $10,000 to $14,999 | 0 | 0.0% |
| $15,000 to $24,999 | 9 | 1.4% |
| $25,000 to $34,999 | 26 | 4.2% |
| $35,000 to $49,999 | 57 | 9.1% |
| $50,000 to $74,999 | 111 | 17.7% |
| $75,000 to $99,999 | 112 | 17.9% |
| $100,000 to $149,999 | 96 | 15.3% |
| $150,000 to $199,999 | 46 | 7.3% |
| $200,000+ | 169 | 27.0% |
Family Income by Famaliy Size in Peterborough
3-person families (74 | 11.8%) account for the highest median family income in Peterborough with $242,931 per family, while 3-person families (74 | 11.8%) have the highest median income of $80,977 per family member.
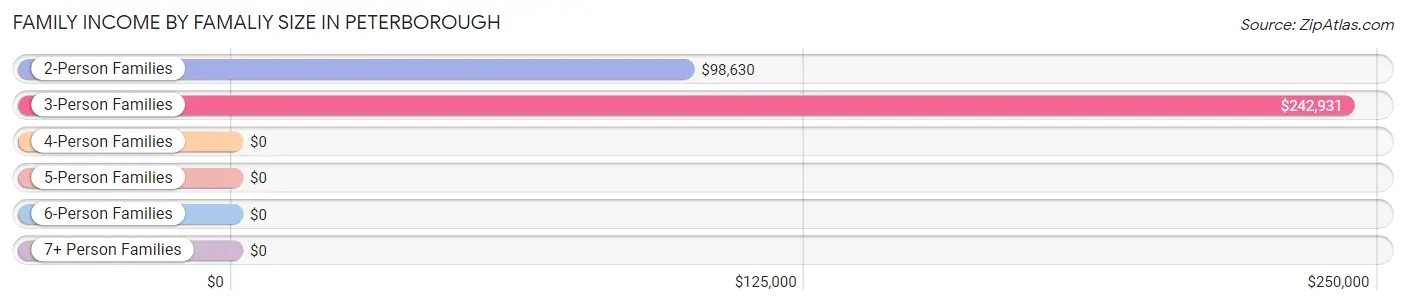
| Income Bracket | # Families | Median Income |
| 2-Person Families | 543 (86.7%) | $98,630 |
| 3-Person Families | 74 (11.8%) | $242,931 |
| 4-Person Families | 9 (1.4%) | $0 |
| 5-Person Families | 0 (0.0%) | $0 |
| 6-Person Families | 0 (0.0%) | $0 |
| 7+ Person Families | 0 (0.0%) | $0 |
| Total | 626 (100.0%) | $99,904 |
Family Income by Number of Earners in Peterborough
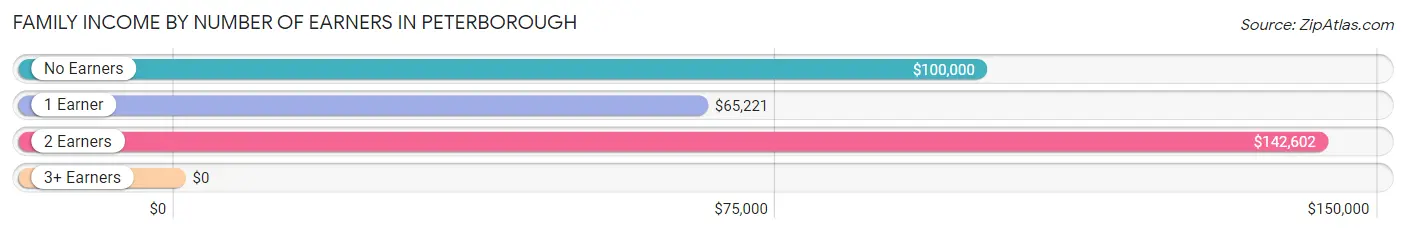
| Number of Earners | # Families | Median Income |
| No Earners | 132 (21.1%) | $100,000 |
| 1 Earner | 185 (29.5%) | $65,221 |
| 2 Earners | 292 (46.7%) | $142,602 |
| 3+ Earners | 17 (2.7%) | $0 |
| Total | 626 (100.0%) | $99,904 |
Household Income in Peterborough
Household Income Brackets in Peterborough
With 290 households falling in the category, the $200,000+ income range is the most frequent in Peterborough, accounting for 22.7% of all households. In contrast, only 19 households (1.5%) fall into the less than $10,000 income bracket, making it the least populous group.
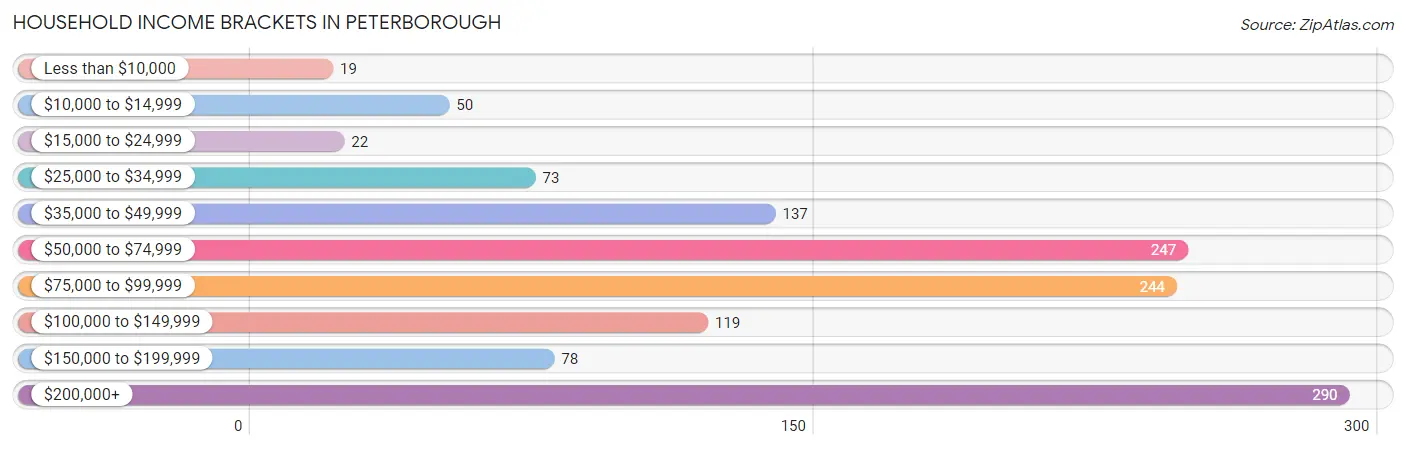
| Income Bracket | # Households | % Households |
| Less than $10,000 | 19 | 1.5% |
| $10,000 to $14,999 | 50 | 3.9% |
| $15,000 to $24,999 | 22 | 1.7% |
| $25,000 to $34,999 | 73 | 5.7% |
| $35,000 to $49,999 | 137 | 10.7% |
| $50,000 to $74,999 | 247 | 19.3% |
| $75,000 to $99,999 | 244 | 19.1% |
| $100,000 to $149,999 | 119 | 9.3% |
| $150,000 to $199,999 | 78 | 6.1% |
| $200,000+ | 290 | 22.7% |
Household Income by Householder Age in Peterborough
The median household income in Peterborough is $83,906, with the highest median household income of $103,000 found in the 45 to 64 years age bracket for the primary householder. A total of 496 households (38.8%) fall into this category.
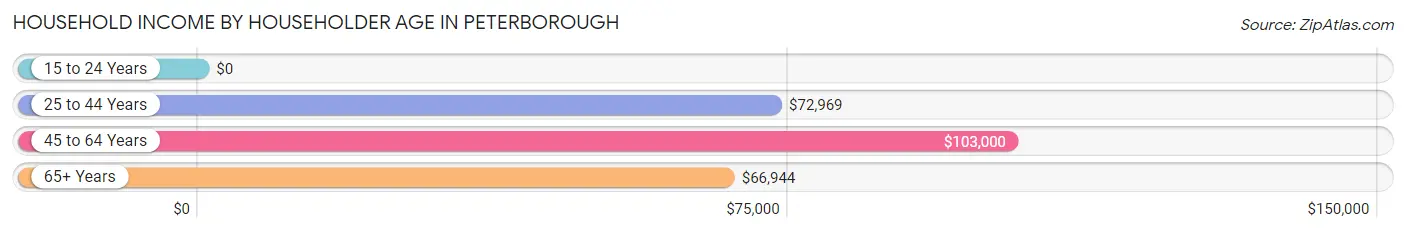
| Income Bracket | # Households | Median Income |
| 15 to 24 Years | 0 (0.0%) | $0 |
| 25 to 44 Years | 273 (21.3%) | $72,969 |
| 45 to 64 Years | 496 (38.8%) | $103,000 |
| 65+ Years | 510 (39.9%) | $66,944 |
| Total | 1,279 (100.0%) | $83,906 |
Poverty in Peterborough
Income Below Poverty by Sex and Age in Peterborough
With 5.7% poverty level for males and 7.0% for females among the residents of Peterborough, 25 to 34 year old males and 16 and 17 year old females are the most vulnerable to poverty, with 41 males (34.2%) and 10 females (100.0%) in their respective age groups living below the poverty level.
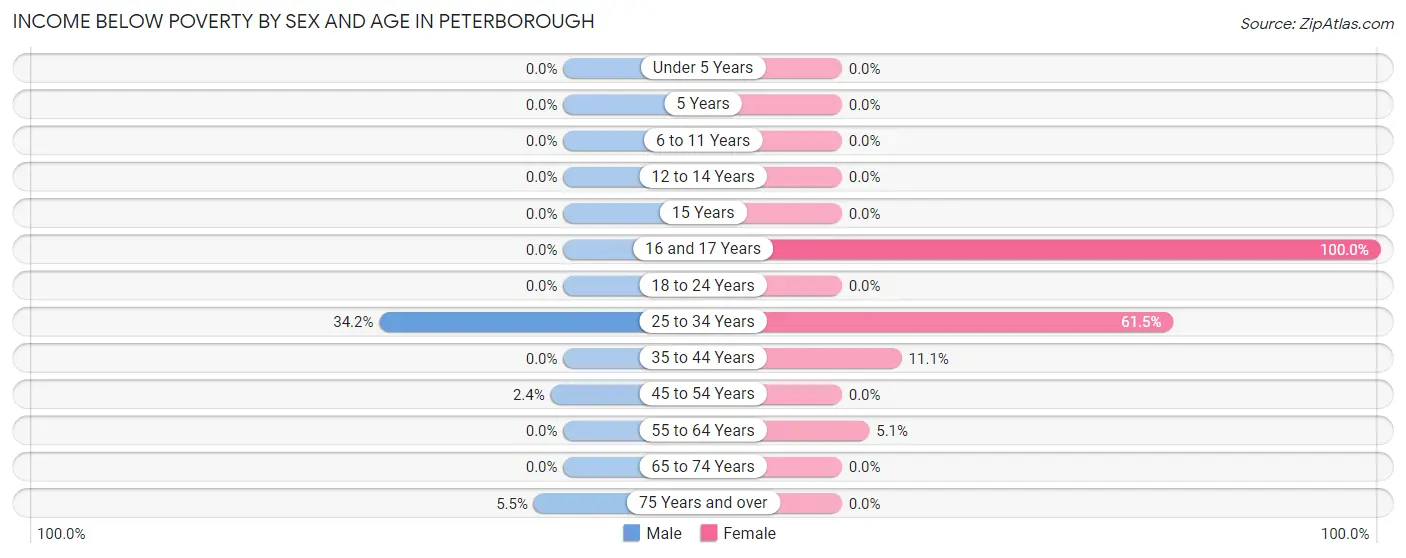
| Age Bracket | Male | Female |
| Under 5 Years | 0 (0.0%) | 0 (0.0%) |
| 5 Years | 0 (0.0%) | 0 (0.0%) |
| 6 to 11 Years | 0 (0.0%) | 0 (0.0%) |
| 12 to 14 Years | 0 (0.0%) | 0 (0.0%) |
| 15 Years | 0 (0.0%) | 0 (0.0%) |
| 16 and 17 Years | 0 (0.0%) | 10 (100.0%) |
| 18 to 24 Years | 0 (0.0%) | 0 (0.0%) |
| 25 to 34 Years | 41 (34.2%) | 40 (61.5%) |
| 35 to 44 Years | 0 (0.0%) | 19 (11.1%) |
| 45 to 54 Years | 4 (2.4%) | 0 (0.0%) |
| 55 to 64 Years | 0 (0.0%) | 15 (5.1%) |
| 65 to 74 Years | 0 (0.0%) | 0 (0.0%) |
| 75 Years and over | 9 (5.5%) | 0 (0.0%) |
| Total | 54 (5.7%) | 84 (7.0%) |
Income Above Poverty by Sex and Age in Peterborough
According to the poverty statistics in Peterborough, males aged 6 to 11 years and females aged 6 to 11 years are the age groups that are most secure financially, with 100.0% of males and 100.0% of females in these age groups living above the poverty line.
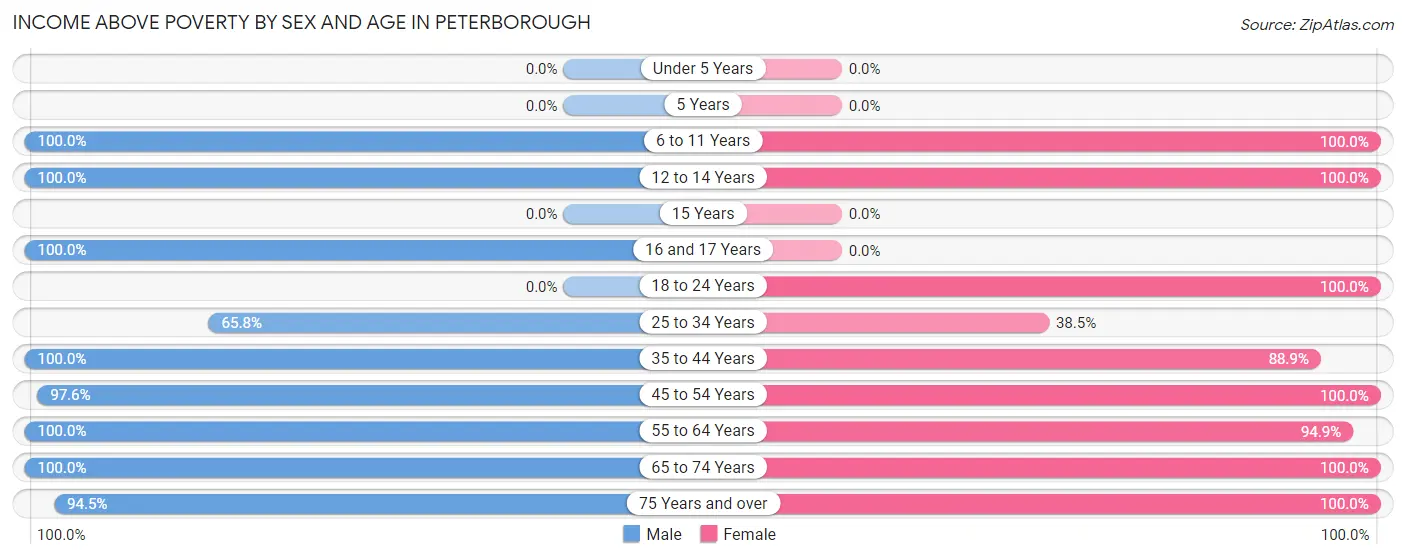
| Age Bracket | Male | Female |
| Under 5 Years | 0 (0.0%) | 0 (0.0%) |
| 5 Years | 0 (0.0%) | 0 (0.0%) |
| 6 to 11 Years | 11 (100.0%) | 7 (100.0%) |
| 12 to 14 Years | 9 (100.0%) | 44 (100.0%) |
| 15 Years | 0 (0.0%) | 0 (0.0%) |
| 16 and 17 Years | 9 (100.0%) | 0 (0.0%) |
| 18 to 24 Years | 0 (0.0%) | 62 (100.0%) |
| 25 to 34 Years | 79 (65.8%) | 25 (38.5%) |
| 35 to 44 Years | 53 (100.0%) | 152 (88.9%) |
| 45 to 54 Years | 165 (97.6%) | 154 (100.0%) |
| 55 to 64 Years | 149 (100.0%) | 279 (94.9%) |
| 65 to 74 Years | 268 (100.0%) | 189 (100.0%) |
| 75 Years and over | 155 (94.5%) | 208 (100.0%) |
| Total | 898 (94.3%) | 1,120 (93.0%) |
Income Below Poverty Among Married-Couple Families in Peterborough
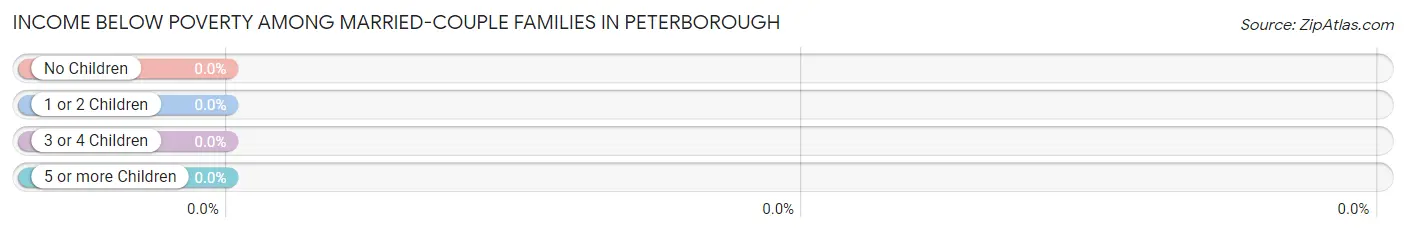
| Children | Above Poverty | Below Poverty |
| No Children | 510 (100.0%) | 0 (0.0%) |
| 1 or 2 Children | 37 (100.0%) | 0 (0.0%) |
| 3 or 4 Children | 0 (0.0%) | 0 (0.0%) |
| 5 or more Children | 0 (0.0%) | 0 (0.0%) |
| Total | 547 (100.0%) | 0 (0.0%) |
Income Below Poverty Among Single-Parent Households in Peterborough
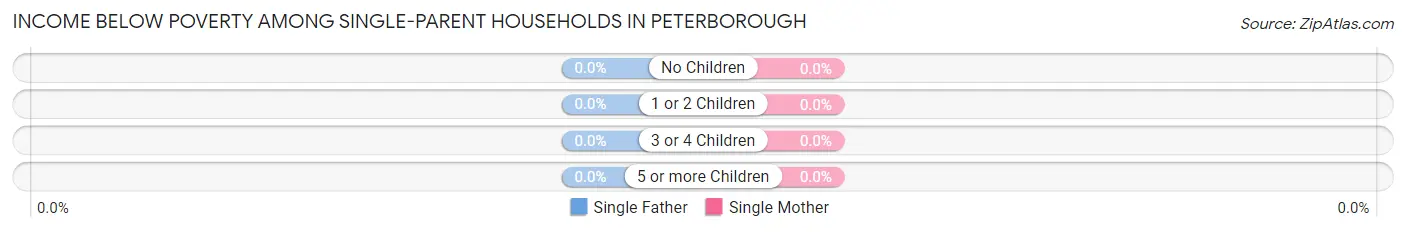
| Children | Single Father | Single Mother |
| No Children | 0 (0.0%) | 0 (0.0%) |
| 1 or 2 Children | 0 (0.0%) | 0 (0.0%) |
| 3 or 4 Children | 0 (0.0%) | 0 (0.0%) |
| 5 or more Children | 0 (0.0%) | 0 (0.0%) |
| Total | 0 (0.0%) | 0 (0.0%) |
Income Below Poverty Among Married-Couple vs Single-Parent Households in Peterborough
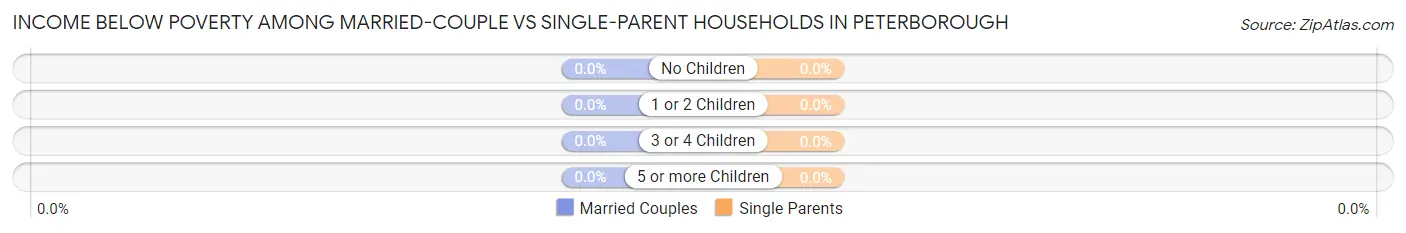
| Children | Married-Couple Families | Single-Parent Households |
| No Children | 0 (0.0%) | 0 (0.0%) |
| 1 or 2 Children | 0 (0.0%) | 0 (0.0%) |
| 3 or 4 Children | 0 (0.0%) | 0 (0.0%) |
| 5 or more Children | 0 (0.0%) | 0 (0.0%) |
| Total | 0 (0.0%) | 0 (0.0%) |
Race in Peterborough
The most populous races in Peterborough are White / Caucasian (2,097 | 93.3%), Hispanic or Latino (157 | 7.0%), and Some other Race (110 | 4.9%).
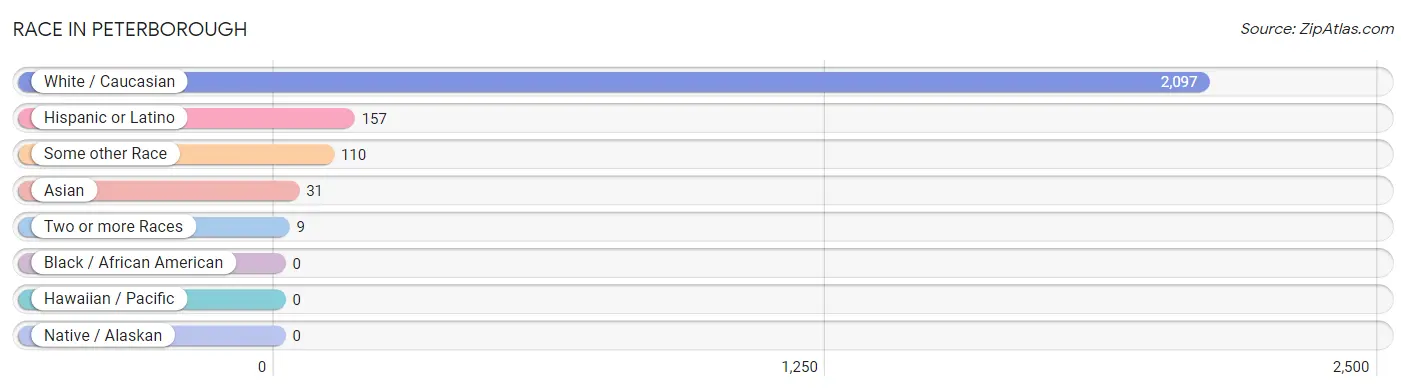
| Race | # Population | % Population |
| Asian | 31 | 1.4% |
| Black / African American | 0 | 0.0% |
| Hawaiian / Pacific | 0 | 0.0% |
| Hispanic or Latino | 157 | 7.0% |
| Native / Alaskan | 0 | 0.0% |
| White / Caucasian | 2,097 | 93.3% |
| Two or more Races | 9 | 0.4% |
| Some other Race | 110 | 4.9% |
| Total | 2,247 | 100.0% |
Ancestry in Peterborough
The most populous ancestries reported in Peterborough are English (673 | 29.9%), Irish (466 | 20.7%), German (344 | 15.3%), Italian (264 | 11.7%), and French Canadian (118 | 5.2%), together accounting for 83.0% of all Peterborough residents.
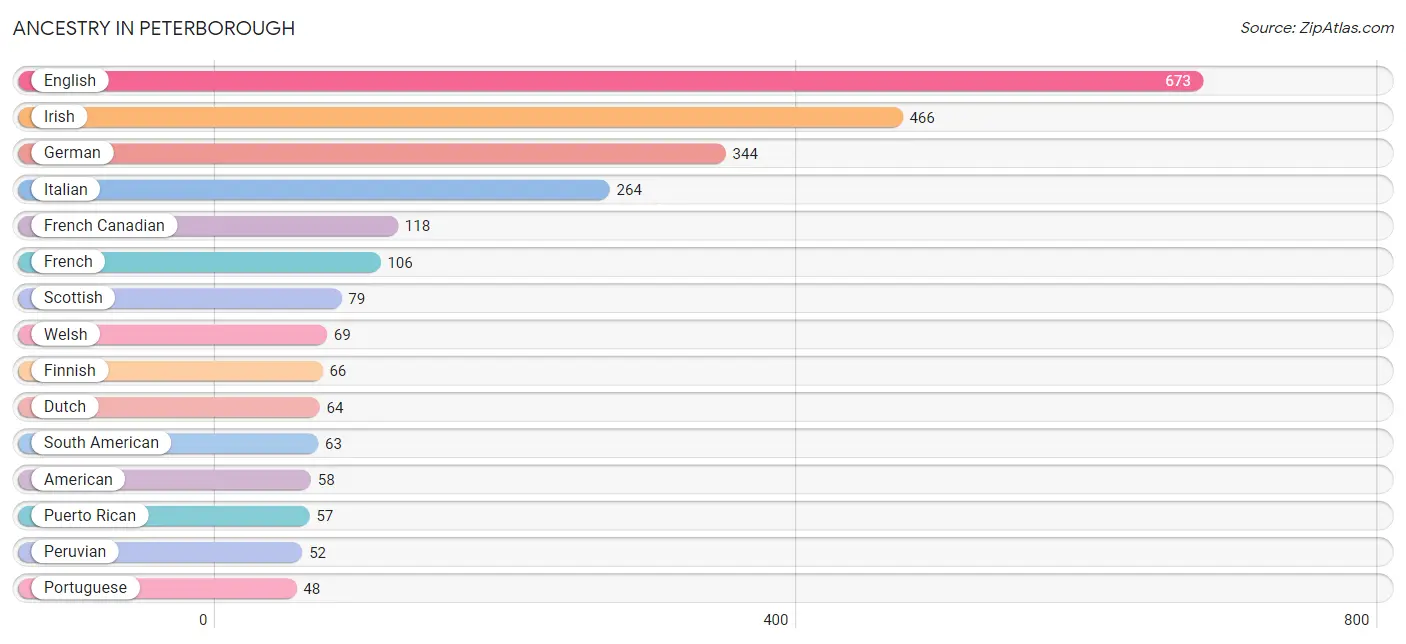
| Ancestry | # Population | % Population |
| American | 58 | 2.6% |
| British | 18 | 0.8% |
| Canadian | 26 | 1.2% |
| Danish | 18 | 0.8% |
| Dutch | 64 | 2.9% |
| Ecuadorian | 11 | 0.5% |
| English | 673 | 29.9% |
| European | 18 | 0.8% |
| Finnish | 66 | 2.9% |
| French | 106 | 4.7% |
| French American Indian | 9 | 0.4% |
| French Canadian | 118 | 5.2% |
| German | 344 | 15.3% |
| Greek | 12 | 0.5% |
| Irish | 466 | 20.7% |
| Italian | 264 | 11.7% |
| Lithuanian | 20 | 0.9% |
| Mexican | 37 | 1.7% |
| Northern European | 8 | 0.4% |
| Norwegian | 5 | 0.2% |
| Peruvian | 52 | 2.3% |
| Polish | 20 | 0.9% |
| Portuguese | 48 | 2.1% |
| Puerto Rican | 57 | 2.5% |
| Romanian | 8 | 0.4% |
| Russian | 9 | 0.4% |
| Scotch-Irish | 14 | 0.6% |
| Scottish | 79 | 3.5% |
| Slovak | 12 | 0.5% |
| South American | 63 | 2.8% |
| Sri Lankan | 31 | 1.4% |
| Swedish | 45 | 2.0% |
| Welsh | 69 | 3.1% | View All 33 Rows |
Immigrants in Peterborough
The most numerous immigrant groups reported in Peterborough came from Latin America (94 | 4.2%), South America (94 | 4.2%), Peru (52 | 2.3%), Colombia (31 | 1.4%), and Asia (18 | 0.8%), together accounting for 12.9% of all Peterborough residents.
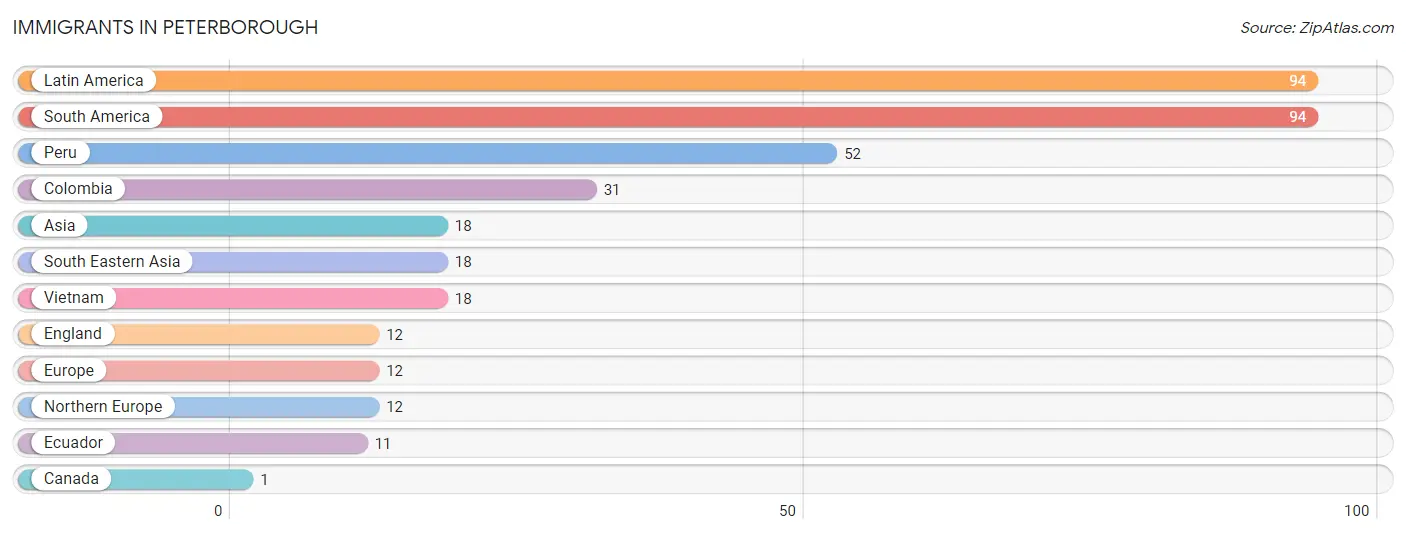
| Immigration Origin | # Population | % Population |
| Asia | 18 | 0.8% |
| Canada | 1 | 0.0% |
| Colombia | 31 | 1.4% |
| Ecuador | 11 | 0.5% |
| England | 12 | 0.5% |
| Europe | 12 | 0.5% |
| Latin America | 94 | 4.2% |
| Northern Europe | 12 | 0.5% |
| Peru | 52 | 2.3% |
| South America | 94 | 4.2% |
| South Eastern Asia | 18 | 0.8% |
| Vietnam | 18 | 0.8% | View All 12 Rows |
Sex and Age in Peterborough
Sex and Age in Peterborough
The most populous age groups in Peterborough are 65 to 69 Years (193 | 19.1%) for men and 60 to 64 Years (242 | 19.6%) for women.
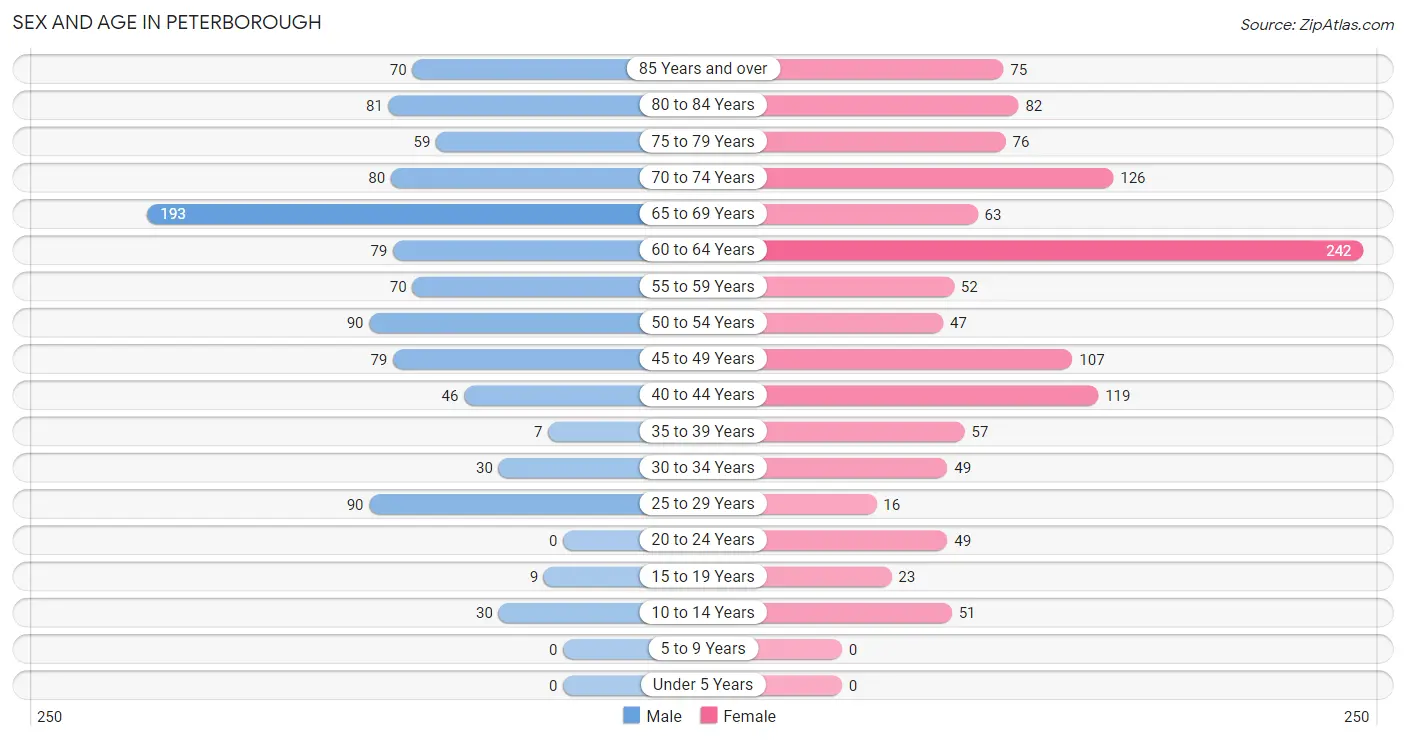
| Age Bracket | Male | Female |
| Under 5 Years | 0 (0.0%) | 0 (0.0%) |
| 5 to 9 Years | 0 (0.0%) | 0 (0.0%) |
| 10 to 14 Years | 30 (3.0%) | 51 (4.1%) |
| 15 to 19 Years | 9 (0.9%) | 23 (1.9%) |
| 20 to 24 Years | 0 (0.0%) | 49 (4.0%) |
| 25 to 29 Years | 90 (8.9%) | 16 (1.3%) |
| 30 to 34 Years | 30 (3.0%) | 49 (4.0%) |
| 35 to 39 Years | 7 (0.7%) | 57 (4.6%) |
| 40 to 44 Years | 46 (4.5%) | 119 (9.6%) |
| 45 to 49 Years | 79 (7.8%) | 107 (8.7%) |
| 50 to 54 Years | 90 (8.9%) | 47 (3.8%) |
| 55 to 59 Years | 70 (6.9%) | 52 (4.2%) |
| 60 to 64 Years | 79 (7.8%) | 242 (19.6%) |
| 65 to 69 Years | 193 (19.1%) | 63 (5.1%) |
| 70 to 74 Years | 80 (7.9%) | 126 (10.2%) |
| 75 to 79 Years | 59 (5.8%) | 76 (6.2%) |
| 80 to 84 Years | 81 (8.0%) | 82 (6.7%) |
| 85 Years and over | 70 (6.9%) | 75 (6.1%) |
| Total | 1,013 (100.0%) | 1,234 (100.0%) |
Families and Households in Peterborough
Median Family Size in Peterborough
The median family size in Peterborough is 2.22 persons per family, with single male/father families (16 | 2.6%) accounting for the largest median family size of 2.56 persons per family. On the other hand, married-couple families (547 | 87.4%) represent the smallest median family size with 2.18 persons per family.
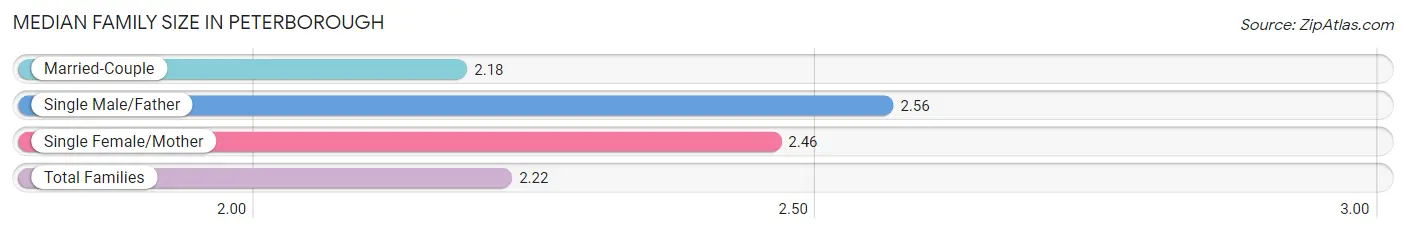
| Family Type | # Families | Family Size |
| Married-Couple | 547 (87.4%) | 2.18 |
| Single Male/Father | 16 (2.6%) | 2.56 |
| Single Female/Mother | 63 (10.1%) | 2.46 |
| Total Families | 626 (100.0%) | 2.22 |
Median Household Size in Peterborough
The median household size in Peterborough is 1.68 persons per household, with single female/mother households (63 | 4.9%) accounting for the largest median household size of 2.94 persons per household. non-family households (653 | 51.1%) represent the smallest median household size with 1.11 persons per household.
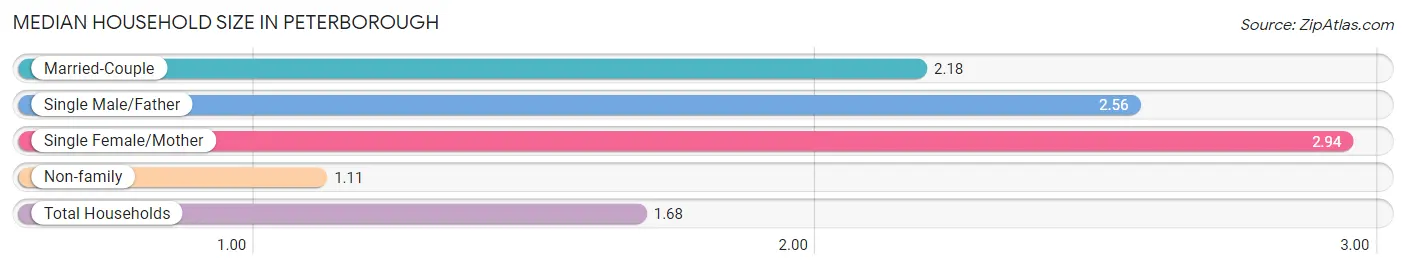
| Household Type | # Households | Household Size |
| Married-Couple | 547 (42.8%) | 2.18 |
| Single Male/Father | 16 (1.3%) | 2.56 |
| Single Female/Mother | 63 (4.9%) | 2.94 |
| Non-family | 653 (51.1%) | 1.11 |
| Total Households | 1,279 (100.0%) | 1.68 |
Household Size by Marriage Status in Peterborough
Out of a total of 1,279 households in Peterborough, 626 (48.9%) are family households, while 653 (51.1%) are nonfamily households. The most numerous type of family households are 2-person households, comprising 543, and the most common type of nonfamily households are 1-person households, comprising 579.
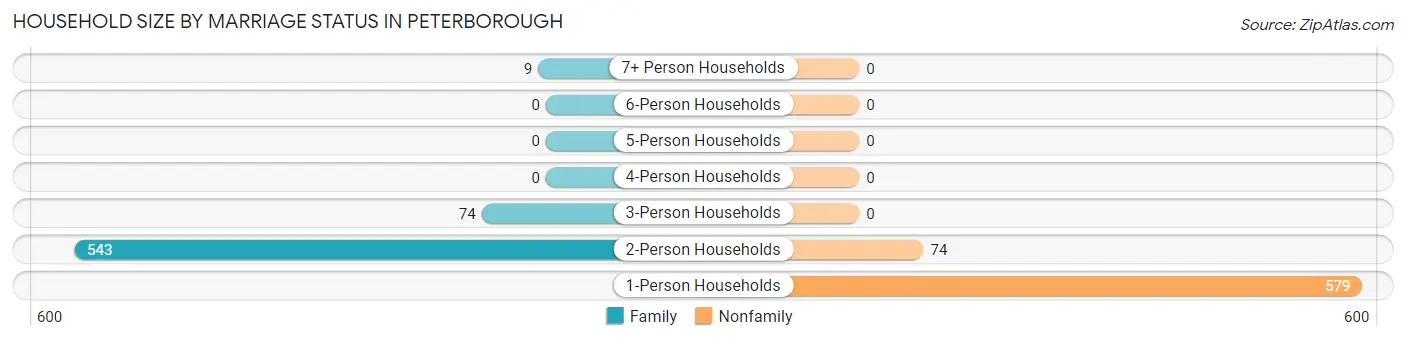
| Household Size | Family Households | Nonfamily Households |
| 1-Person Households | - | 579 (45.3%) |
| 2-Person Households | 543 (42.5%) | 74 (5.8%) |
| 3-Person Households | 74 (5.8%) | 0 (0.0%) |
| 4-Person Households | 0 (0.0%) | 0 (0.0%) |
| 5-Person Households | 0 (0.0%) | 0 (0.0%) |
| 6-Person Households | 0 (0.0%) | 0 (0.0%) |
| 7+ Person Households | 9 (0.7%) | 0 (0.0%) |
| Total | 626 (48.9%) | 653 (51.1%) |
Female Fertility in Peterborough
Fertility by Age in Peterborough
| Age Bracket | Women with Births | Births / 1,000 Women |
| 15 to 19 years | 0 (0.0%) | 0.0 |
| 20 to 34 years | 0 (0.0%) | 0.0 |
| 35 to 50 years | 0 (0.0%) | 0.0 |
| Total | 0 (0.0%) | 0.0 |
Fertility by Age by Marriage Status in Peterborough
| Age Bracket | Married | Unmarried |
| 15 to 19 years | 0 (0.0%) | 0 (0.0%) |
| 20 to 34 years | 0 (0.0%) | 0 (0.0%) |
| 35 to 50 years | 0 (0.0%) | 0 (0.0%) |
| Total | 0 (0.0%) | 0 (0.0%) |
Fertility by Education in Peterborough
| Educational Attainment | Women with Births | Births / 1,000 Women |
| Less than High School | 0 (0.0%) | 0.0 |
| High School Diploma | 0 (0.0%) | 0.0 |
| College or Associate's Degree | 0 (0.0%) | 0.0 |
| Bachelor's Degree | 0 (0.0%) | 0.0 |
| Graduate Degree | 0 (0.0%) | 0.0 |
| Total | 0 (0.0%) | 0.0 |
Fertility by Education by Marriage Status in Peterborough
| Educational Attainment | Married | Unmarried |
| Less than High School | 0 (0.0%) | 0 (0.0%) |
| High School Diploma | 0 (0.0%) | 0 (0.0%) |
| College or Associate's Degree | 0 (0.0%) | 0 (0.0%) |
| Bachelor's Degree | 0 (0.0%) | 0 (0.0%) |
| Graduate Degree | 0 (0.0%) | 0 (0.0%) |
| Total | 0 (0.0%) | 0 (0.0%) |
Employment Characteristics in Peterborough
Employment by Class of Employer in Peterborough
Among the 1,297 employed individuals in Peterborough, private company employees (523 | 40.3%), not-for-profit organizations (228 | 17.6%), and self-employed (not incorporated) (211 | 16.3%) make up the most common classes of employment.
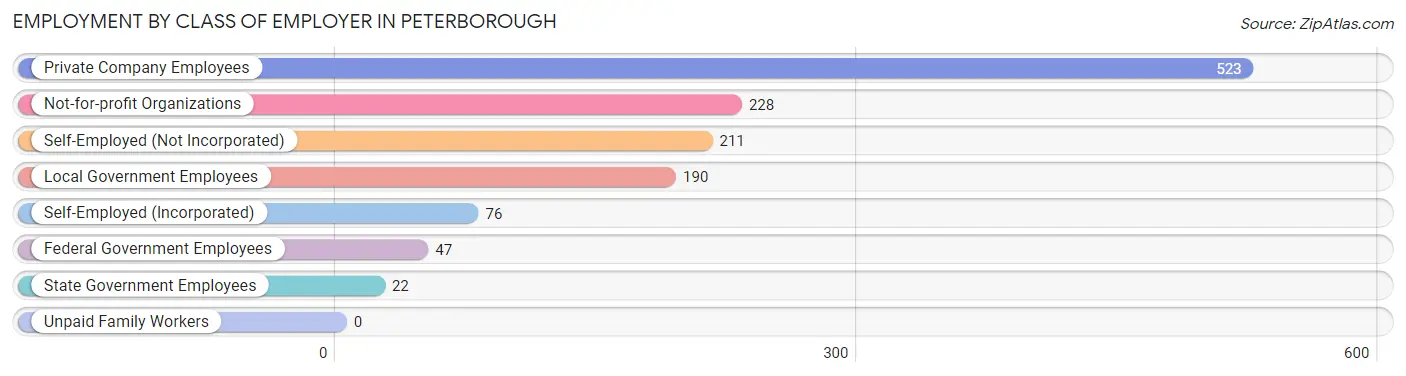
| Employer Class | # Employees | % Employees |
| Private Company Employees | 523 | 40.3% |
| Self-Employed (Incorporated) | 76 | 5.9% |
| Self-Employed (Not Incorporated) | 211 | 16.3% |
| Not-for-profit Organizations | 228 | 17.6% |
| Local Government Employees | 190 | 14.6% |
| State Government Employees | 22 | 1.7% |
| Federal Government Employees | 47 | 3.6% |
| Unpaid Family Workers | 0 | 0.0% |
| Total | 1,297 | 100.0% |
Employment Status by Age in Peterborough
According to the labor force statistics for Peterborough, out of the total population over 16 years of age (2,166), 62.7% or 1,358 individuals are in the labor force, with 2.9% or 39 of them unemployed. The age group with the highest labor force participation rate is 20 to 24 years, with 100.0% or 49 individuals in the labor force. Within the labor force, the 30 to 34 years age range has the highest percentage of unemployed individuals, with 50.6% or 40 of them being unemployed.
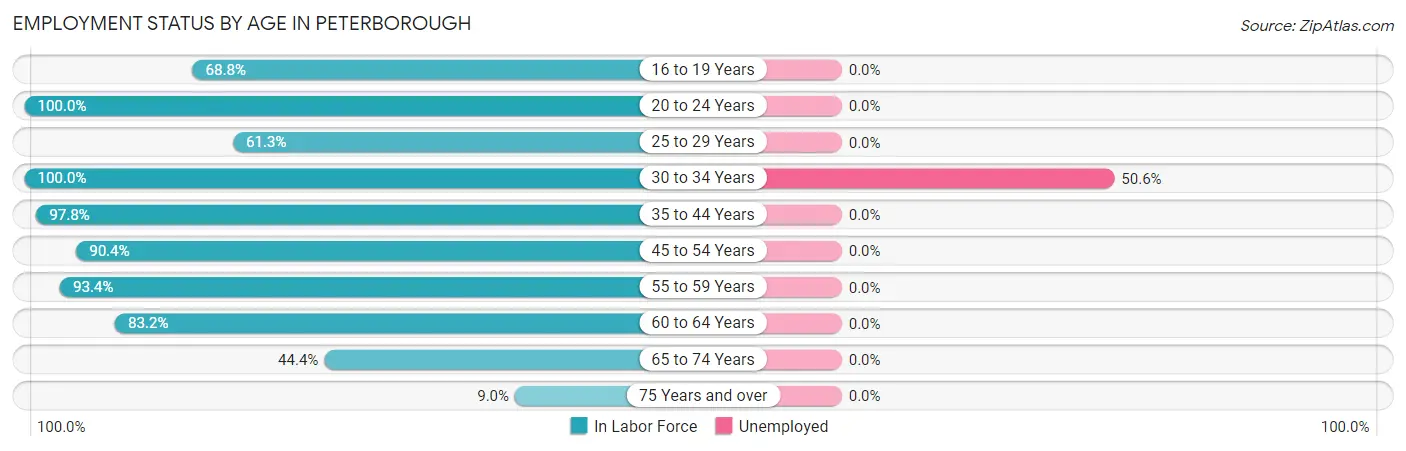
| Age Bracket | In Labor Force | Unemployed |
| 16 to 19 Years | 22 (68.8%) | 0 (0.0%) |
| 20 to 24 Years | 49 (100.0%) | 0 (0.0%) |
| 25 to 29 Years | 65 (61.3%) | 0 (0.0%) |
| 30 to 34 Years | 79 (100.0%) | 40 (50.6%) |
| 35 to 44 Years | 224 (97.8%) | 0 (0.0%) |
| 45 to 54 Years | 292 (90.4%) | 0 (0.0%) |
| 55 to 59 Years | 114 (93.4%) | 0 (0.0%) |
| 60 to 64 Years | 267 (83.2%) | 0 (0.0%) |
| 65 to 74 Years | 205 (44.4%) | 0 (0.0%) |
| 75 Years and over | 40 (9.0%) | 0 (0.0%) |
| Total | 1,358 (62.7%) | 39 (2.9%) |
Employment Status by Educational Attainment in Peterborough
According to labor force statistics for Peterborough, 88.2% of individuals (1,041) out of the total population between 25 and 64 years of age (1,180) are in the labor force, with 3.8% or 40 of them being unemployed. The group with the highest labor force participation rate are those with the educational attainment of bachelor's degree or higher, with 93.4% or 465 individuals in the labor force. Within the labor force, individuals with less than high school education have the highest percentage of unemployment, with 100.0% or 40 of them being unemployed.
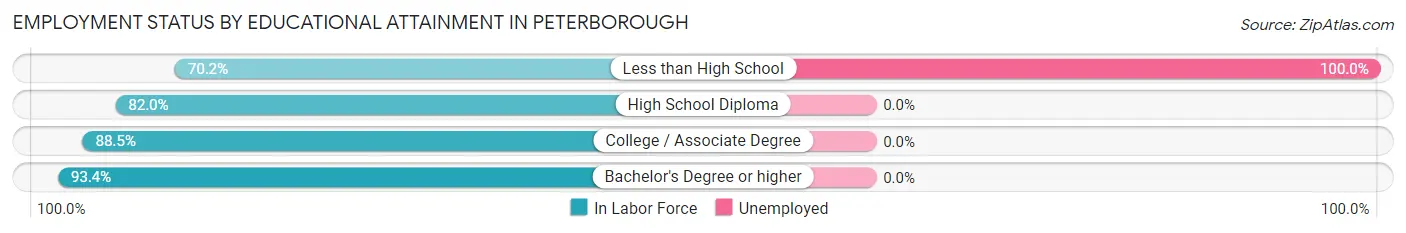
| Educational Attainment | In Labor Force | Unemployed |
| Less than High School | 40 (70.2%) | 57 (100.0%) |
| High School Diploma | 219 (82.0%) | 0 (0.0%) |
| College / Associate Degree | 317 (88.5%) | 0 (0.0%) |
| Bachelor's Degree or higher | 465 (93.4%) | 0 (0.0%) |
| Total | 1,041 (88.2%) | 45 (3.8%) |
Employment Occupations by Sex in Peterborough
Management, Business, Science and Arts Occupations
The most common Management, Business, Science and Arts occupations in Peterborough are Community & Social Service (209 | 15.9%), Education Instruction & Library (140 | 10.6%), Health Diagnosing & Treating (120 | 9.1%), Health Technologists (120 | 9.1%), and Management (111 | 8.4%).
Management, Business, Science and Arts Occupations by Sex
Within the Management, Business, Science and Arts occupations in Peterborough, the most male-oriented occupations are Computers & Mathematics (100.0%), Life, Physical & Social Science (100.0%), and Computers, Engineering & Science (84.6%), while the most female-oriented occupations are Business & Financial (100.0%), Education, Arts & Media (100.0%), and Management (83.8%).
| Occupation | Male | Female |
| Management | 18 (16.2%) | 93 (83.8%) |
| Business & Financial | 0 (0.0%) | 32 (100.0%) |
| Computers, Engineering & Science | 77 (84.6%) | 14 (15.4%) |
| Computers & Mathematics | 10 (100.0%) | 0 (0.0%) |
| Architecture & Engineering | 49 (77.8%) | 14 (22.2%) |
| Life, Physical & Social Science | 18 (100.0%) | 0 (0.0%) |
| Community & Social Service | 103 (49.3%) | 106 (50.7%) |
| Education, Arts & Media | 0 (0.0%) | 9 (100.0%) |
| Legal Services & Support | 23 (67.6%) | 11 (32.4%) |
| Education Instruction & Library | 66 (47.1%) | 74 (52.9%) |
| Arts, Media & Entertainment | 14 (53.8%) | 12 (46.2%) |
| Health Diagnosing & Treating | 78 (65.0%) | 42 (35.0%) |
| Health Technologists | 78 (65.0%) | 42 (35.0%) |
| Total (Category) | 276 (49.0%) | 287 (51.0%) |
| Total (Overall) | 608 (46.2%) | 709 (53.8%) |
Services Occupations
The most common Services occupations in Peterborough are Security & Protection (44 | 3.3%), Firefighting & Prevention (44 | 3.3%), Personal Care & Service (19 | 1.4%), Food Preparation & Serving (16 | 1.2%), and Cleaning & Maintenance (11 | 0.8%).
Services Occupations by Sex
| Occupation | Male | Female |
| Healthcare Support | 0 (0.0%) | 0 (0.0%) |
| Security & Protection | 0 (0.0%) | 44 (100.0%) |
| Firefighting & Prevention | 0 (0.0%) | 44 (100.0%) |
| Law Enforcement | 0 (0.0%) | 0 (0.0%) |
| Food Preparation & Serving | 0 (0.0%) | 16 (100.0%) |
| Cleaning & Maintenance | 11 (100.0%) | 0 (0.0%) |
| Personal Care & Service | 0 (0.0%) | 19 (100.0%) |
| Total (Category) | 11 (12.2%) | 79 (87.8%) |
| Total (Overall) | 608 (46.2%) | 709 (53.8%) |
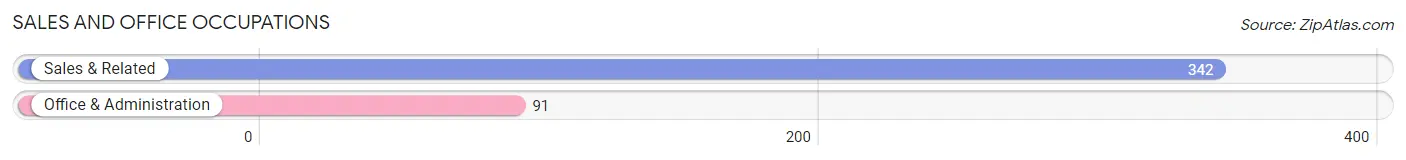
Sales and Office Occupations
The most common Sales and Office occupations in Peterborough are Sales & Related (342 | 26.0%), and Office & Administration (91 | 6.9%).
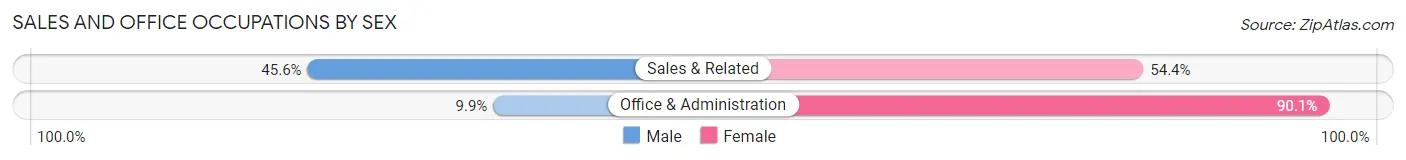
Sales and Office Occupations by Sex
| Occupation | Male | Female |
| Sales & Related | 156 (45.6%) | 186 (54.4%) |
| Office & Administration | 9 (9.9%) | 82 (90.1%) |
| Total (Category) | 165 (38.1%) | 268 (61.9%) |
| Total (Overall) | 608 (46.2%) | 709 (53.8%) |
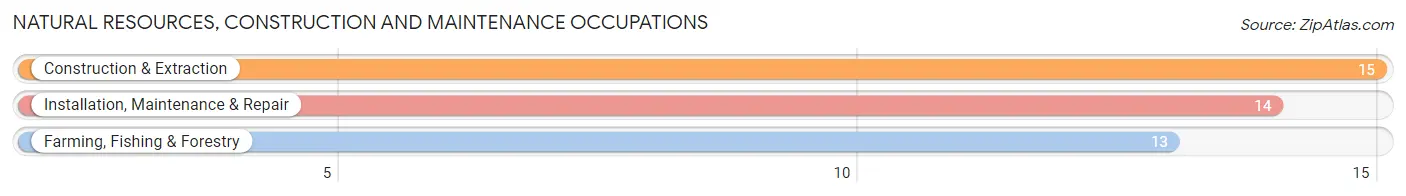
Natural Resources, Construction and Maintenance Occupations
The most common Natural Resources, Construction and Maintenance occupations in Peterborough are Construction & Extraction (15 | 1.1%), Installation, Maintenance & Repair (14 | 1.1%), and Farming, Fishing & Forestry (13 | 1.0%).
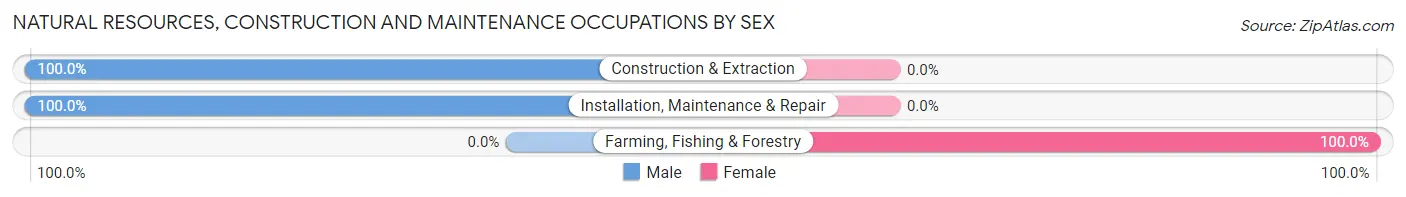
Natural Resources, Construction and Maintenance Occupations by Sex
| Occupation | Male | Female |
| Farming, Fishing & Forestry | 0 (0.0%) | 13 (100.0%) |
| Construction & Extraction | 15 (100.0%) | 0 (0.0%) |
| Installation, Maintenance & Repair | 14 (100.0%) | 0 (0.0%) |
| Total (Category) | 29 (69.1%) | 13 (30.9%) |
| Total (Overall) | 608 (46.2%) | 709 (53.8%) |
Production, Transportation and Moving Occupations
The most common Production, Transportation and Moving occupations in Peterborough are Material Moving (130 | 9.9%), Production (31 | 2.4%), and Transportation (28 | 2.1%).
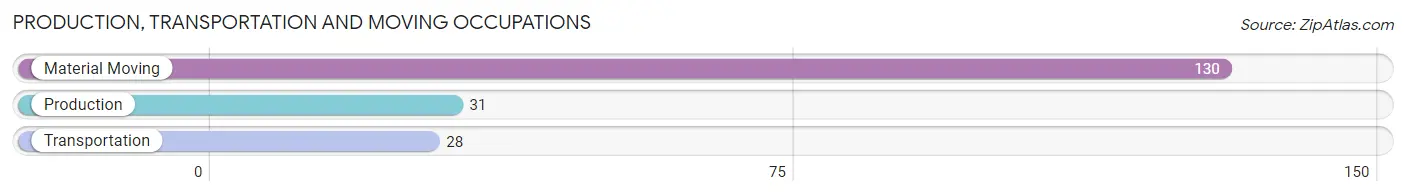
Production, Transportation and Moving Occupations by Sex
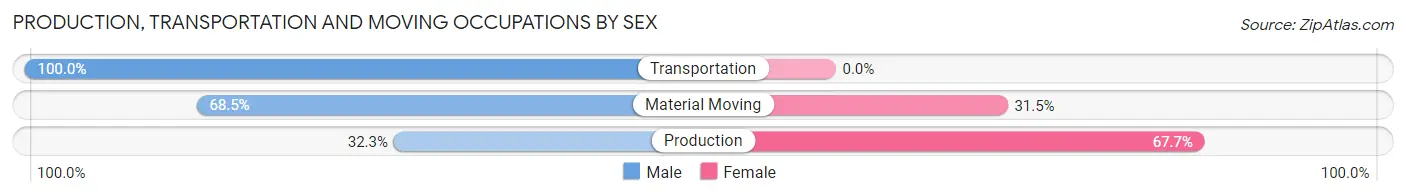
| Occupation | Male | Female |
| Production | 10 (32.3%) | 21 (67.7%) |
| Transportation | 28 (100.0%) | 0 (0.0%) |
| Material Moving | 89 (68.5%) | 41 (31.5%) |
| Total (Category) | 127 (67.2%) | 62 (32.8%) |
| Total (Overall) | 608 (46.2%) | 709 (53.8%) |
Employment Industries by Sex in Peterborough
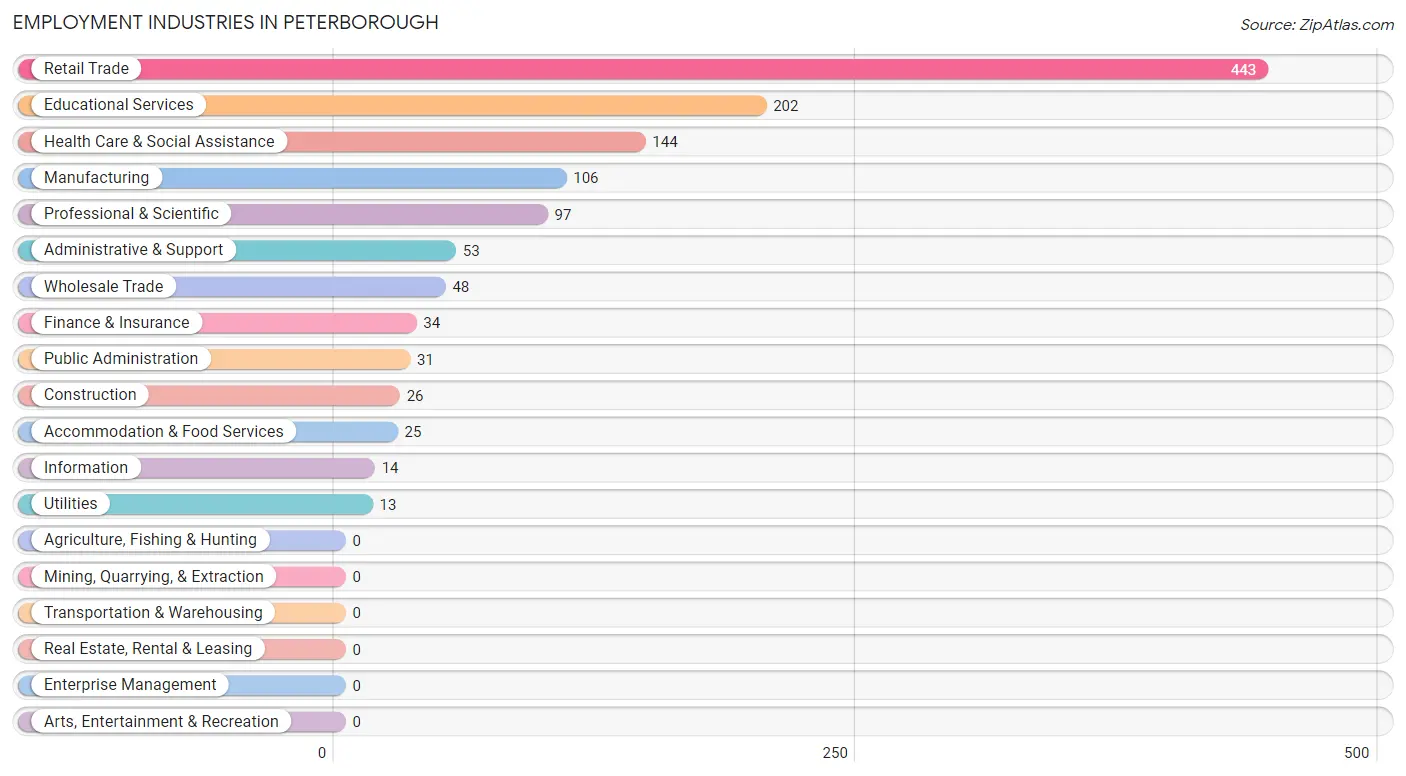
Employment Industries in Peterborough
The major employment industries in Peterborough include Retail Trade (443 | 33.6%), Educational Services (202 | 15.3%), Health Care & Social Assistance (144 | 10.9%), Manufacturing (106 | 8.1%), and Professional & Scientific (97 | 7.4%).
Employment Industries by Sex in Peterborough
The Peterborough industries that see more men than women are Construction (100.0%), Utilities (100.0%), and Information (100.0%), whereas the industries that tend to have a higher number of women are Wholesale Trade (100.0%), Accommodation & Food Services (100.0%), and Public Administration (100.0%).
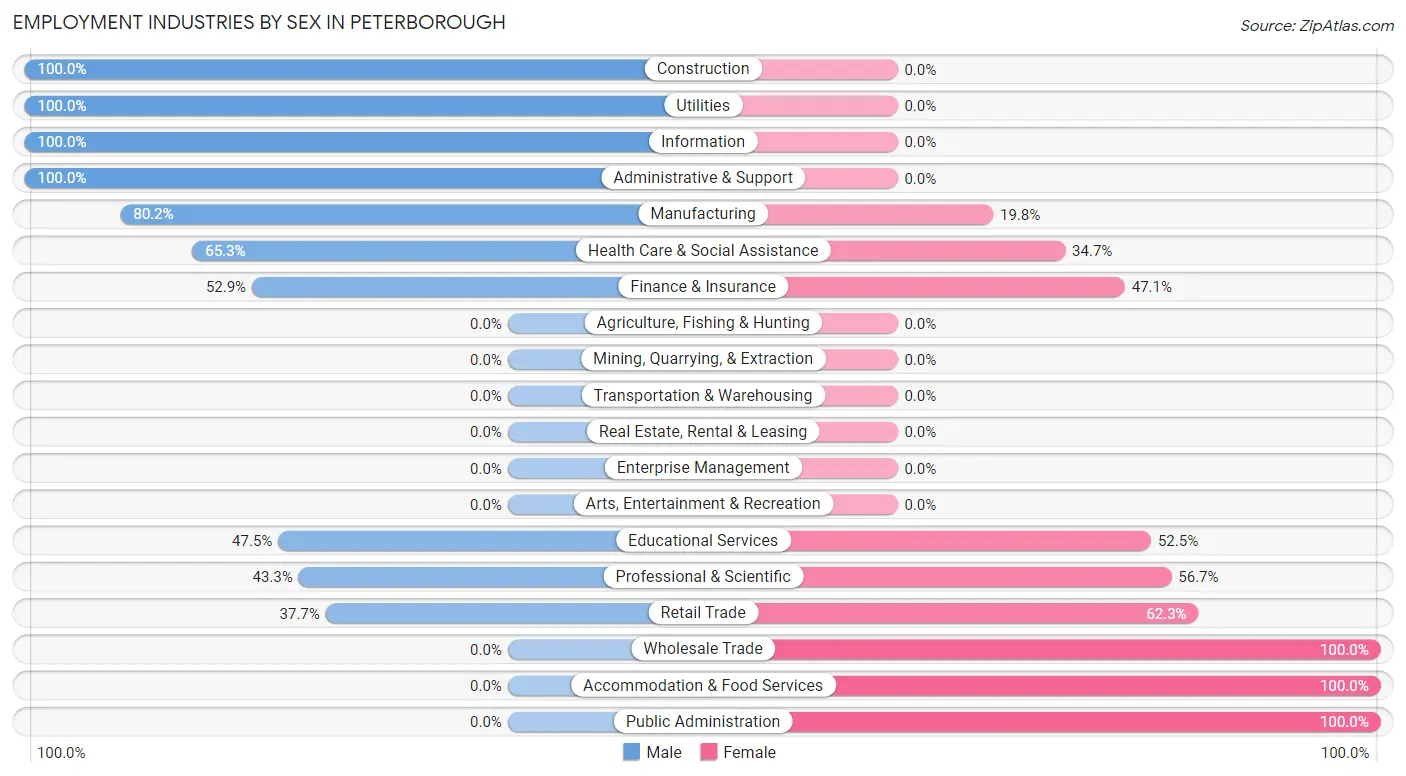
| Industry | Male | Female |
| Agriculture, Fishing & Hunting | 0 (0.0%) | 0 (0.0%) |
| Mining, Quarrying, & Extraction | 0 (0.0%) | 0 (0.0%) |
| Construction | 26 (100.0%) | 0 (0.0%) |
| Manufacturing | 85 (80.2%) | 21 (19.8%) |
| Wholesale Trade | 0 (0.0%) | 48 (100.0%) |
| Retail Trade | 167 (37.7%) | 276 (62.3%) |
| Transportation & Warehousing | 0 (0.0%) | 0 (0.0%) |
| Utilities | 13 (100.0%) | 0 (0.0%) |
| Information | 14 (100.0%) | 0 (0.0%) |
| Finance & Insurance | 18 (52.9%) | 16 (47.1%) |
| Real Estate, Rental & Leasing | 0 (0.0%) | 0 (0.0%) |
| Professional & Scientific | 42 (43.3%) | 55 (56.7%) |
| Enterprise Management | 0 (0.0%) | 0 (0.0%) |
| Administrative & Support | 53 (100.0%) | 0 (0.0%) |
| Educational Services | 96 (47.5%) | 106 (52.5%) |
| Health Care & Social Assistance | 94 (65.3%) | 50 (34.7%) |
| Arts, Entertainment & Recreation | 0 (0.0%) | 0 (0.0%) |
| Accommodation & Food Services | 0 (0.0%) | 25 (100.0%) |
| Public Administration | 0 (0.0%) | 31 (100.0%) |
| Total | 608 (46.2%) | 709 (53.8%) |
Education in Peterborough
School Enrollment in Peterborough
The most common levels of schooling among the 181 students in Peterborough are middle school (53 | 29.3%), high school (47 | 26.0%), and college / undergraduate (43 | 23.8%).
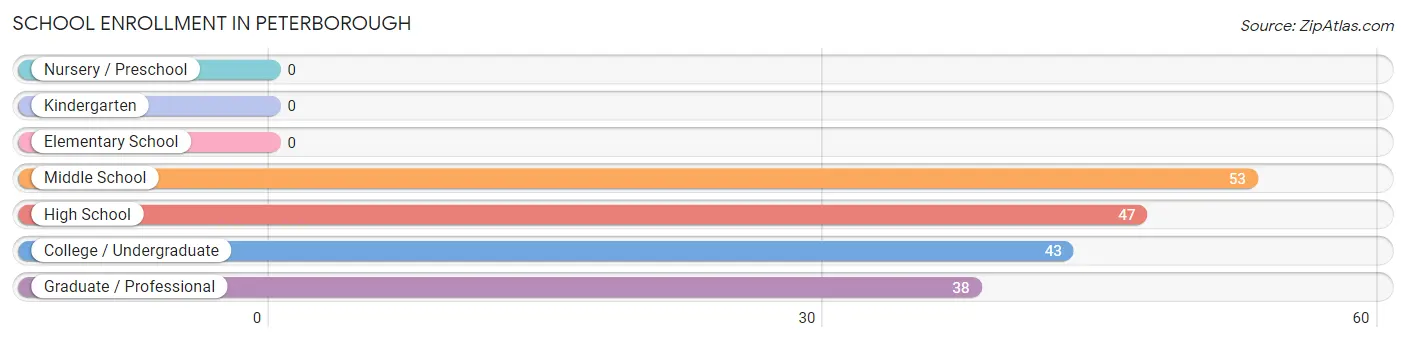
| School Level | # Students | % Students |
| Nursery / Preschool | 0 | 0.0% |
| Kindergarten | 0 | 0.0% |
| Elementary School | 0 | 0.0% |
| Middle School | 53 | 29.3% |
| High School | 47 | 26.0% |
| College / Undergraduate | 43 | 23.8% |
| Graduate / Professional | 38 | 21.0% |
| Total | 181 | 100.0% |
School Enrollment by Age by Funding Source in Peterborough
Out of a total of 181 students who are enrolled in schools in Peterborough, 109 (60.2%) attend a private institution, while the remaining 72 (39.8%) are enrolled in public schools. The age group of 18 to 19 year olds has the highest likelihood of being enrolled in private schools, with 13 (100.0% in the age bracket) enrolled. Conversely, the age group of 15 to 17 year olds has the lowest likelihood of being enrolled in a private school, with 19 (100.0% in the age bracket) attending a public institution.
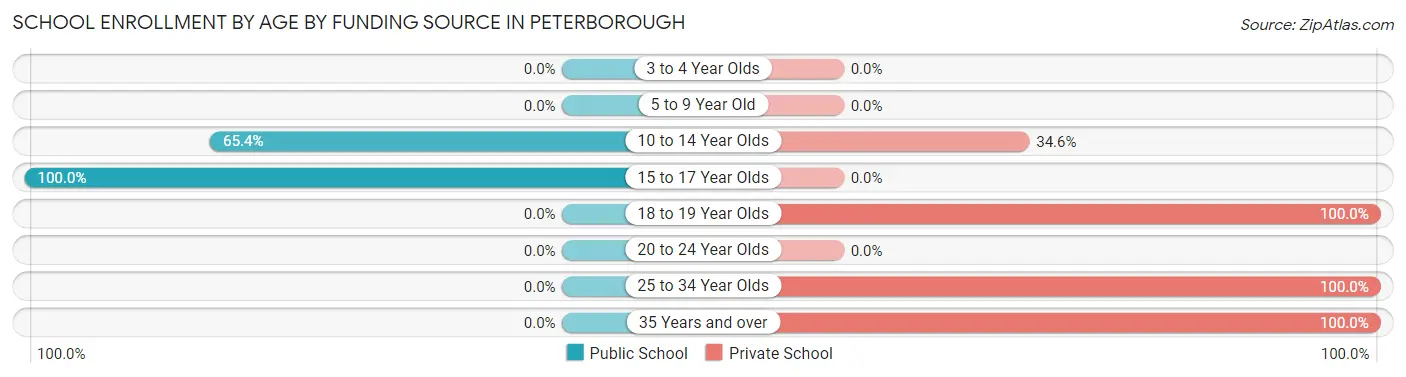
| Age Bracket | Public School | Private School |
| 3 to 4 Year Olds | 0 (0.0%) | 0 (0.0%) |
| 5 to 9 Year Old | 0 (0.0%) | 0 (0.0%) |
| 10 to 14 Year Olds | 53 (65.4%) | 28 (34.6%) |
| 15 to 17 Year Olds | 19 (100.0%) | 0 (0.0%) |
| 18 to 19 Year Olds | 0 (0.0%) | 13 (100.0%) |
| 20 to 24 Year Olds | 0 (0.0%) | 0 (0.0%) |
| 25 to 34 Year Olds | 0 (0.0%) | 34 (100.0%) |
| 35 Years and over | 0 (0.0%) | 34 (100.0%) |
| Total | 72 (39.8%) | 109 (60.2%) |
Educational Attainment by Field of Study in Peterborough
Business (186 | 17.5%), engineering (117 | 11.0%), liberal arts & history (100 | 9.4%), education (93 | 8.7%), and science & technology (90 | 8.5%) are the most common fields of study among 1,064 individuals in Peterborough who have obtained a bachelor's degree or higher.
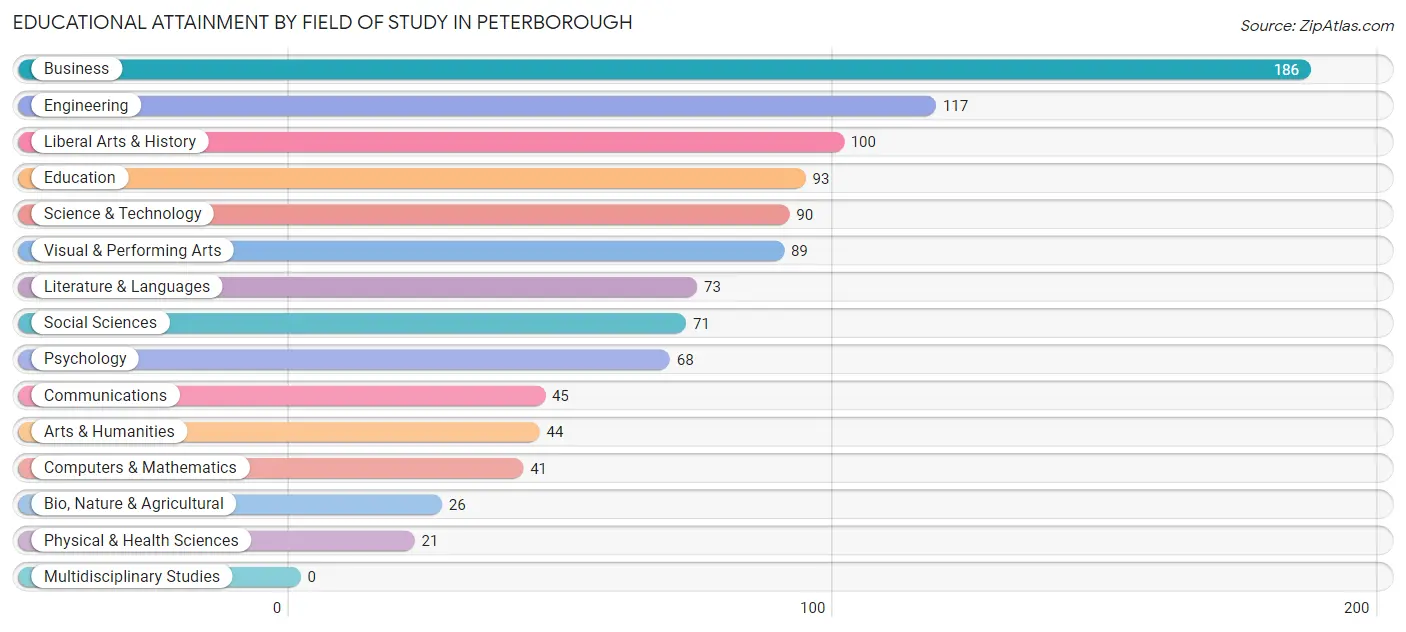
| Field of Study | # Graduates | % Graduates |
| Computers & Mathematics | 41 | 3.8% |
| Bio, Nature & Agricultural | 26 | 2.4% |
| Physical & Health Sciences | 21 | 2.0% |
| Psychology | 68 | 6.4% |
| Social Sciences | 71 | 6.7% |
| Engineering | 117 | 11.0% |
| Multidisciplinary Studies | 0 | 0.0% |
| Science & Technology | 90 | 8.5% |
| Business | 186 | 17.5% |
| Education | 93 | 8.7% |
| Literature & Languages | 73 | 6.9% |
| Liberal Arts & History | 100 | 9.4% |
| Visual & Performing Arts | 89 | 8.4% |
| Communications | 45 | 4.2% |
| Arts & Humanities | 44 | 4.1% |
| Total | 1,064 | 100.0% |
Transportation & Commute in Peterborough
Vehicle Availability by Sex in Peterborough
The most prevalent vehicle ownership categories in Peterborough are males with 2 vehicles (307, accounting for 51.3%) and females with 2 vehicles (282, making up 44.2%).
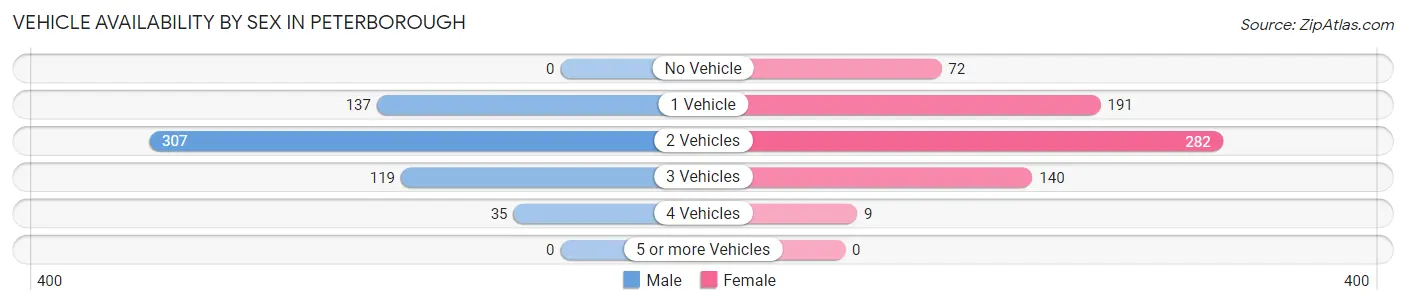
| Vehicles Available | Male | Female |
| No Vehicle | 0 (0.0%) | 72 (10.4%) |
| 1 Vehicle | 137 (22.9%) | 191 (27.5%) |
| 2 Vehicles | 307 (51.3%) | 282 (40.6%) |
| 3 Vehicles | 119 (19.9%) | 140 (20.2%) |
| 4 Vehicles | 35 (5.9%) | 9 (1.3%) |
| 5 or more Vehicles | 0 (0.0%) | 0 (0.0%) |
| Total | 598 (100.0%) | 694 (100.0%) |
Commute Time in Peterborough
The most frequently occuring commute durations in Peterborough are 20 to 24 minutes (243 commuters, 20.9%), 5 to 9 minutes (207 commuters, 17.8%), and 15 to 19 minutes (141 commuters, 12.2%).
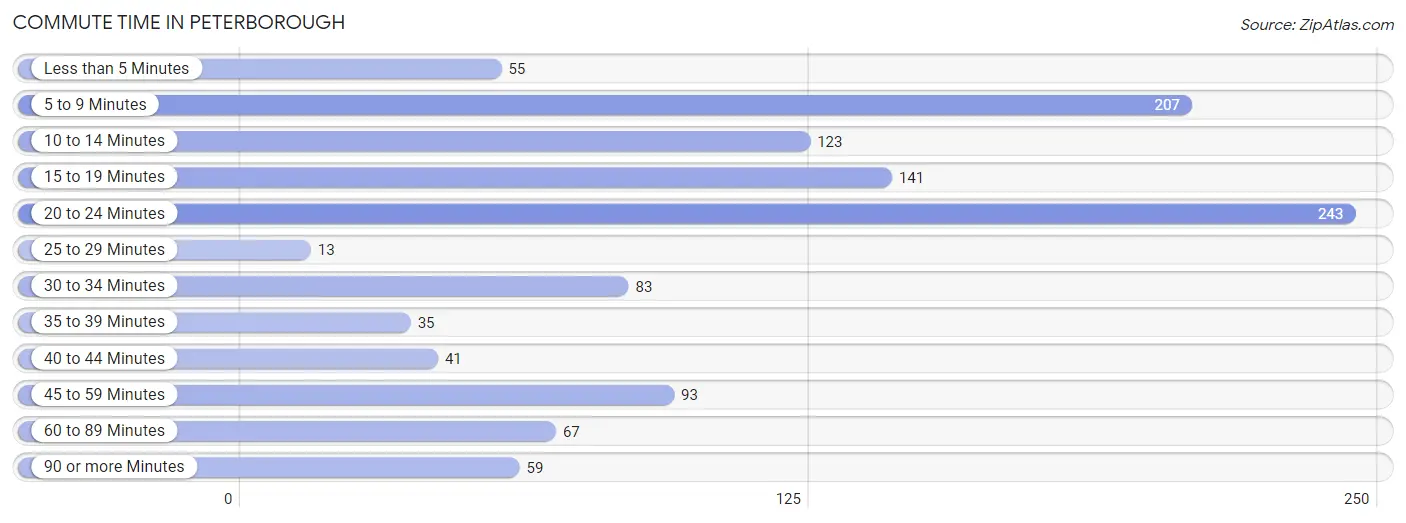
| Commute Time | # Commuters | % Commuters |
| Less than 5 Minutes | 55 | 4.7% |
| 5 to 9 Minutes | 207 | 17.8% |
| 10 to 14 Minutes | 123 | 10.6% |
| 15 to 19 Minutes | 141 | 12.2% |
| 20 to 24 Minutes | 243 | 20.9% |
| 25 to 29 Minutes | 13 | 1.1% |
| 30 to 34 Minutes | 83 | 7.2% |
| 35 to 39 Minutes | 35 | 3.0% |
| 40 to 44 Minutes | 41 | 3.5% |
| 45 to 59 Minutes | 93 | 8.0% |
| 60 to 89 Minutes | 67 | 5.8% |
| 90 or more Minutes | 59 | 5.1% |
Commute Time by Sex in Peterborough
The most common commute times in Peterborough are 5 to 9 minutes (133 commuters, 25.6%) for males and 20 to 24 minutes (243 commuters, 37.9%) for females.
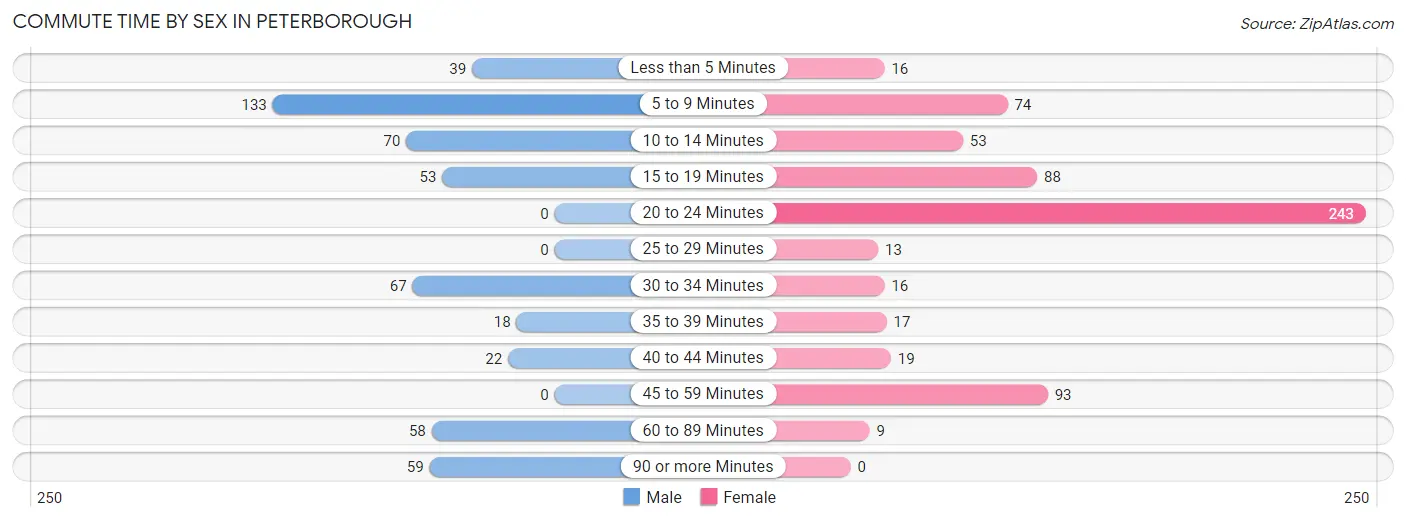
| Commute Time | Male | Female |
| Less than 5 Minutes | 39 (7.5%) | 16 (2.5%) |
| 5 to 9 Minutes | 133 (25.6%) | 74 (11.5%) |
| 10 to 14 Minutes | 70 (13.5%) | 53 (8.3%) |
| 15 to 19 Minutes | 53 (10.2%) | 88 (13.7%) |
| 20 to 24 Minutes | 0 (0.0%) | 243 (37.9%) |
| 25 to 29 Minutes | 0 (0.0%) | 13 (2.0%) |
| 30 to 34 Minutes | 67 (12.9%) | 16 (2.5%) |
| 35 to 39 Minutes | 18 (3.5%) | 17 (2.6%) |
| 40 to 44 Minutes | 22 (4.2%) | 19 (3.0%) |
| 45 to 59 Minutes | 0 (0.0%) | 93 (14.5%) |
| 60 to 89 Minutes | 58 (11.2%) | 9 (1.4%) |
| 90 or more Minutes | 59 (11.4%) | 0 (0.0%) |
Time of Departure to Work by Sex in Peterborough
The most frequent times of departure to work in Peterborough are 7:30 AM to 7:59 AM (144, 27.8%) for males and 9:00 AM to 9:59 AM (136, 21.2%) for females.
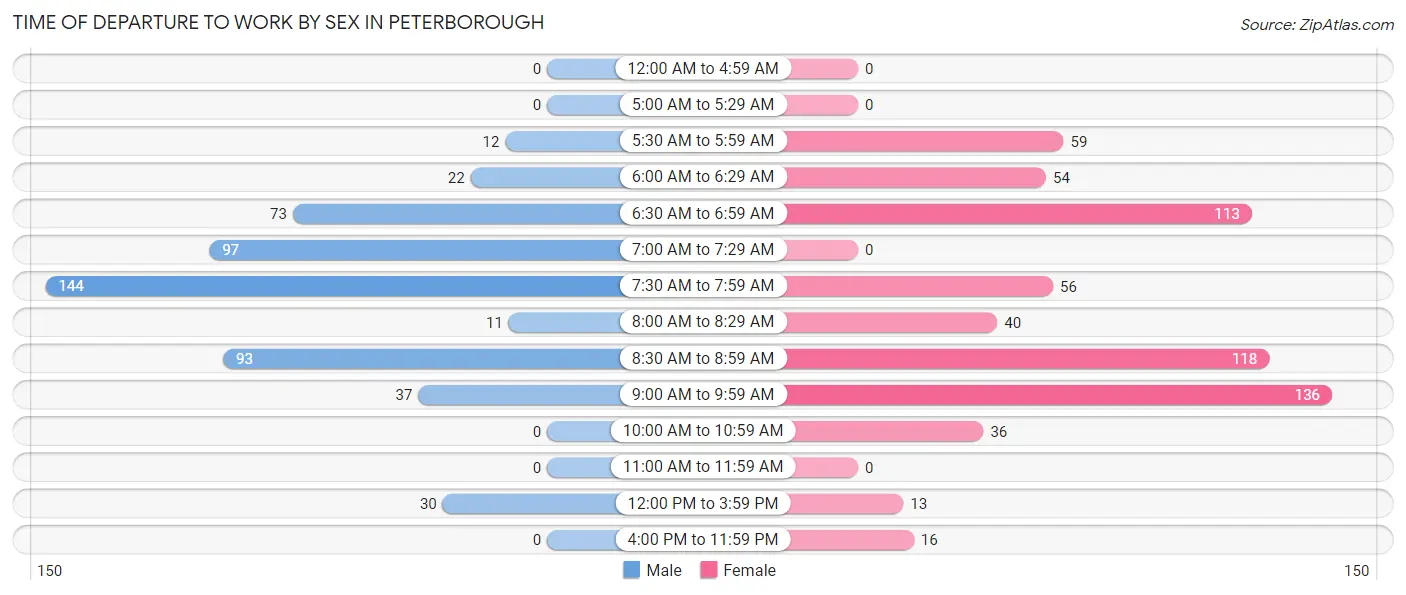
| Time of Departure | Male | Female |
| 12:00 AM to 4:59 AM | 0 (0.0%) | 0 (0.0%) |
| 5:00 AM to 5:29 AM | 0 (0.0%) | 0 (0.0%) |
| 5:30 AM to 5:59 AM | 12 (2.3%) | 59 (9.2%) |
| 6:00 AM to 6:29 AM | 22 (4.2%) | 54 (8.4%) |
| 6:30 AM to 6:59 AM | 73 (14.1%) | 113 (17.6%) |
| 7:00 AM to 7:29 AM | 97 (18.7%) | 0 (0.0%) |
| 7:30 AM to 7:59 AM | 144 (27.8%) | 56 (8.7%) |
| 8:00 AM to 8:29 AM | 11 (2.1%) | 40 (6.2%) |
| 8:30 AM to 8:59 AM | 93 (17.9%) | 118 (18.4%) |
| 9:00 AM to 9:59 AM | 37 (7.1%) | 136 (21.2%) |
| 10:00 AM to 10:59 AM | 0 (0.0%) | 36 (5.6%) |
| 11:00 AM to 11:59 AM | 0 (0.0%) | 0 (0.0%) |
| 12:00 PM to 3:59 PM | 30 (5.8%) | 13 (2.0%) |
| 4:00 PM to 11:59 PM | 0 (0.0%) | 16 (2.5%) |
| Total | 519 (100.0%) | 641 (100.0%) |
Housing Occupancy in Peterborough
Occupancy by Ownership in Peterborough
Of the total 1,279 dwellings in Peterborough, owner-occupied units account for 691 (54.0%), while renter-occupied units make up 588 (46.0%).
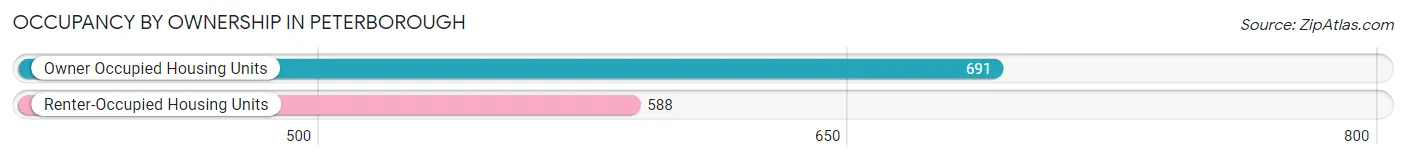
| Occupancy | # Housing Units | % Housing Units |
| Owner Occupied Housing Units | 691 | 54.0% |
| Renter-Occupied Housing Units | 588 | 46.0% |
| Total Occupied Housing Units | 1,279 | 100.0% |
Occupancy by Household Size in Peterborough
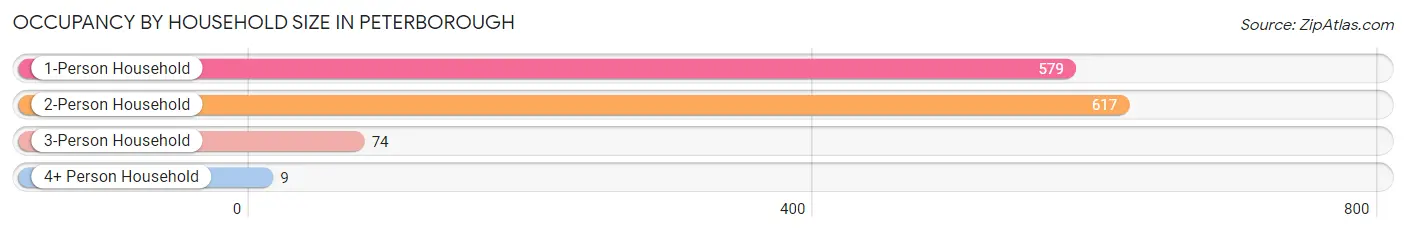
| Household Size | # Housing Units | % Housing Units |
| 1-Person Household | 579 | 45.3% |
| 2-Person Household | 617 | 48.2% |
| 3-Person Household | 74 | 5.8% |
| 4+ Person Household | 9 | 0.7% |
| Total Housing Units | 1,279 | 100.0% |
Occupancy by Ownership by Household Size in Peterborough
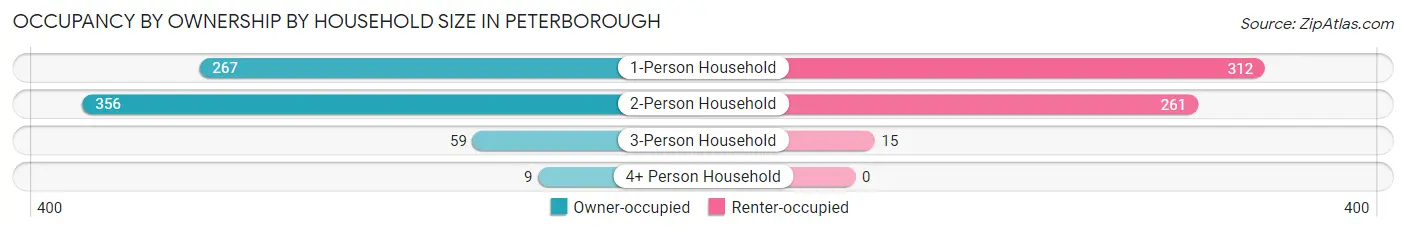
| Household Size | Owner-occupied | Renter-occupied |
| 1-Person Household | 267 (46.1%) | 312 (53.9%) |
| 2-Person Household | 356 (57.7%) | 261 (42.3%) |
| 3-Person Household | 59 (79.7%) | 15 (20.3%) |
| 4+ Person Household | 9 (100.0%) | 0 (0.0%) |
| Total Housing Units | 691 (54.0%) | 588 (46.0%) |
Occupancy by Educational Attainment in Peterborough
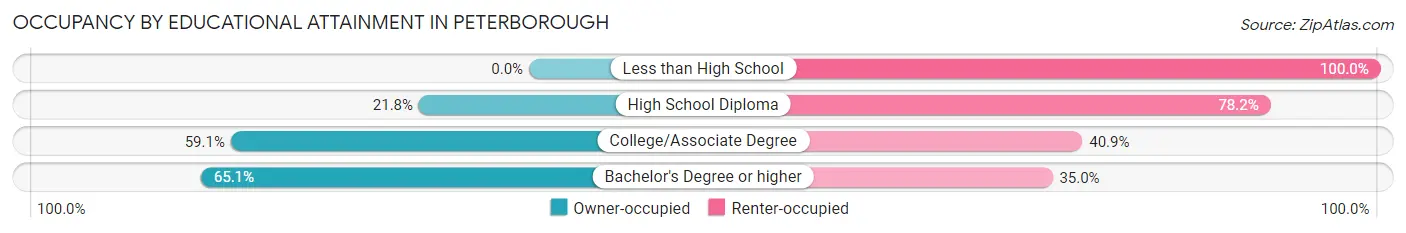
| Household Size | Owner-occupied | Renter-occupied |
| Less than High School | 0 (0.0%) | 48 (100.0%) |
| High School Diploma | 43 (21.8%) | 154 (78.2%) |
| College/Associate Degree | 246 (59.1%) | 170 (40.9%) |
| Bachelor's Degree or higher | 402 (65.0%) | 216 (34.9%) |
Occupancy by Age of Householder in Peterborough
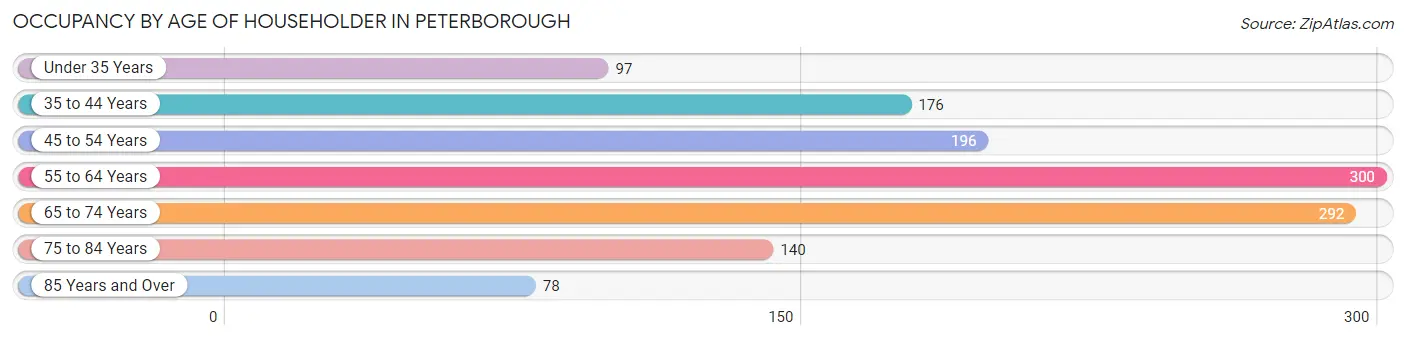
| Age Bracket | # Households | % Households |
| Under 35 Years | 97 | 7.6% |
| 35 to 44 Years | 176 | 13.8% |
| 45 to 54 Years | 196 | 15.3% |
| 55 to 64 Years | 300 | 23.5% |
| 65 to 74 Years | 292 | 22.8% |
| 75 to 84 Years | 140 | 11.0% |
| 85 Years and Over | 78 | 6.1% |
| Total | 1,279 | 100.0% |
Housing Finances in Peterborough
Median Income by Occupancy in Peterborough
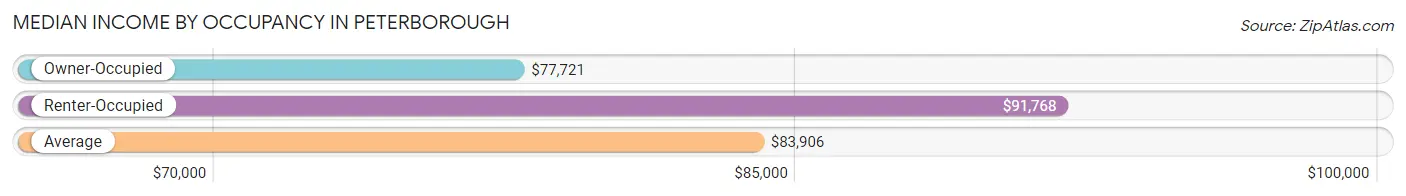
| Occupancy Type | # Households | Median Income |
| Owner-Occupied | 691 (54.0%) | $77,721 |
| Renter-Occupied | 588 (46.0%) | $91,768 |
| Average | 1,279 (100.0%) | $83,906 |
Occupancy by Householder Income Bracket in Peterborough
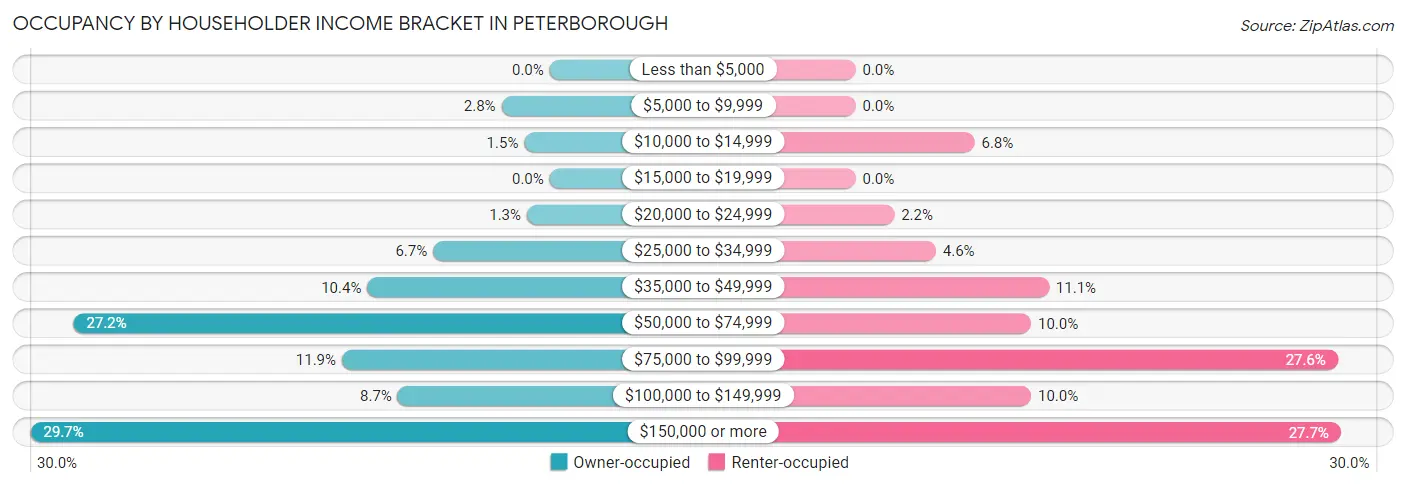
| Income Bracket | Owner-occupied | Renter-occupied |
| Less than $5,000 | 0 (0.0%) | 0 (0.0%) |
| $5,000 to $9,999 | 19 (2.8%) | 0 (0.0%) |
| $10,000 to $14,999 | 10 (1.5%) | 40 (6.8%) |
| $15,000 to $19,999 | 0 (0.0%) | 0 (0.0%) |
| $20,000 to $24,999 | 9 (1.3%) | 13 (2.2%) |
| $25,000 to $34,999 | 46 (6.7%) | 27 (4.6%) |
| $35,000 to $49,999 | 72 (10.4%) | 65 (11.1%) |
| $50,000 to $74,999 | 188 (27.2%) | 59 (10.0%) |
| $75,000 to $99,999 | 82 (11.9%) | 162 (27.6%) |
| $100,000 to $149,999 | 60 (8.7%) | 59 (10.0%) |
| $150,000 or more | 205 (29.7%) | 163 (27.7%) |
| Total | 691 (100.0%) | 588 (100.0%) |
Monthly Housing Cost Tiers in Peterborough
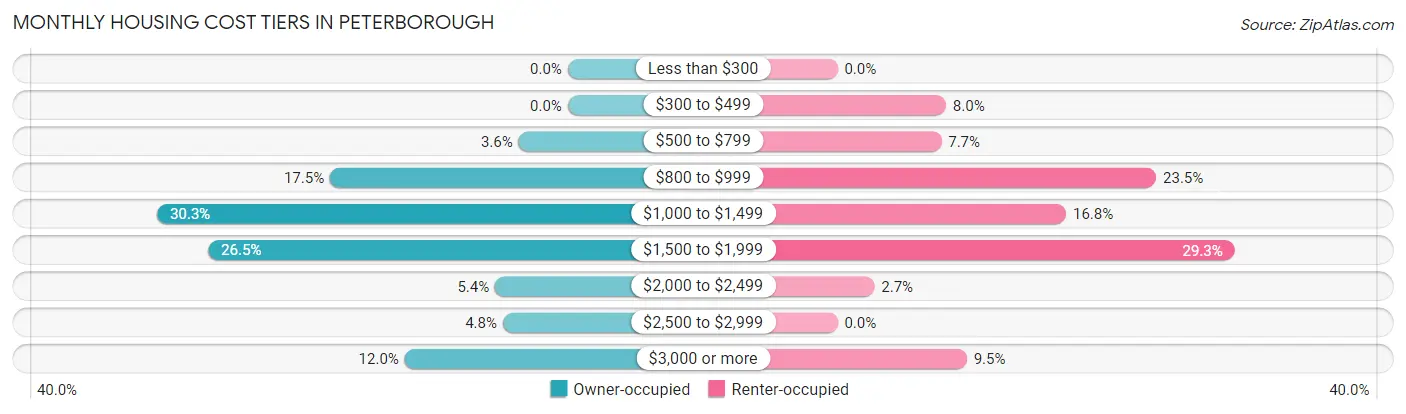
| Monthly Cost | Owner-occupied | Renter-occupied |
| Less than $300 | 0 (0.0%) | 0 (0.0%) |
| $300 to $499 | 0 (0.0%) | 47 (8.0%) |
| $500 to $799 | 25 (3.6%) | 45 (7.6%) |
| $800 to $999 | 121 (17.5%) | 138 (23.5%) |
| $1,000 to $1,499 | 209 (30.2%) | 99 (16.8%) |
| $1,500 to $1,999 | 183 (26.5%) | 172 (29.2%) |
| $2,000 to $2,499 | 37 (5.3%) | 16 (2.7%) |
| $2,500 to $2,999 | 33 (4.8%) | 0 (0.0%) |
| $3,000 or more | 83 (12.0%) | 56 (9.5%) |
| Total | 691 (100.0%) | 588 (100.0%) |
Physical Housing Characteristics in Peterborough
Housing Structures in Peterborough
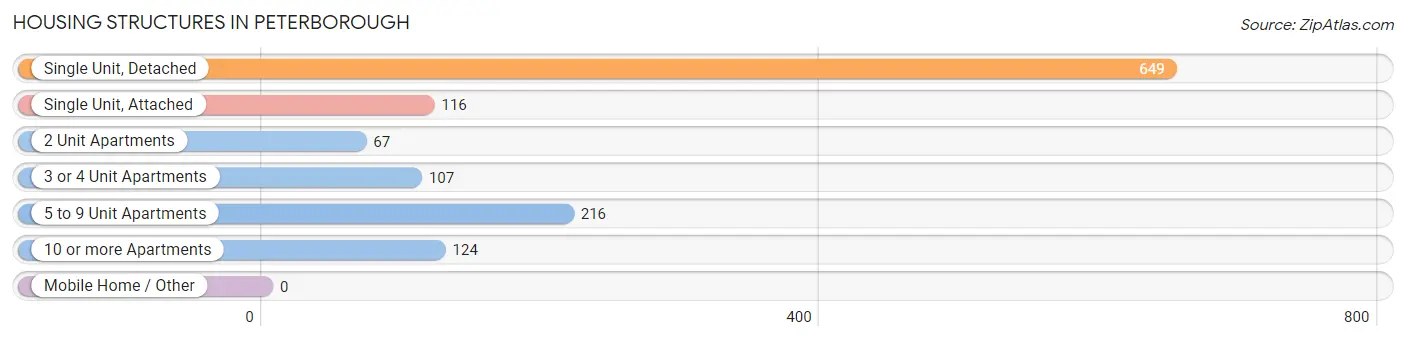
| Structure Type | # Housing Units | % Housing Units |
| Single Unit, Detached | 649 | 50.7% |
| Single Unit, Attached | 116 | 9.1% |
| 2 Unit Apartments | 67 | 5.2% |
| 3 or 4 Unit Apartments | 107 | 8.4% |
| 5 to 9 Unit Apartments | 216 | 16.9% |
| 10 or more Apartments | 124 | 9.7% |
| Mobile Home / Other | 0 | 0.0% |
| Total | 1,279 | 100.0% |
Housing Structures by Occupancy in Peterborough
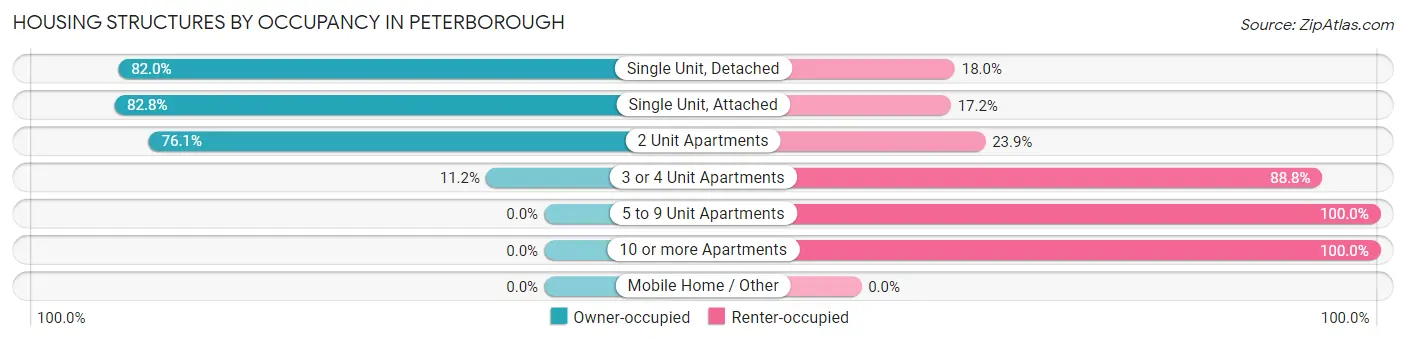
| Structure Type | Owner-occupied | Renter-occupied |
| Single Unit, Detached | 532 (82.0%) | 117 (18.0%) |
| Single Unit, Attached | 96 (82.8%) | 20 (17.2%) |
| 2 Unit Apartments | 51 (76.1%) | 16 (23.9%) |
| 3 or 4 Unit Apartments | 12 (11.2%) | 95 (88.8%) |
| 5 to 9 Unit Apartments | 0 (0.0%) | 216 (100.0%) |
| 10 or more Apartments | 0 (0.0%) | 124 (100.0%) |
| Mobile Home / Other | 0 (0.0%) | 0 (0.0%) |
| Total | 691 (54.0%) | 588 (46.0%) |
Housing Structures by Number of Rooms in Peterborough
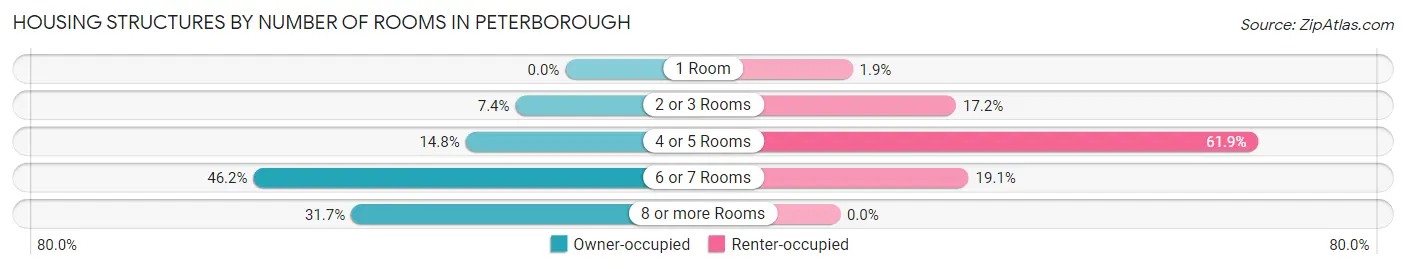
| Number of Rooms | Owner-occupied | Renter-occupied |
| 1 Room | 0 (0.0%) | 11 (1.9%) |
| 2 or 3 Rooms | 51 (7.4%) | 101 (17.2%) |
| 4 or 5 Rooms | 102 (14.8%) | 364 (61.9%) |
| 6 or 7 Rooms | 319 (46.2%) | 112 (19.1%) |
| 8 or more Rooms | 219 (31.7%) | 0 (0.0%) |
| Total | 691 (100.0%) | 588 (100.0%) |
Housing Structure by Heating Type in Peterborough
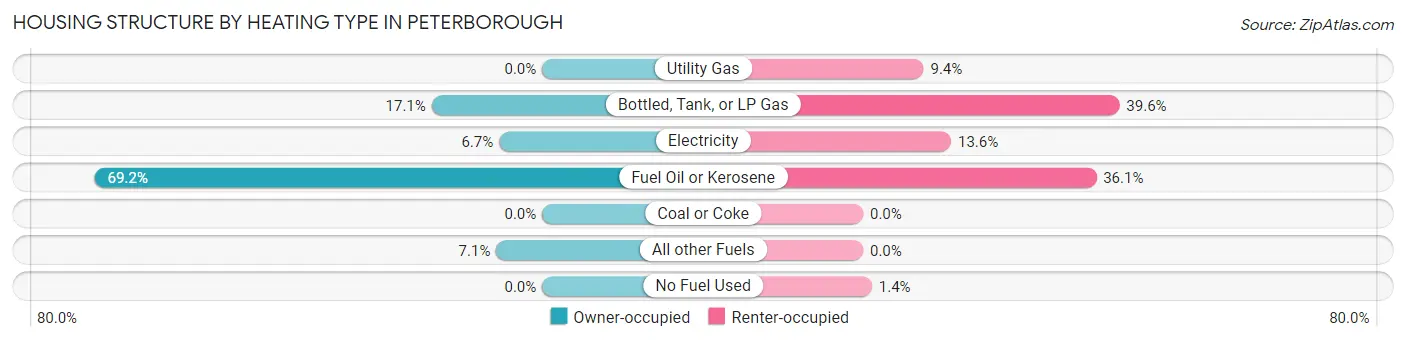
| Heating Type | Owner-occupied | Renter-occupied |
| Utility Gas | 0 (0.0%) | 55 (9.3%) |
| Bottled, Tank, or LP Gas | 118 (17.1%) | 233 (39.6%) |
| Electricity | 46 (6.7%) | 80 (13.6%) |
| Fuel Oil or Kerosene | 478 (69.2%) | 212 (36.0%) |
| Coal or Coke | 0 (0.0%) | 0 (0.0%) |
| All other Fuels | 49 (7.1%) | 0 (0.0%) |
| No Fuel Used | 0 (0.0%) | 8 (1.4%) |
| Total | 691 (100.0%) | 588 (100.0%) |
Household Vehicle Usage in Peterborough
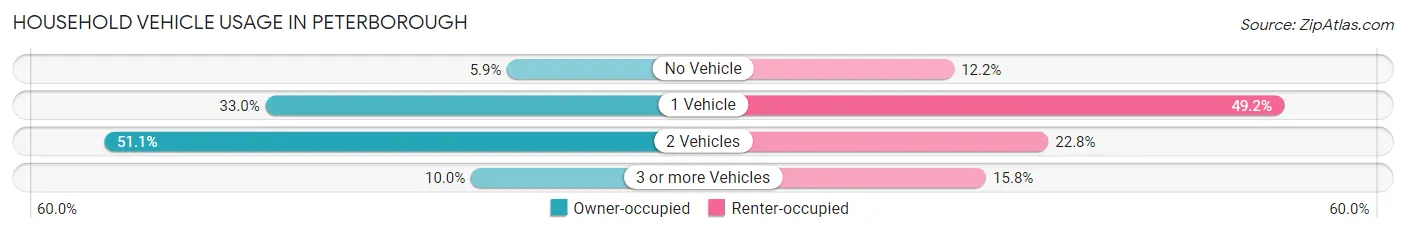
| Vehicles per Household | Owner-occupied | Renter-occupied |
| No Vehicle | 41 (5.9%) | 72 (12.2%) |
| 1 Vehicle | 228 (33.0%) | 289 (49.1%) |
| 2 Vehicles | 353 (51.1%) | 134 (22.8%) |
| 3 or more Vehicles | 69 (10.0%) | 93 (15.8%) |
| Total | 691 (100.0%) | 588 (100.0%) |
Real Estate & Mortgages in Peterborough
Real Estate and Mortgage Overview in Peterborough
| Characteristic | Without Mortgage | With Mortgage |
| Housing Units | 345 | 346 |
| Median Property Value | $326,600 | $275,400 |
| Median Household Income | $65,515 | $167 |
| Monthly Housing Costs | $1,091 | $83 |
| Real Estate Taxes | $8,524 | $0 |
Property Value by Mortgage Status in Peterborough
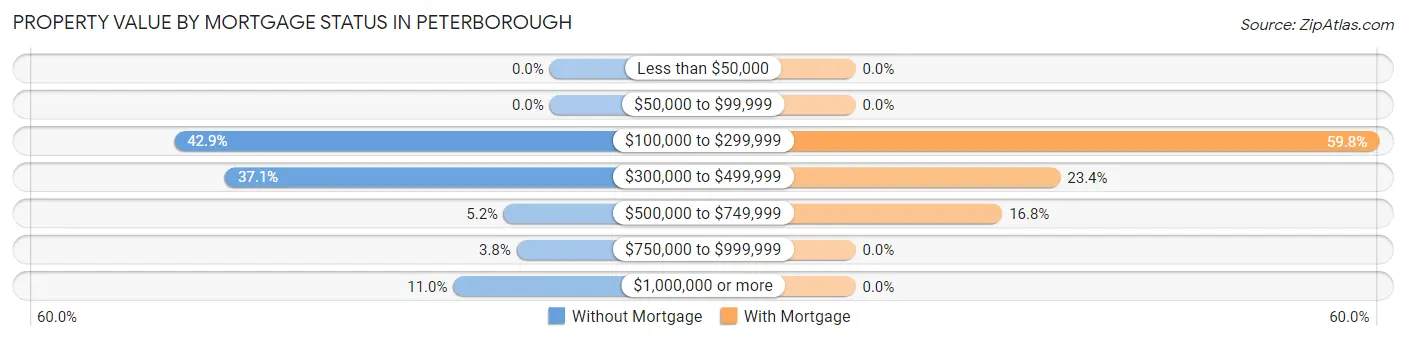
| Property Value | Without Mortgage | With Mortgage |
| Less than $50,000 | 0 (0.0%) | 0 (0.0%) |
| $50,000 to $99,999 | 0 (0.0%) | 0 (0.0%) |
| $100,000 to $299,999 | 148 (42.9%) | 207 (59.8%) |
| $300,000 to $499,999 | 128 (37.1%) | 81 (23.4%) |
| $500,000 to $749,999 | 18 (5.2%) | 58 (16.8%) |
| $750,000 to $999,999 | 13 (3.8%) | 0 (0.0%) |
| $1,000,000 or more | 38 (11.0%) | 0 (0.0%) |
| Total | 345 (100.0%) | 346 (100.0%) |
Household Income by Mortgage Status in Peterborough
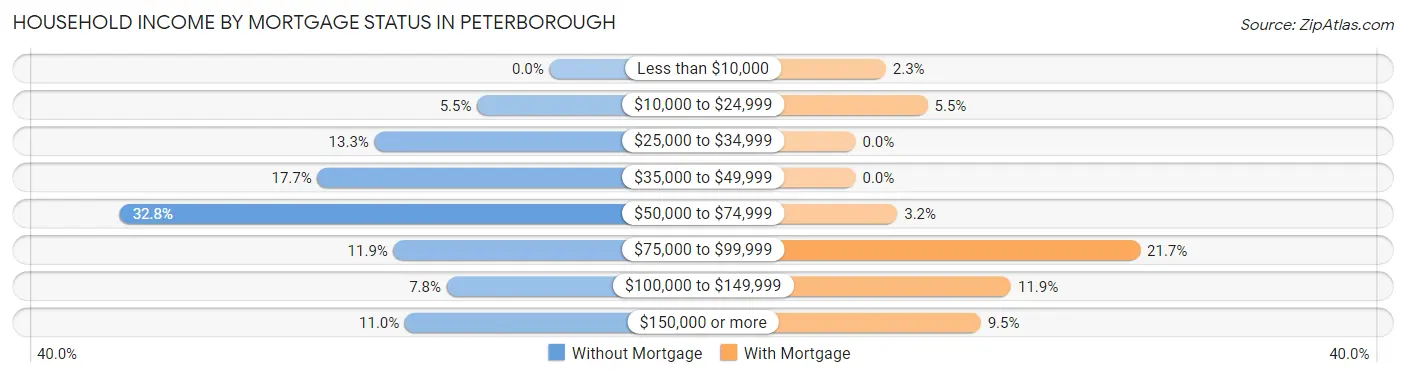
| Household Income | Without Mortgage | With Mortgage |
| Less than $10,000 | 0 (0.0%) | 8 (2.3%) |
| $10,000 to $24,999 | 19 (5.5%) | 19 (5.5%) |
| $25,000 to $34,999 | 46 (13.3%) | 0 (0.0%) |
| $35,000 to $49,999 | 61 (17.7%) | 0 (0.0%) |
| $50,000 to $74,999 | 113 (32.8%) | 11 (3.2%) |
| $75,000 to $99,999 | 41 (11.9%) | 75 (21.7%) |
| $100,000 to $149,999 | 27 (7.8%) | 41 (11.8%) |
| $150,000 or more | 38 (11.0%) | 33 (9.5%) |
| Total | 345 (100.0%) | 346 (100.0%) |
Property Value to Household Income Ratio in Peterborough
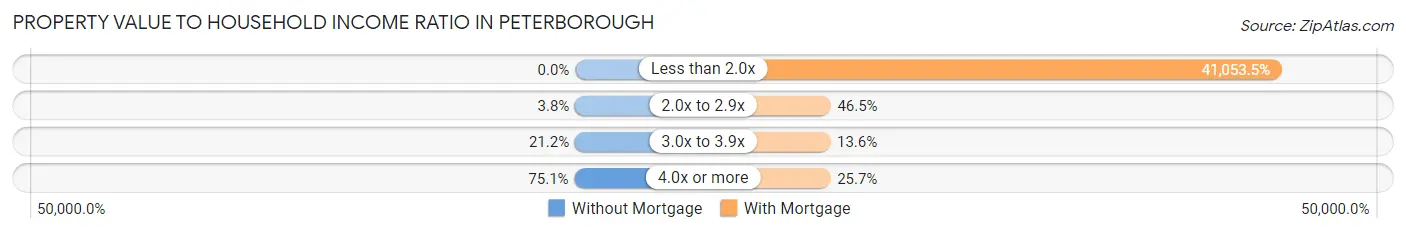
| Value-to-Income Ratio | Without Mortgage | With Mortgage |
| Less than 2.0x | 0 (0.0%) | 142,045 (41,053.5%) |
| 2.0x to 2.9x | 13 (3.8%) | 161 (46.5%) |
| 3.0x to 3.9x | 73 (21.2%) | 47 (13.6%) |
| 4.0x or more | 259 (75.1%) | 89 (25.7%) |
| Total | 345 (100.0%) | 346 (100.0%) |
Real Estate Taxes by Mortgage Status in Peterborough
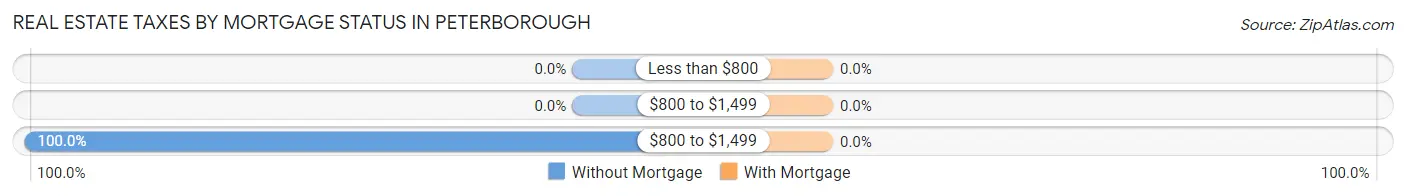
| Property Taxes | Without Mortgage | With Mortgage |
| Less than $800 | 0 (0.0%) | 0 (0.0%) |
| $800 to $1,499 | 0 (0.0%) | 0 (0.0%) |
| $800 to $1,499 | 345 (100.0%) | 0 (0.0%) |
| Total | 345 (100.0%) | 346 (100.0%) |
Health & Disability in Peterborough
Health Insurance Coverage by Age in Peterborough
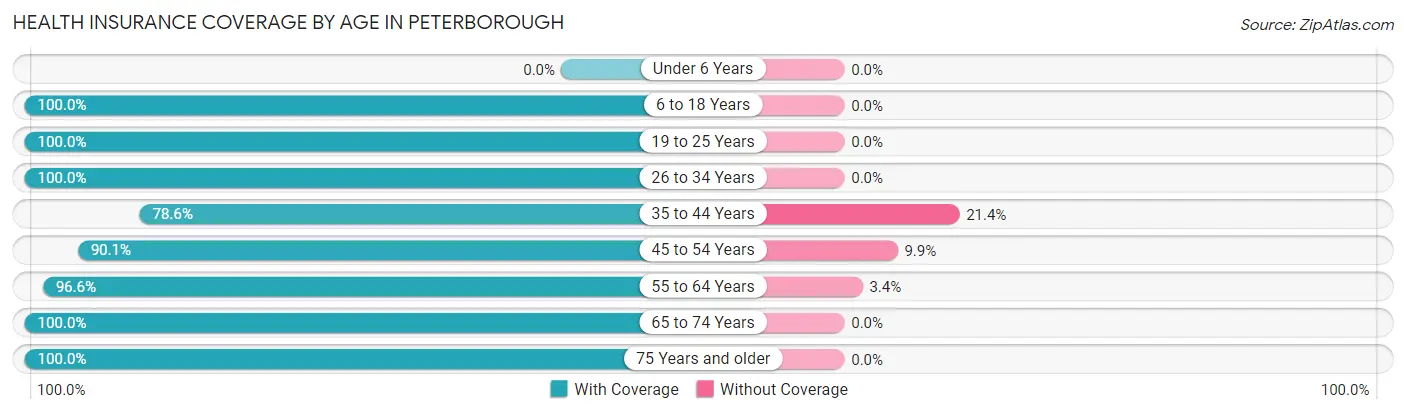
| Age Bracket | With Coverage | Without Coverage |
| Under 6 Years | 0 (0.0%) | 0 (0.0%) |
| 6 to 18 Years | 100 (100.0%) | 0 (0.0%) |
| 19 to 25 Years | 62 (100.0%) | 0 (0.0%) |
| 26 to 34 Years | 185 (100.0%) | 0 (0.0%) |
| 35 to 44 Years | 176 (78.6%) | 48 (21.4%) |
| 45 to 54 Years | 291 (90.1%) | 32 (9.9%) |
| 55 to 64 Years | 428 (96.6%) | 15 (3.4%) |
| 65 to 74 Years | 457 (100.0%) | 0 (0.0%) |
| 75 Years and older | 372 (100.0%) | 0 (0.0%) |
| Total | 2,071 (95.6%) | 95 (4.4%) |
Health Insurance Coverage by Citizenship Status in Peterborough
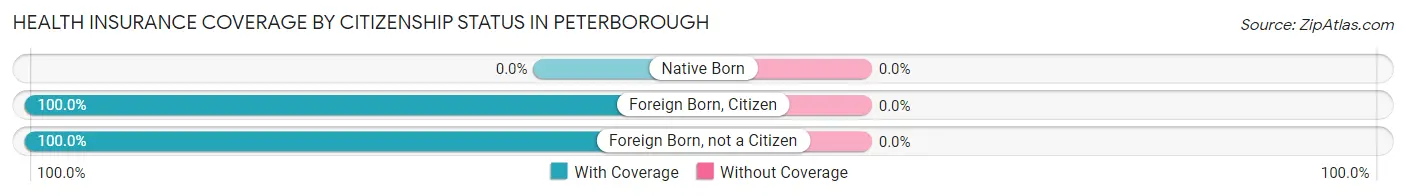
| Citizenship Status | With Coverage | Without Coverage |
| Native Born | 0 (0.0%) | 0 (0.0%) |
| Foreign Born, Citizen | 100 (100.0%) | 0 (0.0%) |
| Foreign Born, not a Citizen | 62 (100.0%) | 0 (0.0%) |
Health Insurance Coverage by Household Income in Peterborough
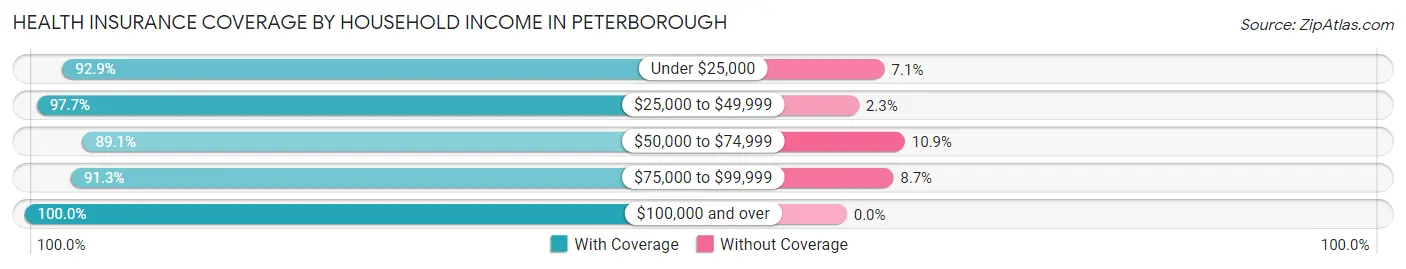
| Household Income | With Coverage | Without Coverage |
| Under $25,000 | 131 (92.9%) | 10 (7.1%) |
| $25,000 to $49,999 | 302 (97.7%) | 7 (2.3%) |
| $50,000 to $74,999 | 336 (89.1%) | 41 (10.9%) |
| $75,000 to $99,999 | 335 (91.3%) | 32 (8.7%) |
| $100,000 and over | 950 (100.0%) | 0 (0.0%) |
Public vs Private Health Insurance Coverage by Age in Peterborough
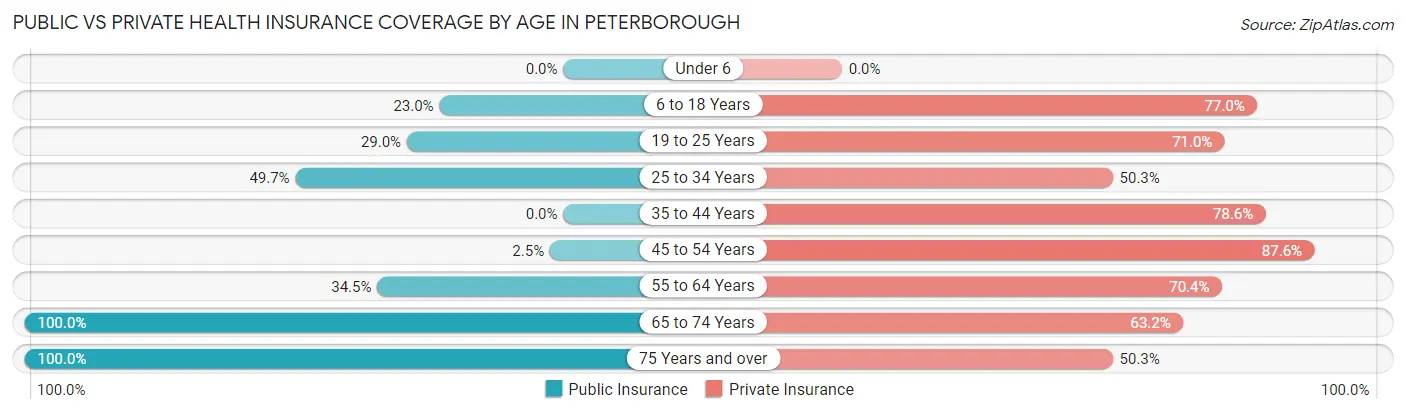
| Age Bracket | Public Insurance | Private Insurance |
| Under 6 | 0 (0.0%) | 0 (0.0%) |
| 6 to 18 Years | 23 (23.0%) | 77 (77.0%) |
| 19 to 25 Years | 18 (29.0%) | 44 (71.0%) |
| 25 to 34 Years | 92 (49.7%) | 93 (50.3%) |
| 35 to 44 Years | 0 (0.0%) | 176 (78.6%) |
| 45 to 54 Years | 8 (2.5%) | 283 (87.6%) |
| 55 to 64 Years | 153 (34.5%) | 312 (70.4%) |
| 65 to 74 Years | 457 (100.0%) | 289 (63.2%) |
| 75 Years and over | 372 (100.0%) | 187 (50.3%) |
| Total | 1,123 (51.8%) | 1,461 (67.4%) |
Disability Status by Sex by Age in Peterborough
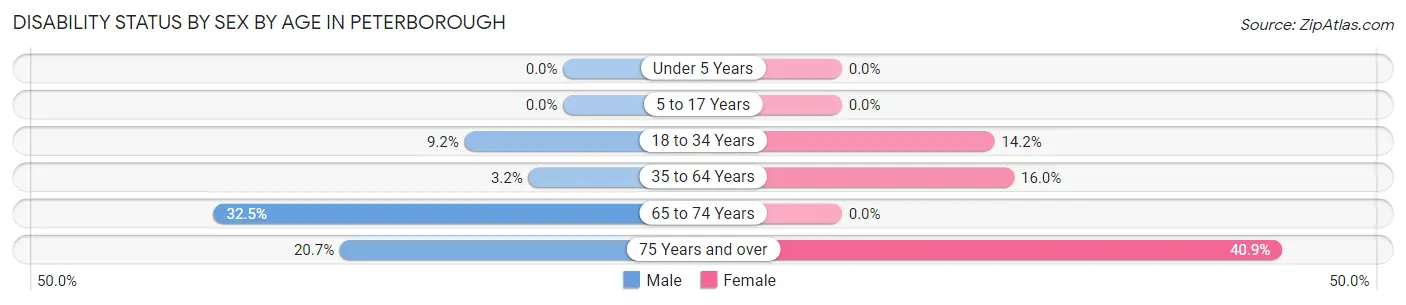
| Age Bracket | Male | Female |
| Under 5 Years | 0 (0.0%) | 0 (0.0%) |
| 5 to 17 Years | 0 (0.0%) | 0 (0.0%) |
| 18 to 34 Years | 11 (9.2%) | 18 (14.2%) |
| 35 to 64 Years | 12 (3.2%) | 99 (16.0%) |
| 65 to 74 Years | 87 (32.5%) | 0 (0.0%) |
| 75 Years and over | 34 (20.7%) | 85 (40.9%) |
Disability Class by Sex by Age in Peterborough
Disability Class: Hearing Difficulty
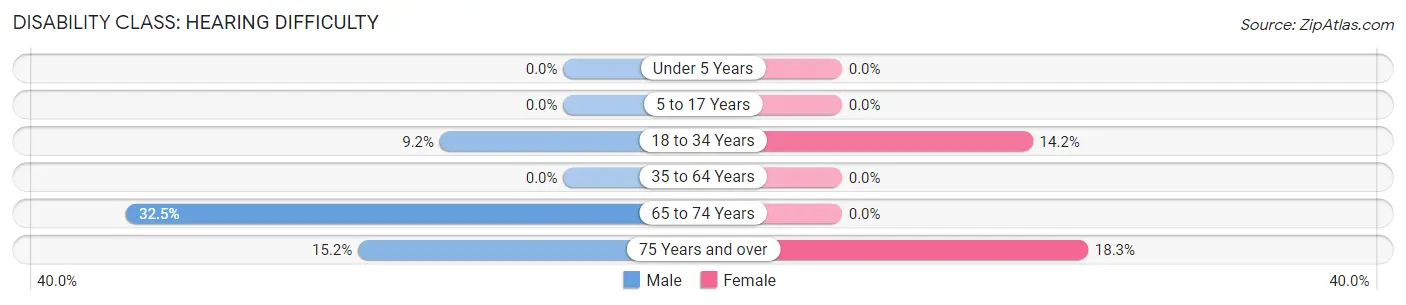
| Age Bracket | Male | Female |
| Under 5 Years | 0 (0.0%) | 0 (0.0%) |
| 5 to 17 Years | 0 (0.0%) | 0 (0.0%) |
| 18 to 34 Years | 11 (9.2%) | 18 (14.2%) |
| 35 to 64 Years | 0 (0.0%) | 0 (0.0%) |
| 65 to 74 Years | 87 (32.5%) | 0 (0.0%) |
| 75 Years and over | 25 (15.2%) | 38 (18.3%) |
Disability Class: Vision Difficulty
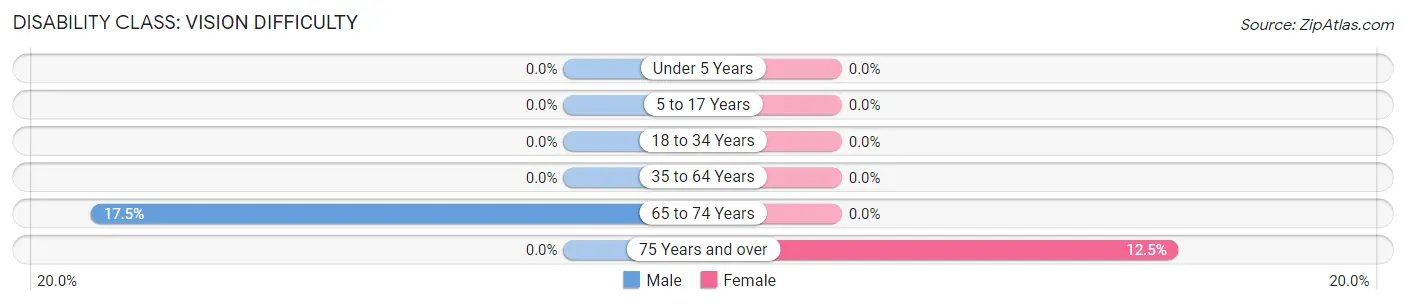
| Age Bracket | Male | Female |
| Under 5 Years | 0 (0.0%) | 0 (0.0%) |
| 5 to 17 Years | 0 (0.0%) | 0 (0.0%) |
| 18 to 34 Years | 0 (0.0%) | 0 (0.0%) |
| 35 to 64 Years | 0 (0.0%) | 0 (0.0%) |
| 65 to 74 Years | 47 (17.5%) | 0 (0.0%) |
| 75 Years and over | 0 (0.0%) | 26 (12.5%) |
Disability Class: Cognitive Difficulty
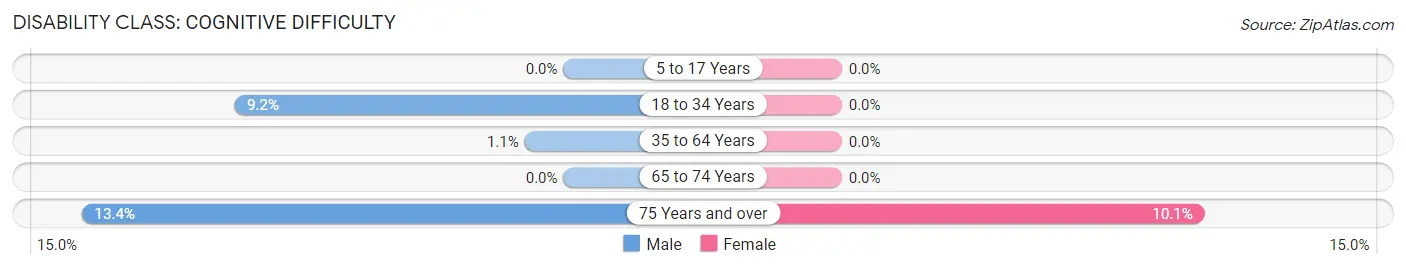
| Age Bracket | Male | Female |
| 5 to 17 Years | 0 (0.0%) | 0 (0.0%) |
| 18 to 34 Years | 11 (9.2%) | 0 (0.0%) |
| 35 to 64 Years | 4 (1.1%) | 0 (0.0%) |
| 65 to 74 Years | 0 (0.0%) | 0 (0.0%) |
| 75 Years and over | 22 (13.4%) | 21 (10.1%) |
Disability Class: Ambulatory Difficulty
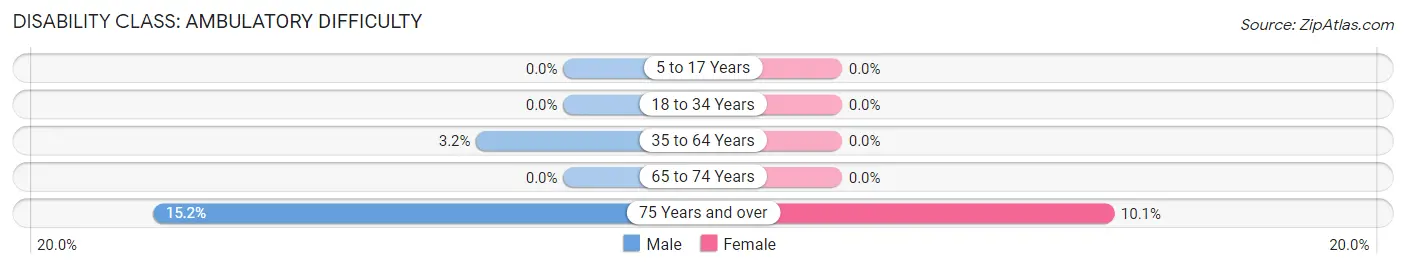
| Age Bracket | Male | Female |
| 5 to 17 Years | 0 (0.0%) | 0 (0.0%) |
| 18 to 34 Years | 0 (0.0%) | 0 (0.0%) |
| 35 to 64 Years | 12 (3.2%) | 0 (0.0%) |
| 65 to 74 Years | 0 (0.0%) | 0 (0.0%) |
| 75 Years and over | 25 (15.2%) | 21 (10.1%) |
Disability Class: Self-Care Difficulty
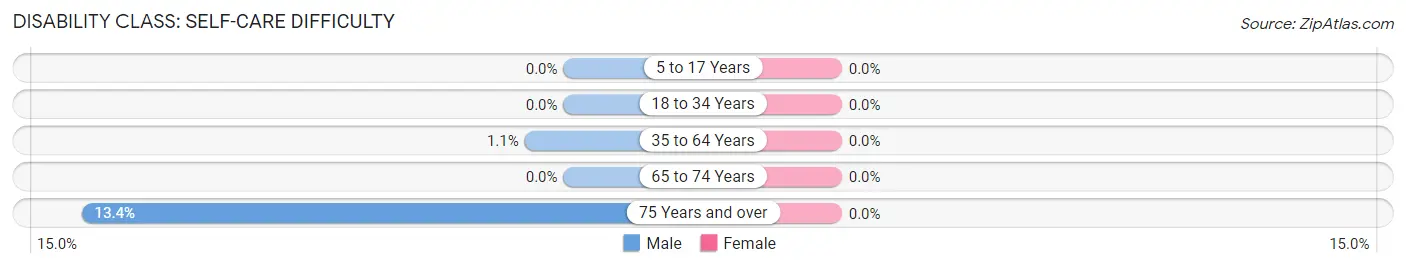
| Age Bracket | Male | Female |
| 5 to 17 Years | 0 (0.0%) | 0 (0.0%) |
| 18 to 34 Years | 0 (0.0%) | 0 (0.0%) |
| 35 to 64 Years | 4 (1.1%) | 0 (0.0%) |
| 65 to 74 Years | 0 (0.0%) | 0 (0.0%) |
| 75 Years and over | 22 (13.4%) | 0 (0.0%) |
Technology Access in Peterborough
Computing Device Access in Peterborough
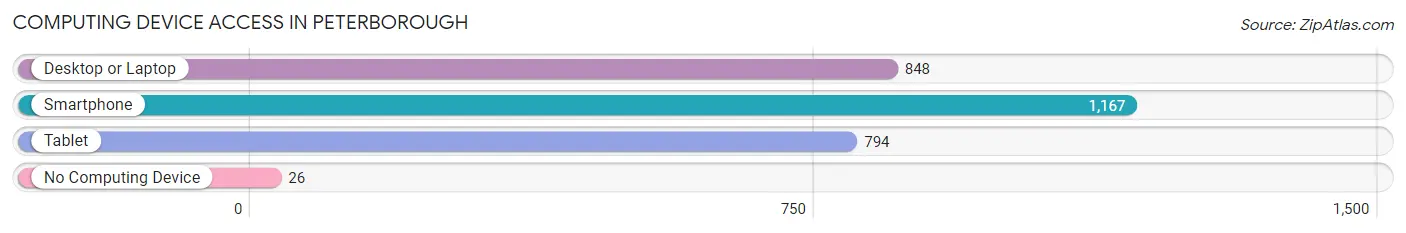
| Device Type | # Households | % Households |
| Desktop or Laptop | 848 | 66.3% |
| Smartphone | 1,167 | 91.2% |
| Tablet | 794 | 62.1% |
| No Computing Device | 26 | 2.0% |
| Total | 1,279 | 100.0% |
Internet Access in Peterborough
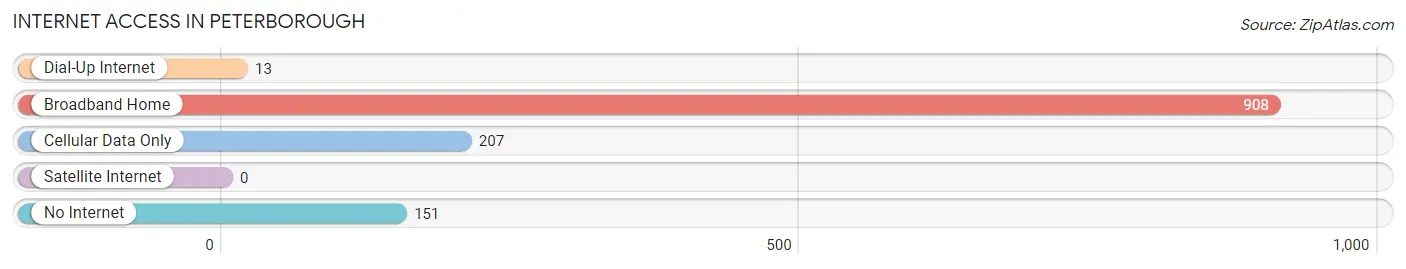
| Internet Type | # Households | % Households |
| Dial-Up Internet | 13 | 1.0% |
| Broadband Home | 908 | 71.0% |
| Cellular Data Only | 207 | 16.2% |
| Satellite Internet | 0 | 0.0% |
| No Internet | 151 | 11.8% |
| Total | 1,279 | 100.0% |
Peterborough Summary
Peterborough, New Hampshire is a small town located in Hillsborough County in the southwestern part of the state. It is situated on the Contoocook River, and is part of the Monadnock Region. The town has a population of 6,284 as of the 2010 census, and is the county seat of Hillsborough County.
History
The area that is now Peterborough was first settled in 1738 by a group of Scots-Irish immigrants led by the Reverend Peter Powers. The town was incorporated in 1760, and named after Powers. The town was an important center of trade and industry in the early 19th century, and was home to several mills and factories. The town was also the site of the first free public library in the United States, established in 1833.
Geography
Peterborough is located in southwestern New Hampshire, in Hillsborough County. It is situated on the Contoocook River, and is part of the Monadnock Region. The town has a total area of 16.2 square miles, of which 15.9 square miles is land and 0.3 square miles is water. The town is bordered by the towns of Dublin to the north, Sharon to the east, Hancock to the south, and Jaffrey to the west.
Economy
The economy of Peterborough is largely based on tourism and manufacturing. The town is home to several small businesses, including a number of restaurants, shops, and galleries. The town is also home to several manufacturing companies, including a paper mill, a plastics factory, and a printing company.
Demographics
As of the 2010 census, there were 6,284 people, 2,541 households, and 1,619 families residing in the town. The population density was 393.3 people per square mile. The racial makeup of the town was 96.2% White, 0.7% African American, 0.3% Native American, 0.7% Asian, 0.1% Pacific Islander, 0.7% from other races, and 1.3% from two or more races. Hispanic or Latino of any race were 2.2% of the population.
The median income for a household in the town was $50,977, and the median income for a family was $63,958. The per capita income for the town was $25,945. About 5.2% of families and 8.2% of the population were below the poverty line, including 10.2% of those under age 18 and 5.2% of those age 65 or over.
Common Questions
What is Per Capita Income in Peterborough?
Per Capita income in Peterborough is $72,177.
What is the Median Family Income in Peterborough?
Median Family Income in Peterborough is $99,904.
What is the Median Household income in Peterborough?
Median Household Income in Peterborough is $83,906.
What is Income or Wage Gap in Peterborough?
Income or Wage Gap in Peterborough is 22.3%.
Women in Peterborough earn 77.7 cents for every dollar earned by a man.
What is Inequality or Gini Index in Peterborough?
Inequality or Gini Index in Peterborough is 0.45.
What is the Total Population of Peterborough?
Total Population of Peterborough is 2,247.
What is the Total Male Population of Peterborough?
Total Male Population of Peterborough is 1,013.
What is the Total Female Population of Peterborough?
Total Female Population of Peterborough is 1,234.
What is the Ratio of Males per 100 Females in Peterborough?
There are 82.09 Males per 100 Females in Peterborough.
What is the Ratio of Females per 100 Males in Peterborough?
There are 121.82 Females per 100 Males in Peterborough.
What is the Median Population Age in Peterborough?
Median Population Age in Peterborough is 60.7 Years.
What is the Average Family Size in Peterborough
Average Family Size in Peterborough is 2.2 People.
What is the Average Household Size in Peterborough
Average Household Size in Peterborough is 1.7 People.
How Large is the Labor Force in Peterborough?
There are 1,358 People in the Labor Forcein in Peterborough.
What is the Percentage of People in the Labor Force in Peterborough?
62.7% of People are in the Labor Force in Peterborough.
What is the Unemployment Rate in Peterborough?
Unemployment Rate in Peterborough is 2.9%.