Whitefield, NH Map & Demographics
Whitefield Map
Whitefield Overview
$30,182
PER CAPITA INCOME
$99,167
AVG FAMILY INCOME
$53,750
AVG HOUSEHOLD INCOME
6.3%
WAGE / INCOME GAP [ % ]
93.7¢/ $1
WAGE / INCOME GAP [ $ ]
0.43
INEQUALITY / GINI INDEX
1,332
TOTAL POPULATION
607
MALE POPULATION
725
FEMALE POPULATION
83.72
MALES / 100 FEMALES
119.44
FEMALES / 100 MALES
52.6
MEDIAN AGE
2.7
AVG FAMILY SIZE
2.1
AVG HOUSEHOLD SIZE
701
LABOR FORCE [ PEOPLE ]
58.5%
PERCENT IN LABOR FORCE
5.1%
UNEMPLOYMENT RATE
Whitefield Zip Codes
Whitefield Area Codes
Income in Whitefield
Income Overview in Whitefield
Per Capita Income in Whitefield is $30,182, while median incomes of families and households are $99,167 and $53,750 respectively.
| Characteristic | Number | Measure |
| Per Capita Income | 1,332 | $30,182 |
| Median Family Income | 284 | $99,167 |
| Mean Family Income | 284 | $92,309 |
| Median Household Income | 608 | $53,750 |
| Mean Household Income | 608 | $62,755 |
| Income Deficit | 284 | $0 |
| Wage / Income Gap (%) | 1,332 | 6.27% |
| Wage / Income Gap ($) | 1,332 | 93.73¢ per $1 |
| Gini / Inequality Index | 1,332 | 0.43 |
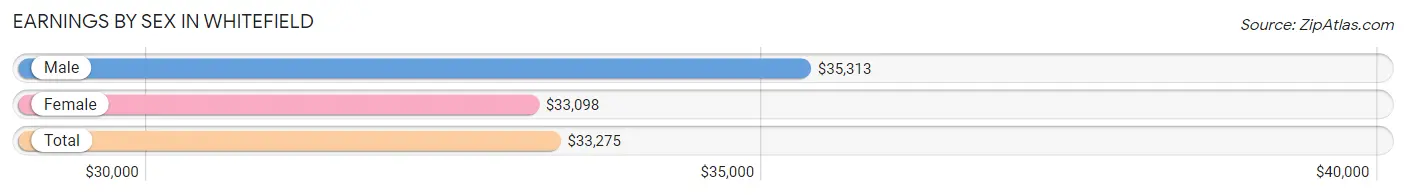
Earnings by Sex in Whitefield
Average Earnings in Whitefield are $33,275, $35,313 for men and $33,098 for women, a difference of 6.3%.
| Sex | Number | Average Earnings |
| Male | 359 (50.8%) | $35,313 |
| Female | 348 (49.2%) | $33,098 |
| Total | 707 (100.0%) | $33,275 |
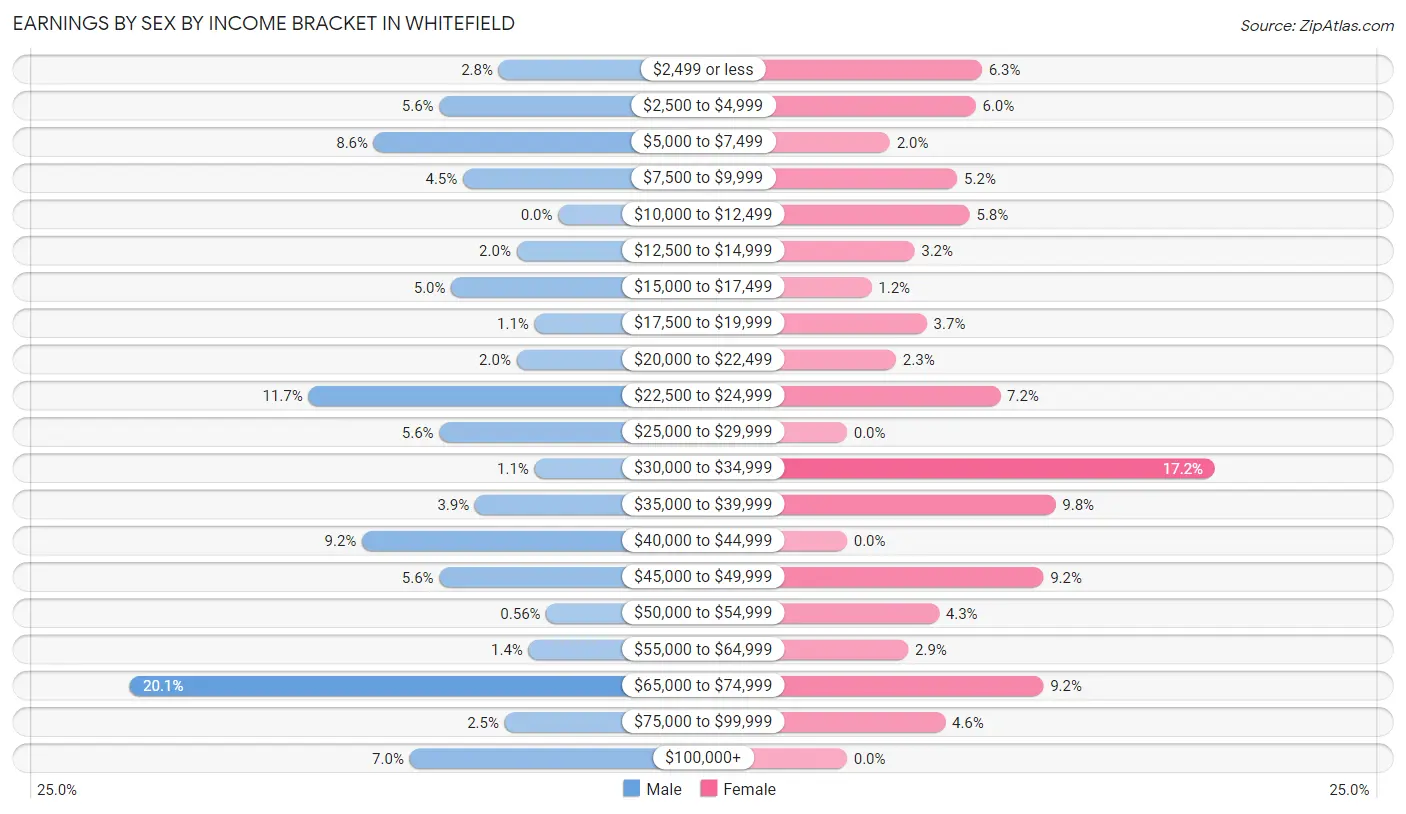
Earnings by Sex by Income Bracket in Whitefield
The most common earnings brackets in Whitefield are $65,000 to $74,999 for men (72 | 20.1%) and $30,000 to $34,999 for women (60 | 17.2%).
| Income | Male | Female |
| $2,499 or less | 10 (2.8%) | 22 (6.3%) |
| $2,500 to $4,999 | 20 (5.6%) | 21 (6.0%) |
| $5,000 to $7,499 | 31 (8.6%) | 7 (2.0%) |
| $7,500 to $9,999 | 16 (4.5%) | 18 (5.2%) |
| $10,000 to $12,499 | 0 (0.0%) | 20 (5.8%) |
| $12,500 to $14,999 | 7 (1.9%) | 11 (3.2%) |
| $15,000 to $17,499 | 18 (5.0%) | 4 (1.1%) |
| $17,500 to $19,999 | 4 (1.1%) | 13 (3.7%) |
| $20,000 to $22,499 | 7 (1.9%) | 8 (2.3%) |
| $22,500 to $24,999 | 42 (11.7%) | 25 (7.2%) |
| $25,000 to $29,999 | 20 (5.6%) | 0 (0.0%) |
| $30,000 to $34,999 | 4 (1.1%) | 60 (17.2%) |
| $35,000 to $39,999 | 14 (3.9%) | 34 (9.8%) |
| $40,000 to $44,999 | 33 (9.2%) | 0 (0.0%) |
| $45,000 to $49,999 | 20 (5.6%) | 32 (9.2%) |
| $50,000 to $54,999 | 2 (0.6%) | 15 (4.3%) |
| $55,000 to $64,999 | 5 (1.4%) | 10 (2.9%) |
| $65,000 to $74,999 | 72 (20.1%) | 32 (9.2%) |
| $75,000 to $99,999 | 9 (2.5%) | 16 (4.6%) |
| $100,000+ | 25 (7.0%) | 0 (0.0%) |
| Total | 359 (100.0%) | 348 (100.0%) |
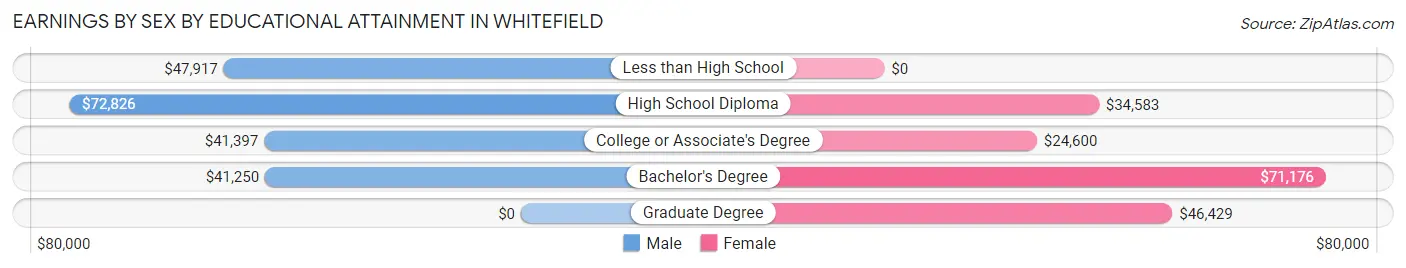
Earnings by Sex by Educational Attainment in Whitefield
Average earnings in Whitefield are $41,629 for men and $34,125 for women, a difference of 18.0%. Men with an educational attainment of high school diploma enjoy the highest average annual earnings of $72,826, while those with bachelor's degree education earn the least with $41,250. Women with an educational attainment of bachelor's degree earn the most with the average annual earnings of $71,176, while those with college or associate's degree education have the smallest earnings of $24,600.
| Educational Attainment | Male Income | Female Income |
| Less than High School | $47,917 | $0 |
| High School Diploma | $72,826 | $34,583 |
| College or Associate's Degree | $41,397 | $24,600 |
| Bachelor's Degree | $41,250 | $71,176 |
| Graduate Degree | - | - |
| Total | $41,629 | $34,125 |
Family Income in Whitefield
Family Income Brackets in Whitefield
According to the Whitefield family income data, there are 115 families falling into the $100,000 to $149,999 income range, which is the most common income bracket and makes up 40.5% of all families.
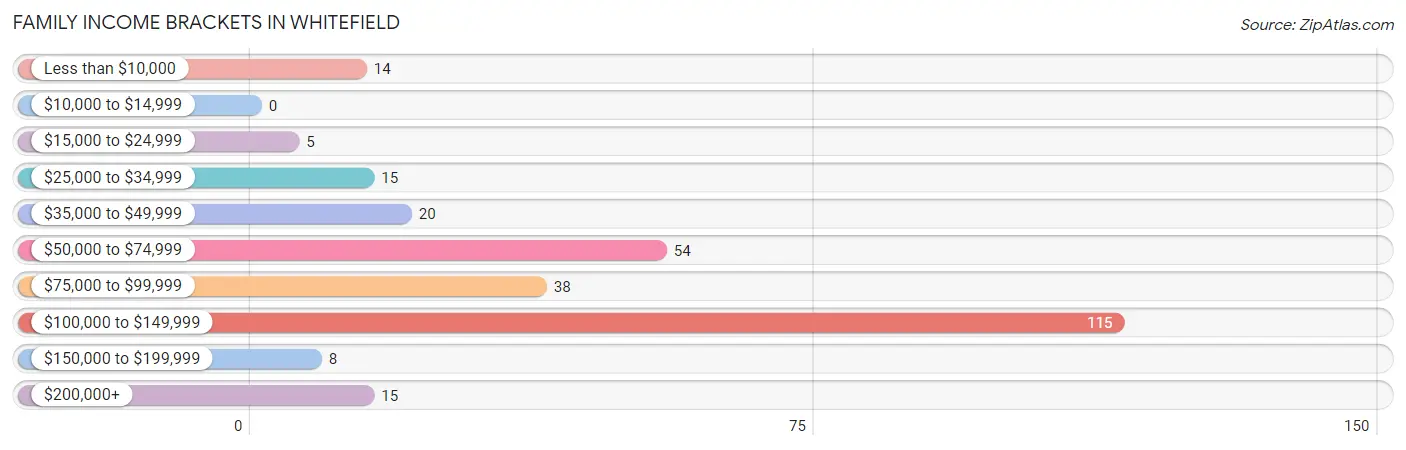
| Income Bracket | # Families | % Families |
| Less than $10,000 | 14 | 4.9% |
| $10,000 to $14,999 | 0 | 0.0% |
| $15,000 to $24,999 | 5 | 1.8% |
| $25,000 to $34,999 | 15 | 5.3% |
| $35,000 to $49,999 | 20 | 7.0% |
| $50,000 to $74,999 | 54 | 19.0% |
| $75,000 to $99,999 | 38 | 13.4% |
| $100,000 to $149,999 | 115 | 40.5% |
| $150,000 to $199,999 | 8 | 2.8% |
| $200,000+ | 15 | 5.3% |
Family Income by Famaliy Size in Whitefield
3-person families (91 | 32.0%) account for the highest median family income in Whitefield with $104,205 per family, while 2-person families (142 | 50.0%) have the highest median income of $45,514 per family member.
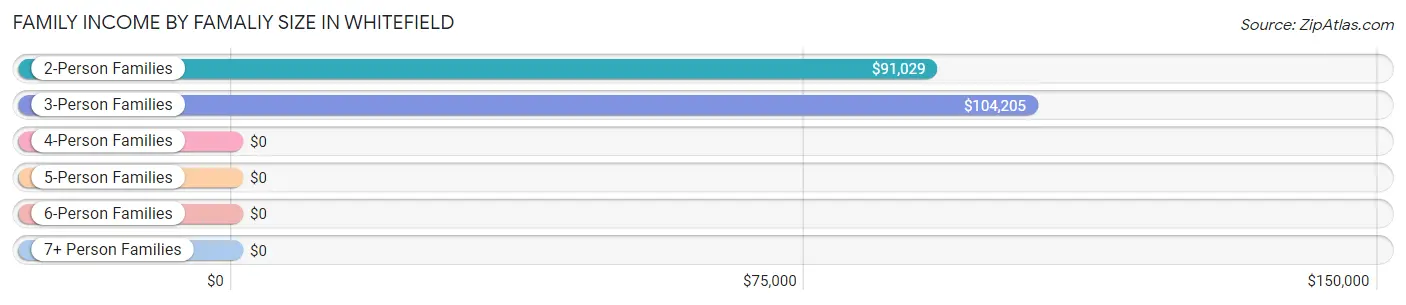
| Income Bracket | # Families | Median Income |
| 2-Person Families | 142 (50.0%) | $91,029 |
| 3-Person Families | 91 (32.0%) | $104,205 |
| 4-Person Families | 37 (13.0%) | $0 |
| 5-Person Families | 14 (4.9%) | $0 |
| 6-Person Families | 0 (0.0%) | $0 |
| 7+ Person Families | 0 (0.0%) | $0 |
| Total | 284 (100.0%) | $99,167 |
Family Income by Number of Earners in Whitefield
The median family income in Whitefield is $99,167, with families comprising 3+ earners (40) having the highest median family income of $107,000, while families with no earners (39) have the lowest median family income of $45,781, accounting for 14.1% and 13.7% of families, respectively.
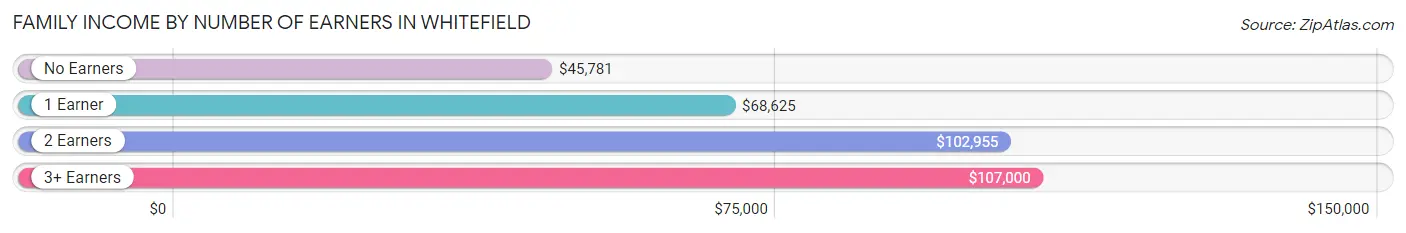
| Number of Earners | # Families | Median Income |
| No Earners | 39 (13.7%) | $45,781 |
| 1 Earner | 55 (19.4%) | $68,625 |
| 2 Earners | 150 (52.8%) | $102,955 |
| 3+ Earners | 40 (14.1%) | $107,000 |
| Total | 284 (100.0%) | $99,167 |
Household Income in Whitefield
Household Income Brackets in Whitefield
With 139 households falling in the category, the $50,000 to $74,999 income range is the most frequent in Whitefield, accounting for 22.9% of all households. In contrast, only 8 households (1.3%) fall into the $150,000 to $199,999 income bracket, making it the least populous group.
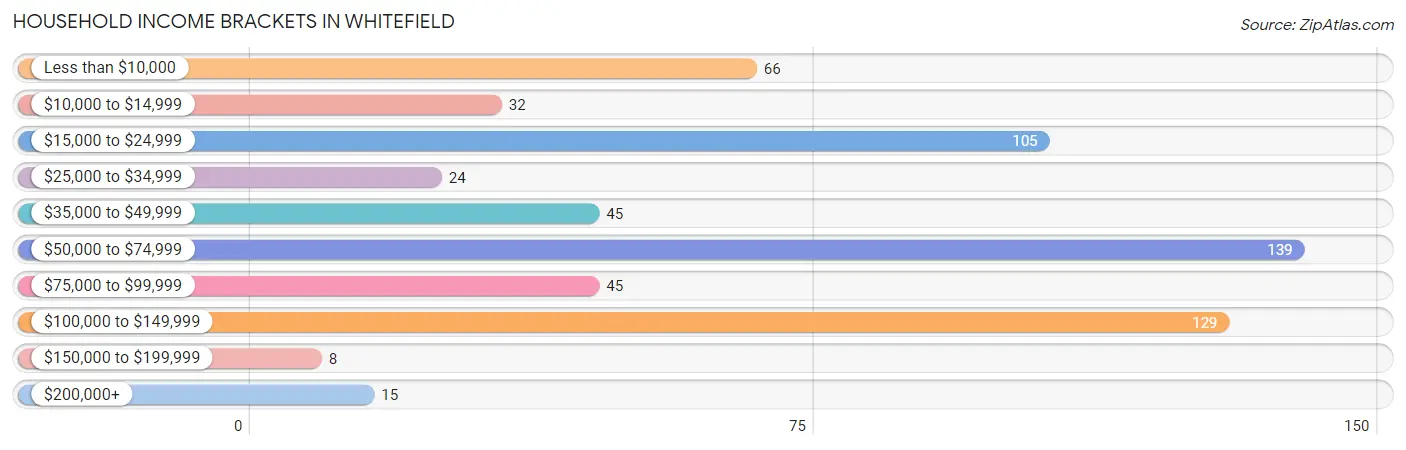
| Income Bracket | # Households | % Households |
| Less than $10,000 | 66 | 10.9% |
| $10,000 to $14,999 | 32 | 5.3% |
| $15,000 to $24,999 | 105 | 17.3% |
| $25,000 to $34,999 | 24 | 3.9% |
| $35,000 to $49,999 | 45 | 7.4% |
| $50,000 to $74,999 | 139 | 22.9% |
| $75,000 to $99,999 | 45 | 7.4% |
| $100,000 to $149,999 | 129 | 21.2% |
| $150,000 to $199,999 | 8 | 1.3% |
| $200,000+ | 15 | 2.5% |
Household Income by Householder Age in Whitefield
The median household income in Whitefield is $53,750, with the highest median household income of $91,500 found in the 45 to 64 years age bracket for the primary householder. A total of 212 households (34.9%) fall into this category. Meanwhile, the 65+ years age bracket for the primary householder has the lowest median household income of $0, with 241 households (39.6%) in this group.
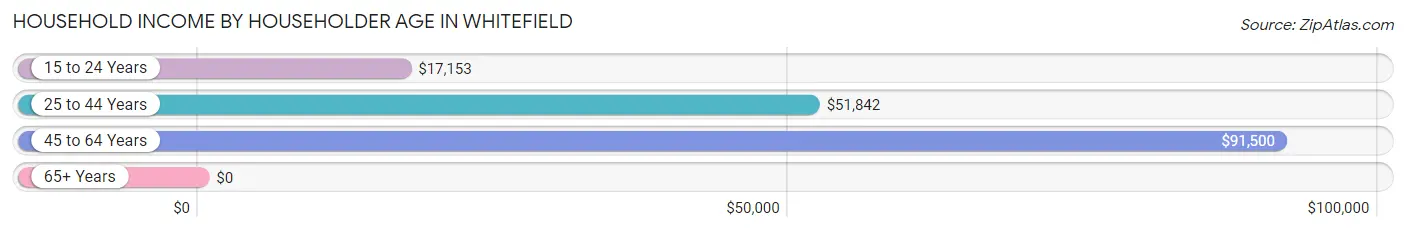
| Income Bracket | # Households | Median Income |
| 15 to 24 Years | 31 (5.1%) | $17,153 |
| 25 to 44 Years | 124 (20.4%) | $51,842 |
| 45 to 64 Years | 212 (34.9%) | $91,500 |
| 65+ Years | 241 (39.6%) | $0 |
| Total | 608 (100.0%) | $53,750 |
Poverty in Whitefield
Income Below Poverty by Sex and Age in Whitefield
With 15.0% poverty level for males and 17.5% for females among the residents of Whitefield, 6 to 11 year old males and 55 to 64 year old females are the most vulnerable to poverty, with 8 males (100.0%) and 32 females (37.7%) in their respective age groups living below the poverty level.
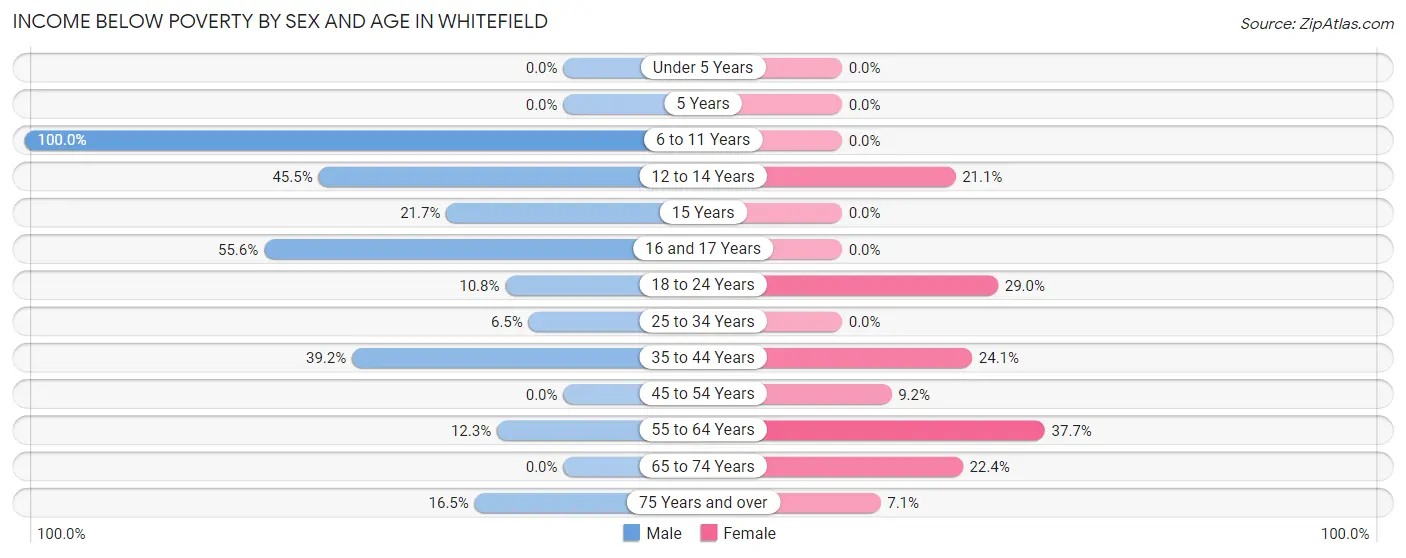
| Age Bracket | Male | Female |
| Under 5 Years | 0 (0.0%) | 0 (0.0%) |
| 5 Years | 0 (0.0%) | 0 (0.0%) |
| 6 to 11 Years | 8 (100.0%) | 0 (0.0%) |
| 12 to 14 Years | 5 (45.5%) | 4 (21.0%) |
| 15 Years | 5 (21.7%) | 0 (0.0%) |
| 16 and 17 Years | 5 (55.6%) | 0 (0.0%) |
| 18 to 24 Years | 7 (10.8%) | 22 (28.9%) |
| 25 to 34 Years | 6 (6.5%) | 0 (0.0%) |
| 35 to 44 Years | 20 (39.2%) | 14 (24.1%) |
| 45 to 54 Years | 0 (0.0%) | 10 (9.2%) |
| 55 to 64 Years | 17 (12.3%) | 32 (37.7%) |
| 65 to 74 Years | 0 (0.0%) | 28 (22.4%) |
| 75 Years and over | 14 (16.5%) | 4 (7.1%) |
| Total | 87 (15.0%) | 114 (17.5%) |
Income Above Poverty by Sex and Age in Whitefield
According to the poverty statistics in Whitefield, males aged 45 to 54 years and females aged under 5 years are the age groups that are most secure financially, with 100.0% of males and 100.0% of females in these age groups living above the poverty line.
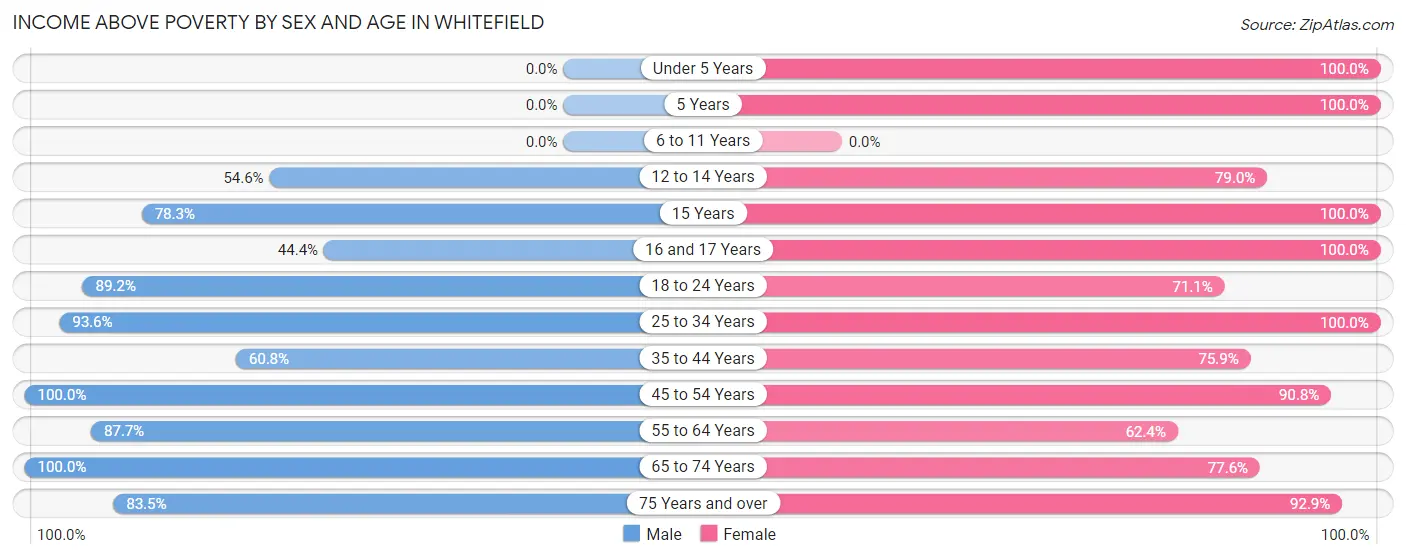
| Age Bracket | Male | Female |
| Under 5 Years | 0 (0.0%) | 39 (100.0%) |
| 5 Years | 0 (0.0%) | 6 (100.0%) |
| 6 to 11 Years | 0 (0.0%) | 0 (0.0%) |
| 12 to 14 Years | 6 (54.5%) | 15 (78.9%) |
| 15 Years | 18 (78.3%) | 6 (100.0%) |
| 16 and 17 Years | 4 (44.4%) | 8 (100.0%) |
| 18 to 24 Years | 58 (89.2%) | 54 (71.1%) |
| 25 to 34 Years | 87 (93.5%) | 63 (100.0%) |
| 35 to 44 Years | 31 (60.8%) | 44 (75.9%) |
| 45 to 54 Years | 49 (100.0%) | 99 (90.8%) |
| 55 to 64 Years | 121 (87.7%) | 53 (62.4%) |
| 65 to 74 Years | 49 (100.0%) | 97 (77.6%) |
| 75 Years and over | 71 (83.5%) | 52 (92.9%) |
| Total | 494 (85.0%) | 536 (82.5%) |
Income Below Poverty Among Married-Couple Families in Whitefield
The poverty statistics for married-couple families in Whitefield show that 3.7% or 9 of the total 246 families live below the poverty line. Families with 1 or 2 children have the highest poverty rate of 6.1%, comprising of 4 families. On the other hand, families with no children have the lowest poverty rate of 2.8%, which includes 5 families.
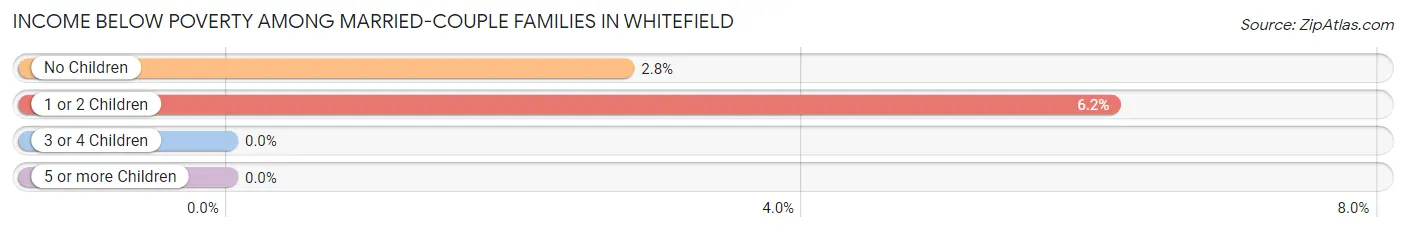
| Children | Above Poverty | Below Poverty |
| No Children | 176 (97.2%) | 5 (2.8%) |
| 1 or 2 Children | 61 (93.9%) | 4 (6.1%) |
| 3 or 4 Children | 0 (0.0%) | 0 (0.0%) |
| 5 or more Children | 0 (0.0%) | 0 (0.0%) |
| Total | 237 (96.3%) | 9 (3.7%) |
Income Below Poverty Among Single-Parent Households in Whitefield
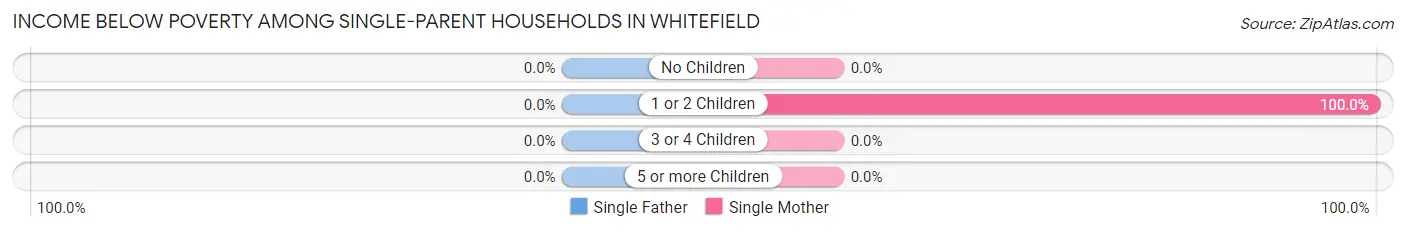
| Children | Single Father | Single Mother |
| No Children | 0 (0.0%) | 0 (0.0%) |
| 1 or 2 Children | 0 (0.0%) | 10 (100.0%) |
| 3 or 4 Children | 0 (0.0%) | 0 (0.0%) |
| 5 or more Children | 0 (0.0%) | 0 (0.0%) |
| Total | 0 (0.0%) | 10 (62.5%) |
Income Below Poverty Among Married-Couple vs Single-Parent Households in Whitefield
The poverty data for Whitefield shows that 9 of the married-couple family households (3.7%) and 10 of the single-parent households (26.3%) are living below the poverty level. Within the married-couple family households, those with 1 or 2 children have the highest poverty rate, with 4 households (6.1%) falling below the poverty line. Among the single-parent households, those with 1 or 2 children have the highest poverty rate, with 10 household (41.7%) living below poverty.
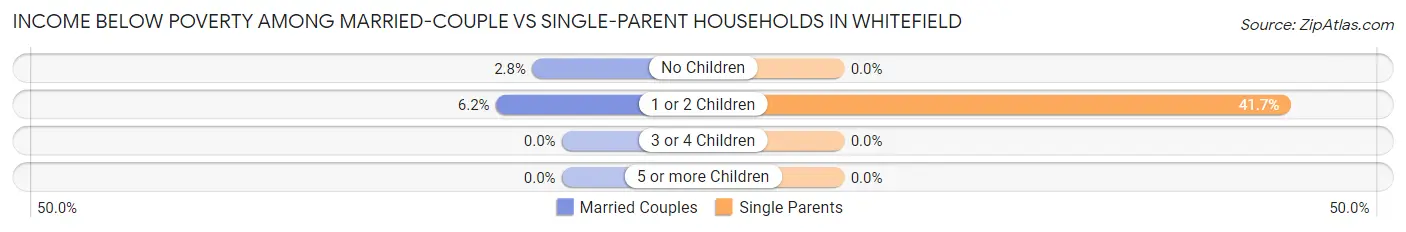
| Children | Married-Couple Families | Single-Parent Households |
| No Children | 5 (2.8%) | 0 (0.0%) |
| 1 or 2 Children | 4 (6.1%) | 10 (41.7%) |
| 3 or 4 Children | 0 (0.0%) | 0 (0.0%) |
| 5 or more Children | 0 (0.0%) | 0 (0.0%) |
| Total | 9 (3.7%) | 10 (26.3%) |
Race in Whitefield
The most populous races in Whitefield are White / Caucasian (1,298 | 97.5%), Hispanic or Latino (18 | 1.3%), and Two or more Races (17 | 1.3%).
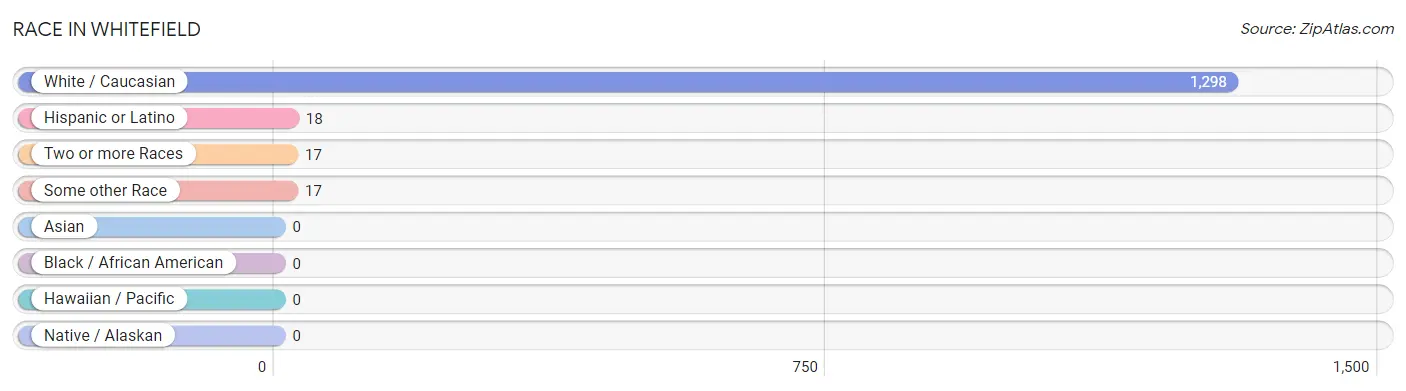
| Race | # Population | % Population |
| Asian | 0 | 0.0% |
| Black / African American | 0 | 0.0% |
| Hawaiian / Pacific | 0 | 0.0% |
| Hispanic or Latino | 18 | 1.3% |
| Native / Alaskan | 0 | 0.0% |
| White / Caucasian | 1,298 | 97.5% |
| Two or more Races | 17 | 1.3% |
| Some other Race | 17 | 1.3% |
| Total | 1,332 | 100.0% |
Ancestry in Whitefield
The most populous ancestries reported in Whitefield are Irish (297 | 22.3%), English (213 | 16.0%), French Canadian (140 | 10.5%), German (112 | 8.4%), and French (104 | 7.8%), together accounting for 65.0% of all Whitefield residents.
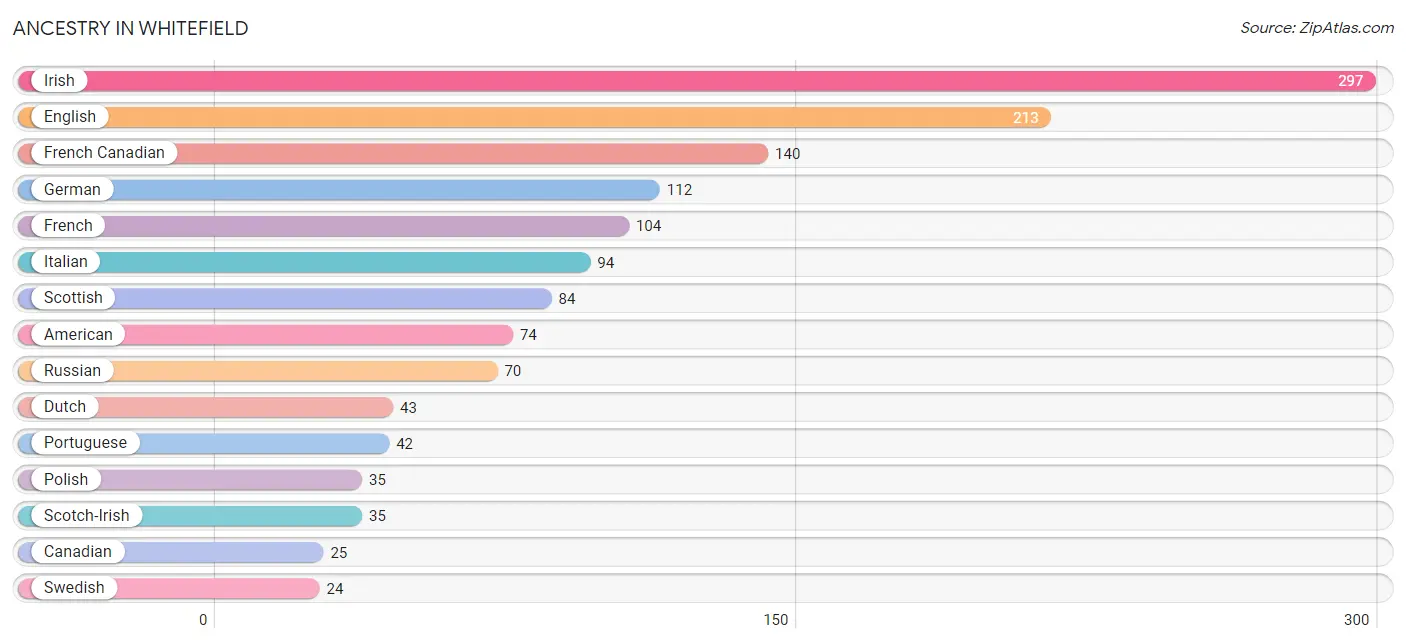
| Ancestry | # Population | % Population |
| American | 74 | 5.6% |
| Brazilian | 17 | 1.3% |
| Burmese | 4 | 0.3% |
| Canadian | 25 | 1.9% |
| Cree | 1 | 0.1% |
| Czech | 5 | 0.4% |
| Dutch | 43 | 3.2% |
| English | 213 | 16.0% |
| European | 9 | 0.7% |
| Finnish | 4 | 0.3% |
| French | 104 | 7.8% |
| French Canadian | 140 | 10.5% |
| German | 112 | 8.4% |
| Irish | 297 | 22.3% |
| Iroquois | 9 | 0.7% |
| Italian | 94 | 7.1% |
| Lithuanian | 15 | 1.1% |
| Norwegian | 16 | 1.2% |
| Polish | 35 | 2.6% |
| Portuguese | 42 | 3.2% |
| Puerto Rican | 17 | 1.3% |
| Russian | 70 | 5.3% |
| Scotch-Irish | 35 | 2.6% |
| Scottish | 84 | 6.3% |
| South American | 1 | 0.1% |
| Swedish | 24 | 1.8% |
| Uruguayan | 1 | 0.1% |
| Welsh | 15 | 1.1% | View All 28 Rows |
Immigrants in Whitefield
The most numerous immigrant groups reported in Whitefield came from Europe (33 | 2.5%), Canada (25 | 1.9%), Germany (17 | 1.3%), Western Europe (17 | 1.3%), and Northern Europe (12 | 0.9%), together accounting for 7.8% of all Whitefield residents.
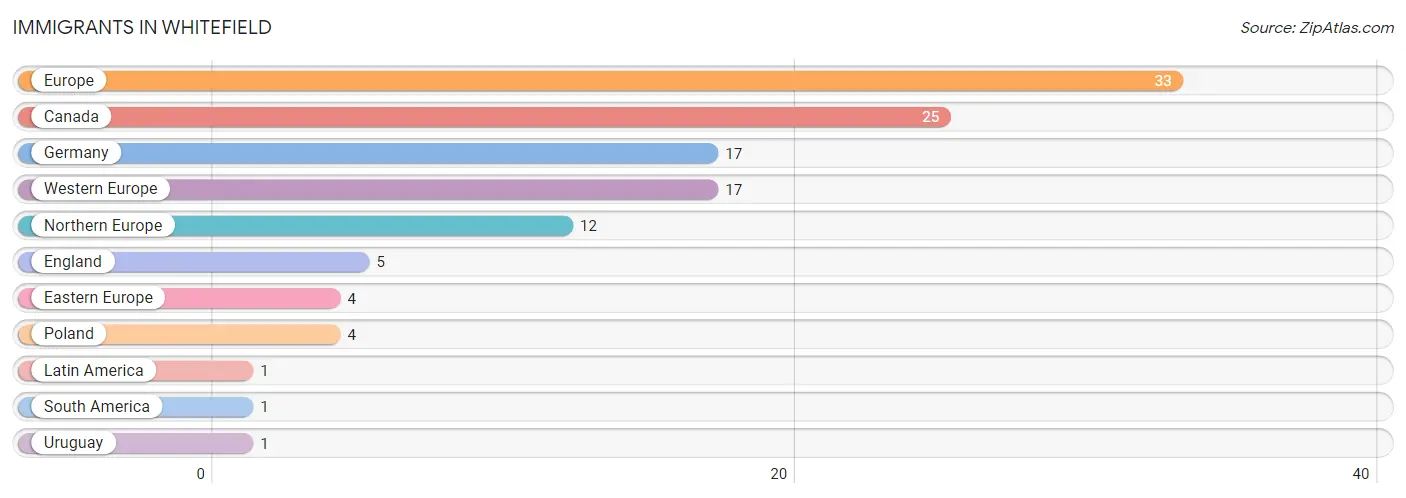
| Immigration Origin | # Population | % Population |
| Canada | 25 | 1.9% |
| Eastern Europe | 4 | 0.3% |
| England | 5 | 0.4% |
| Europe | 33 | 2.5% |
| Germany | 17 | 1.3% |
| Latin America | 1 | 0.1% |
| Northern Europe | 12 | 0.9% |
| Poland | 4 | 0.3% |
| South America | 1 | 0.1% |
| Uruguay | 1 | 0.1% |
| Western Europe | 17 | 1.3% | View All 11 Rows |
Sex and Age in Whitefield
Sex and Age in Whitefield
The most populous age groups in Whitefield are 55 to 59 Years (81 | 13.3%) for men and 50 to 54 Years (100 | 13.8%) for women.
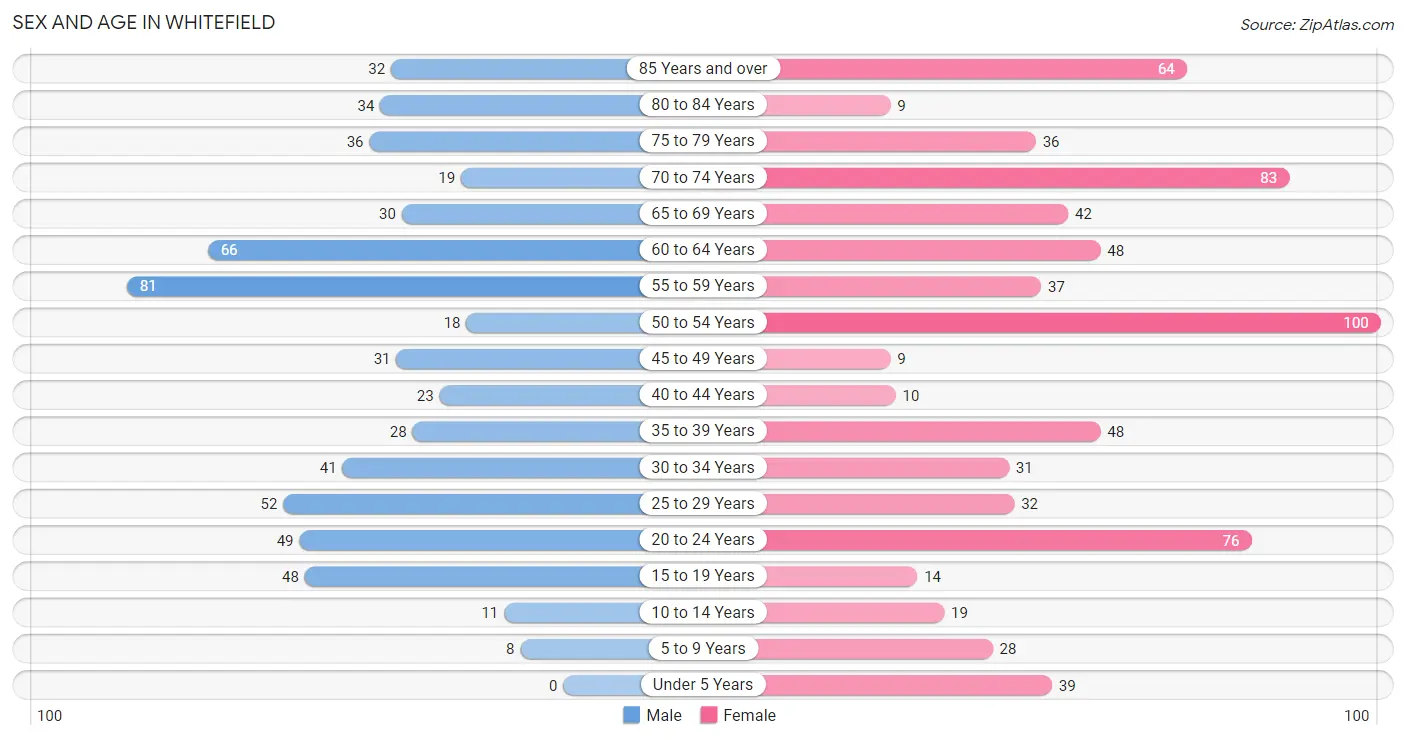
| Age Bracket | Male | Female |
| Under 5 Years | 0 (0.0%) | 39 (5.4%) |
| 5 to 9 Years | 8 (1.3%) | 28 (3.9%) |
| 10 to 14 Years | 11 (1.8%) | 19 (2.6%) |
| 15 to 19 Years | 48 (7.9%) | 14 (1.9%) |
| 20 to 24 Years | 49 (8.1%) | 76 (10.5%) |
| 25 to 29 Years | 52 (8.6%) | 32 (4.4%) |
| 30 to 34 Years | 41 (6.8%) | 31 (4.3%) |
| 35 to 39 Years | 28 (4.6%) | 48 (6.6%) |
| 40 to 44 Years | 23 (3.8%) | 10 (1.4%) |
| 45 to 49 Years | 31 (5.1%) | 9 (1.2%) |
| 50 to 54 Years | 18 (3.0%) | 100 (13.8%) |
| 55 to 59 Years | 81 (13.3%) | 37 (5.1%) |
| 60 to 64 Years | 66 (10.9%) | 48 (6.6%) |
| 65 to 69 Years | 30 (4.9%) | 42 (5.8%) |
| 70 to 74 Years | 19 (3.1%) | 83 (11.5%) |
| 75 to 79 Years | 36 (5.9%) | 36 (5.0%) |
| 80 to 84 Years | 34 (5.6%) | 9 (1.2%) |
| 85 Years and over | 32 (5.3%) | 64 (8.8%) |
| Total | 607 (100.0%) | 725 (100.0%) |
Families and Households in Whitefield
Median Family Size in Whitefield
The median family size in Whitefield is 2.72 persons per family, with married-couple families (246 | 86.6%) accounting for the largest median family size of 2.81 persons per family. On the other hand, single male/father families (22 | 7.7%) represent the smallest median family size with 1.91 persons per family.
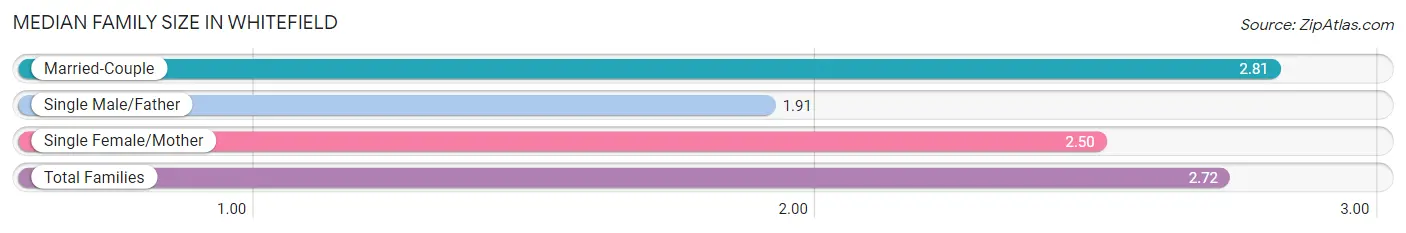
| Family Type | # Families | Family Size |
| Married-Couple | 246 (86.6%) | 2.81 |
| Single Male/Father | 22 (7.7%) | 1.91 |
| Single Female/Mother | 16 (5.6%) | 2.50 |
| Total Families | 284 (100.0%) | 2.72 |
Median Household Size in Whitefield
The median household size in Whitefield is 2.06 persons per household, with married-couple households (246 | 40.5%) accounting for the largest median household size of 3.06 persons per household. non-family households (324 | 53.3%) represent the smallest median household size with 1.23 persons per household.
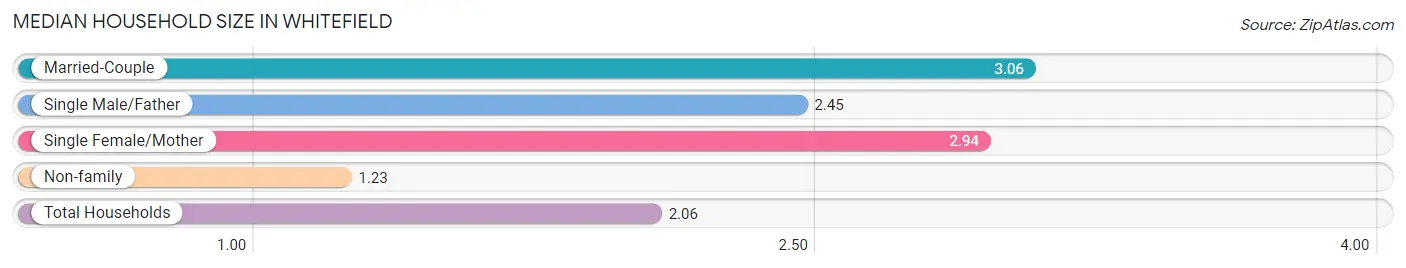
| Household Type | # Households | Household Size |
| Married-Couple | 246 (40.5%) | 3.06 |
| Single Male/Father | 22 (3.6%) | 2.45 |
| Single Female/Mother | 16 (2.6%) | 2.94 |
| Non-family | 324 (53.3%) | 1.23 |
| Total Households | 608 (100.0%) | 2.06 |
Household Size by Marriage Status in Whitefield
Out of a total of 608 households in Whitefield, 284 (46.7%) are family households, while 324 (53.3%) are nonfamily households. The most numerous type of family households are 2-person households, comprising 129, and the most common type of nonfamily households are 1-person households, comprising 262.
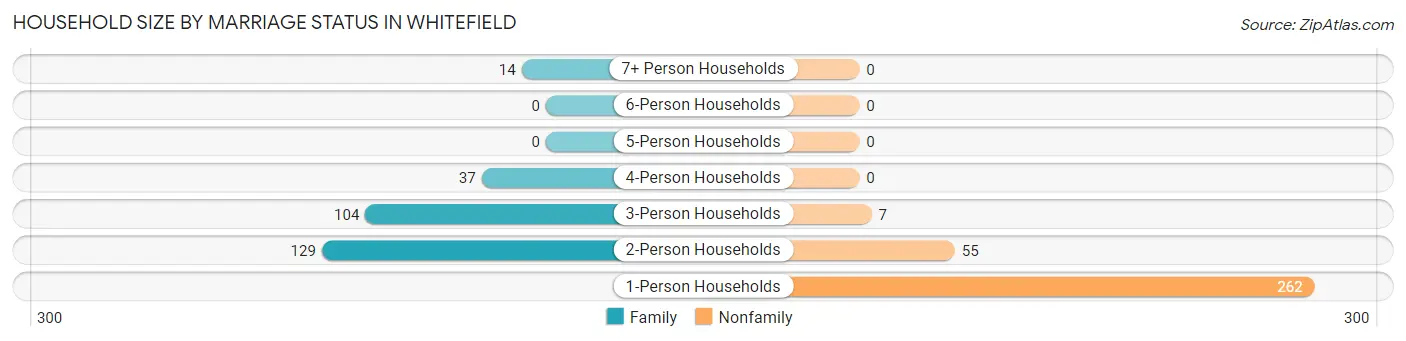
| Household Size | Family Households | Nonfamily Households |
| 1-Person Households | - | 262 (43.1%) |
| 2-Person Households | 129 (21.2%) | 55 (9.0%) |
| 3-Person Households | 104 (17.1%) | 7 (1.1%) |
| 4-Person Households | 37 (6.1%) | 0 (0.0%) |
| 5-Person Households | 0 (0.0%) | 0 (0.0%) |
| 6-Person Households | 0 (0.0%) | 0 (0.0%) |
| 7+ Person Households | 14 (2.3%) | 0 (0.0%) |
| Total | 284 (46.7%) | 324 (53.3%) |
Female Fertility in Whitefield
Fertility by Age in Whitefield
| Age Bracket | Women with Births | Births / 1,000 Women |
| 15 to 19 years | 0 (0.0%) | 0.0 |
| 20 to 34 years | 0 (0.0%) | 0.0 |
| 35 to 50 years | 0 (0.0%) | 0.0 |
| Total | 0 (0.0%) | 0.0 |
Fertility by Age by Marriage Status in Whitefield
| Age Bracket | Married | Unmarried |
| 15 to 19 years | 0 (0.0%) | 0 (0.0%) |
| 20 to 34 years | 0 (0.0%) | 0 (0.0%) |
| 35 to 50 years | 0 (0.0%) | 0 (0.0%) |
| Total | 0 (0.0%) | 0 (0.0%) |
Fertility by Education in Whitefield
| Educational Attainment | Women with Births | Births / 1,000 Women |
| Less than High School | 0 (0.0%) | 0.0 |
| High School Diploma | 0 (0.0%) | 0.0 |
| College or Associate's Degree | 0 (0.0%) | 0.0 |
| Bachelor's Degree | 0 (0.0%) | 0.0 |
| Graduate Degree | 0 (0.0%) | 0.0 |
| Total | 0 (0.0%) | 0.0 |
Fertility by Education by Marriage Status in Whitefield
| Educational Attainment | Married | Unmarried |
| Less than High School | 0 (0.0%) | 0 (0.0%) |
| High School Diploma | 0 (0.0%) | 0 (0.0%) |
| College or Associate's Degree | 0 (0.0%) | 0 (0.0%) |
| Bachelor's Degree | 0 (0.0%) | 0 (0.0%) |
| Graduate Degree | 0 (0.0%) | 0 (0.0%) |
| Total | 0 (0.0%) | 0 (0.0%) |
Employment Characteristics in Whitefield
Employment by Class of Employer in Whitefield
Among the 652 employed individuals in Whitefield, private company employees (373 | 57.2%), local government employees (91 | 14.0%), and not-for-profit organizations (79 | 12.1%) make up the most common classes of employment.
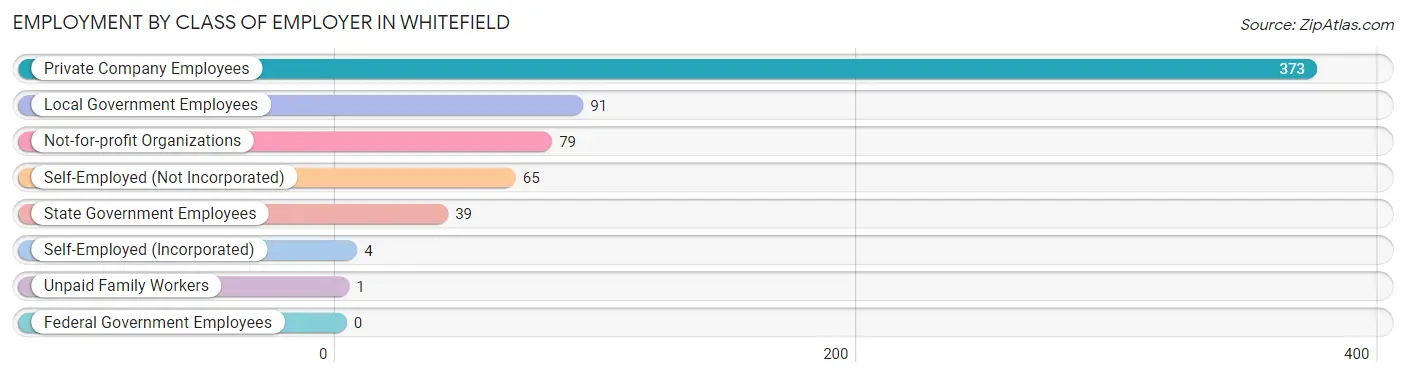
| Employer Class | # Employees | % Employees |
| Private Company Employees | 373 | 57.2% |
| Self-Employed (Incorporated) | 4 | 0.6% |
| Self-Employed (Not Incorporated) | 65 | 10.0% |
| Not-for-profit Organizations | 79 | 12.1% |
| Local Government Employees | 91 | 14.0% |
| State Government Employees | 39 | 6.0% |
| Federal Government Employees | 0 | 0.0% |
| Unpaid Family Workers | 1 | 0.2% |
| Total | 652 | 100.0% |
Employment Status by Age in Whitefield
According to the labor force statistics for Whitefield, out of the total population over 16 years of age (1,198), 58.5% or 701 individuals are in the labor force, with 5.1% or 36 of them unemployed. The age group with the highest labor force participation rate is 20 to 24 years, with 100.0% or 125 individuals in the labor force. Within the labor force, the 35 to 44 years age range has the highest percentage of unemployed individuals, with 15.2% or 15 of them being unemployed.
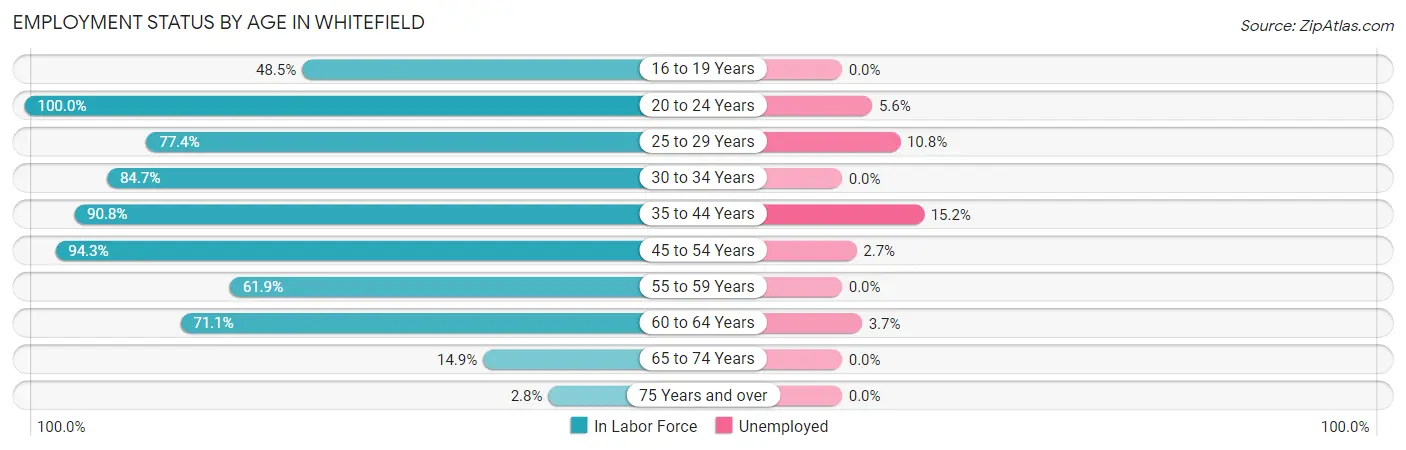
| Age Bracket | In Labor Force | Unemployed |
| 16 to 19 Years | 16 (48.5%) | 0 (0.0%) |
| 20 to 24 Years | 125 (100.0%) | 7 (5.6%) |
| 25 to 29 Years | 65 (77.4%) | 7 (10.8%) |
| 30 to 34 Years | 61 (84.7%) | 0 (0.0%) |
| 35 to 44 Years | 99 (90.8%) | 15 (15.2%) |
| 45 to 54 Years | 149 (94.3%) | 4 (2.7%) |
| 55 to 59 Years | 73 (61.9%) | 0 (0.0%) |
| 60 to 64 Years | 81 (71.1%) | 3 (3.7%) |
| 65 to 74 Years | 26 (14.9%) | 0 (0.0%) |
| 75 Years and over | 6 (2.8%) | 0 (0.0%) |
| Total | 701 (58.5%) | 36 (5.1%) |
Employment Status by Educational Attainment in Whitefield
According to labor force statistics for Whitefield, 80.6% of individuals (528) out of the total population between 25 and 64 years of age (655) are in the labor force, with 5.5% or 29 of them being unemployed. The group with the highest labor force participation rate are those with the educational attainment of college / associate degree, with 95.3% or 203 individuals in the labor force. Within the labor force, individuals with college / associate degree education have the highest percentage of unemployment, with 9.4% or 19 of them being unemployed.
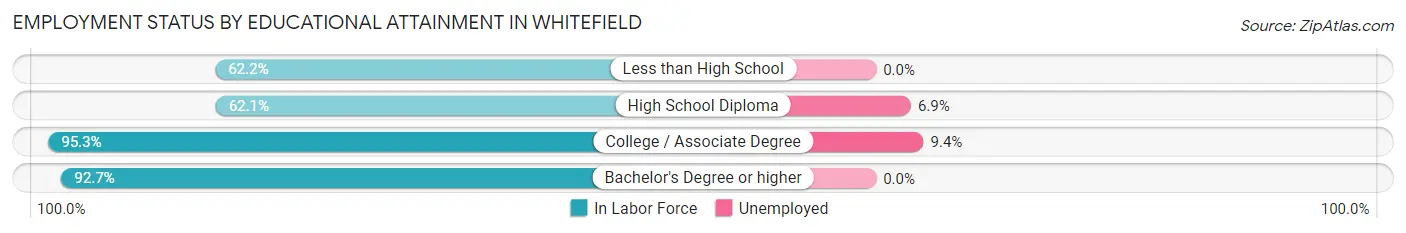
| Educational Attainment | In Labor Force | Unemployed |
| Less than High School | 28 (62.2%) | 0 (0.0%) |
| High School Diploma | 144 (62.1%) | 16 (6.9%) |
| College / Associate Degree | 203 (95.3%) | 20 (9.4%) |
| Bachelor's Degree or higher | 153 (92.7%) | 0 (0.0%) |
| Total | 528 (80.6%) | 36 (5.5%) |
Employment Occupations by Sex in Whitefield
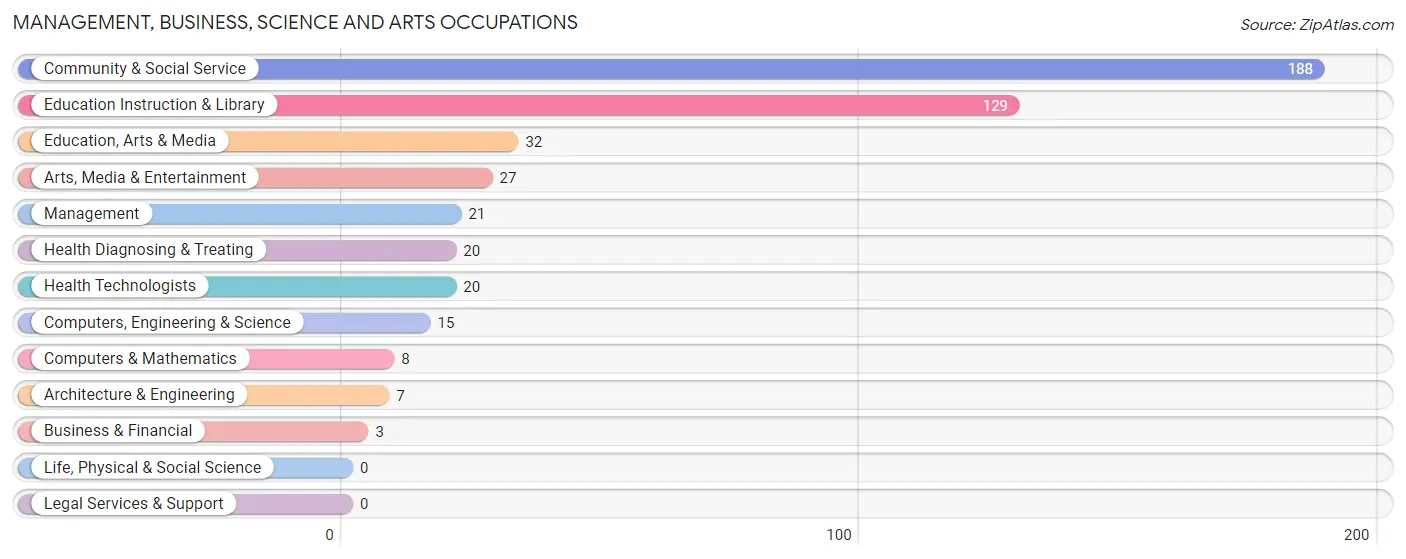
Management, Business, Science and Arts Occupations
The most common Management, Business, Science and Arts occupations in Whitefield are Community & Social Service (188 | 28.3%), Education Instruction & Library (129 | 19.4%), Education, Arts & Media (32 | 4.8%), Arts, Media & Entertainment (27 | 4.1%), and Management (21 | 3.2%).
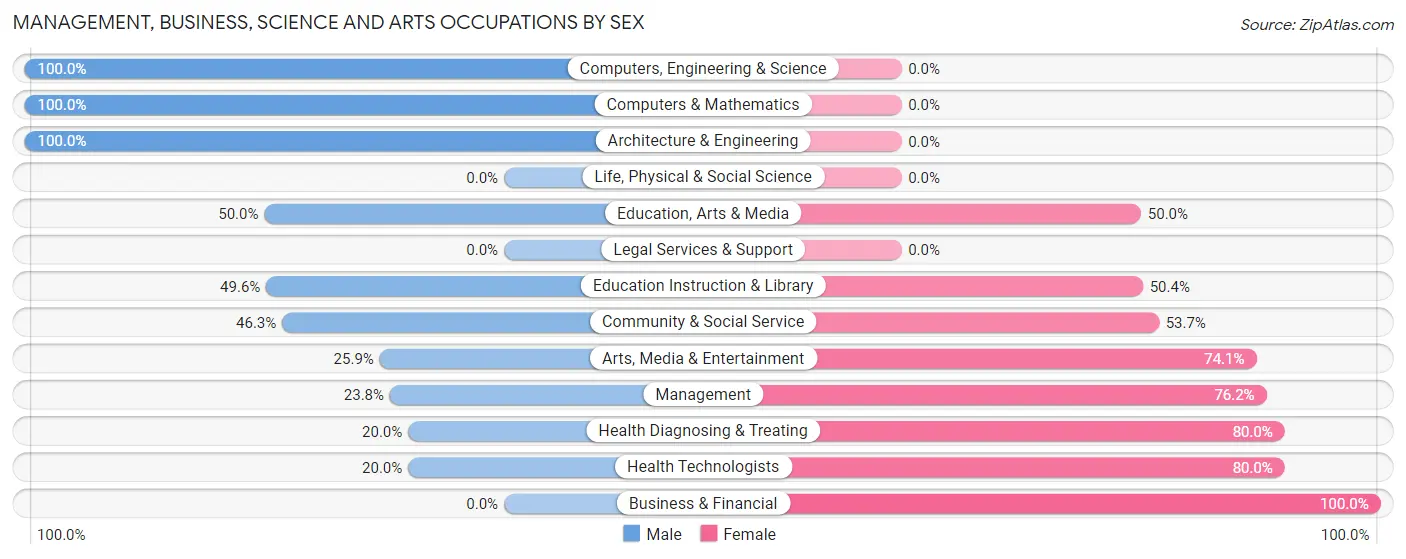
Management, Business, Science and Arts Occupations by Sex
Within the Management, Business, Science and Arts occupations in Whitefield, the most male-oriented occupations are Computers, Engineering & Science (100.0%), Computers & Mathematics (100.0%), and Architecture & Engineering (100.0%), while the most female-oriented occupations are Business & Financial (100.0%), Health Diagnosing & Treating (80.0%), and Health Technologists (80.0%).
| Occupation | Male | Female |
| Management | 5 (23.8%) | 16 (76.2%) |
| Business & Financial | 0 (0.0%) | 3 (100.0%) |
| Computers, Engineering & Science | 15 (100.0%) | 0 (0.0%) |
| Computers & Mathematics | 8 (100.0%) | 0 (0.0%) |
| Architecture & Engineering | 7 (100.0%) | 0 (0.0%) |
| Life, Physical & Social Science | 0 (0.0%) | 0 (0.0%) |
| Community & Social Service | 87 (46.3%) | 101 (53.7%) |
| Education, Arts & Media | 16 (50.0%) | 16 (50.0%) |
| Legal Services & Support | 0 (0.0%) | 0 (0.0%) |
| Education Instruction & Library | 64 (49.6%) | 65 (50.4%) |
| Arts, Media & Entertainment | 7 (25.9%) | 20 (74.1%) |
| Health Diagnosing & Treating | 4 (20.0%) | 16 (80.0%) |
| Health Technologists | 4 (20.0%) | 16 (80.0%) |
| Total (Category) | 111 (44.9%) | 136 (55.1%) |
| Total (Overall) | 320 (48.1%) | 345 (51.9%) |
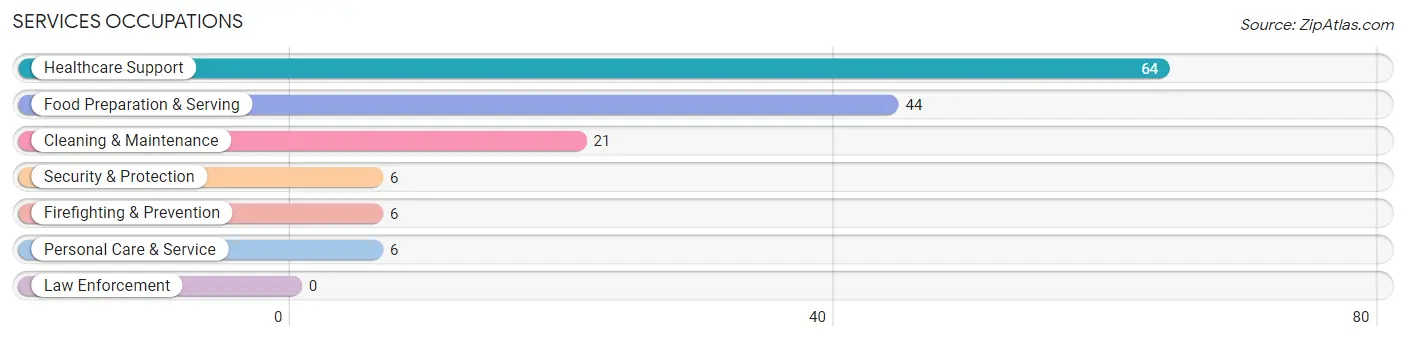
Services Occupations
The most common Services occupations in Whitefield are Healthcare Support (64 | 9.6%), Food Preparation & Serving (44 | 6.6%), Cleaning & Maintenance (21 | 3.2%), Security & Protection (6 | 0.9%), and Firefighting & Prevention (6 | 0.9%).
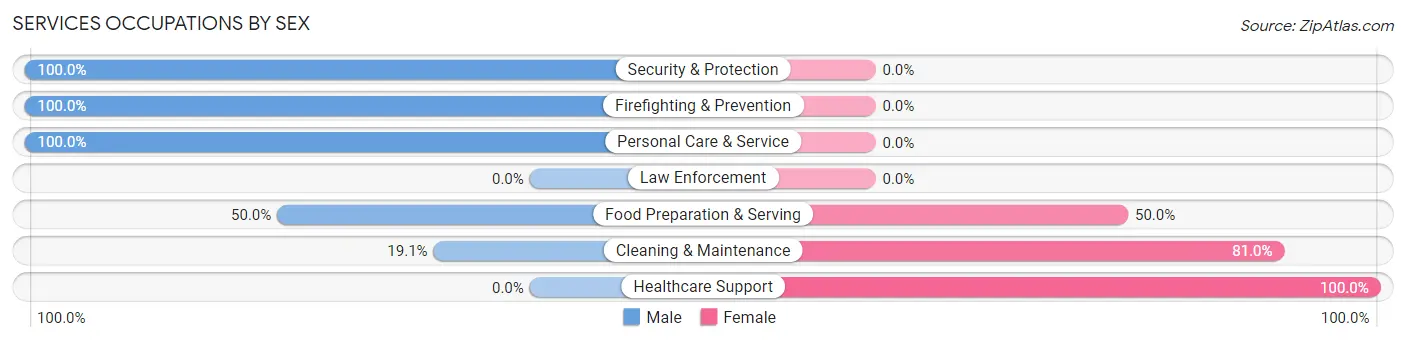
Services Occupations by Sex
Within the Services occupations in Whitefield, the most male-oriented occupations are Security & Protection (100.0%), Firefighting & Prevention (100.0%), and Personal Care & Service (100.0%), while the most female-oriented occupations are Healthcare Support (100.0%), Cleaning & Maintenance (80.9%), and Food Preparation & Serving (50.0%).
| Occupation | Male | Female |
| Healthcare Support | 0 (0.0%) | 64 (100.0%) |
| Security & Protection | 6 (100.0%) | 0 (0.0%) |
| Firefighting & Prevention | 6 (100.0%) | 0 (0.0%) |
| Law Enforcement | 0 (0.0%) | 0 (0.0%) |
| Food Preparation & Serving | 22 (50.0%) | 22 (50.0%) |
| Cleaning & Maintenance | 4 (19.1%) | 17 (80.9%) |
| Personal Care & Service | 6 (100.0%) | 0 (0.0%) |
| Total (Category) | 38 (27.0%) | 103 (73.1%) |
| Total (Overall) | 320 (48.1%) | 345 (51.9%) |
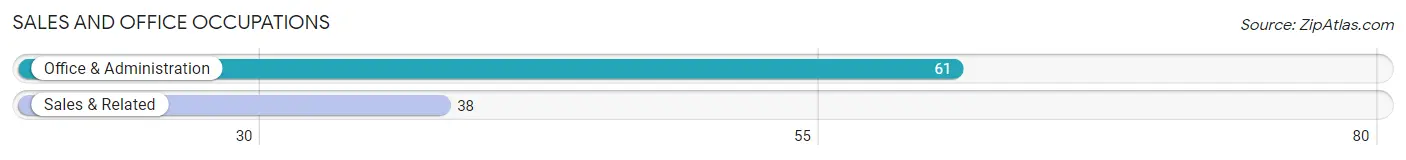
Sales and Office Occupations
The most common Sales and Office occupations in Whitefield are Office & Administration (61 | 9.2%), and Sales & Related (38 | 5.7%).
Sales and Office Occupations by Sex
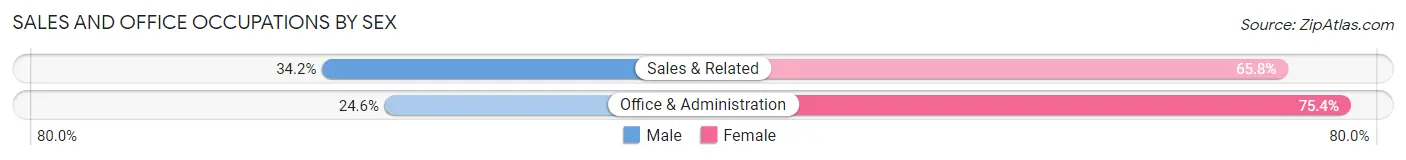
| Occupation | Male | Female |
| Sales & Related | 13 (34.2%) | 25 (65.8%) |
| Office & Administration | 15 (24.6%) | 46 (75.4%) |
| Total (Category) | 28 (28.3%) | 71 (71.7%) |
| Total (Overall) | 320 (48.1%) | 345 (51.9%) |
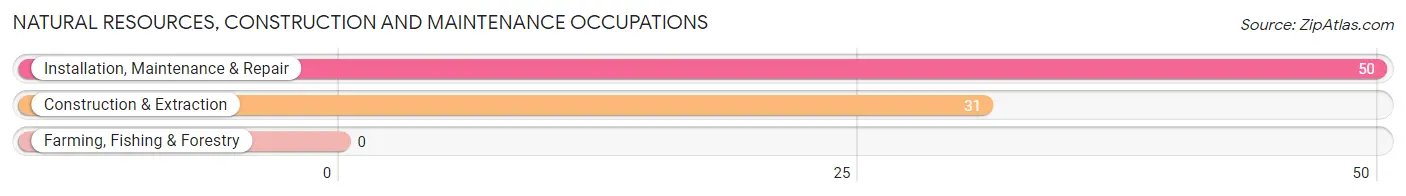
Natural Resources, Construction and Maintenance Occupations
The most common Natural Resources, Construction and Maintenance occupations in Whitefield are Installation, Maintenance & Repair (50 | 7.5%), and Construction & Extraction (31 | 4.7%).
Natural Resources, Construction and Maintenance Occupations by Sex
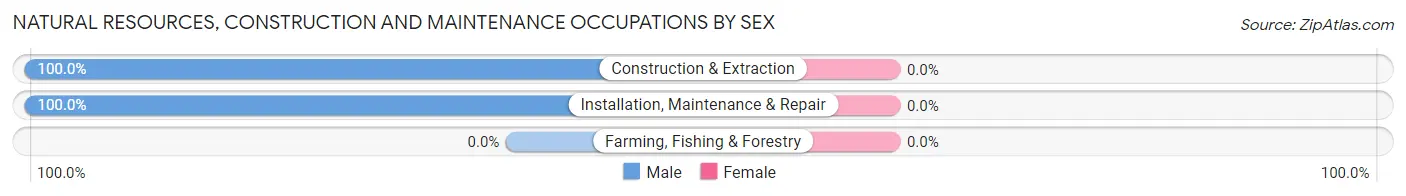
| Occupation | Male | Female |
| Farming, Fishing & Forestry | 0 (0.0%) | 0 (0.0%) |
| Construction & Extraction | 31 (100.0%) | 0 (0.0%) |
| Installation, Maintenance & Repair | 50 (100.0%) | 0 (0.0%) |
| Total (Category) | 81 (100.0%) | 0 (0.0%) |
| Total (Overall) | 320 (48.1%) | 345 (51.9%) |
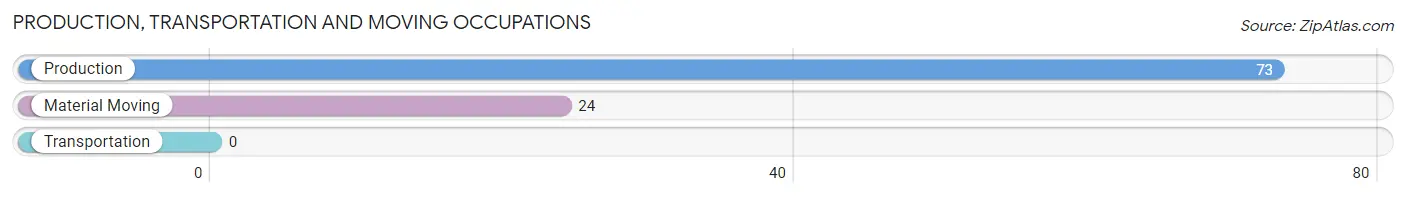
Production, Transportation and Moving Occupations
The most common Production, Transportation and Moving occupations in Whitefield are Production (73 | 11.0%), and Material Moving (24 | 3.6%).
Production, Transportation and Moving Occupations by Sex
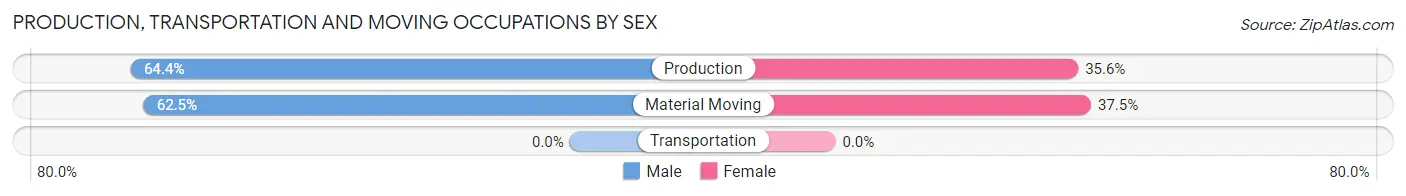
| Occupation | Male | Female |
| Production | 47 (64.4%) | 26 (35.6%) |
| Transportation | 0 (0.0%) | 0 (0.0%) |
| Material Moving | 15 (62.5%) | 9 (37.5%) |
| Total (Category) | 62 (63.9%) | 35 (36.1%) |
| Total (Overall) | 320 (48.1%) | 345 (51.9%) |
Employment Industries by Sex in Whitefield
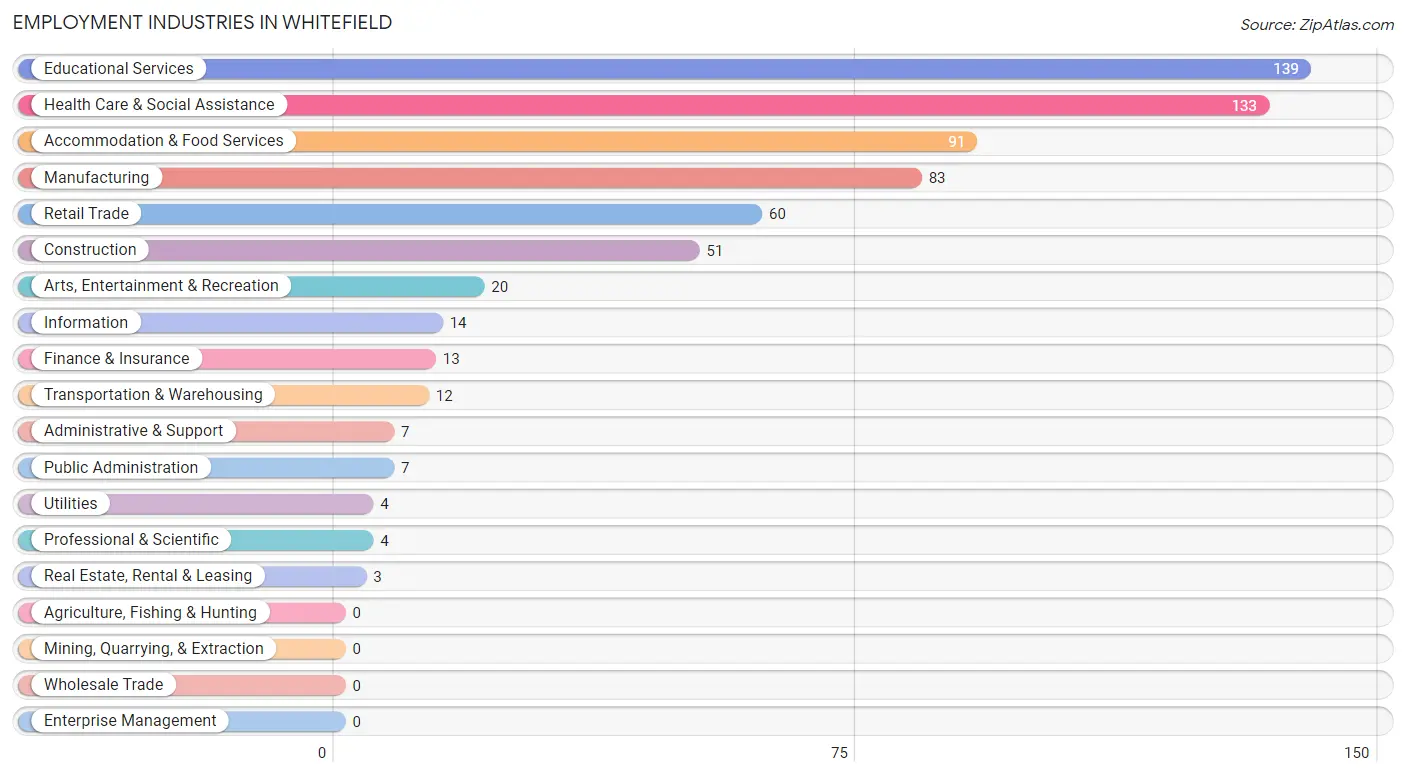
Employment Industries in Whitefield
The major employment industries in Whitefield include Educational Services (139 | 20.9%), Health Care & Social Assistance (133 | 20.0%), Accommodation & Food Services (91 | 13.7%), Manufacturing (83 | 12.5%), and Retail Trade (60 | 9.0%).
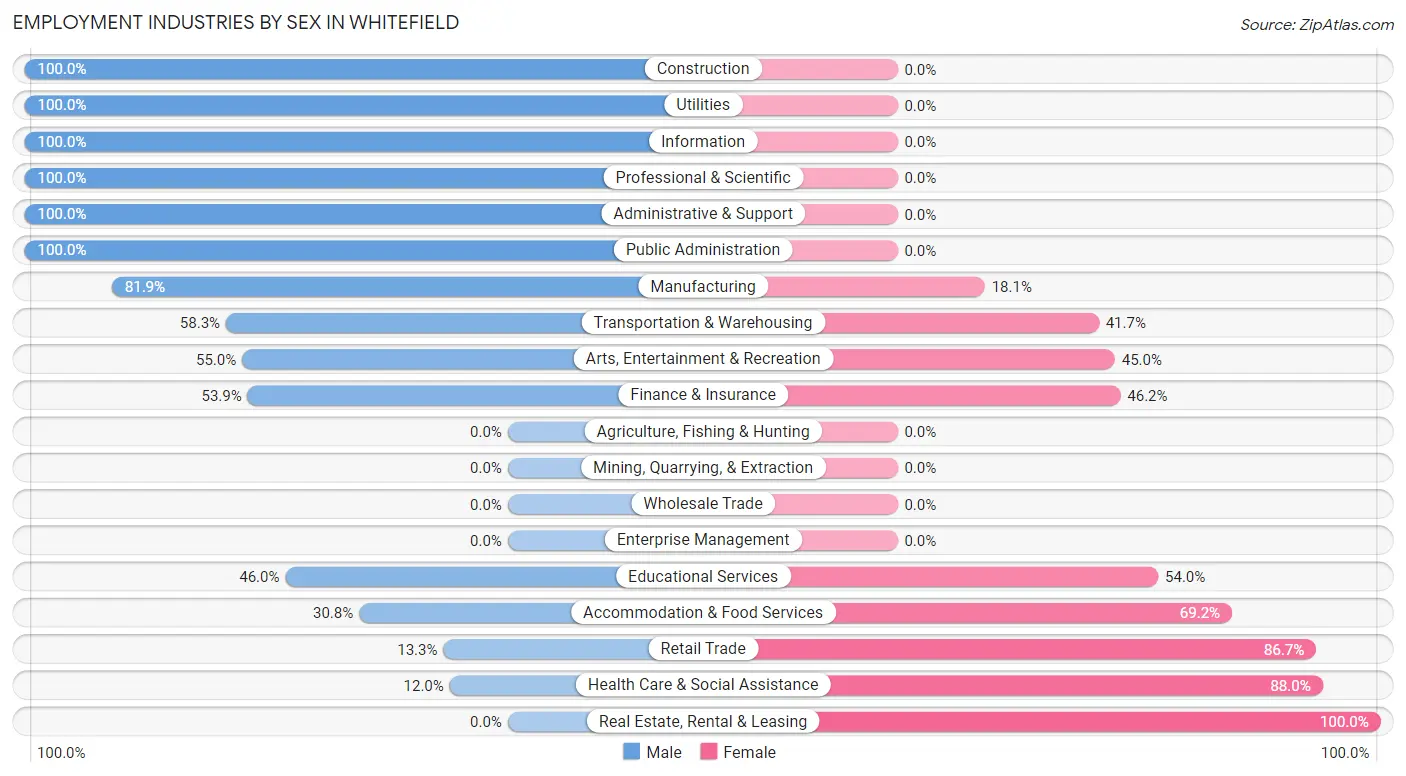
Employment Industries by Sex in Whitefield
The Whitefield industries that see more men than women are Construction (100.0%), Utilities (100.0%), and Information (100.0%), whereas the industries that tend to have a higher number of women are Real Estate, Rental & Leasing (100.0%), Health Care & Social Assistance (88.0%), and Retail Trade (86.7%).
| Industry | Male | Female |
| Agriculture, Fishing & Hunting | 0 (0.0%) | 0 (0.0%) |
| Mining, Quarrying, & Extraction | 0 (0.0%) | 0 (0.0%) |
| Construction | 51 (100.0%) | 0 (0.0%) |
| Manufacturing | 68 (81.9%) | 15 (18.1%) |
| Wholesale Trade | 0 (0.0%) | 0 (0.0%) |
| Retail Trade | 8 (13.3%) | 52 (86.7%) |
| Transportation & Warehousing | 7 (58.3%) | 5 (41.7%) |
| Utilities | 4 (100.0%) | 0 (0.0%) |
| Information | 14 (100.0%) | 0 (0.0%) |
| Finance & Insurance | 7 (53.8%) | 6 (46.2%) |
| Real Estate, Rental & Leasing | 0 (0.0%) | 3 (100.0%) |
| Professional & Scientific | 4 (100.0%) | 0 (0.0%) |
| Enterprise Management | 0 (0.0%) | 0 (0.0%) |
| Administrative & Support | 7 (100.0%) | 0 (0.0%) |
| Educational Services | 64 (46.0%) | 75 (54.0%) |
| Health Care & Social Assistance | 16 (12.0%) | 117 (88.0%) |
| Arts, Entertainment & Recreation | 11 (55.0%) | 9 (45.0%) |
| Accommodation & Food Services | 28 (30.8%) | 63 (69.2%) |
| Public Administration | 7 (100.0%) | 0 (0.0%) |
| Total | 320 (48.1%) | 345 (51.9%) |
Education in Whitefield
School Enrollment in Whitefield
The most common levels of schooling among the 304 students in Whitefield are college / undergraduate (102 | 33.6%), graduate / professional (90 | 29.6%), and high school (50 | 16.5%).
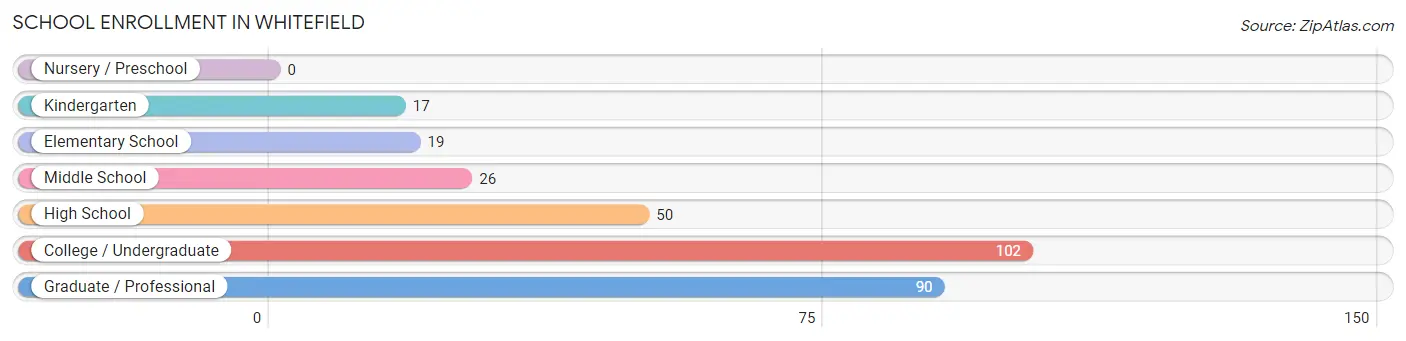
| School Level | # Students | % Students |
| Nursery / Preschool | 0 | 0.0% |
| Kindergarten | 17 | 5.6% |
| Elementary School | 19 | 6.2% |
| Middle School | 26 | 8.6% |
| High School | 50 | 16.5% |
| College / Undergraduate | 102 | 33.6% |
| Graduate / Professional | 90 | 29.6% |
| Total | 304 | 100.0% |
School Enrollment by Age by Funding Source in Whitefield
Out of a total of 304 students who are enrolled in schools in Whitefield, 59 (19.4%) attend a private institution, while the remaining 245 (80.6%) are enrolled in public schools. The age group of 25 to 34 year olds has the highest likelihood of being enrolled in private schools, with 16 (30.8% in the age bracket) enrolled. Conversely, the age group of 20 to 24 year olds has the lowest likelihood of being enrolled in a private school, with 67 (93.1% in the age bracket) attending a public institution.
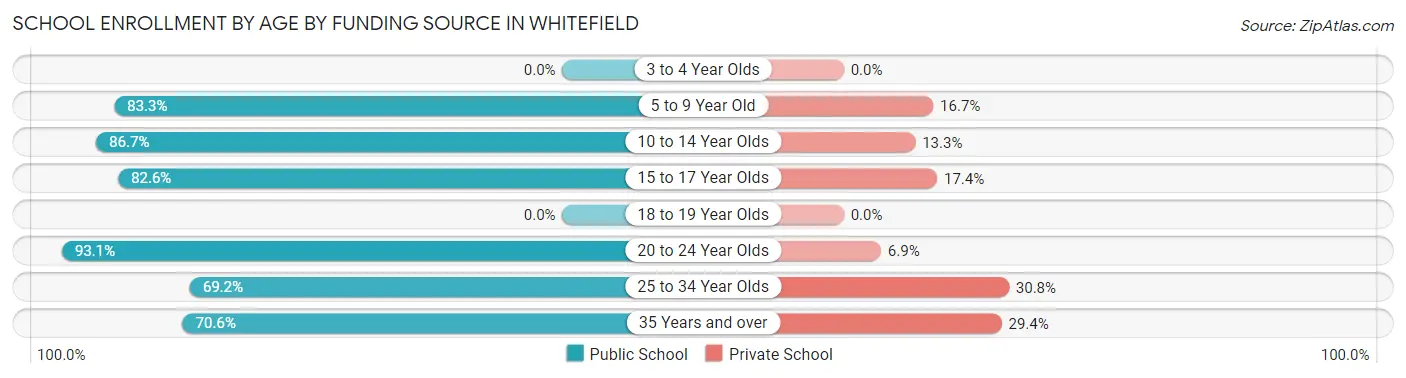
| Age Bracket | Public School | Private School |
| 3 to 4 Year Olds | 0 (0.0%) | 0 (0.0%) |
| 5 to 9 Year Old | 30 (83.3%) | 6 (16.7%) |
| 10 to 14 Year Olds | 26 (86.7%) | 4 (13.3%) |
| 15 to 17 Year Olds | 38 (82.6%) | 8 (17.4%) |
| 18 to 19 Year Olds | 0 (0.0%) | 0 (0.0%) |
| 20 to 24 Year Olds | 67 (93.1%) | 5 (6.9%) |
| 25 to 34 Year Olds | 36 (69.2%) | 16 (30.8%) |
| 35 Years and over | 48 (70.6%) | 20 (29.4%) |
| Total | 245 (80.6%) | 59 (19.4%) |
Educational Attainment by Field of Study in Whitefield
Education (62 | 20.1%), bio, nature & agricultural (54 | 17.5%), liberal arts & history (34 | 11.0%), literature & languages (27 | 8.8%), and visual & performing arts (24 | 7.8%) are the most common fields of study among 308 individuals in Whitefield who have obtained a bachelor's degree or higher.
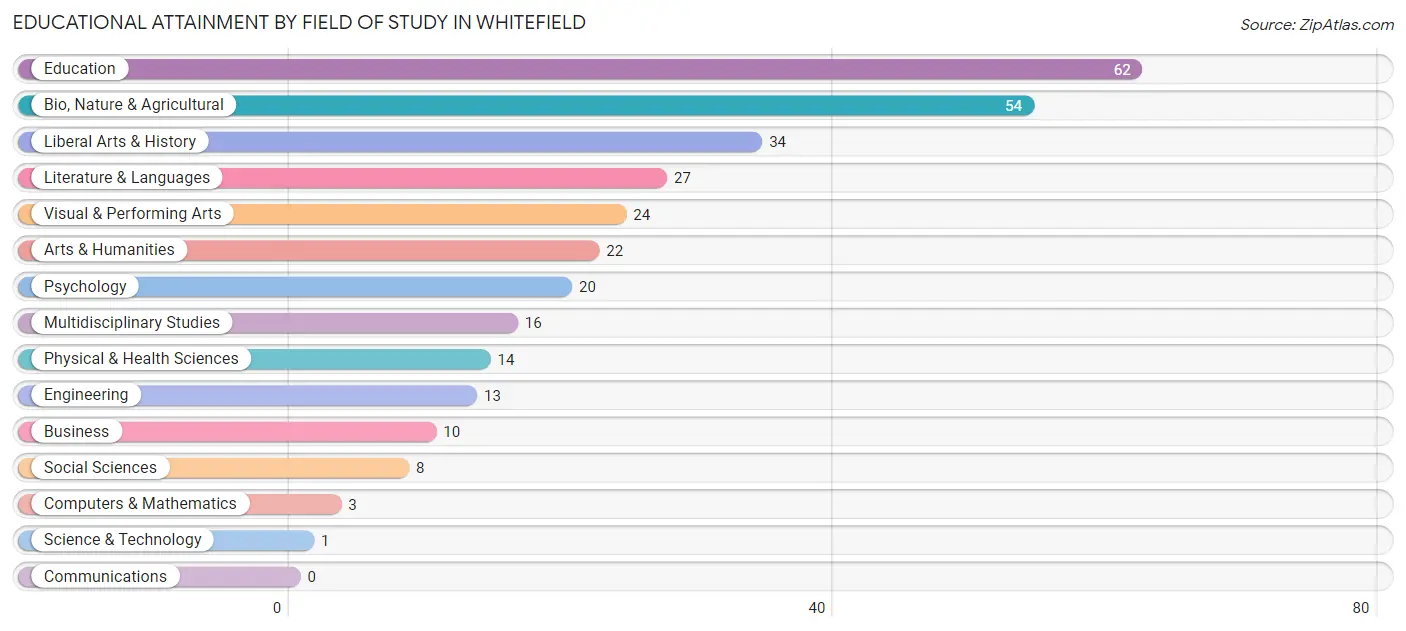
| Field of Study | # Graduates | % Graduates |
| Computers & Mathematics | 3 | 1.0% |
| Bio, Nature & Agricultural | 54 | 17.5% |
| Physical & Health Sciences | 14 | 4.5% |
| Psychology | 20 | 6.5% |
| Social Sciences | 8 | 2.6% |
| Engineering | 13 | 4.2% |
| Multidisciplinary Studies | 16 | 5.2% |
| Science & Technology | 1 | 0.3% |
| Business | 10 | 3.3% |
| Education | 62 | 20.1% |
| Literature & Languages | 27 | 8.8% |
| Liberal Arts & History | 34 | 11.0% |
| Visual & Performing Arts | 24 | 7.8% |
| Communications | 0 | 0.0% |
| Arts & Humanities | 22 | 7.1% |
| Total | 308 | 100.0% |
Transportation & Commute in Whitefield
Vehicle Availability by Sex in Whitefield
The most prevalent vehicle ownership categories in Whitefield are males with 1 vehicle (114, accounting for 35.6%) and females with 1 vehicle (59, making up 34.3%).
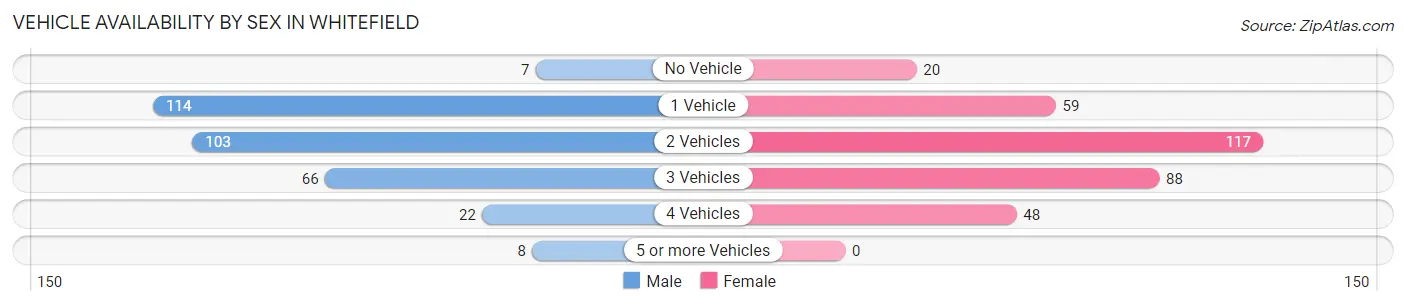
| Vehicles Available | Male | Female |
| No Vehicle | 7 (2.2%) | 20 (6.0%) |
| 1 Vehicle | 114 (35.6%) | 59 (17.8%) |
| 2 Vehicles | 103 (32.2%) | 117 (35.2%) |
| 3 Vehicles | 66 (20.6%) | 88 (26.5%) |
| 4 Vehicles | 22 (6.9%) | 48 (14.5%) |
| 5 or more Vehicles | 8 (2.5%) | 0 (0.0%) |
| Total | 320 (100.0%) | 332 (100.0%) |
Commute Time in Whitefield
The most frequently occuring commute durations in Whitefield are 20 to 24 minutes (135 commuters, 21.5%), 30 to 34 minutes (98 commuters, 15.6%), and 15 to 19 minutes (74 commuters, 11.8%).
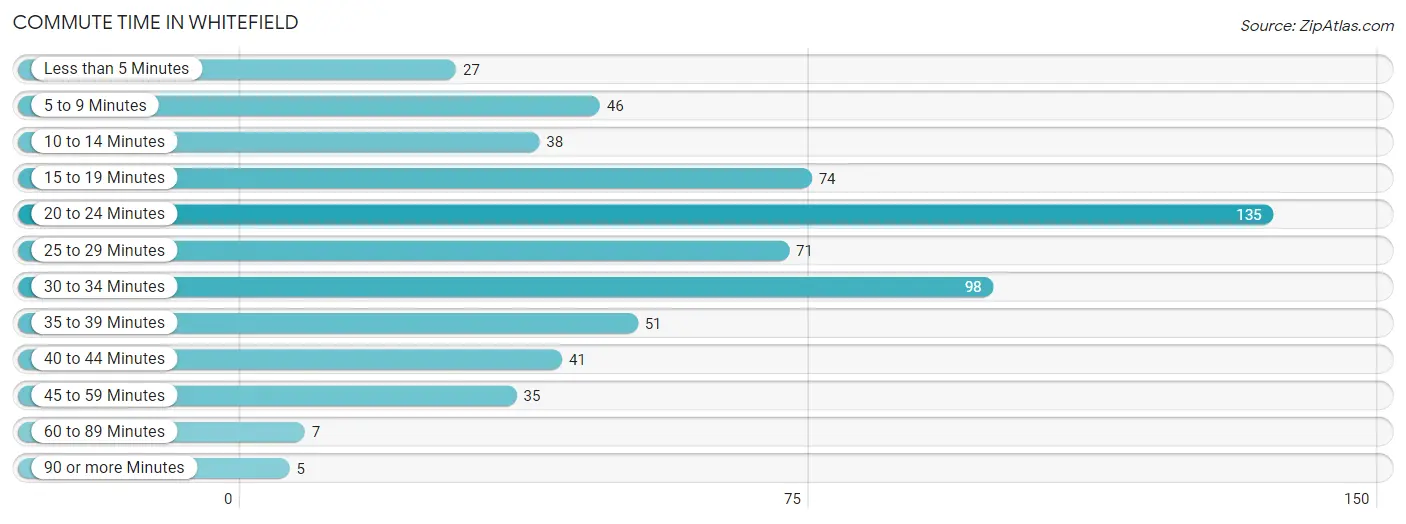
| Commute Time | # Commuters | % Commuters |
| Less than 5 Minutes | 27 | 4.3% |
| 5 to 9 Minutes | 46 | 7.3% |
| 10 to 14 Minutes | 38 | 6.0% |
| 15 to 19 Minutes | 74 | 11.8% |
| 20 to 24 Minutes | 135 | 21.5% |
| 25 to 29 Minutes | 71 | 11.3% |
| 30 to 34 Minutes | 98 | 15.6% |
| 35 to 39 Minutes | 51 | 8.1% |
| 40 to 44 Minutes | 41 | 6.5% |
| 45 to 59 Minutes | 35 | 5.6% |
| 60 to 89 Minutes | 7 | 1.1% |
| 90 or more Minutes | 5 | 0.8% |
Commute Time by Sex in Whitefield
The most common commute times in Whitefield are 20 to 24 minutes (58 commuters, 18.9%) for males and 20 to 24 minutes (77 commuters, 24.0%) for females.
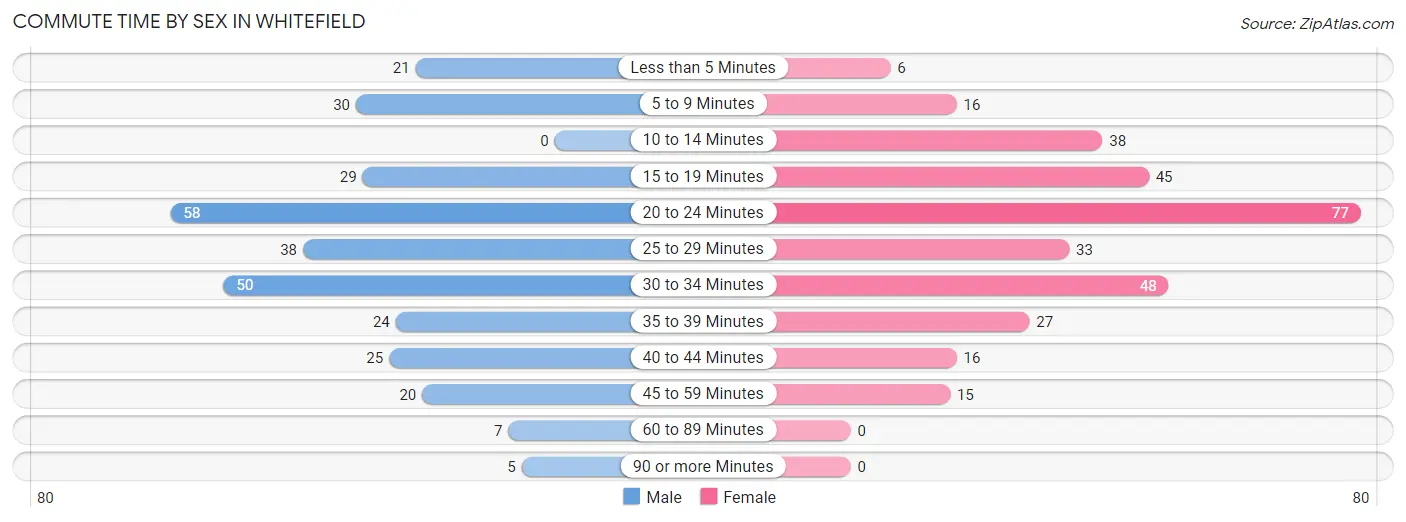
| Commute Time | Male | Female |
| Less than 5 Minutes | 21 (6.8%) | 6 (1.9%) |
| 5 to 9 Minutes | 30 (9.8%) | 16 (5.0%) |
| 10 to 14 Minutes | 0 (0.0%) | 38 (11.8%) |
| 15 to 19 Minutes | 29 (9.5%) | 45 (14.0%) |
| 20 to 24 Minutes | 58 (18.9%) | 77 (24.0%) |
| 25 to 29 Minutes | 38 (12.4%) | 33 (10.3%) |
| 30 to 34 Minutes | 50 (16.3%) | 48 (14.9%) |
| 35 to 39 Minutes | 24 (7.8%) | 27 (8.4%) |
| 40 to 44 Minutes | 25 (8.1%) | 16 (5.0%) |
| 45 to 59 Minutes | 20 (6.5%) | 15 (4.7%) |
| 60 to 89 Minutes | 7 (2.3%) | 0 (0.0%) |
| 90 or more Minutes | 5 (1.6%) | 0 (0.0%) |
Time of Departure to Work by Sex in Whitefield
The most frequent times of departure to work in Whitefield are 12:00 PM to 3:59 PM (84, 27.4%) for males and 6:30 AM to 6:59 AM (88, 27.4%) for females.
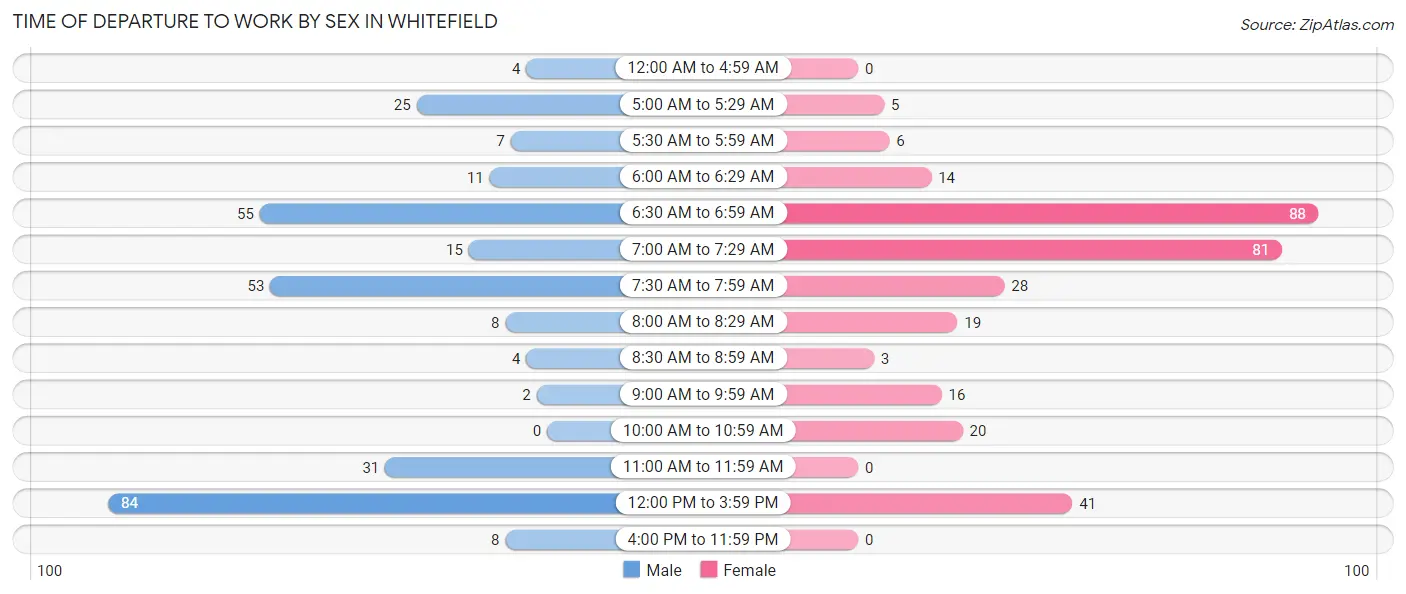
| Time of Departure | Male | Female |
| 12:00 AM to 4:59 AM | 4 (1.3%) | 0 (0.0%) |
| 5:00 AM to 5:29 AM | 25 (8.1%) | 5 (1.6%) |
| 5:30 AM to 5:59 AM | 7 (2.3%) | 6 (1.9%) |
| 6:00 AM to 6:29 AM | 11 (3.6%) | 14 (4.4%) |
| 6:30 AM to 6:59 AM | 55 (17.9%) | 88 (27.4%) |
| 7:00 AM to 7:29 AM | 15 (4.9%) | 81 (25.2%) |
| 7:30 AM to 7:59 AM | 53 (17.3%) | 28 (8.7%) |
| 8:00 AM to 8:29 AM | 8 (2.6%) | 19 (5.9%) |
| 8:30 AM to 8:59 AM | 4 (1.3%) | 3 (0.9%) |
| 9:00 AM to 9:59 AM | 2 (0.6%) | 16 (5.0%) |
| 10:00 AM to 10:59 AM | 0 (0.0%) | 20 (6.2%) |
| 11:00 AM to 11:59 AM | 31 (10.1%) | 0 (0.0%) |
| 12:00 PM to 3:59 PM | 84 (27.4%) | 41 (12.8%) |
| 4:00 PM to 11:59 PM | 8 (2.6%) | 0 (0.0%) |
| Total | 307 (100.0%) | 321 (100.0%) |
Housing Occupancy in Whitefield
Occupancy by Ownership in Whitefield
Of the total 608 dwellings in Whitefield, owner-occupied units account for 344 (56.6%), while renter-occupied units make up 264 (43.4%).
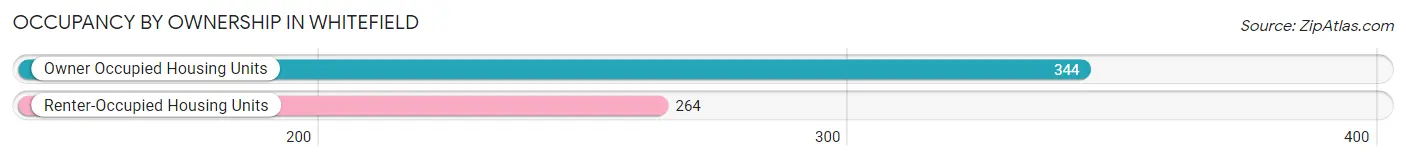
| Occupancy | # Housing Units | % Housing Units |
| Owner Occupied Housing Units | 344 | 56.6% |
| Renter-Occupied Housing Units | 264 | 43.4% |
| Total Occupied Housing Units | 608 | 100.0% |
Occupancy by Household Size in Whitefield
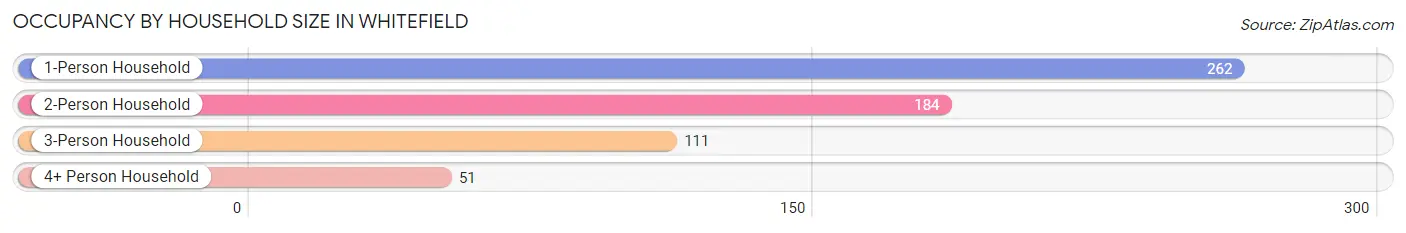
| Household Size | # Housing Units | % Housing Units |
| 1-Person Household | 262 | 43.1% |
| 2-Person Household | 184 | 30.3% |
| 3-Person Household | 111 | 18.3% |
| 4+ Person Household | 51 | 8.4% |
| Total Housing Units | 608 | 100.0% |
Occupancy by Ownership by Household Size in Whitefield
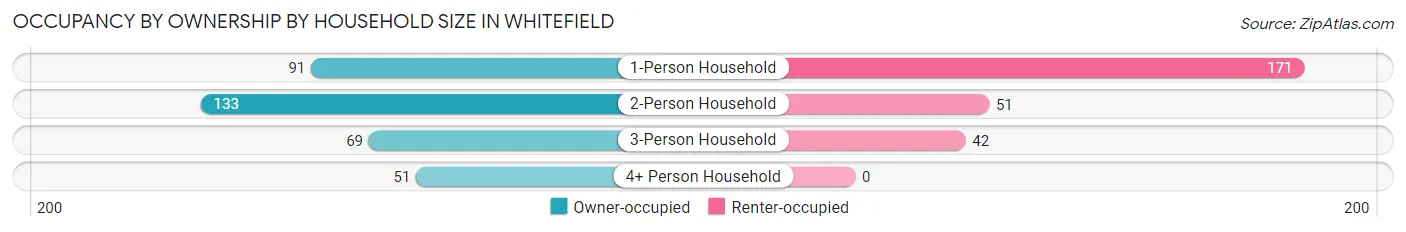
| Household Size | Owner-occupied | Renter-occupied |
| 1-Person Household | 91 (34.7%) | 171 (65.3%) |
| 2-Person Household | 133 (72.3%) | 51 (27.7%) |
| 3-Person Household | 69 (62.2%) | 42 (37.8%) |
| 4+ Person Household | 51 (100.0%) | 0 (0.0%) |
| Total Housing Units | 344 (56.6%) | 264 (43.4%) |
Occupancy by Educational Attainment in Whitefield
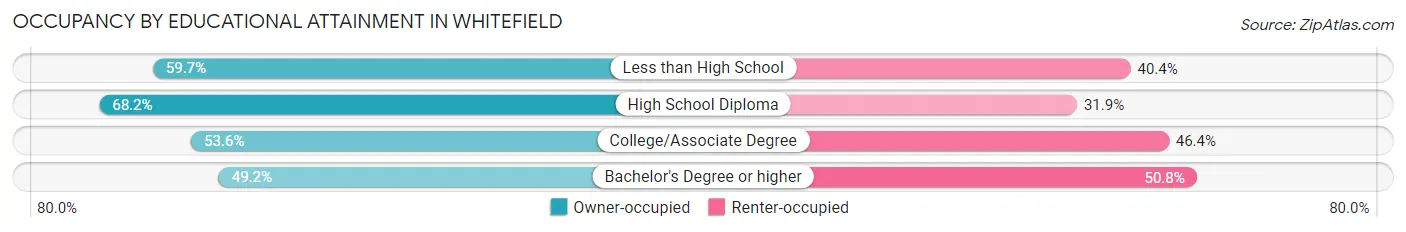
| Household Size | Owner-occupied | Renter-occupied |
| Less than High School | 34 (59.7%) | 23 (40.4%) |
| High School Diploma | 107 (68.1%) | 50 (31.9%) |
| College/Associate Degree | 112 (53.6%) | 97 (46.4%) |
| Bachelor's Degree or higher | 91 (49.2%) | 94 (50.8%) |
Occupancy by Age of Householder in Whitefield
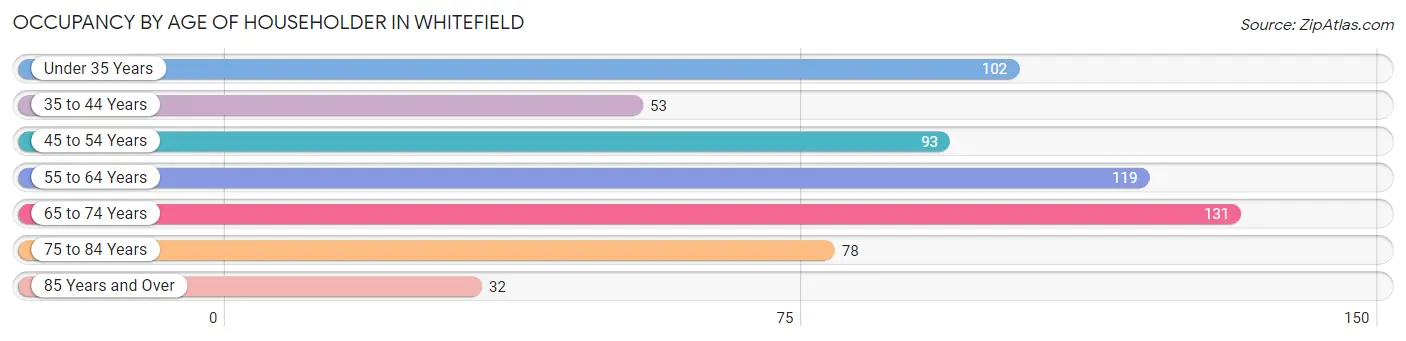
| Age Bracket | # Households | % Households |
| Under 35 Years | 102 | 16.8% |
| 35 to 44 Years | 53 | 8.7% |
| 45 to 54 Years | 93 | 15.3% |
| 55 to 64 Years | 119 | 19.6% |
| 65 to 74 Years | 131 | 21.5% |
| 75 to 84 Years | 78 | 12.8% |
| 85 Years and Over | 32 | 5.3% |
| Total | 608 | 100.0% |
Housing Finances in Whitefield
Median Income by Occupancy in Whitefield
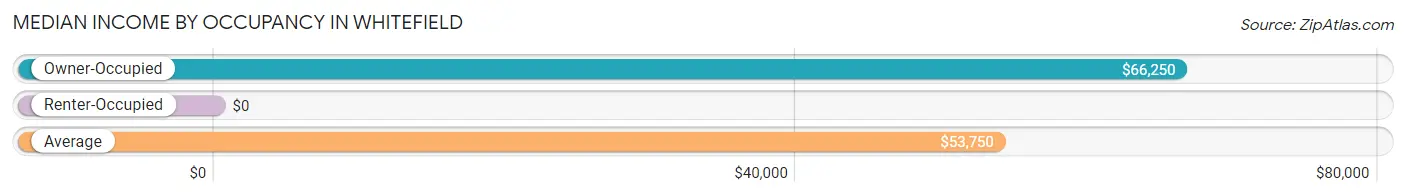
| Occupancy Type | # Households | Median Income |
| Owner-Occupied | 344 (56.6%) | $66,250 |
| Renter-Occupied | 264 (43.4%) | $0 |
| Average | 608 (100.0%) | $53,750 |
Occupancy by Householder Income Bracket in Whitefield
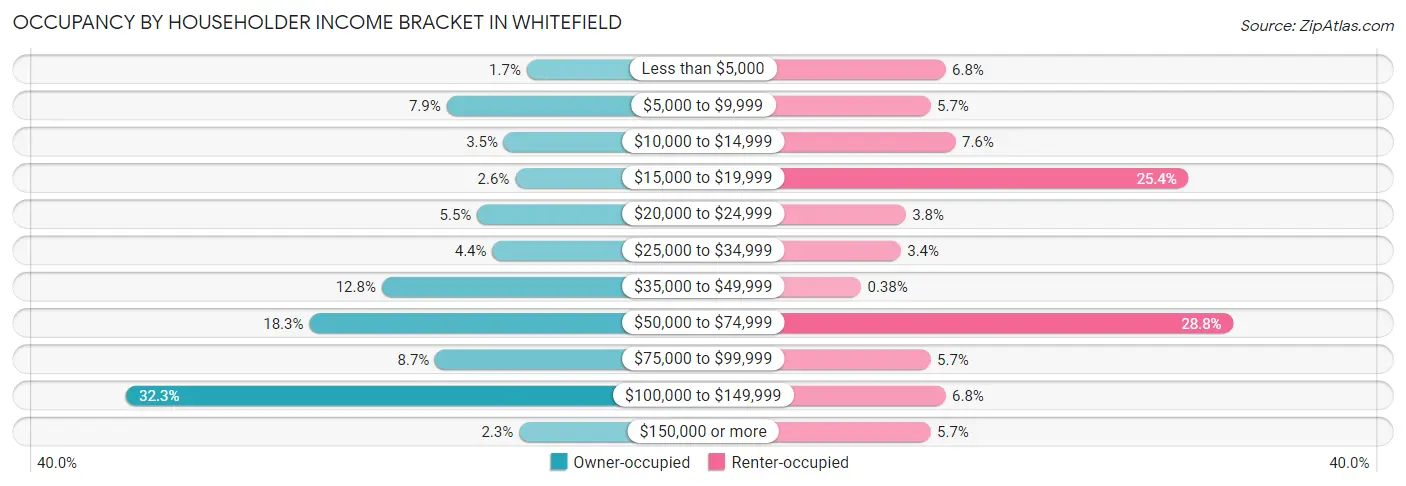
| Income Bracket | Owner-occupied | Renter-occupied |
| Less than $5,000 | 6 (1.7%) | 18 (6.8%) |
| $5,000 to $9,999 | 27 (7.9%) | 15 (5.7%) |
| $10,000 to $14,999 | 12 (3.5%) | 20 (7.6%) |
| $15,000 to $19,999 | 9 (2.6%) | 67 (25.4%) |
| $20,000 to $24,999 | 19 (5.5%) | 10 (3.8%) |
| $25,000 to $34,999 | 15 (4.4%) | 9 (3.4%) |
| $35,000 to $49,999 | 44 (12.8%) | 1 (0.4%) |
| $50,000 to $74,999 | 63 (18.3%) | 76 (28.8%) |
| $75,000 to $99,999 | 30 (8.7%) | 15 (5.7%) |
| $100,000 to $149,999 | 111 (32.3%) | 18 (6.8%) |
| $150,000 or more | 8 (2.3%) | 15 (5.7%) |
| Total | 344 (100.0%) | 264 (100.0%) |
Monthly Housing Cost Tiers in Whitefield
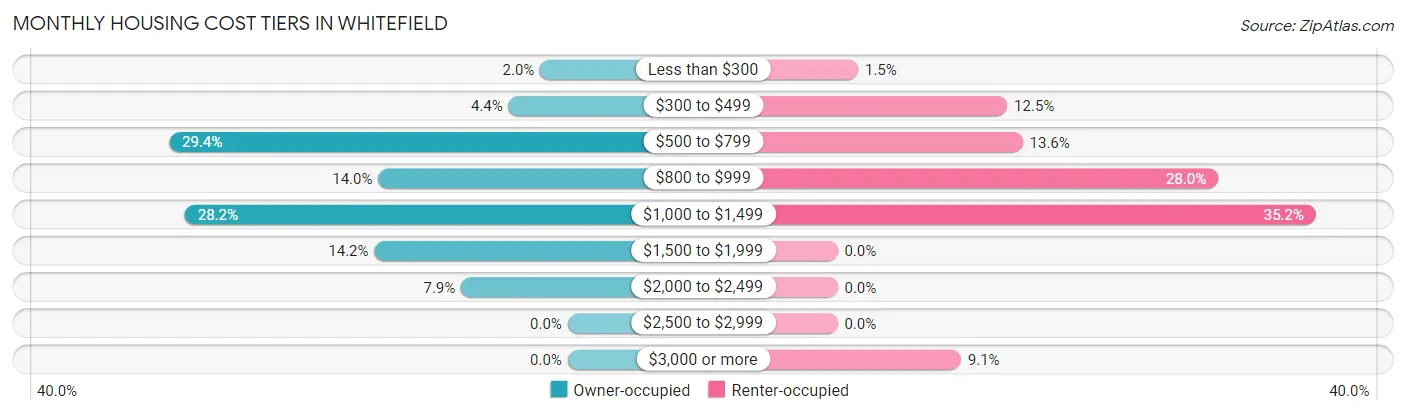
| Monthly Cost | Owner-occupied | Renter-occupied |
| Less than $300 | 7 (2.0%) | 4 (1.5%) |
| $300 to $499 | 15 (4.4%) | 33 (12.5%) |
| $500 to $799 | 101 (29.4%) | 36 (13.6%) |
| $800 to $999 | 48 (14.0%) | 74 (28.0%) |
| $1,000 to $1,499 | 97 (28.2%) | 93 (35.2%) |
| $1,500 to $1,999 | 49 (14.2%) | 0 (0.0%) |
| $2,000 to $2,499 | 27 (7.9%) | 0 (0.0%) |
| $2,500 to $2,999 | 0 (0.0%) | 0 (0.0%) |
| $3,000 or more | 0 (0.0%) | 24 (9.1%) |
| Total | 344 (100.0%) | 264 (100.0%) |
Physical Housing Characteristics in Whitefield
Housing Structures in Whitefield
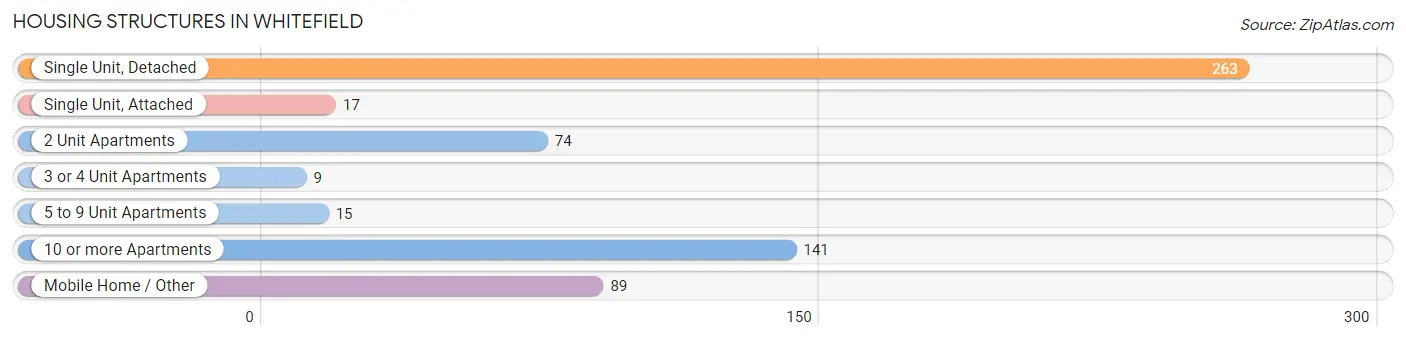
| Structure Type | # Housing Units | % Housing Units |
| Single Unit, Detached | 263 | 43.3% |
| Single Unit, Attached | 17 | 2.8% |
| 2 Unit Apartments | 74 | 12.2% |
| 3 or 4 Unit Apartments | 9 | 1.5% |
| 5 to 9 Unit Apartments | 15 | 2.5% |
| 10 or more Apartments | 141 | 23.2% |
| Mobile Home / Other | 89 | 14.6% |
| Total | 608 | 100.0% |
Housing Structures by Occupancy in Whitefield
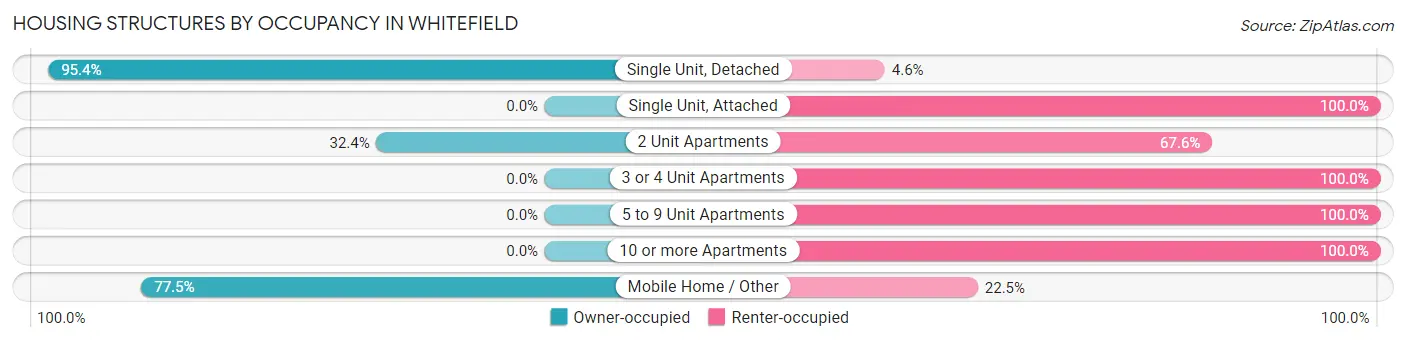
| Structure Type | Owner-occupied | Renter-occupied |
| Single Unit, Detached | 251 (95.4%) | 12 (4.6%) |
| Single Unit, Attached | 0 (0.0%) | 17 (100.0%) |
| 2 Unit Apartments | 24 (32.4%) | 50 (67.6%) |
| 3 or 4 Unit Apartments | 0 (0.0%) | 9 (100.0%) |
| 5 to 9 Unit Apartments | 0 (0.0%) | 15 (100.0%) |
| 10 or more Apartments | 0 (0.0%) | 141 (100.0%) |
| Mobile Home / Other | 69 (77.5%) | 20 (22.5%) |
| Total | 344 (56.6%) | 264 (43.4%) |
Housing Structures by Number of Rooms in Whitefield
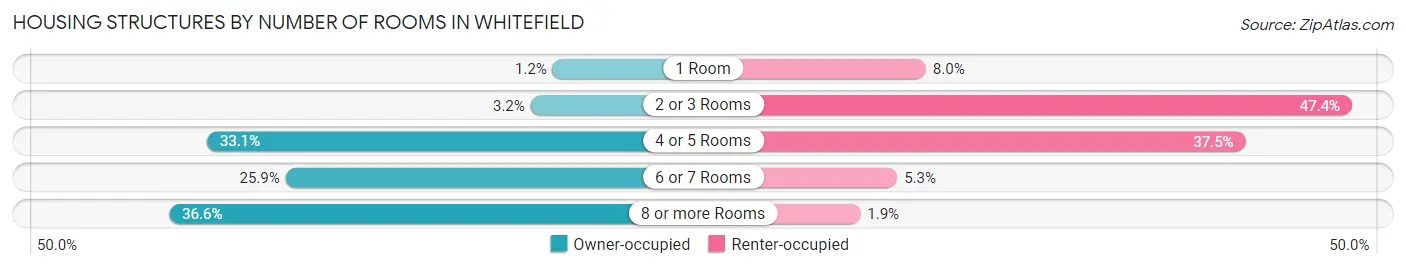
| Number of Rooms | Owner-occupied | Renter-occupied |
| 1 Room | 4 (1.2%) | 21 (8.0%) |
| 2 or 3 Rooms | 11 (3.2%) | 125 (47.3%) |
| 4 or 5 Rooms | 114 (33.1%) | 99 (37.5%) |
| 6 or 7 Rooms | 89 (25.9%) | 14 (5.3%) |
| 8 or more Rooms | 126 (36.6%) | 5 (1.9%) |
| Total | 344 (100.0%) | 264 (100.0%) |
Housing Structure by Heating Type in Whitefield
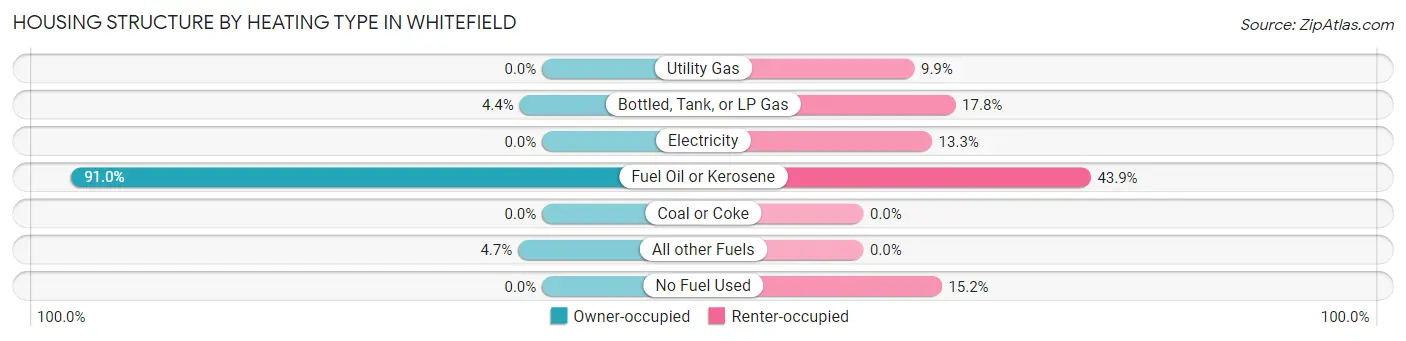
| Heating Type | Owner-occupied | Renter-occupied |
| Utility Gas | 0 (0.0%) | 26 (9.9%) |
| Bottled, Tank, or LP Gas | 15 (4.4%) | 47 (17.8%) |
| Electricity | 0 (0.0%) | 35 (13.3%) |
| Fuel Oil or Kerosene | 313 (91.0%) | 116 (43.9%) |
| Coal or Coke | 0 (0.0%) | 0 (0.0%) |
| All other Fuels | 16 (4.6%) | 0 (0.0%) |
| No Fuel Used | 0 (0.0%) | 40 (15.1%) |
| Total | 344 (100.0%) | 264 (100.0%) |
Household Vehicle Usage in Whitefield
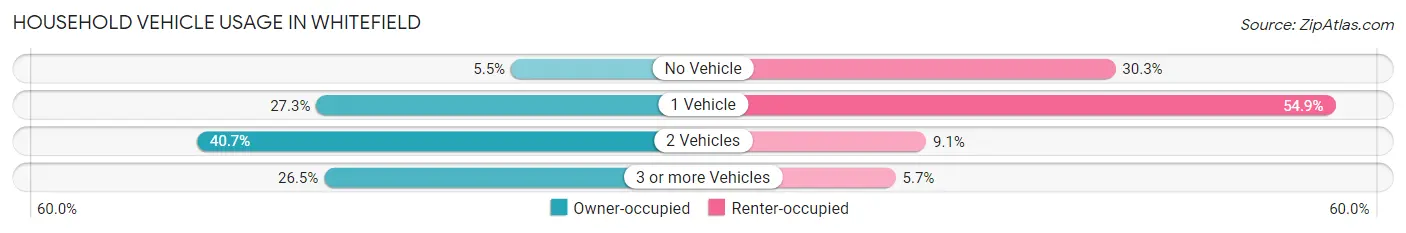
| Vehicles per Household | Owner-occupied | Renter-occupied |
| No Vehicle | 19 (5.5%) | 80 (30.3%) |
| 1 Vehicle | 94 (27.3%) | 145 (54.9%) |
| 2 Vehicles | 140 (40.7%) | 24 (9.1%) |
| 3 or more Vehicles | 91 (26.5%) | 15 (5.7%) |
| Total | 344 (100.0%) | 264 (100.0%) |
Real Estate & Mortgages in Whitefield
Real Estate and Mortgage Overview in Whitefield
| Characteristic | Without Mortgage | With Mortgage |
| Housing Units | 201 | 143 |
| Median Property Value | $124,600 | $164,500 |
| Median Household Income | $59,432 | $0 |
| Monthly Housing Costs | $734 | $0 |
| Real Estate Taxes | $2,615 | $0 |
Property Value by Mortgage Status in Whitefield
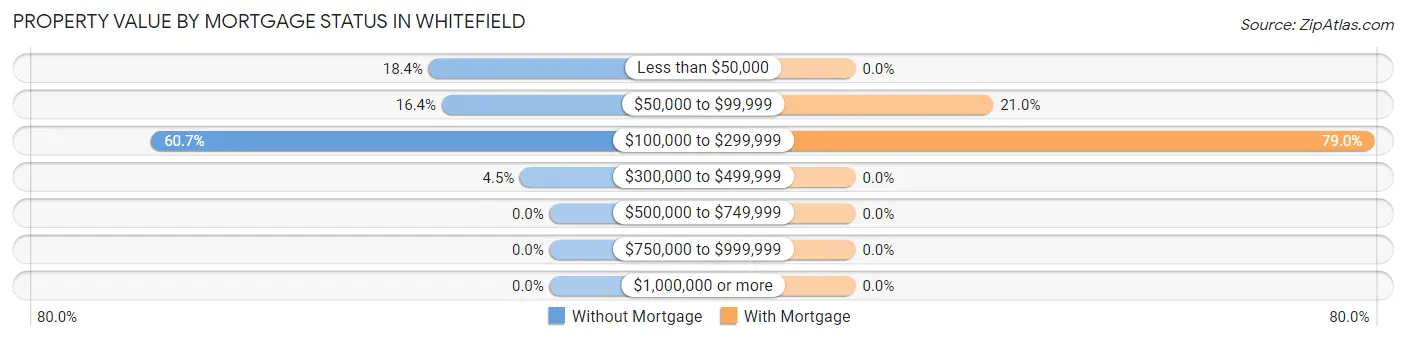
| Property Value | Without Mortgage | With Mortgage |
| Less than $50,000 | 37 (18.4%) | 0 (0.0%) |
| $50,000 to $99,999 | 33 (16.4%) | 30 (21.0%) |
| $100,000 to $299,999 | 122 (60.7%) | 113 (79.0%) |
| $300,000 to $499,999 | 9 (4.5%) | 0 (0.0%) |
| $500,000 to $749,999 | 0 (0.0%) | 0 (0.0%) |
| $750,000 to $999,999 | 0 (0.0%) | 0 (0.0%) |
| $1,000,000 or more | 0 (0.0%) | 0 (0.0%) |
| Total | 201 (100.0%) | 143 (100.0%) |
Household Income by Mortgage Status in Whitefield
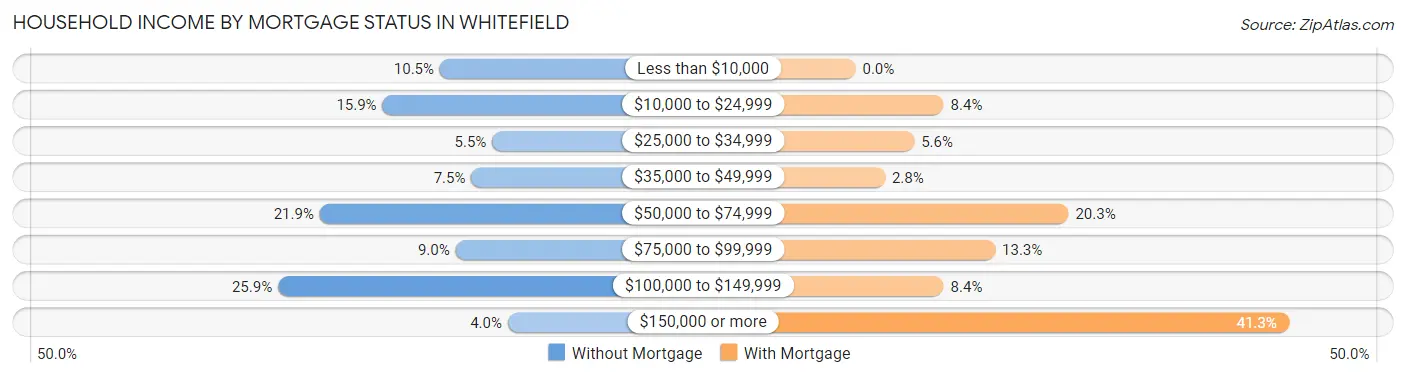
| Household Income | Without Mortgage | With Mortgage |
| Less than $10,000 | 21 (10.4%) | 0 (0.0%) |
| $10,000 to $24,999 | 32 (15.9%) | 12 (8.4%) |
| $25,000 to $34,999 | 11 (5.5%) | 8 (5.6%) |
| $35,000 to $49,999 | 15 (7.5%) | 4 (2.8%) |
| $50,000 to $74,999 | 44 (21.9%) | 29 (20.3%) |
| $75,000 to $99,999 | 18 (9.0%) | 19 (13.3%) |
| $100,000 to $149,999 | 52 (25.9%) | 12 (8.4%) |
| $150,000 or more | 8 (4.0%) | 59 (41.3%) |
| Total | 201 (100.0%) | 143 (100.0%) |
Property Value to Household Income Ratio in Whitefield
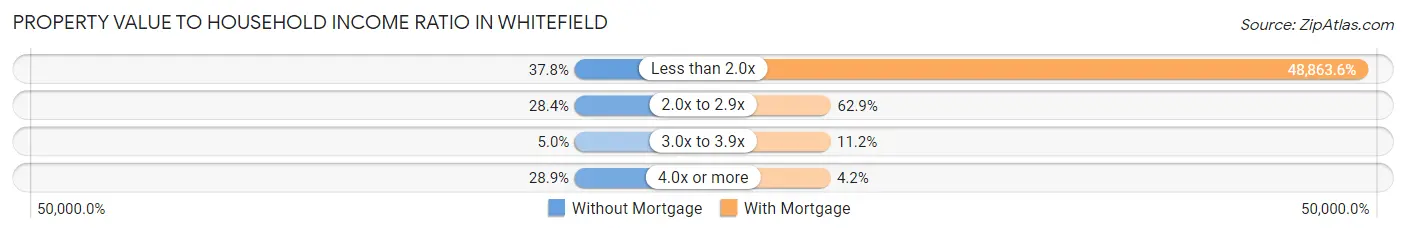
| Value-to-Income Ratio | Without Mortgage | With Mortgage |
| Less than 2.0x | 76 (37.8%) | 69,875 (48,863.6%) |
| 2.0x to 2.9x | 57 (28.4%) | 90 (62.9%) |
| 3.0x to 3.9x | 10 (5.0%) | 16 (11.2%) |
| 4.0x or more | 58 (28.9%) | 6 (4.2%) |
| Total | 201 (100.0%) | 143 (100.0%) |
Real Estate Taxes by Mortgage Status in Whitefield
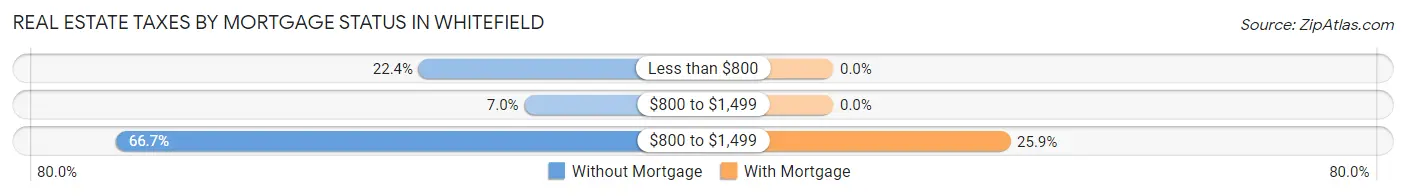
| Property Taxes | Without Mortgage | With Mortgage |
| Less than $800 | 45 (22.4%) | 0 (0.0%) |
| $800 to $1,499 | 14 (7.0%) | 0 (0.0%) |
| $800 to $1,499 | 134 (66.7%) | 37 (25.9%) |
| Total | 201 (100.0%) | 143 (100.0%) |
Health & Disability in Whitefield
Health Insurance Coverage by Age in Whitefield
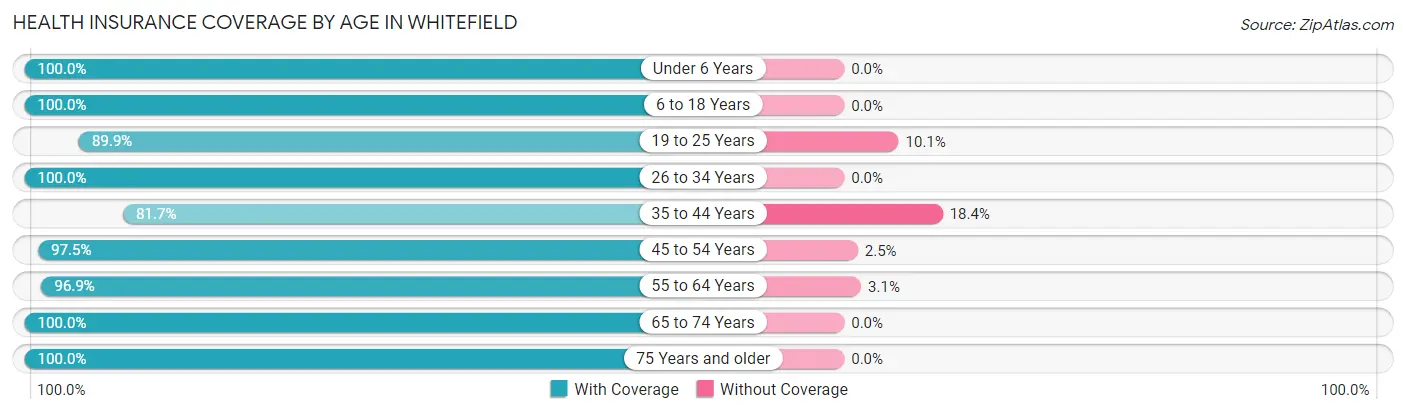
| Age Bracket | With Coverage | Without Coverage |
| Under 6 Years | 56 (100.0%) | 0 (0.0%) |
| 6 to 18 Years | 95 (100.0%) | 0 (0.0%) |
| 19 to 25 Years | 142 (89.9%) | 16 (10.1%) |
| 26 to 34 Years | 139 (100.0%) | 0 (0.0%) |
| 35 to 44 Years | 89 (81.7%) | 20 (18.3%) |
| 45 to 54 Years | 154 (97.5%) | 4 (2.5%) |
| 55 to 64 Years | 216 (96.9%) | 7 (3.1%) |
| 65 to 74 Years | 174 (100.0%) | 0 (0.0%) |
| 75 Years and older | 141 (100.0%) | 0 (0.0%) |
| Total | 1,206 (96.3%) | 47 (3.7%) |
Health Insurance Coverage by Citizenship Status in Whitefield
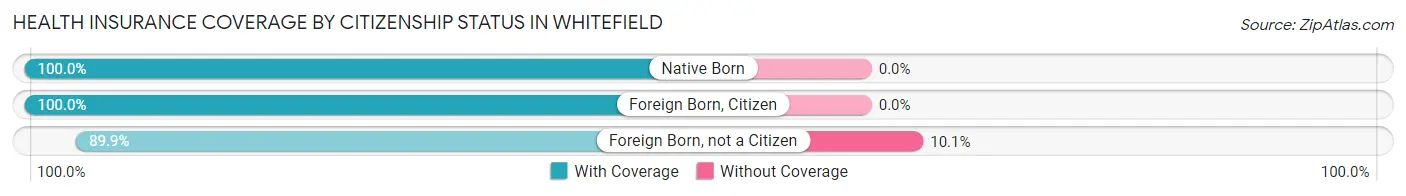
| Citizenship Status | With Coverage | Without Coverage |
| Native Born | 56 (100.0%) | 0 (0.0%) |
| Foreign Born, Citizen | 95 (100.0%) | 0 (0.0%) |
| Foreign Born, not a Citizen | 142 (89.9%) | 16 (10.1%) |
Health Insurance Coverage by Household Income in Whitefield
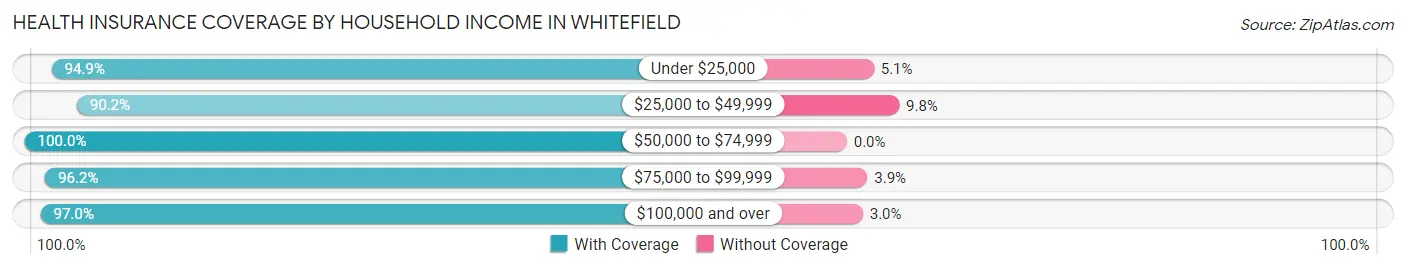
| Household Income | With Coverage | Without Coverage |
| Under $25,000 | 225 (94.9%) | 12 (5.1%) |
| $25,000 to $49,999 | 138 (90.2%) | 15 (9.8%) |
| $50,000 to $74,999 | 226 (100.0%) | 0 (0.0%) |
| $75,000 to $99,999 | 100 (96.2%) | 4 (3.8%) |
| $100,000 and over | 517 (97.0%) | 16 (3.0%) |
Public vs Private Health Insurance Coverage by Age in Whitefield
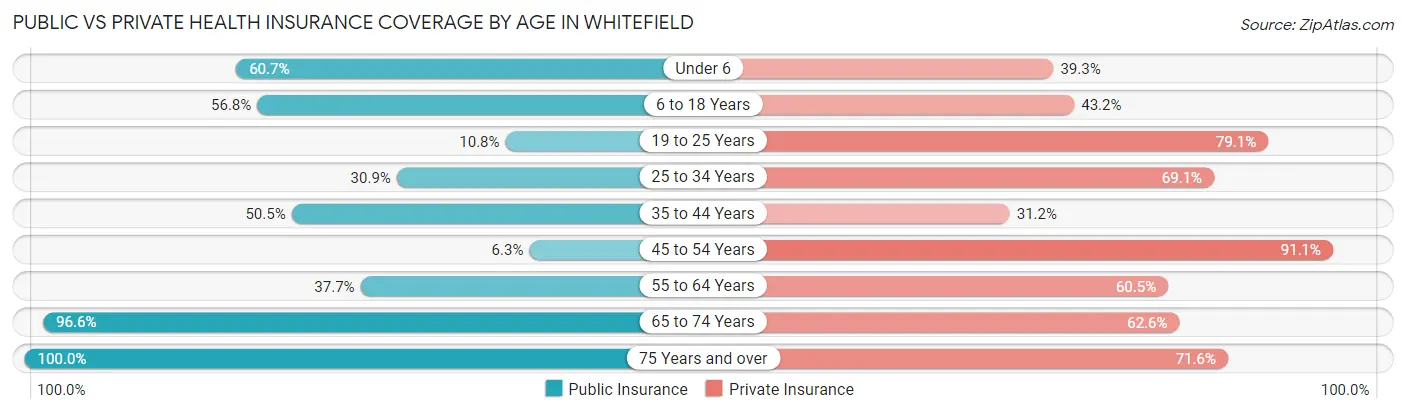
| Age Bracket | Public Insurance | Private Insurance |
| Under 6 | 34 (60.7%) | 22 (39.3%) |
| 6 to 18 Years | 54 (56.8%) | 41 (43.2%) |
| 19 to 25 Years | 17 (10.8%) | 125 (79.1%) |
| 25 to 34 Years | 43 (30.9%) | 96 (69.1%) |
| 35 to 44 Years | 55 (50.5%) | 34 (31.2%) |
| 45 to 54 Years | 10 (6.3%) | 144 (91.1%) |
| 55 to 64 Years | 84 (37.7%) | 135 (60.5%) |
| 65 to 74 Years | 168 (96.6%) | 109 (62.6%) |
| 75 Years and over | 141 (100.0%) | 101 (71.6%) |
| Total | 606 (48.4%) | 807 (64.4%) |
Disability Status by Sex by Age in Whitefield
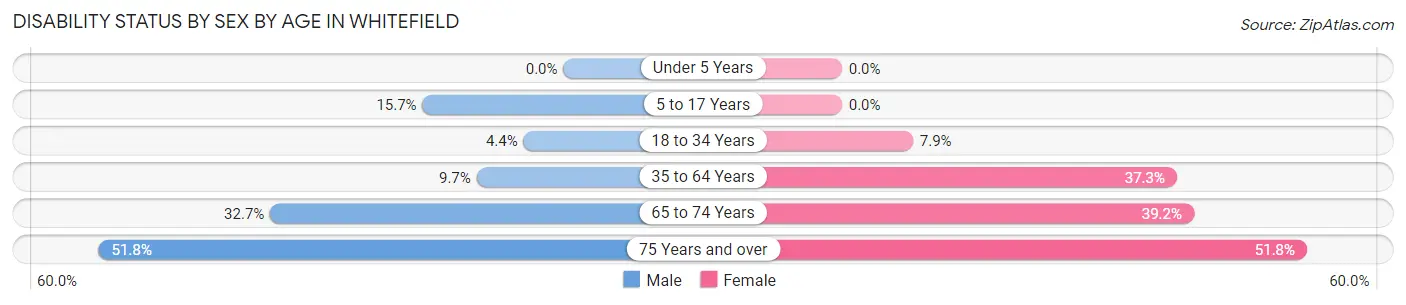
| Age Bracket | Male | Female |
| Under 5 Years | 0 (0.0%) | 0 (0.0%) |
| 5 to 17 Years | 8 (15.7%) | 0 (0.0%) |
| 18 to 34 Years | 7 (4.4%) | 11 (7.9%) |
| 35 to 64 Years | 23 (9.7%) | 94 (37.3%) |
| 65 to 74 Years | 16 (32.7%) | 49 (39.2%) |
| 75 Years and over | 44 (51.8%) | 29 (51.8%) |
Disability Class by Sex by Age in Whitefield
Disability Class: Hearing Difficulty
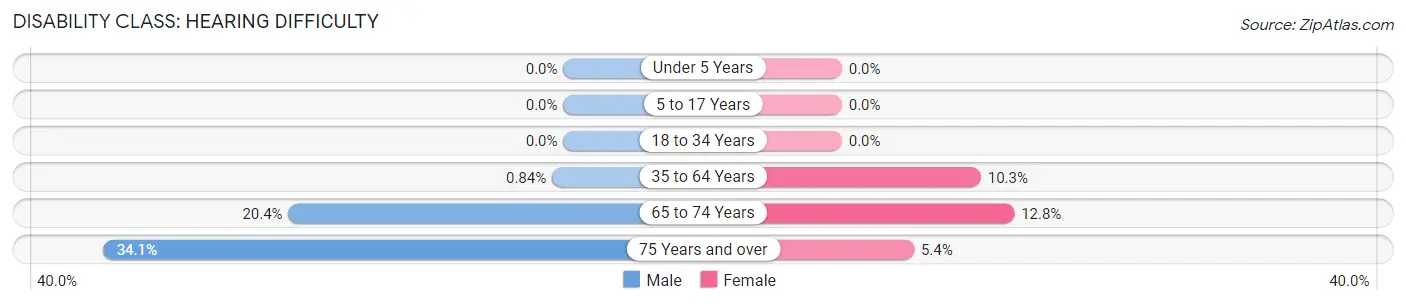
| Age Bracket | Male | Female |
| Under 5 Years | 0 (0.0%) | 0 (0.0%) |
| 5 to 17 Years | 0 (0.0%) | 0 (0.0%) |
| 18 to 34 Years | 0 (0.0%) | 0 (0.0%) |
| 35 to 64 Years | 2 (0.8%) | 26 (10.3%) |
| 65 to 74 Years | 10 (20.4%) | 16 (12.8%) |
| 75 Years and over | 29 (34.1%) | 3 (5.4%) |
Disability Class: Vision Difficulty
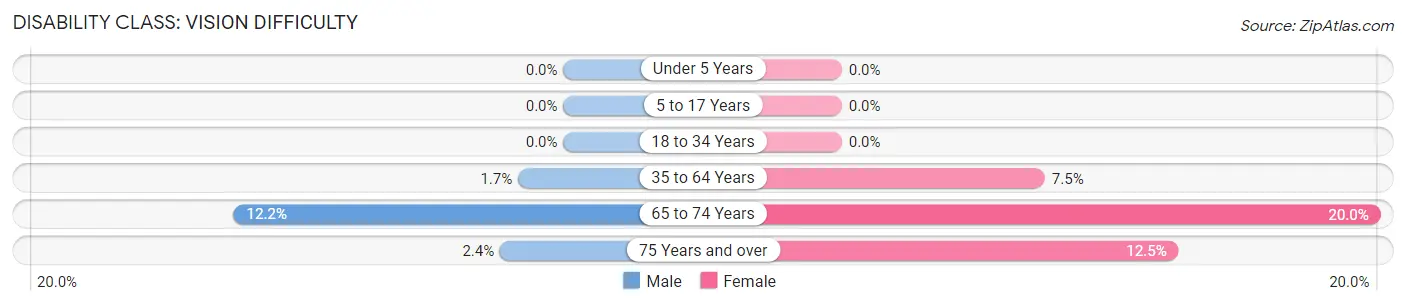
| Age Bracket | Male | Female |
| Under 5 Years | 0 (0.0%) | 0 (0.0%) |
| 5 to 17 Years | 0 (0.0%) | 0 (0.0%) |
| 18 to 34 Years | 0 (0.0%) | 0 (0.0%) |
| 35 to 64 Years | 4 (1.7%) | 19 (7.5%) |
| 65 to 74 Years | 6 (12.2%) | 25 (20.0%) |
| 75 Years and over | 2 (2.4%) | 7 (12.5%) |
Disability Class: Cognitive Difficulty
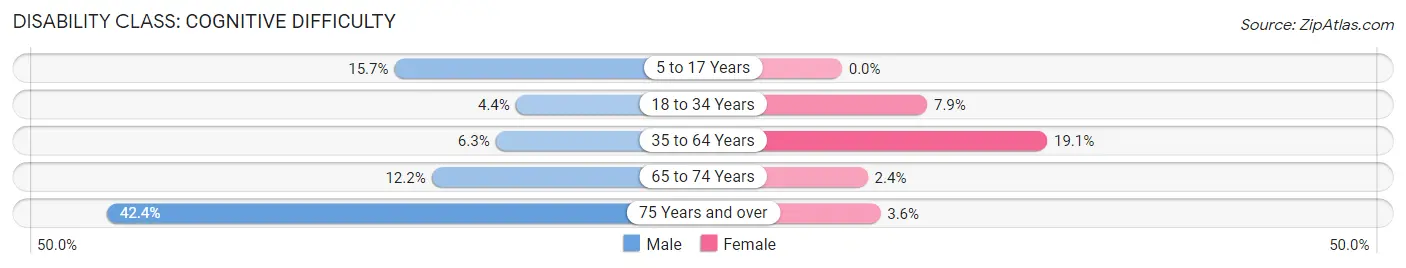
| Age Bracket | Male | Female |
| 5 to 17 Years | 8 (15.7%) | 0 (0.0%) |
| 18 to 34 Years | 7 (4.4%) | 11 (7.9%) |
| 35 to 64 Years | 15 (6.3%) | 48 (19.1%) |
| 65 to 74 Years | 6 (12.2%) | 3 (2.4%) |
| 75 Years and over | 36 (42.3%) | 2 (3.6%) |
Disability Class: Ambulatory Difficulty
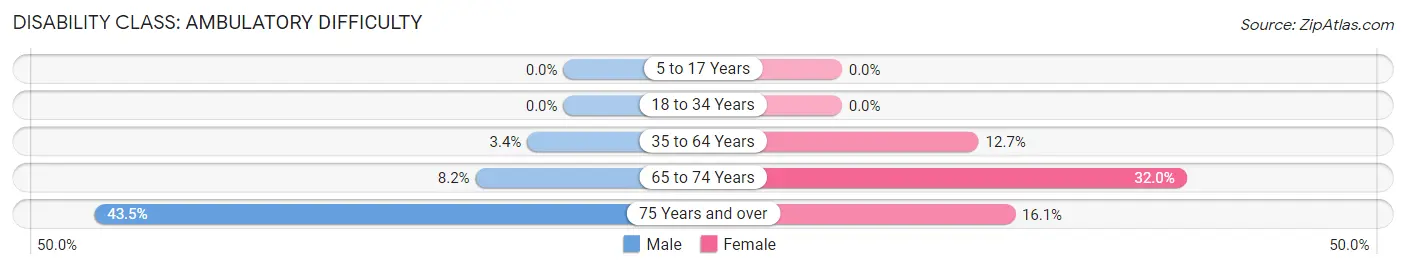
| Age Bracket | Male | Female |
| 5 to 17 Years | 0 (0.0%) | 0 (0.0%) |
| 18 to 34 Years | 0 (0.0%) | 0 (0.0%) |
| 35 to 64 Years | 8 (3.4%) | 32 (12.7%) |
| 65 to 74 Years | 4 (8.2%) | 40 (32.0%) |
| 75 Years and over | 37 (43.5%) | 9 (16.1%) |
Disability Class: Self-Care Difficulty
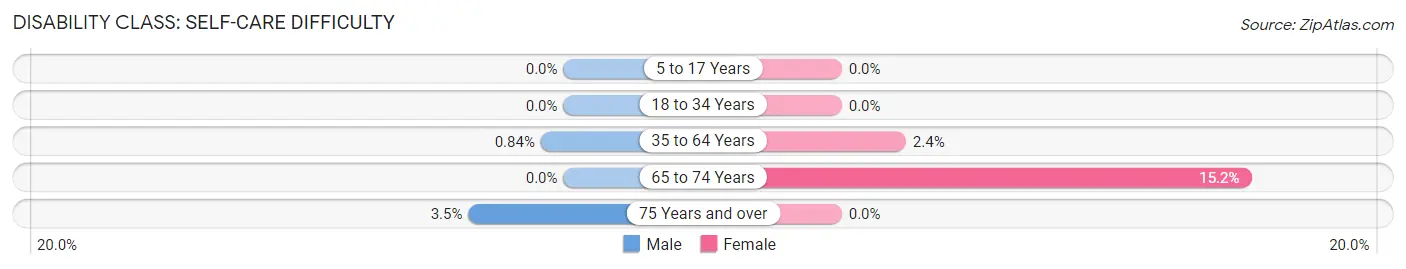
| Age Bracket | Male | Female |
| 5 to 17 Years | 0 (0.0%) | 0 (0.0%) |
| 18 to 34 Years | 0 (0.0%) | 0 (0.0%) |
| 35 to 64 Years | 2 (0.8%) | 6 (2.4%) |
| 65 to 74 Years | 0 (0.0%) | 19 (15.2%) |
| 75 Years and over | 3 (3.5%) | 0 (0.0%) |
Technology Access in Whitefield
Computing Device Access in Whitefield
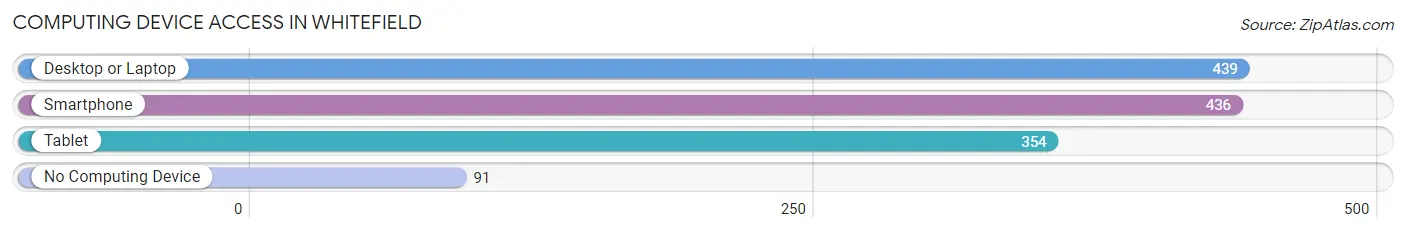
| Device Type | # Households | % Households |
| Desktop or Laptop | 439 | 72.2% |
| Smartphone | 436 | 71.7% |
| Tablet | 354 | 58.2% |
| No Computing Device | 91 | 15.0% |
| Total | 608 | 100.0% |
Internet Access in Whitefield
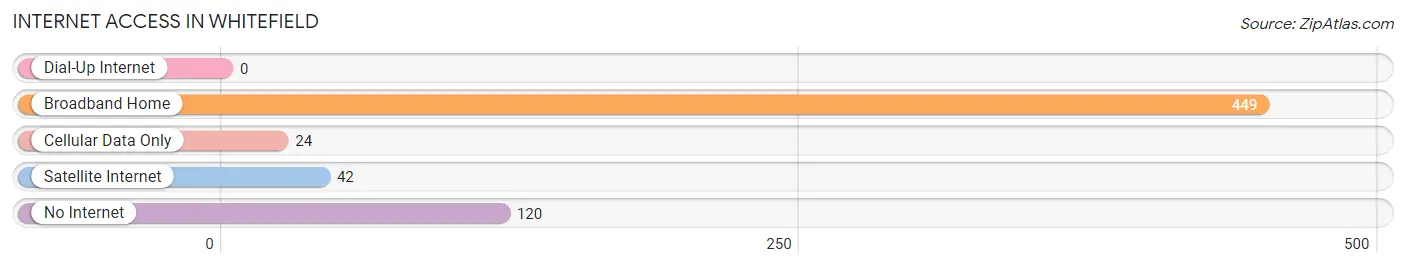
| Internet Type | # Households | % Households |
| Dial-Up Internet | 0 | 0.0% |
| Broadband Home | 449 | 73.9% |
| Cellular Data Only | 24 | 4.0% |
| Satellite Internet | 42 | 6.9% |
| No Internet | 120 | 19.7% |
| Total | 608 | 100.0% |
Whitefield Summary
Whitefield is a town located in Coos County, New Hampshire, United States. The population was 2,306 at the 2010 census. It is situated in the White Mountains region of the state.
History
Whitefield was first settled in 1774 by a group of settlers from Massachusetts. The town was incorporated in 1778 and named after the English statesman and philosopher, George Whitefield. The town was originally part of the town of Jefferson, but was set off and incorporated in 1778.
Whitefield was an important center of the lumber industry in the 19th century. The town was home to several sawmills, gristmills, and a tannery. The town also had a thriving agricultural industry, with dairy farms and apple orchards.
Geography
Whitefield is located in the White Mountains region of New Hampshire. The town is situated in the northern part of Coos County, bordered by the towns of Jefferson to the north, Lancaster to the east, Dalton to the south, and Bethlehem to the west.
Whitefield is located in the White Mountain National Forest. The town is home to several mountains, including Mount Washington, the highest peak in the Northeast. The town is also home to several lakes, including Lake Francis, Lake Tarleton, and Lake Gloriette.
The town is served by U S Route 3 which runs through the center of town
Economy
Whitefield is a rural town with a small economy. The town is home to several small businesses, including a few restaurants, a grocery store, and a few retail stores.
The town is also home to several small manufacturing companies, including a furniture manufacturer, a paper mill, and a plastics manufacturer.
The town is also home to several tourist attractions, including the White Mountain National Forest, the Mount Washington Auto Road, and the Whitefield Historical Society.
Demographics
As of the 2010 census, there were 2,306 people, 990 households, and 645 families residing in the town. The population density was 44.3 people per square mile (17.1/km2). There were 1,093 housing units at an average density of 20.7 per square mile (8.0/km2). The racial makeup of the town was 97.3% White, 0.3% African American, 0.3% Native American, 0.3% Asian, 0.1% Pacific Islander, 0.3% from other races, and 1.4% from two or more races. Hispanic or Latino of any race were 1.2% of the population.
There were 990 households, out of which 28.2% had children under the age of 18 living with them, 51.2% were married couples living together, 9.7% had a female householder with no husband present, and 34.2% were non-families. 28.2% of all households were made up of individuals, and 12.2% had someone living alone who was 65 years of age or older. The average household size was 2.33 and the average family size was 2.83.
In the town, the population was spread out, with 22.7% under the age of 18, 6.2% from 18 to 24, 25.7% from 25 to 44, 28.7% from 45 to 64, and 16.7% who were 65 years of age or older. The median age was 42 years. For every 100 females, there were 97.2 males. For every 100 females age 18 and over, there were 94.2 males.
The median income for a household in the town was $41,964, and the median income for a family was $50,000. Males had a median income of $35,000 versus $25,000 for females. The per capita income for the town was $20,945. About 6.2% of families and 9.2% of the population were below the poverty line, including 11.2% of those under age 18 and 8.2% of those age 65 or over.
Common Questions
What is Per Capita Income in Whitefield?
Per Capita income in Whitefield is $30,182.
What is the Median Family Income in Whitefield?
Median Family Income in Whitefield is $99,167.
What is the Median Household income in Whitefield?
Median Household Income in Whitefield is $53,750.
What is Income or Wage Gap in Whitefield?
Income or Wage Gap in Whitefield is 6.3%.
Women in Whitefield earn 93.7 cents for every dollar earned by a man.
What is Inequality or Gini Index in Whitefield?
Inequality or Gini Index in Whitefield is 0.43.
What is the Total Population of Whitefield?
Total Population of Whitefield is 1,332.
What is the Total Male Population of Whitefield?
Total Male Population of Whitefield is 607.
What is the Total Female Population of Whitefield?
Total Female Population of Whitefield is 725.
What is the Ratio of Males per 100 Females in Whitefield?
There are 83.72 Males per 100 Females in Whitefield.
What is the Ratio of Females per 100 Males in Whitefield?
There are 119.44 Females per 100 Males in Whitefield.
What is the Median Population Age in Whitefield?
Median Population Age in Whitefield is 52.6 Years.
What is the Average Family Size in Whitefield
Average Family Size in Whitefield is 2.7 People.
What is the Average Household Size in Whitefield
Average Household Size in Whitefield is 2.1 People.
How Large is the Labor Force in Whitefield?
There are 701 People in the Labor Forcein in Whitefield.
What is the Percentage of People in the Labor Force in Whitefield?
58.5% of People are in the Labor Force in Whitefield.
What is the Unemployment Rate in Whitefield?
Unemployment Rate in Whitefield is 5.1%.