Conway, NH Map & Demographics
Conway Map
Conway Overview
$33,042
PER CAPITA INCOME
$83,636
AVG FAMILY INCOME
$46,771
AVG HOUSEHOLD INCOME
17.2%
WAGE / INCOME GAP [ % ]
82.8¢/ $1
WAGE / INCOME GAP [ $ ]
0.46
INEQUALITY / GINI INDEX
3,847
TOTAL POPULATION
1,948
MALE POPULATION
1,899
FEMALE POPULATION
102.58
MALES / 100 FEMALES
97.48
FEMALES / 100 MALES
41.7
MEDIAN AGE
3.2
AVG FAMILY SIZE
2.4
AVG HOUSEHOLD SIZE
2,090
LABOR FORCE [ PEOPLE ]
63.8%
PERCENT IN LABOR FORCE
15.3%
UNEMPLOYMENT RATE
Conway Zip Codes
Conway Area Codes
Income in Conway
Income Overview in Conway
Per Capita Income in Conway is $33,042, while median incomes of families and households are $83,636 and $46,771 respectively.
| Characteristic | Number | Measure |
| Per Capita Income | 3,847 | $33,042 |
| Median Family Income | 914 | $83,636 |
| Mean Family Income | 914 | $93,141 |
| Median Household Income | 1,613 | $46,771 |
| Mean Household Income | 1,613 | $67,929 |
| Income Deficit | 914 | $0 |
| Wage / Income Gap (%) | 3,847 | 17.22% |
| Wage / Income Gap ($) | 3,847 | 82.78¢ per $1 |
| Gini / Inequality Index | 3,847 | 0.46 |
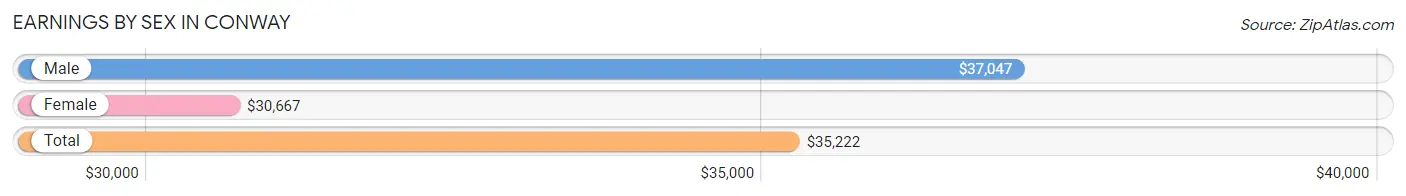
Earnings by Sex in Conway
Average Earnings in Conway are $35,222, $37,047 for men and $30,667 for women, a difference of 17.2%.
| Sex | Number | Average Earnings |
| Male | 1,205 (55.3%) | $37,047 |
| Female | 975 (44.7%) | $30,667 |
| Total | 2,180 (100.0%) | $35,222 |
Earnings by Sex by Income Bracket in Conway
The most common earnings brackets in Conway are $35,000 to $39,999 for men (288 | 23.9%) and $30,000 to $34,999 for women (243 | 24.9%).
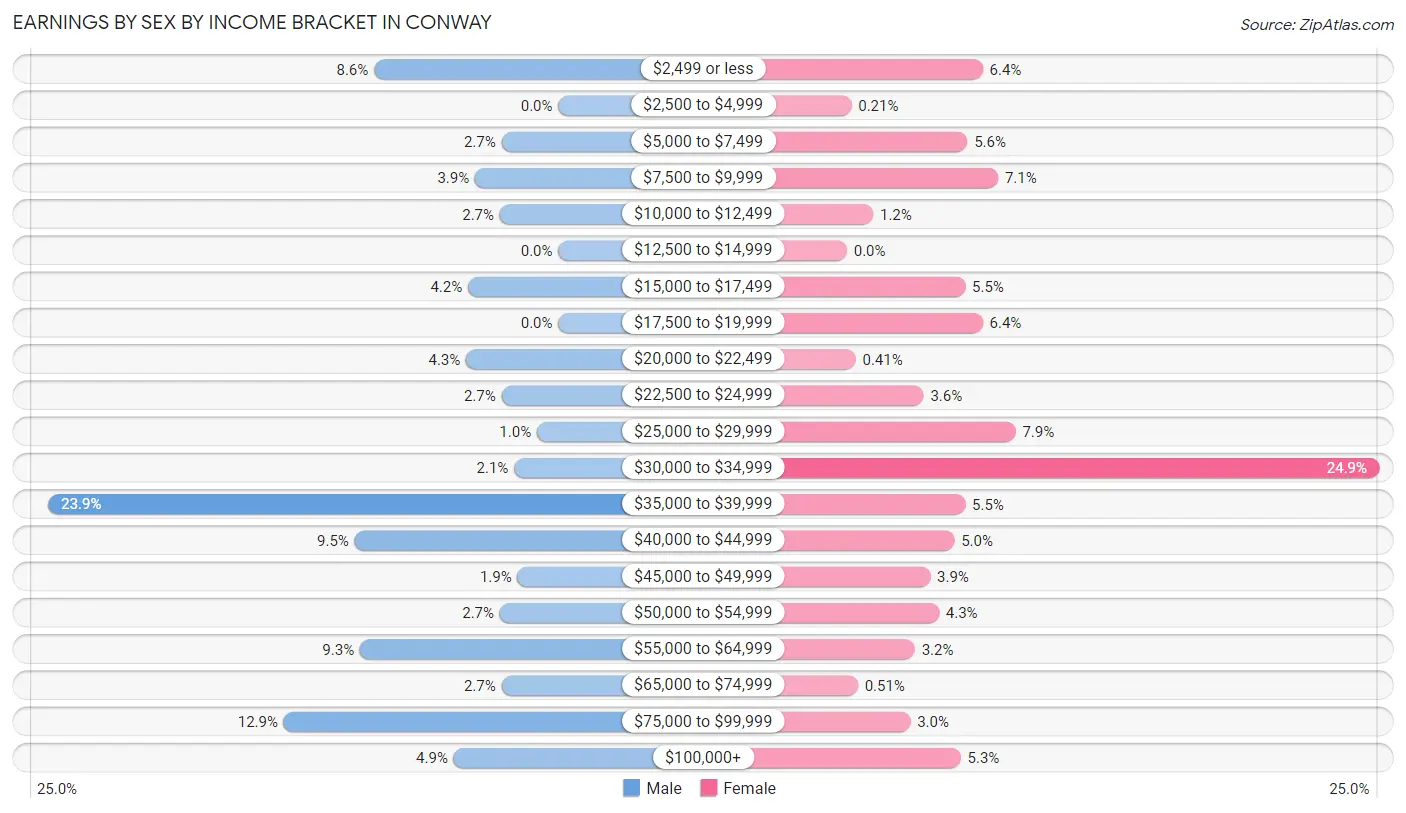
| Income | Male | Female |
| $2,499 or less | 104 (8.6%) | 62 (6.4%) |
| $2,500 to $4,999 | 0 (0.0%) | 2 (0.2%) |
| $5,000 to $7,499 | 32 (2.7%) | 55 (5.6%) |
| $7,500 to $9,999 | 47 (3.9%) | 69 (7.1%) |
| $10,000 to $12,499 | 33 (2.7%) | 12 (1.2%) |
| $12,500 to $14,999 | 0 (0.0%) | 0 (0.0%) |
| $15,000 to $17,499 | 51 (4.2%) | 54 (5.5%) |
| $17,500 to $19,999 | 0 (0.0%) | 62 (6.4%) |
| $20,000 to $22,499 | 52 (4.3%) | 4 (0.4%) |
| $22,500 to $24,999 | 32 (2.7%) | 35 (3.6%) |
| $25,000 to $29,999 | 12 (1.0%) | 77 (7.9%) |
| $30,000 to $34,999 | 25 (2.1%) | 243 (24.9%) |
| $35,000 to $39,999 | 288 (23.9%) | 54 (5.5%) |
| $40,000 to $44,999 | 115 (9.5%) | 49 (5.0%) |
| $45,000 to $49,999 | 23 (1.9%) | 38 (3.9%) |
| $50,000 to $54,999 | 33 (2.7%) | 42 (4.3%) |
| $55,000 to $64,999 | 112 (9.3%) | 31 (3.2%) |
| $65,000 to $74,999 | 32 (2.7%) | 5 (0.5%) |
| $75,000 to $99,999 | 155 (12.9%) | 29 (3.0%) |
| $100,000+ | 59 (4.9%) | 52 (5.3%) |
| Total | 1,205 (100.0%) | 975 (100.0%) |
Earnings by Sex by Educational Attainment in Conway
Average earnings in Conway are $38,990 for men and $29,068 for women, a difference of 25.5%. Men with an educational attainment of graduate degree enjoy the highest average annual earnings of $211,389, while those with bachelor's degree education earn the least with $36,715. Women with an educational attainment of bachelor's degree earn the most with the average annual earnings of $38,958, while those with high school diploma education have the smallest earnings of $18,952.
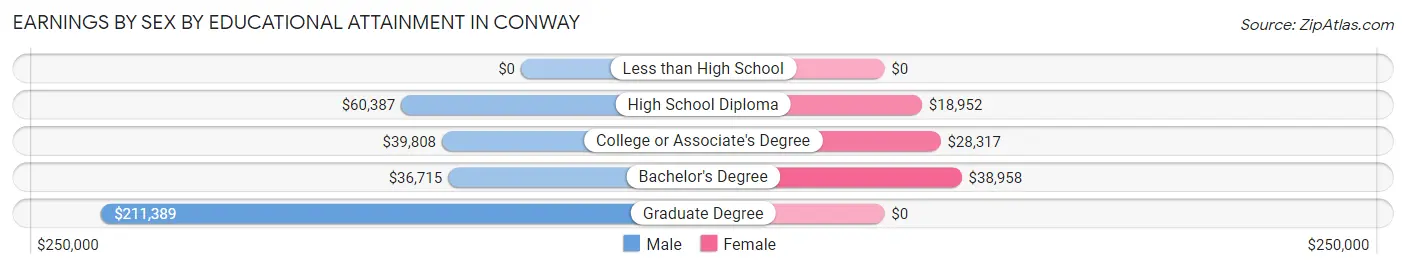
| Educational Attainment | Male Income | Female Income |
| Less than High School | - | - |
| High School Diploma | $60,387 | $18,952 |
| College or Associate's Degree | $39,808 | $28,317 |
| Bachelor's Degree | $36,715 | $38,958 |
| Graduate Degree | $211,389 | $0 |
| Total | $38,990 | $29,068 |
Family Income in Conway
Family Income Brackets in Conway
According to the Conway family income data, there are 216 families falling into the $100,000 to $149,999 income range, which is the most common income bracket and makes up 23.6% of all families.
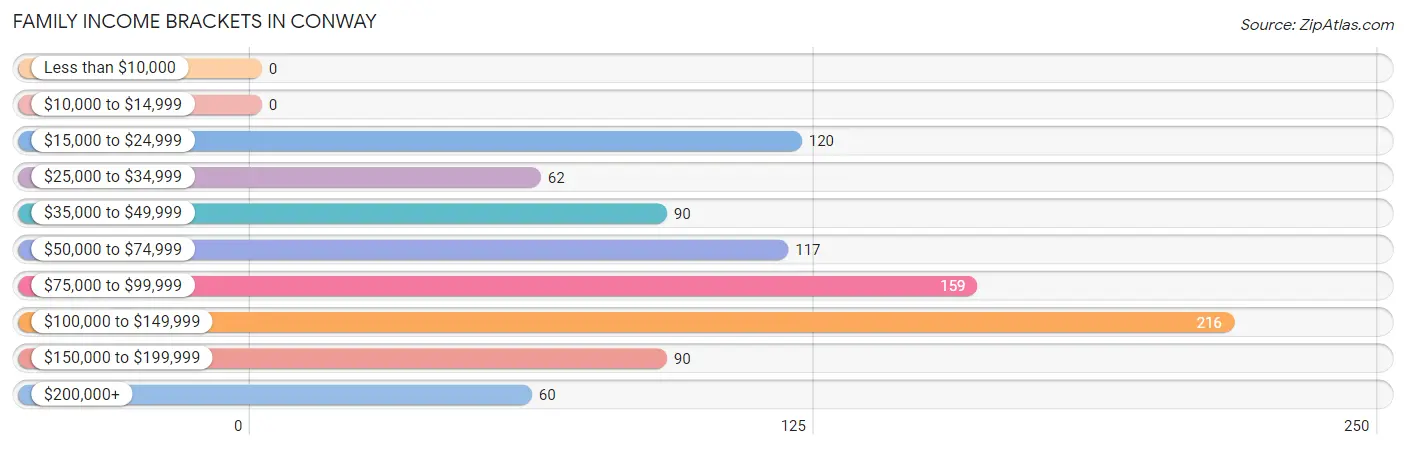
| Income Bracket | # Families | % Families |
| Less than $10,000 | 0 | 0.0% |
| $10,000 to $14,999 | 0 | 0.0% |
| $15,000 to $24,999 | 120 | 13.1% |
| $25,000 to $34,999 | 62 | 6.8% |
| $35,000 to $49,999 | 90 | 9.8% |
| $50,000 to $74,999 | 117 | 12.8% |
| $75,000 to $99,999 | 159 | 17.4% |
| $100,000 to $149,999 | 216 | 23.6% |
| $150,000 to $199,999 | 90 | 9.8% |
| $200,000+ | 60 | 6.6% |
Family Income by Famaliy Size in Conway
4-person families (34 | 3.7%) account for the highest median family income in Conway with $108,125 per family, while 2-person families (587 | 64.2%) have the highest median income of $42,604 per family member.
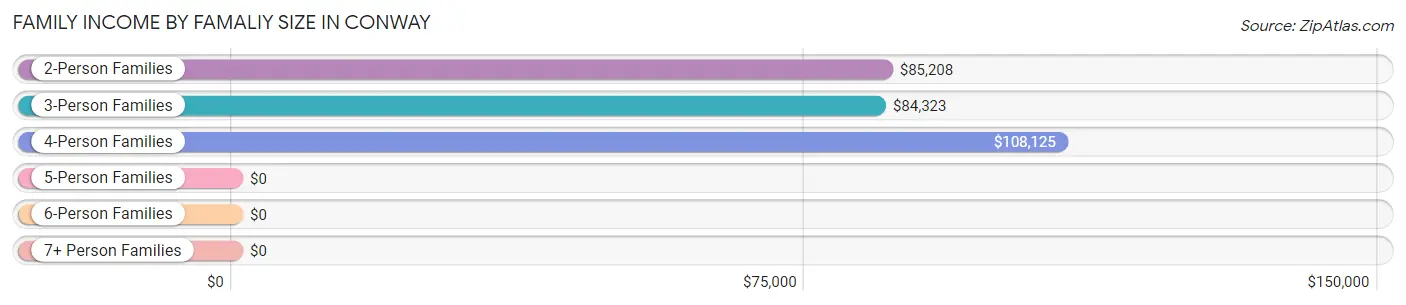
| Income Bracket | # Families | Median Income |
| 2-Person Families | 587 (64.2%) | $85,208 |
| 3-Person Families | 189 (20.7%) | $84,323 |
| 4-Person Families | 34 (3.7%) | $108,125 |
| 5-Person Families | 78 (8.5%) | $0 |
| 6-Person Families | 17 (1.9%) | $0 |
| 7+ Person Families | 9 (1.0%) | $0 |
| Total | 914 (100.0%) | $83,636 |
Family Income by Number of Earners in Conway
The median family income in Conway is $83,636, with families comprising 2 earners (344) having the highest median family income of $106,339, while families with no earners (124) have the lowest median family income of $61,250, accounting for 37.6% and 13.6% of families, respectively.
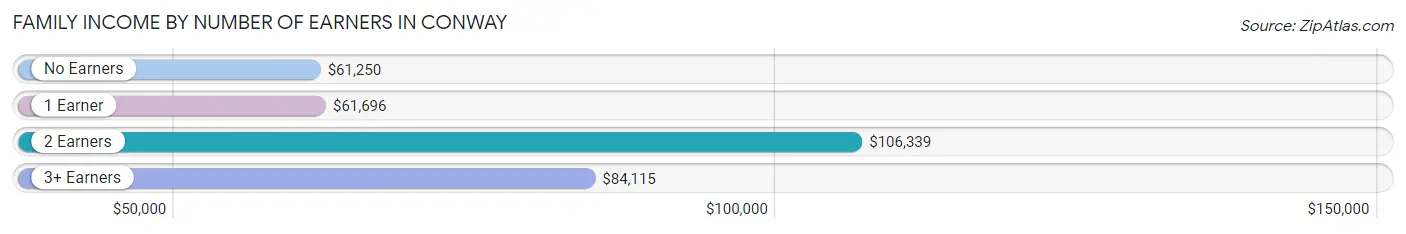
| Number of Earners | # Families | Median Income |
| No Earners | 124 (13.6%) | $61,250 |
| 1 Earner | 331 (36.2%) | $61,696 |
| 2 Earners | 344 (37.6%) | $106,339 |
| 3+ Earners | 115 (12.6%) | $84,115 |
| Total | 914 (100.0%) | $83,636 |
Household Income in Conway
Household Income Brackets in Conway
With 318 households falling in the category, the $15,000 to $24,999 income range is the most frequent in Conway, accounting for 19.7% of all households. In contrast, only 56 households (3.5%) fall into the $150,000 to $199,999 income bracket, making it the least populous group.
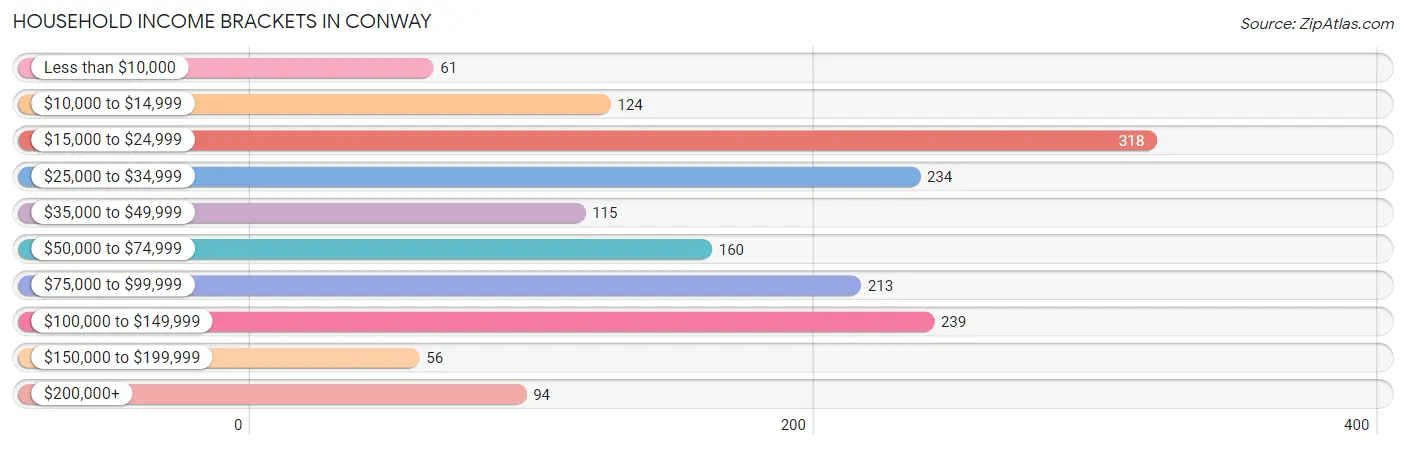
| Income Bracket | # Households | % Households |
| Less than $10,000 | 61 | 3.8% |
| $10,000 to $14,999 | 124 | 7.7% |
| $15,000 to $24,999 | 318 | 19.7% |
| $25,000 to $34,999 | 234 | 14.5% |
| $35,000 to $49,999 | 115 | 7.1% |
| $50,000 to $74,999 | 160 | 9.9% |
| $75,000 to $99,999 | 213 | 13.2% |
| $100,000 to $149,999 | 239 | 14.8% |
| $150,000 to $199,999 | 56 | 3.5% |
| $200,000+ | 94 | 5.8% |
Household Income by Householder Age in Conway
The median household income in Conway is $46,771, with the highest median household income of $85,893 found in the 25 to 44 years age bracket for the primary householder. A total of 279 households (17.3%) fall into this category. Meanwhile, the 15 to 24 years age bracket for the primary householder has the lowest median household income of $0, with 60 households (3.7%) in this group.
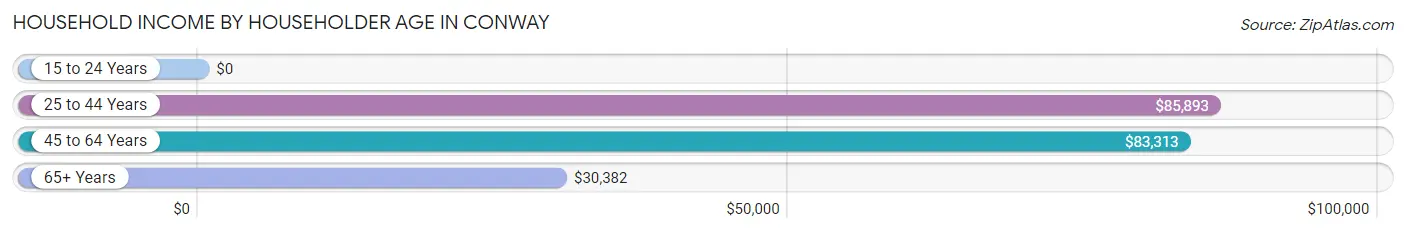
| Income Bracket | # Households | Median Income |
| 15 to 24 Years | 60 (3.7%) | $0 |
| 25 to 44 Years | 279 (17.3%) | $85,893 |
| 45 to 64 Years | 370 (22.9%) | $83,313 |
| 65+ Years | 904 (56.0%) | $30,382 |
| Total | 1,613 (100.0%) | $46,771 |
Poverty in Conway
Income Below Poverty by Sex and Age in Conway
With 16.2% poverty level for males and 15.4% for females among the residents of Conway, 12 to 14 year old males and 6 to 11 year old females are the most vulnerable to poverty, with 42 males (87.5%) and 45 females (38.1%) in their respective age groups living below the poverty level.
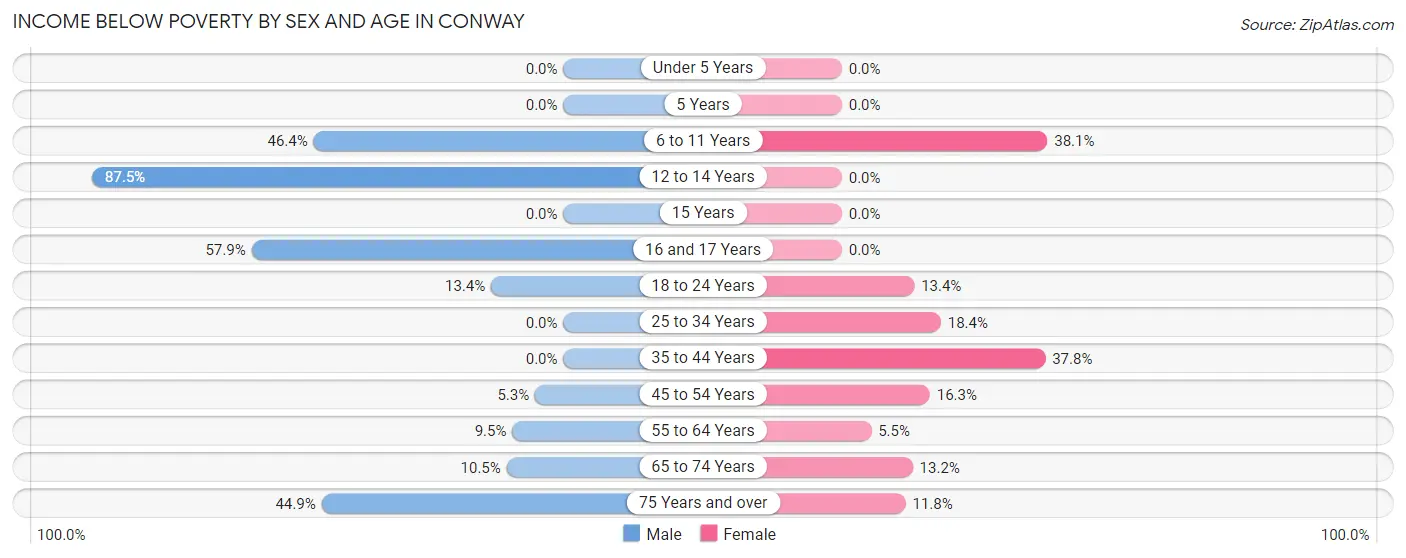
| Age Bracket | Male | Female |
| Under 5 Years | 0 (0.0%) | 0 (0.0%) |
| 5 Years | 0 (0.0%) | 0 (0.0%) |
| 6 to 11 Years | 83 (46.4%) | 45 (38.1%) |
| 12 to 14 Years | 42 (87.5%) | 0 (0.0%) |
| 15 Years | 0 (0.0%) | 0 (0.0%) |
| 16 and 17 Years | 22 (57.9%) | 0 (0.0%) |
| 18 to 24 Years | 40 (13.4%) | 34 (13.4%) |
| 25 to 34 Years | 0 (0.0%) | 25 (18.4%) |
| 35 to 44 Years | 0 (0.0%) | 54 (37.8%) |
| 45 to 54 Years | 5 (5.3%) | 24 (16.3%) |
| 55 to 64 Years | 20 (9.5%) | 10 (5.5%) |
| 65 to 74 Years | 24 (10.5%) | 58 (13.2%) |
| 75 Years and over | 79 (44.9%) | 42 (11.8%) |
| Total | 315 (16.2%) | 292 (15.4%) |
Income Above Poverty by Sex and Age in Conway
According to the poverty statistics in Conway, males aged under 5 years and females aged under 5 years are the age groups that are most secure financially, with 100.0% of males and 100.0% of females in these age groups living above the poverty line.
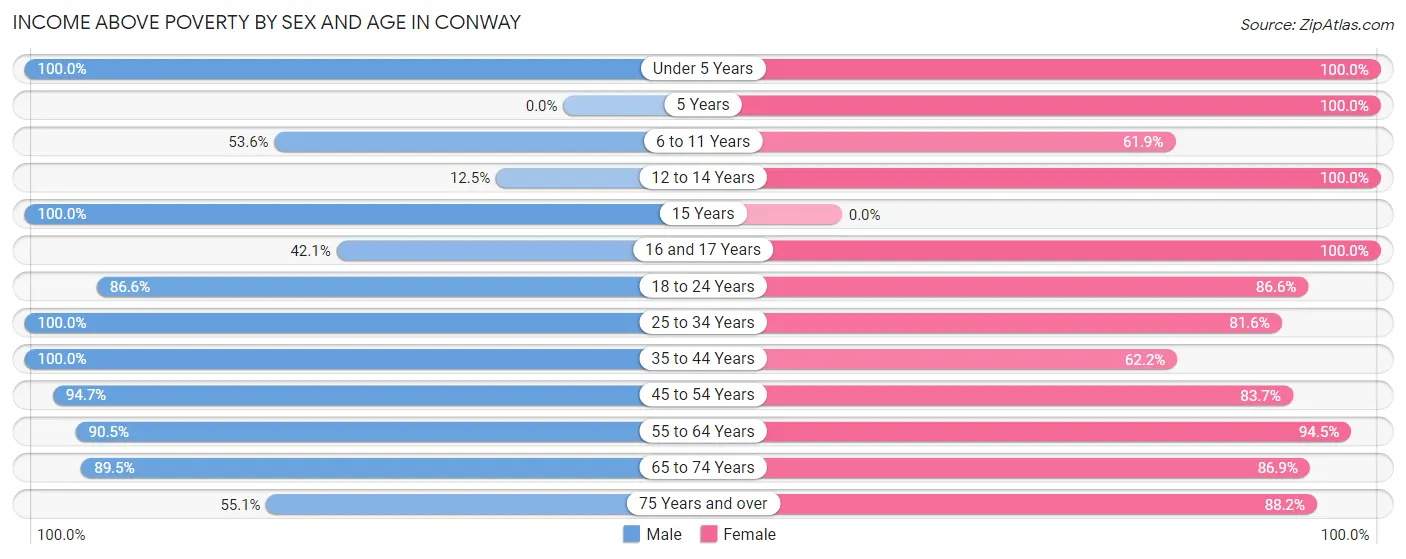
| Age Bracket | Male | Female |
| Under 5 Years | 117 (100.0%) | 33 (100.0%) |
| 5 Years | 0 (0.0%) | 26 (100.0%) |
| 6 to 11 Years | 96 (53.6%) | 73 (61.9%) |
| 12 to 14 Years | 6 (12.5%) | 47 (100.0%) |
| 15 Years | 3 (100.0%) | 0 (0.0%) |
| 16 and 17 Years | 16 (42.1%) | 17 (100.0%) |
| 18 to 24 Years | 258 (86.6%) | 219 (86.6%) |
| 25 to 34 Years | 221 (100.0%) | 111 (81.6%) |
| 35 to 44 Years | 334 (100.0%) | 89 (62.2%) |
| 45 to 54 Years | 90 (94.7%) | 123 (83.7%) |
| 55 to 64 Years | 191 (90.5%) | 173 (94.5%) |
| 65 to 74 Years | 204 (89.5%) | 383 (86.9%) |
| 75 Years and over | 97 (55.1%) | 313 (88.2%) |
| Total | 1,633 (83.8%) | 1,607 (84.6%) |
Income Below Poverty Among Married-Couple Families in Conway
The poverty statistics for married-couple families in Conway show that 6.2% or 38 of the total 609 families live below the poverty line. Families with 1 or 2 children have the highest poverty rate of 26.7%, comprising of 24 families. On the other hand, families with 3 or 4 children have the lowest poverty rate of 0.0%, which includes 0 families.
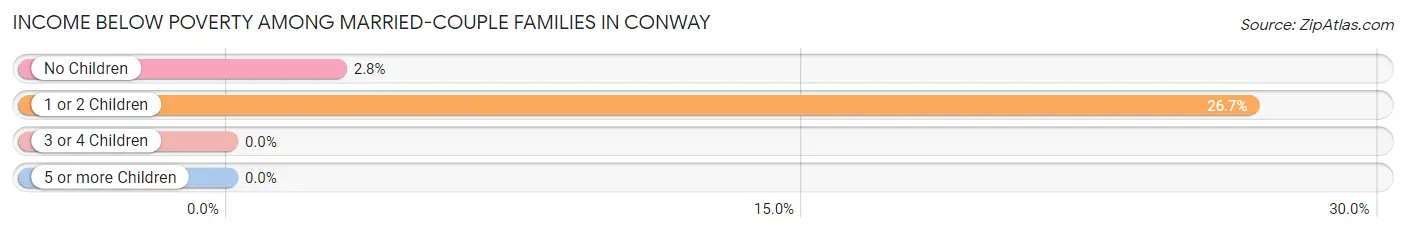
| Children | Above Poverty | Below Poverty |
| No Children | 479 (97.2%) | 14 (2.8%) |
| 1 or 2 Children | 66 (73.3%) | 24 (26.7%) |
| 3 or 4 Children | 26 (100.0%) | 0 (0.0%) |
| 5 or more Children | 0 (0.0%) | 0 (0.0%) |
| Total | 571 (93.8%) | 38 (6.2%) |
Income Below Poverty Among Single-Parent Households in Conway
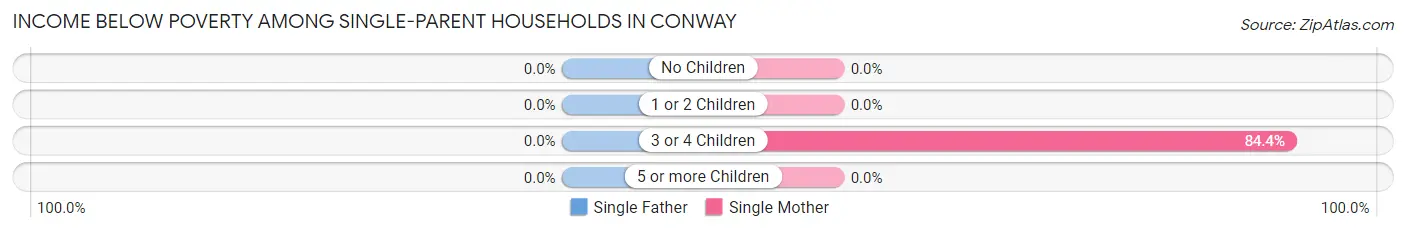
| Children | Single Father | Single Mother |
| No Children | 0 (0.0%) | 0 (0.0%) |
| 1 or 2 Children | 0 (0.0%) | 0 (0.0%) |
| 3 or 4 Children | 0 (0.0%) | 54 (84.4%) |
| 5 or more Children | 0 (0.0%) | 0 (0.0%) |
| Total | 0 (0.0%) | 54 (28.6%) |
Income Below Poverty Among Married-Couple vs Single-Parent Households in Conway
The poverty data for Conway shows that 38 of the married-couple family households (6.2%) and 54 of the single-parent households (17.7%) are living below the poverty level. Within the married-couple family households, those with 1 or 2 children have the highest poverty rate, with 24 households (26.7%) falling below the poverty line. Among the single-parent households, those with 3 or 4 children have the highest poverty rate, with 54 household (84.4%) living below poverty.

| Children | Married-Couple Families | Single-Parent Households |
| No Children | 14 (2.8%) | 0 (0.0%) |
| 1 or 2 Children | 24 (26.7%) | 0 (0.0%) |
| 3 or 4 Children | 0 (0.0%) | 54 (84.4%) |
| 5 or more Children | 0 (0.0%) | 0 (0.0%) |
| Total | 38 (6.2%) | 54 (17.7%) |
Race in Conway
The most populous races in Conway are White / Caucasian (3,684 | 95.8%), Asian (91 | 2.4%), and Two or more Races (67 | 1.7%).
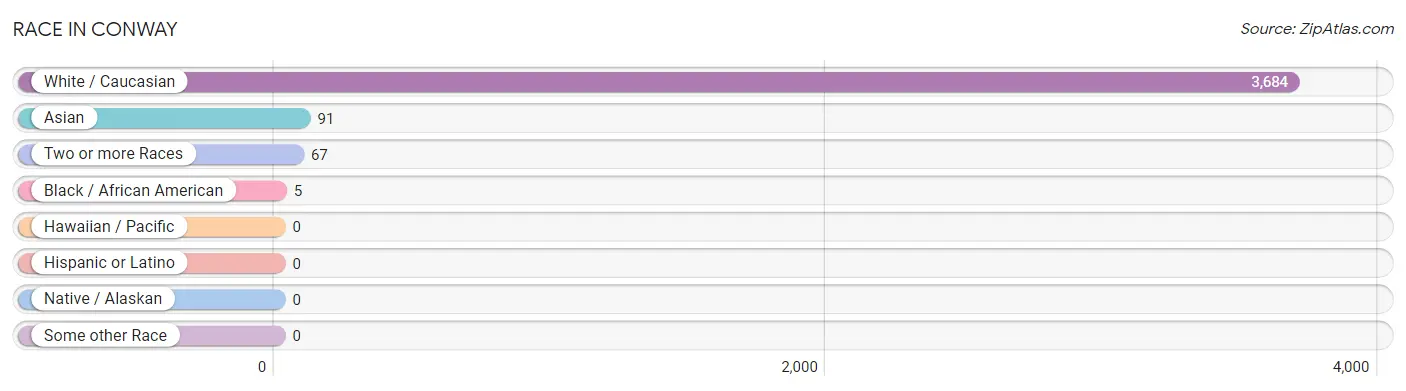
| Race | # Population | % Population |
| Asian | 91 | 2.4% |
| Black / African American | 5 | 0.1% |
| Hawaiian / Pacific | 0 | 0.0% |
| Hispanic or Latino | 0 | 0.0% |
| Native / Alaskan | 0 | 0.0% |
| White / Caucasian | 3,684 | 95.8% |
| Two or more Races | 67 | 1.7% |
| Some other Race | 0 | 0.0% |
| Total | 3,847 | 100.0% |
Ancestry in Conway
The most populous ancestries reported in Conway are Irish (1,215 | 31.6%), English (773 | 20.1%), French Canadian (471 | 12.2%), German (394 | 10.2%), and Italian (318 | 8.3%), together accounting for 82.4% of all Conway residents.
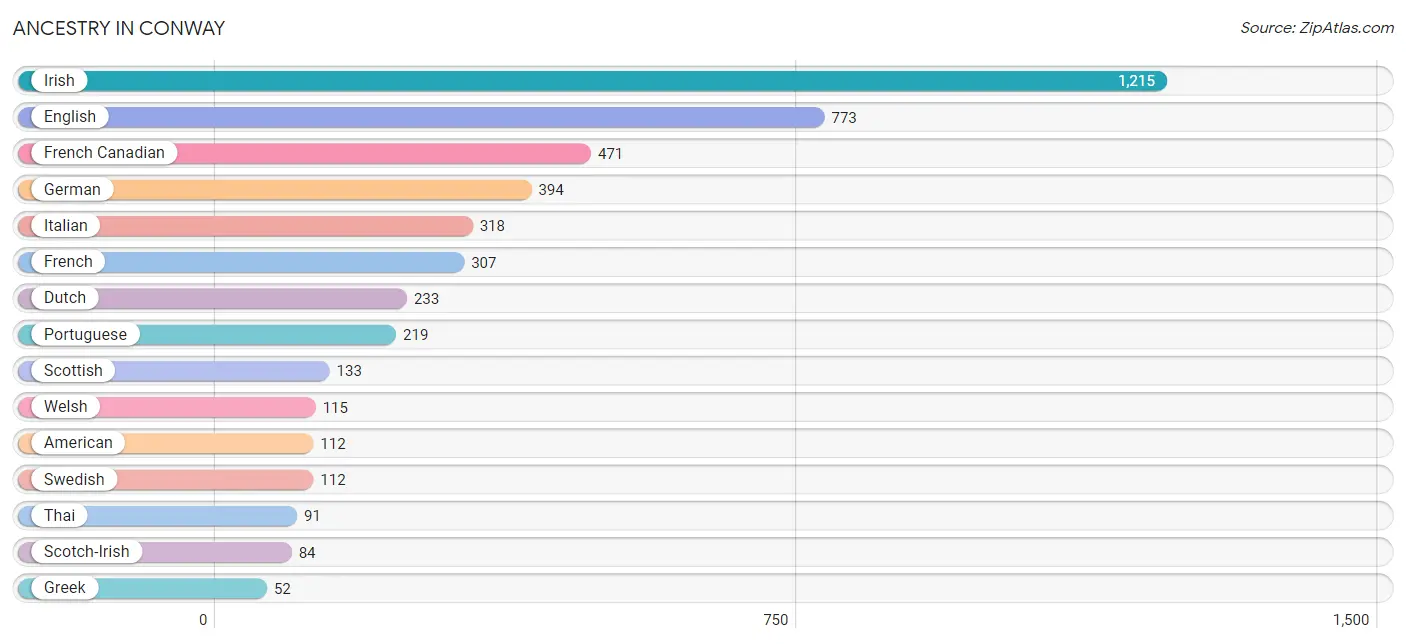
| Ancestry | # Population | % Population |
| American | 112 | 2.9% |
| British | 20 | 0.5% |
| Cherokee | 5 | 0.1% |
| Danish | 44 | 1.1% |
| Dutch | 233 | 6.1% |
| Eastern European | 10 | 0.3% |
| English | 773 | 20.1% |
| European | 20 | 0.5% |
| French | 307 | 8.0% |
| French Canadian | 471 | 12.2% |
| German | 394 | 10.2% |
| Greek | 52 | 1.3% |
| Hungarian | 7 | 0.2% |
| Irish | 1,215 | 31.6% |
| Italian | 318 | 8.3% |
| Lithuanian | 8 | 0.2% |
| Norwegian | 14 | 0.4% |
| Polish | 38 | 1.0% |
| Portuguese | 219 | 5.7% |
| Romanian | 26 | 0.7% |
| Russian | 30 | 0.8% |
| Scotch-Irish | 84 | 2.2% |
| Scottish | 133 | 3.5% |
| Swedish | 112 | 2.9% |
| Thai | 91 | 2.4% |
| Ukrainian | 4 | 0.1% |
| Welsh | 115 | 3.0% | View All 27 Rows |
Immigrants in Conway
The most numerous immigrant groups reported in Conway came from Latin America (52 | 1.3%), South America (52 | 1.3%), England (20 | 0.5%), Europe (20 | 0.5%), and Northern Europe (20 | 0.5%), together accounting for 4.3% of all Conway residents.
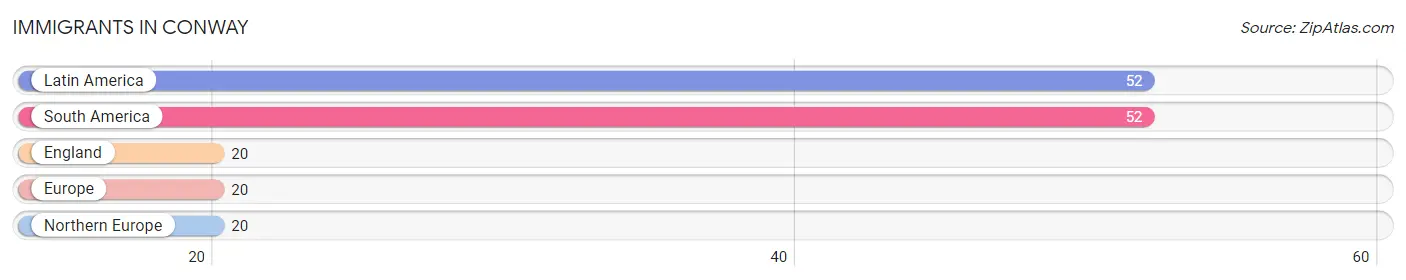
| Immigration Origin | # Population | % Population |
| England | 20 | 0.5% |
| Europe | 20 | 0.5% |
| Latin America | 52 | 1.3% |
| Northern Europe | 20 | 0.5% |
| South America | 52 | 1.3% | View All 5 Rows |
Sex and Age in Conway
Sex and Age in Conway
The most populous age groups in Conway are 20 to 24 Years (265 | 13.6%) for men and 70 to 74 Years (302 | 15.9%) for women.
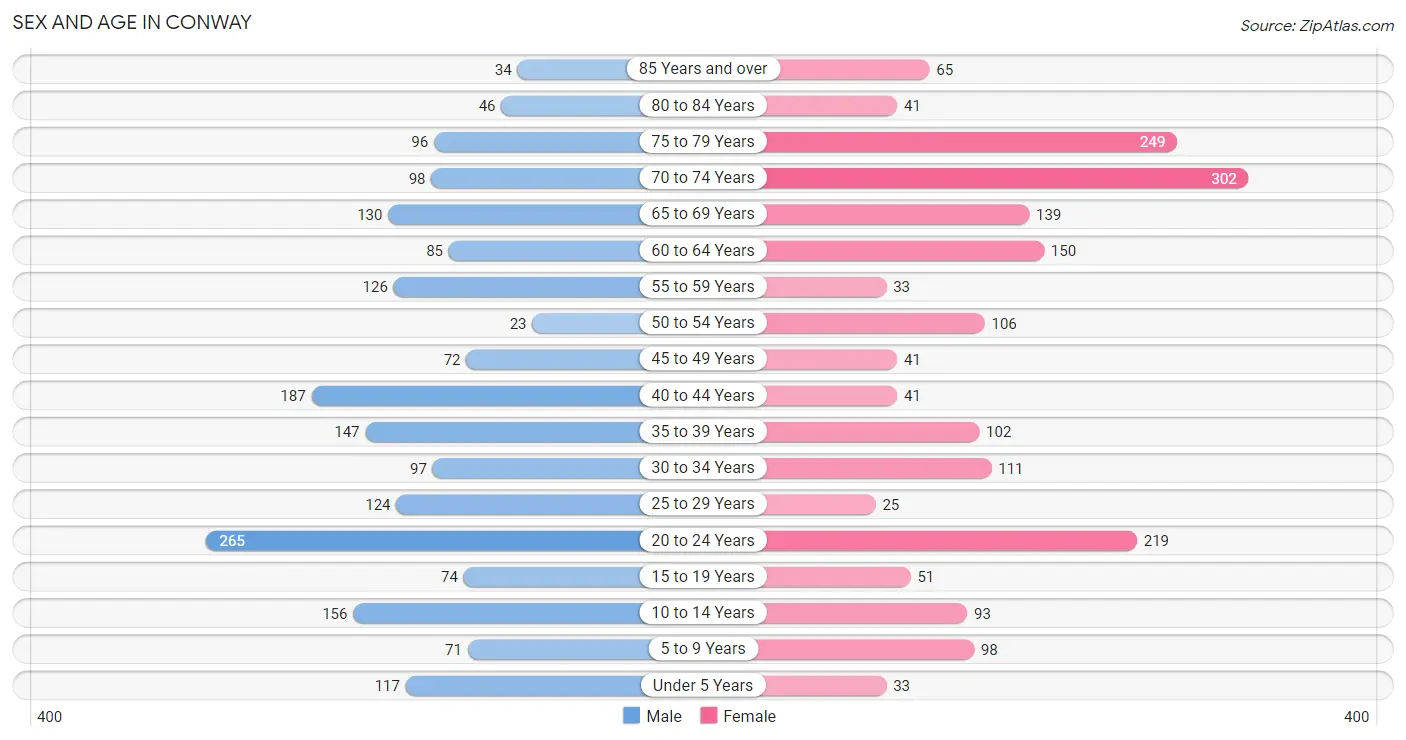
| Age Bracket | Male | Female |
| Under 5 Years | 117 (6.0%) | 33 (1.7%) |
| 5 to 9 Years | 71 (3.6%) | 98 (5.2%) |
| 10 to 14 Years | 156 (8.0%) | 93 (4.9%) |
| 15 to 19 Years | 74 (3.8%) | 51 (2.7%) |
| 20 to 24 Years | 265 (13.6%) | 219 (11.5%) |
| 25 to 29 Years | 124 (6.4%) | 25 (1.3%) |
| 30 to 34 Years | 97 (5.0%) | 111 (5.9%) |
| 35 to 39 Years | 147 (7.5%) | 102 (5.4%) |
| 40 to 44 Years | 187 (9.6%) | 41 (2.2%) |
| 45 to 49 Years | 72 (3.7%) | 41 (2.2%) |
| 50 to 54 Years | 23 (1.2%) | 106 (5.6%) |
| 55 to 59 Years | 126 (6.5%) | 33 (1.7%) |
| 60 to 64 Years | 85 (4.4%) | 150 (7.9%) |
| 65 to 69 Years | 130 (6.7%) | 139 (7.3%) |
| 70 to 74 Years | 98 (5.0%) | 302 (15.9%) |
| 75 to 79 Years | 96 (4.9%) | 249 (13.1%) |
| 80 to 84 Years | 46 (2.4%) | 41 (2.2%) |
| 85 Years and over | 34 (1.8%) | 65 (3.4%) |
| Total | 1,948 (100.0%) | 1,899 (100.0%) |
Families and Households in Conway
Median Family Size in Conway
The median family size in Conway is 3.25 persons per family, with single female/mother families (189 | 20.7%) accounting for the largest median family size of 4.07 persons per family. On the other hand, married-couple families (609 | 66.6%) represent the smallest median family size with 2.84 persons per family.
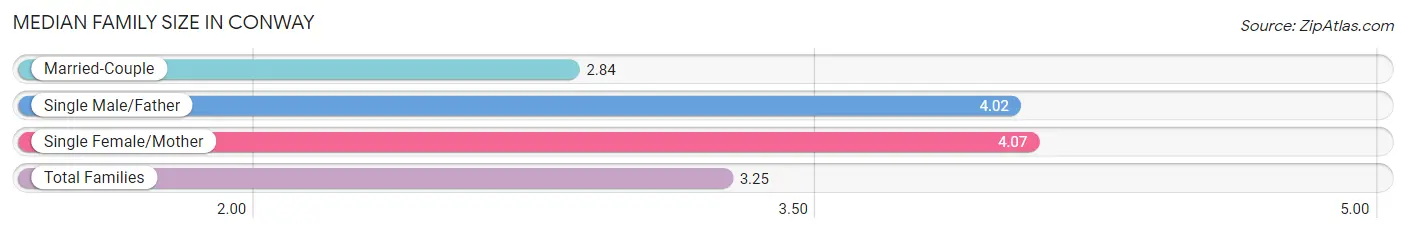
| Family Type | # Families | Family Size |
| Married-Couple | 609 (66.6%) | 2.84 |
| Single Male/Father | 116 (12.7%) | 4.02 |
| Single Female/Mother | 189 (20.7%) | 4.07 |
| Total Families | 914 (100.0%) | 3.25 |
Median Household Size in Conway
The median household size in Conway is 2.38 persons per household, with single female/mother households (189 | 11.7%) accounting for the largest median household size of 4.51 persons per household. non-family households (699 | 43.3%) represent the smallest median household size with 1.09 persons per household.
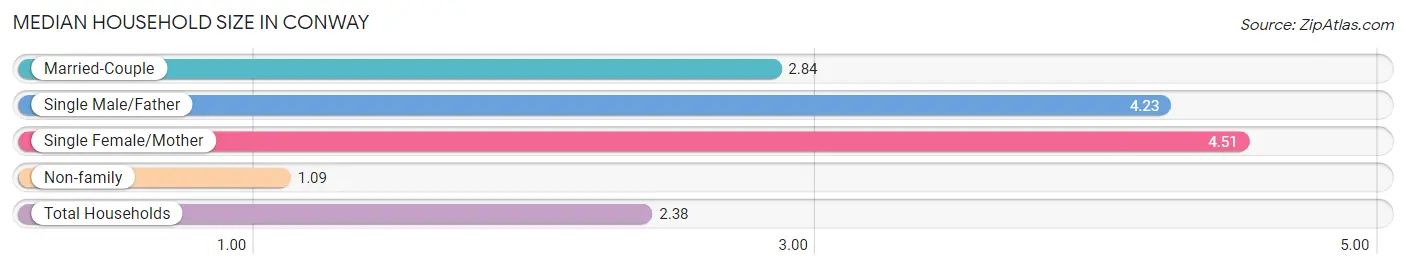
| Household Type | # Households | Household Size |
| Married-Couple | 609 (37.8%) | 2.84 |
| Single Male/Father | 116 (7.2%) | 4.23 |
| Single Female/Mother | 189 (11.7%) | 4.51 |
| Non-family | 699 (43.3%) | 1.09 |
| Total Households | 1,613 (100.0%) | 2.38 |
Household Size by Marriage Status in Conway
Out of a total of 1,613 households in Conway, 914 (56.7%) are family households, while 699 (43.3%) are nonfamily households. The most numerous type of family households are 2-person households, comprising 553, and the most common type of nonfamily households are 1-person households, comprising 653.
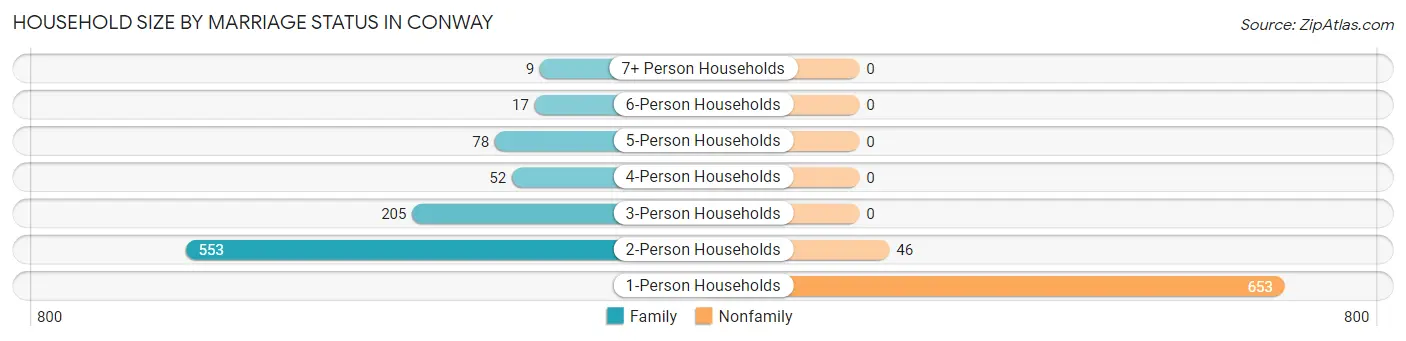
| Household Size | Family Households | Nonfamily Households |
| 1-Person Households | - | 653 (40.5%) |
| 2-Person Households | 553 (34.3%) | 46 (2.9%) |
| 3-Person Households | 205 (12.7%) | 0 (0.0%) |
| 4-Person Households | 52 (3.2%) | 0 (0.0%) |
| 5-Person Households | 78 (4.8%) | 0 (0.0%) |
| 6-Person Households | 17 (1.1%) | 0 (0.0%) |
| 7+ Person Households | 9 (0.6%) | 0 (0.0%) |
| Total | 914 (56.7%) | 699 (43.3%) |
Female Fertility in Conway
Fertility by Age in Conway
Average fertility rate in Conway is 41.0 births per 1,000 women. Women in the age bracket of 20 to 34 years have the highest fertility rate with 70.0 births per 1,000 women. Women in the age bracket of 20 to 34 years acount for 100.0% of all women with births.
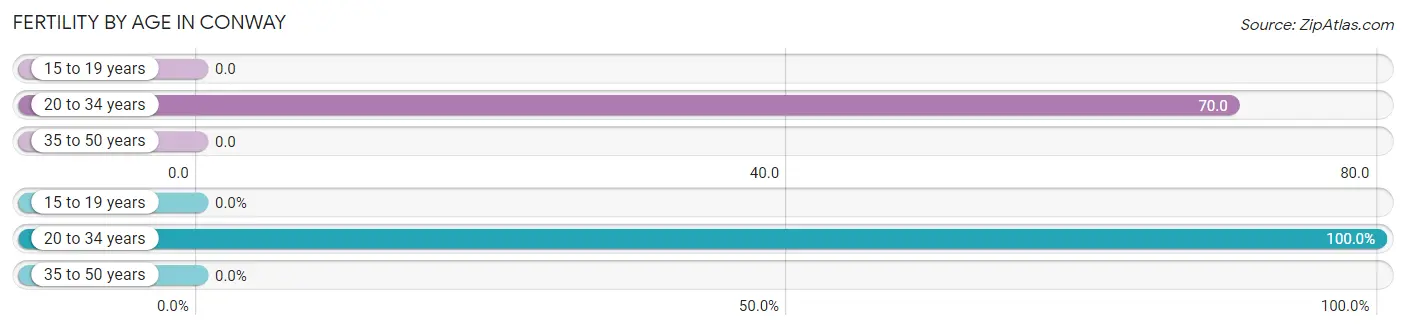
| Age Bracket | Women with Births | Births / 1,000 Women |
| 15 to 19 years | 0 (0.0%) | 0.0 |
| 20 to 34 years | 25 (100.0%) | 70.0 |
| 35 to 50 years | 0 (0.0%) | 0.0 |
| Total | 25 (100.0%) | 41.0 |
Fertility by Age by Marriage Status in Conway
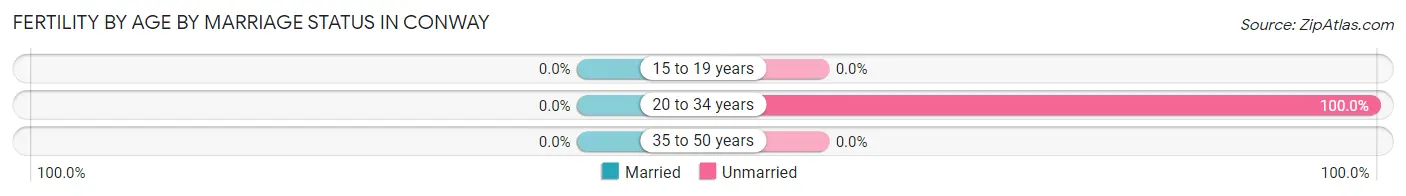
| Age Bracket | Married | Unmarried |
| 15 to 19 years | 0 (0.0%) | 0 (0.0%) |
| 20 to 34 years | 0 (0.0%) | 25 (100.0%) |
| 35 to 50 years | 0 (0.0%) | 0 (0.0%) |
| Total | 0 (0.0%) | 25 (100.0%) |
Fertility by Education in Conway
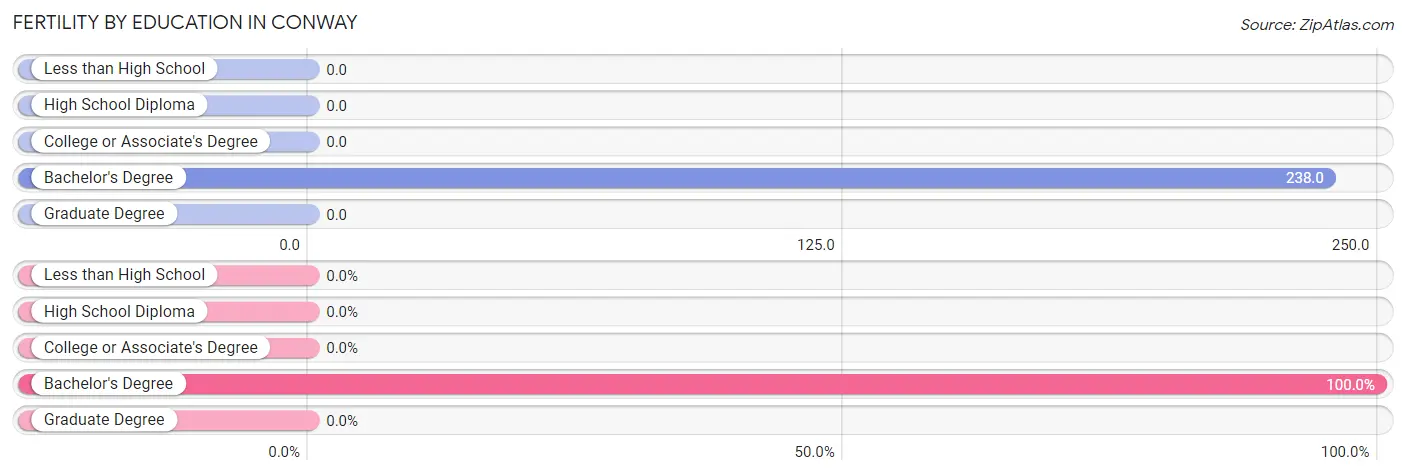
| Educational Attainment | Women with Births | Births / 1,000 Women |
| Less than High School | 0 (0.0%) | 0.0 |
| High School Diploma | 0 (0.0%) | 0.0 |
| College or Associate's Degree | 0 (0.0%) | 0.0 |
| Bachelor's Degree | 25 (100.0%) | 238.0 |
| Graduate Degree | 0 (0.0%) | 0.0 |
| Total | 25 (100.0%) | 41.0 |
Fertility by Education by Marriage Status in Conway
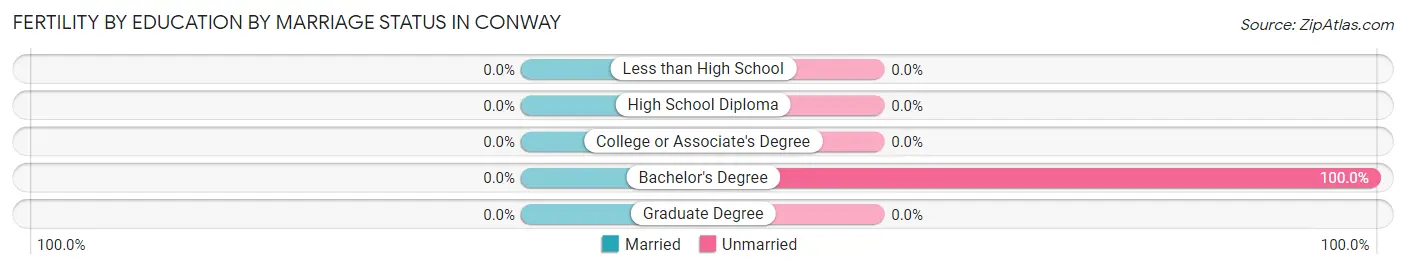
| Educational Attainment | Married | Unmarried |
| Less than High School | 0 (0.0%) | 0 (0.0%) |
| High School Diploma | 0 (0.0%) | 0 (0.0%) |
| College or Associate's Degree | 0 (0.0%) | 0 (0.0%) |
| Bachelor's Degree | 0 (0.0%) | 25 (100.0%) |
| Graduate Degree | 0 (0.0%) | 0 (0.0%) |
| Total | 0 (0.0%) | 25 (100.0%) |
Employment Characteristics in Conway
Employment by Class of Employer in Conway
Among the 1,763 employed individuals in Conway, private company employees (1,217 | 69.0%), not-for-profit organizations (157 | 8.9%), and local government employees (133 | 7.5%) make up the most common classes of employment.
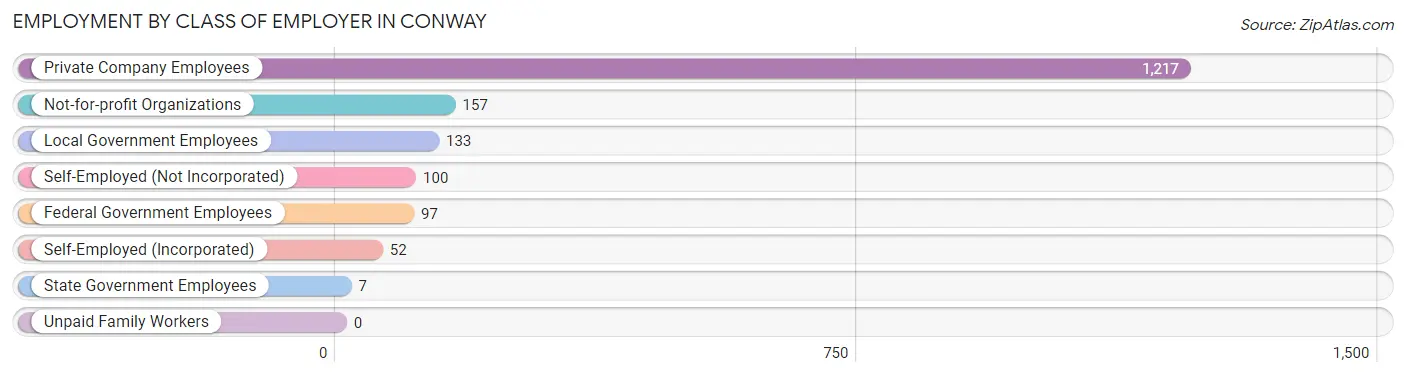
| Employer Class | # Employees | % Employees |
| Private Company Employees | 1,217 | 69.0% |
| Self-Employed (Incorporated) | 52 | 2.9% |
| Self-Employed (Not Incorporated) | 100 | 5.7% |
| Not-for-profit Organizations | 157 | 8.9% |
| Local Government Employees | 133 | 7.5% |
| State Government Employees | 7 | 0.4% |
| Federal Government Employees | 97 | 5.5% |
| Unpaid Family Workers | 0 | 0.0% |
| Total | 1,763 | 100.0% |
Employment Status by Age in Conway
According to the labor force statistics for Conway, out of the total population over 16 years of age (3,276), 63.8% or 2,090 individuals are in the labor force, with 15.3% or 320 of them unemployed. The age group with the highest labor force participation rate is 35 to 44 years, with 100.0% or 477 individuals in the labor force. Within the labor force, the 35 to 44 years age range has the highest percentage of unemployed individuals, with 46.1% or 220 of them being unemployed.
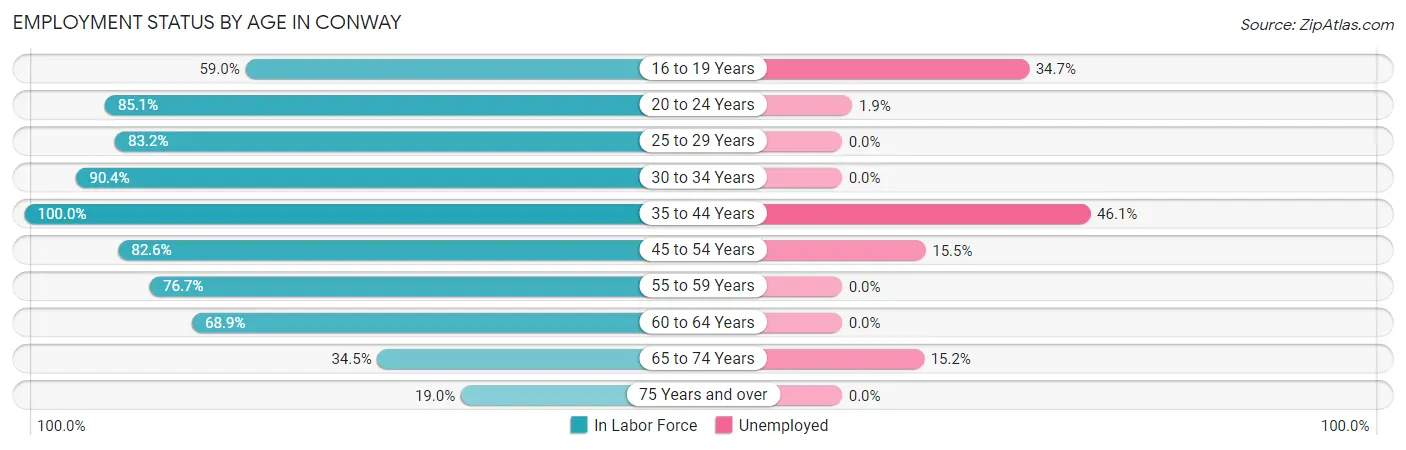
| Age Bracket | In Labor Force | Unemployed |
| 16 to 19 Years | 72 (59.0%) | 25 (34.7%) |
| 20 to 24 Years | 412 (85.1%) | 8 (1.9%) |
| 25 to 29 Years | 124 (83.2%) | 0 (0.0%) |
| 30 to 34 Years | 188 (90.4%) | 0 (0.0%) |
| 35 to 44 Years | 477 (100.0%) | 220 (46.1%) |
| 45 to 54 Years | 200 (82.6%) | 31 (15.5%) |
| 55 to 59 Years | 122 (76.7%) | 0 (0.0%) |
| 60 to 64 Years | 162 (68.9%) | 0 (0.0%) |
| 65 to 74 Years | 231 (34.5%) | 35 (15.2%) |
| 75 Years and over | 101 (19.0%) | 0 (0.0%) |
| Total | 2,090 (63.8%) | 320 (15.3%) |
Employment Status by Educational Attainment in Conway
According to labor force statistics for Conway, 86.6% of individuals (1,273) out of the total population between 25 and 64 years of age (1,470) are in the labor force, with 19.7% or 251 of them being unemployed. The group with the highest labor force participation rate are those with the educational attainment of bachelor's degree or higher, with 89.7% or 506 individuals in the labor force. Within the labor force, individuals with bachelor's degree or higher education have the highest percentage of unemployment, with 35.8% or 181 of them being unemployed.
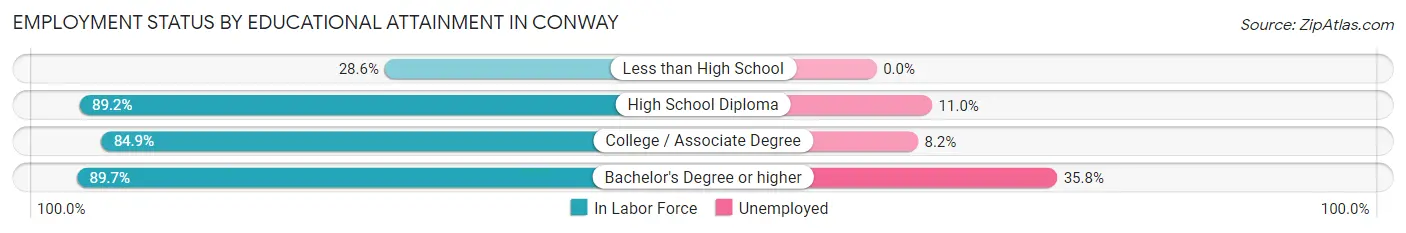
| Educational Attainment | In Labor Force | Unemployed |
| Less than High School | 8 (28.6%) | 0 (0.0%) |
| High School Diploma | 281 (89.2%) | 35 (11.0%) |
| College / Associate Degree | 478 (84.9%) | 46 (8.2%) |
| Bachelor's Degree or higher | 506 (89.7%) | 202 (35.8%) |
| Total | 1,273 (86.6%) | 290 (19.7%) |
Employment Occupations by Sex in Conway
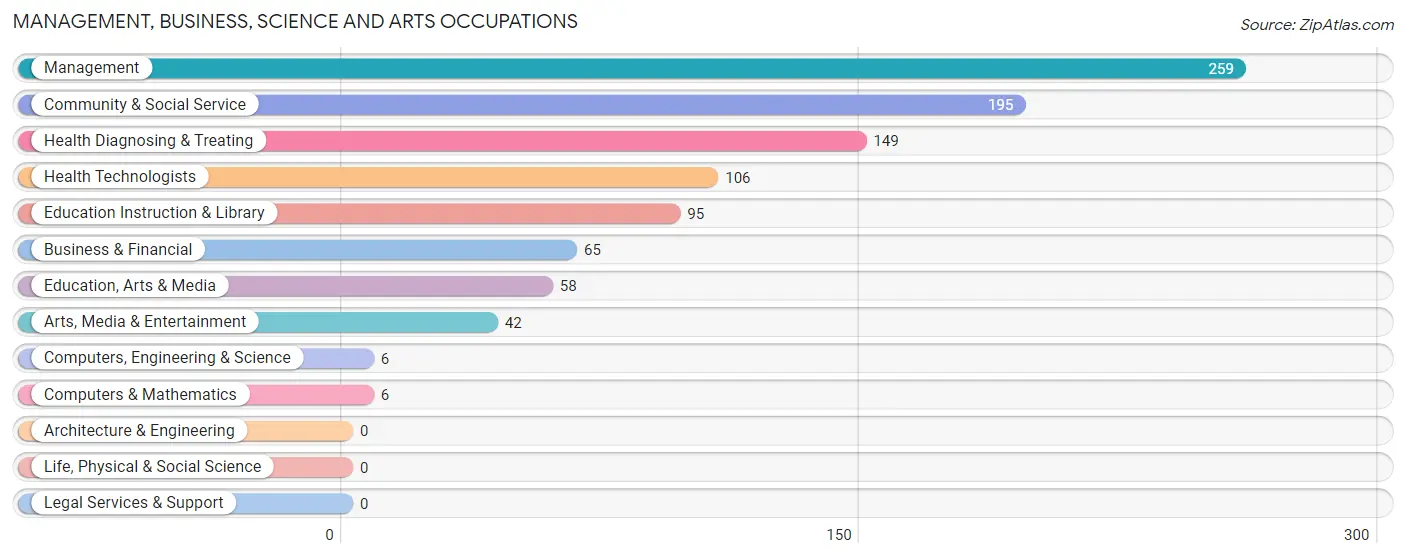
Management, Business, Science and Arts Occupations
The most common Management, Business, Science and Arts occupations in Conway are Management (259 | 14.6%), Community & Social Service (195 | 11.0%), Health Diagnosing & Treating (149 | 8.4%), Health Technologists (106 | 6.0%), and Education Instruction & Library (95 | 5.4%).
Management, Business, Science and Arts Occupations by Sex
Within the Management, Business, Science and Arts occupations in Conway, the most male-oriented occupations are Computers, Engineering & Science (100.0%), Computers & Mathematics (100.0%), and Business & Financial (83.1%), while the most female-oriented occupations are Management (84.9%), Education, Arts & Media (82.8%), and Education Instruction & Library (81.0%).
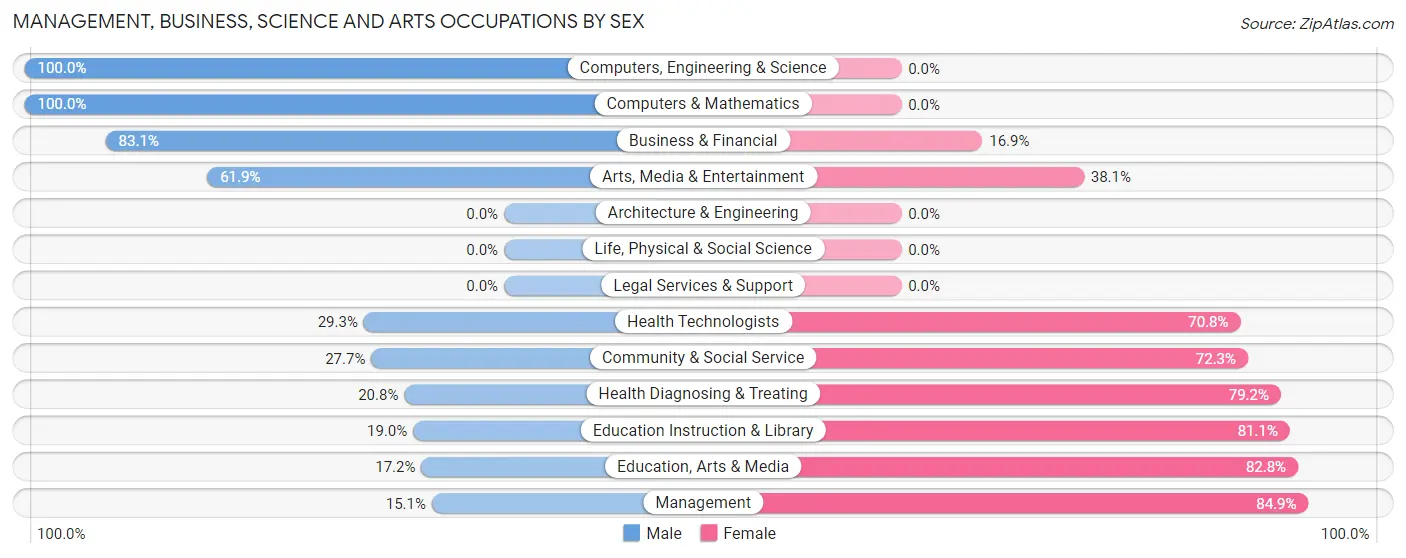
| Occupation | Male | Female |
| Management | 39 (15.1%) | 220 (84.9%) |
| Business & Financial | 54 (83.1%) | 11 (16.9%) |
| Computers, Engineering & Science | 6 (100.0%) | 0 (0.0%) |
| Computers & Mathematics | 6 (100.0%) | 0 (0.0%) |
| Architecture & Engineering | 0 (0.0%) | 0 (0.0%) |
| Life, Physical & Social Science | 0 (0.0%) | 0 (0.0%) |
| Community & Social Service | 54 (27.7%) | 141 (72.3%) |
| Education, Arts & Media | 10 (17.2%) | 48 (82.8%) |
| Legal Services & Support | 0 (0.0%) | 0 (0.0%) |
| Education Instruction & Library | 18 (19.0%) | 77 (81.0%) |
| Arts, Media & Entertainment | 26 (61.9%) | 16 (38.1%) |
| Health Diagnosing & Treating | 31 (20.8%) | 118 (79.2%) |
| Health Technologists | 31 (29.2%) | 75 (70.8%) |
| Total (Category) | 184 (27.3%) | 490 (72.7%) |
| Total (Overall) | 909 (51.4%) | 861 (48.6%) |
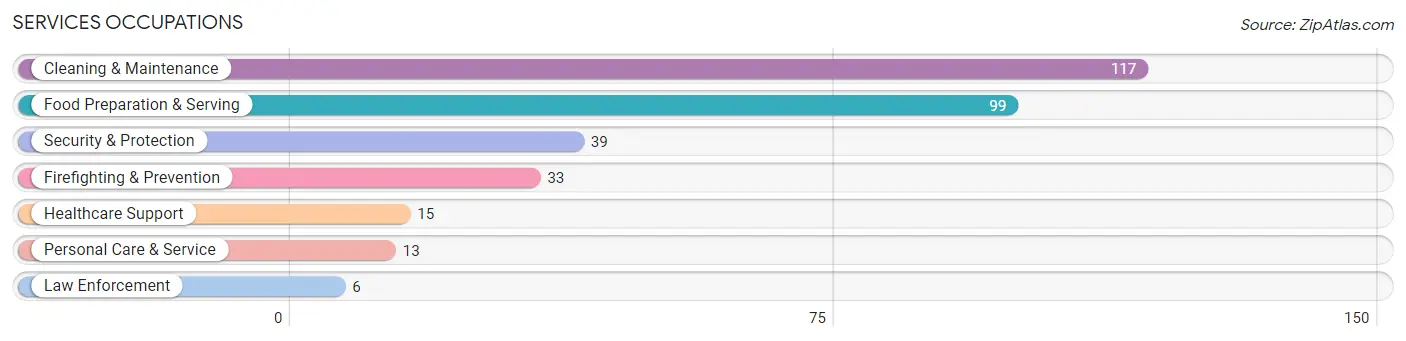
Services Occupations
The most common Services occupations in Conway are Cleaning & Maintenance (117 | 6.6%), Food Preparation & Serving (99 | 5.6%), Security & Protection (39 | 2.2%), Firefighting & Prevention (33 | 1.9%), and Healthcare Support (15 | 0.9%).
Services Occupations by Sex
Within the Services occupations in Conway, the most male-oriented occupations are Security & Protection (100.0%), Firefighting & Prevention (100.0%), and Law Enforcement (100.0%), while the most female-oriented occupations are Healthcare Support (26.7%), Food Preparation & Serving (21.2%), and Cleaning & Maintenance (20.5%).
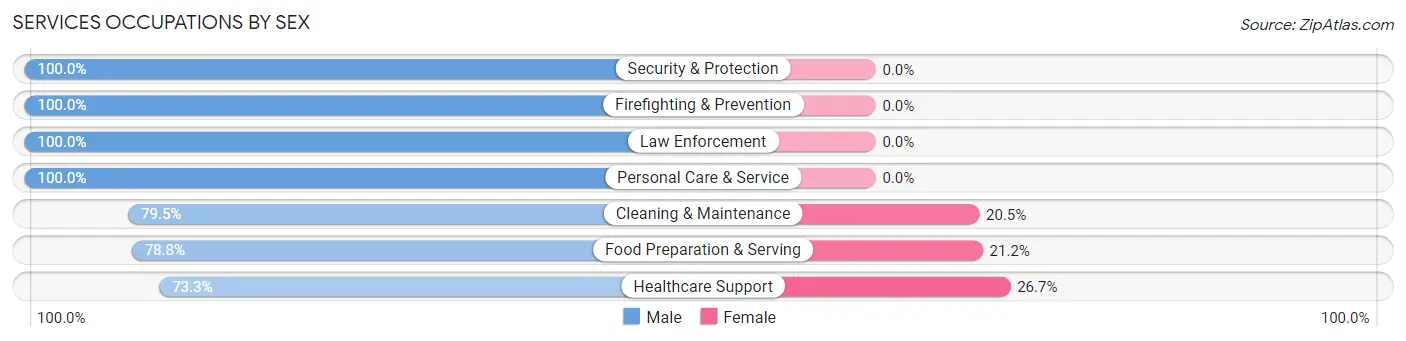
| Occupation | Male | Female |
| Healthcare Support | 11 (73.3%) | 4 (26.7%) |
| Security & Protection | 39 (100.0%) | 0 (0.0%) |
| Firefighting & Prevention | 33 (100.0%) | 0 (0.0%) |
| Law Enforcement | 6 (100.0%) | 0 (0.0%) |
| Food Preparation & Serving | 78 (78.8%) | 21 (21.2%) |
| Cleaning & Maintenance | 93 (79.5%) | 24 (20.5%) |
| Personal Care & Service | 13 (100.0%) | 0 (0.0%) |
| Total (Category) | 234 (82.7%) | 49 (17.3%) |
| Total (Overall) | 909 (51.4%) | 861 (48.6%) |
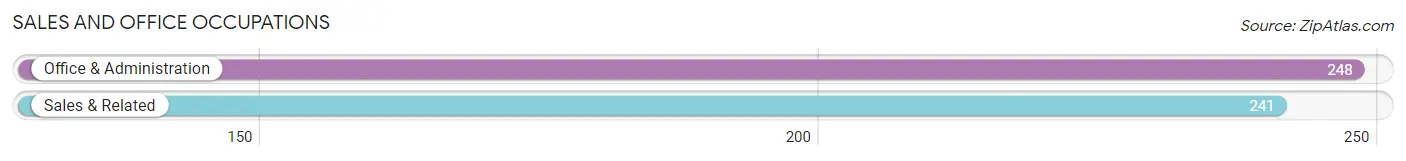
Sales and Office Occupations
The most common Sales and Office occupations in Conway are Office & Administration (248 | 14.0%), and Sales & Related (241 | 13.6%).
Sales and Office Occupations by Sex

| Occupation | Male | Female |
| Sales & Related | 149 (61.8%) | 92 (38.2%) |
| Office & Administration | 26 (10.5%) | 222 (89.5%) |
| Total (Category) | 175 (35.8%) | 314 (64.2%) |
| Total (Overall) | 909 (51.4%) | 861 (48.6%) |
Natural Resources, Construction and Maintenance Occupations
The most common Natural Resources, Construction and Maintenance occupations in Conway are Installation, Maintenance & Repair (156 | 8.8%), and Construction & Extraction (147 | 8.3%).

Natural Resources, Construction and Maintenance Occupations by Sex

| Occupation | Male | Female |
| Farming, Fishing & Forestry | 0 (0.0%) | 0 (0.0%) |
| Construction & Extraction | 147 (100.0%) | 0 (0.0%) |
| Installation, Maintenance & Repair | 156 (100.0%) | 0 (0.0%) |
| Total (Category) | 303 (100.0%) | 0 (0.0%) |
| Total (Overall) | 909 (51.4%) | 861 (48.6%) |
Production, Transportation and Moving Occupations
The most common Production, Transportation and Moving occupations in Conway are , and Production (21 | 1.2%).
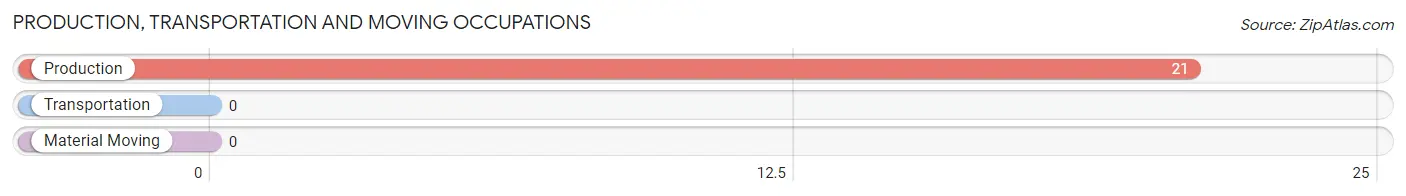
Production, Transportation and Moving Occupations by Sex
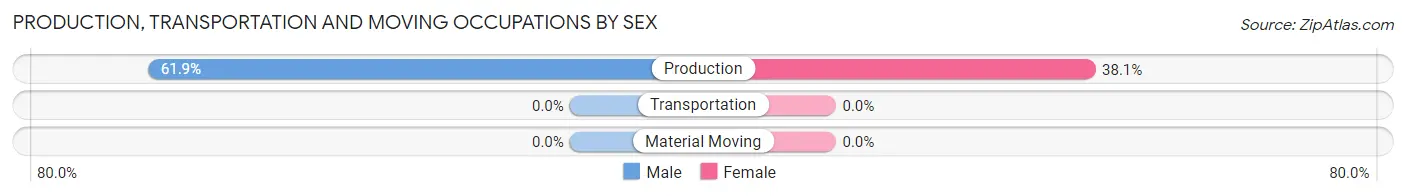
| Occupation | Male | Female |
| Production | 13 (61.9%) | 8 (38.1%) |
| Transportation | 0 (0.0%) | 0 (0.0%) |
| Material Moving | 0 (0.0%) | 0 (0.0%) |
| Total (Category) | 13 (61.9%) | 8 (38.1%) |
| Total (Overall) | 909 (51.4%) | 861 (48.6%) |
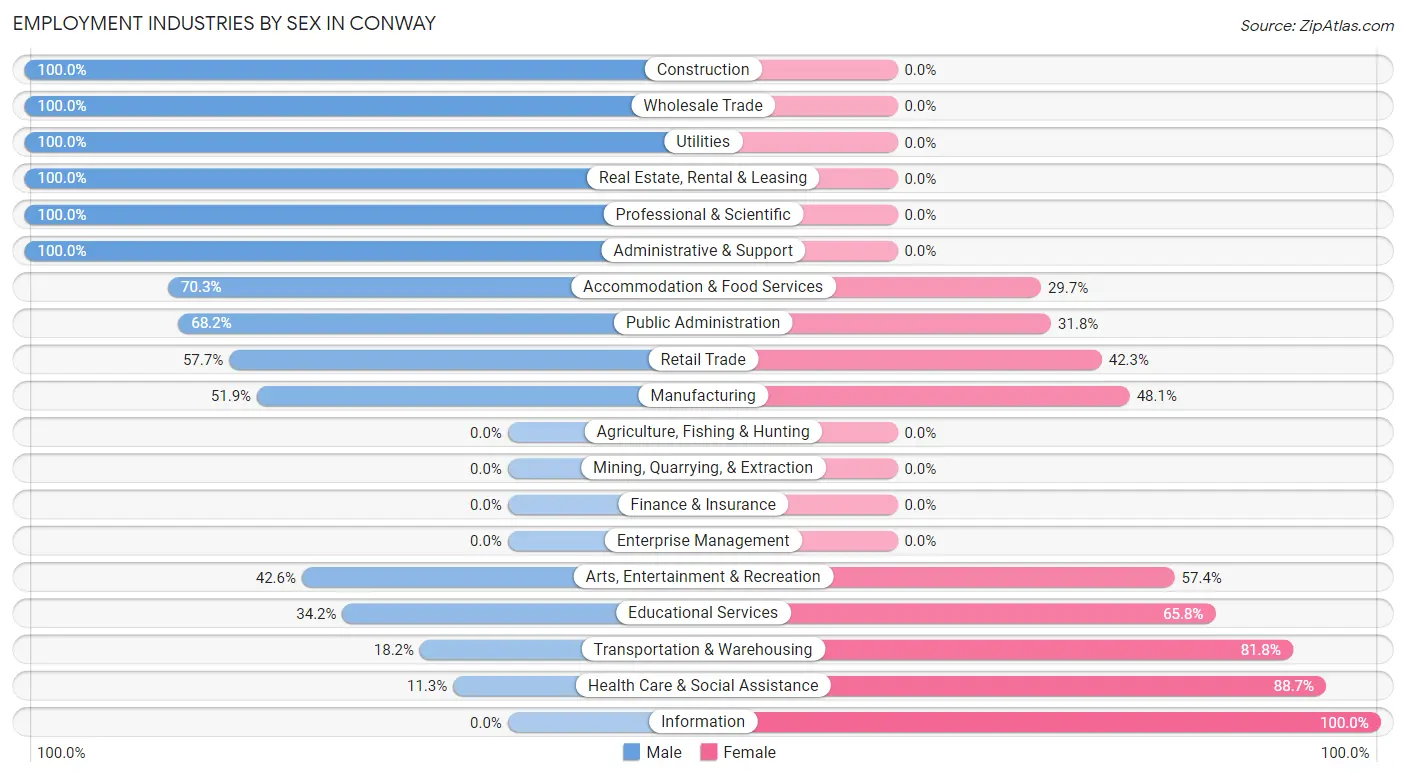
Employment Industries by Sex in Conway
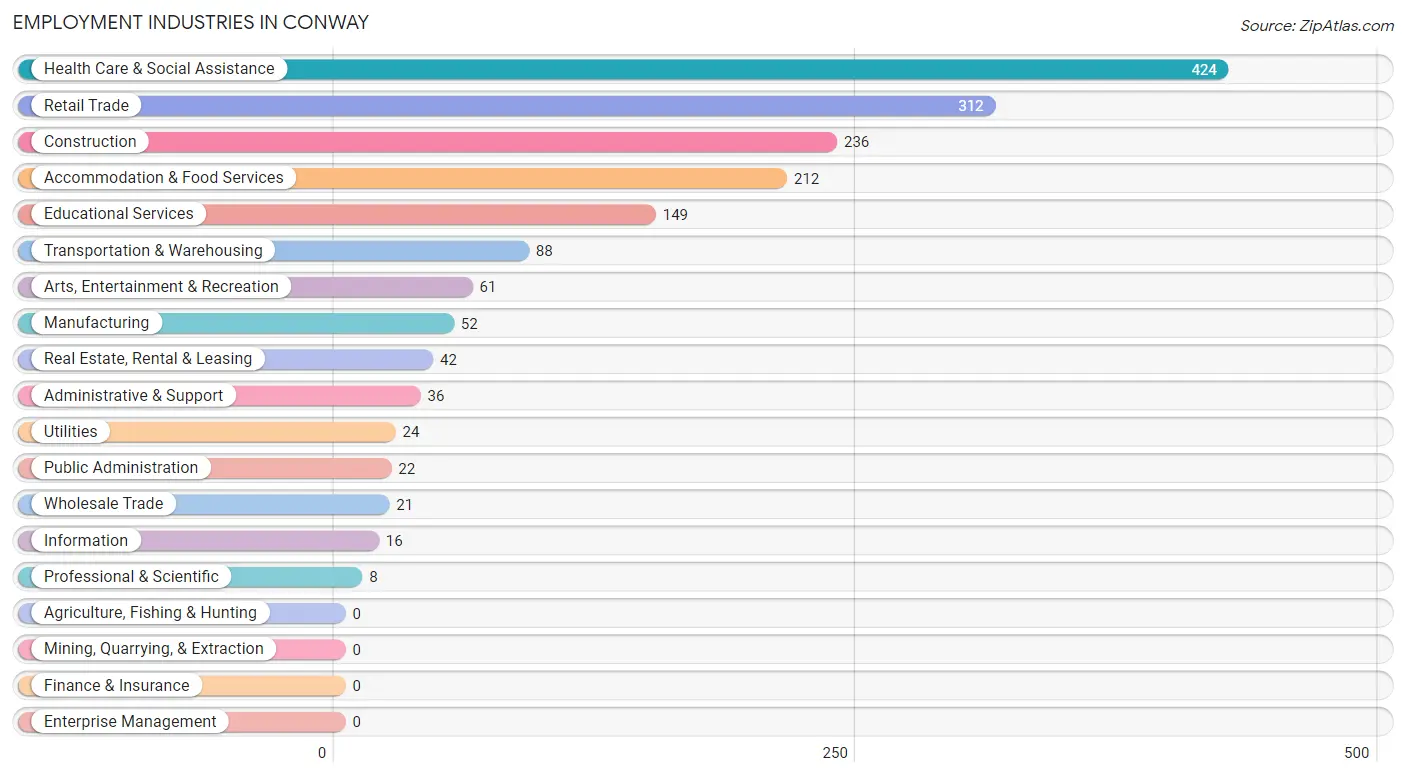
Employment Industries in Conway
The major employment industries in Conway include Health Care & Social Assistance (424 | 23.9%), Retail Trade (312 | 17.6%), Construction (236 | 13.3%), Accommodation & Food Services (212 | 12.0%), and Educational Services (149 | 8.4%).
Employment Industries by Sex in Conway
The Conway industries that see more men than women are Construction (100.0%), Wholesale Trade (100.0%), and Utilities (100.0%), whereas the industries that tend to have a higher number of women are Information (100.0%), Health Care & Social Assistance (88.7%), and Transportation & Warehousing (81.8%).
| Industry | Male | Female |
| Agriculture, Fishing & Hunting | 0 (0.0%) | 0 (0.0%) |
| Mining, Quarrying, & Extraction | 0 (0.0%) | 0 (0.0%) |
| Construction | 236 (100.0%) | 0 (0.0%) |
| Manufacturing | 27 (51.9%) | 25 (48.1%) |
| Wholesale Trade | 21 (100.0%) | 0 (0.0%) |
| Retail Trade | 180 (57.7%) | 132 (42.3%) |
| Transportation & Warehousing | 16 (18.2%) | 72 (81.8%) |
| Utilities | 24 (100.0%) | 0 (0.0%) |
| Information | 0 (0.0%) | 16 (100.0%) |
| Finance & Insurance | 0 (0.0%) | 0 (0.0%) |
| Real Estate, Rental & Leasing | 42 (100.0%) | 0 (0.0%) |
| Professional & Scientific | 8 (100.0%) | 0 (0.0%) |
| Enterprise Management | 0 (0.0%) | 0 (0.0%) |
| Administrative & Support | 36 (100.0%) | 0 (0.0%) |
| Educational Services | 51 (34.2%) | 98 (65.8%) |
| Health Care & Social Assistance | 48 (11.3%) | 376 (88.7%) |
| Arts, Entertainment & Recreation | 26 (42.6%) | 35 (57.4%) |
| Accommodation & Food Services | 149 (70.3%) | 63 (29.7%) |
| Public Administration | 15 (68.2%) | 7 (31.8%) |
| Total | 909 (51.4%) | 861 (48.6%) |
Education in Conway
School Enrollment in Conway
The most common levels of schooling among the 804 students in Conway are college / undergraduate (308 | 38.3%), middle school (208 | 25.9%), and elementary school (150 | 18.7%).
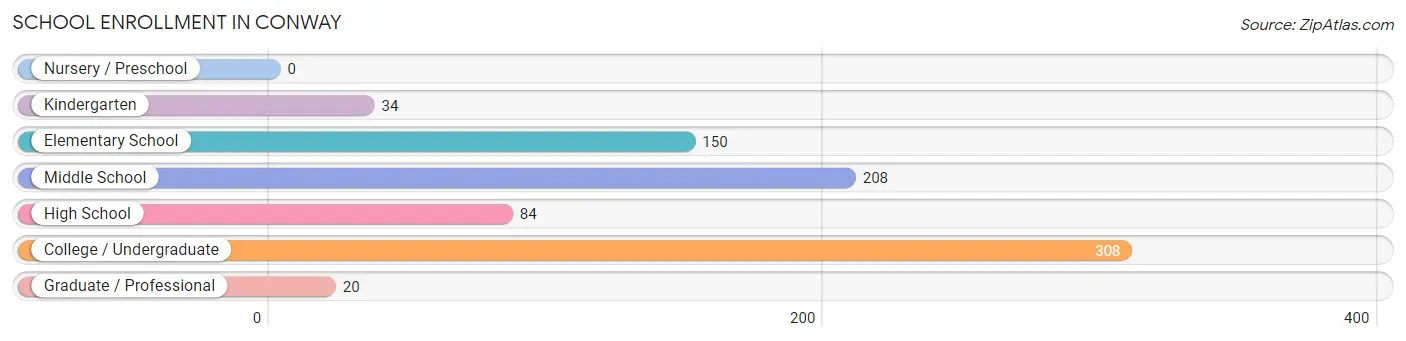
| School Level | # Students | % Students |
| Nursery / Preschool | 0 | 0.0% |
| Kindergarten | 34 | 4.2% |
| Elementary School | 150 | 18.7% |
| Middle School | 208 | 25.9% |
| High School | 84 | 10.4% |
| College / Undergraduate | 308 | 38.3% |
| Graduate / Professional | 20 | 2.5% |
| Total | 804 | 100.0% |
School Enrollment by Age by Funding Source in Conway
Out of a total of 804 students who are enrolled in schools in Conway, 32 (4.0%) attend a private institution, while the remaining 772 (96.0%) are enrolled in public schools. The age group of 20 to 24 year olds has the highest likelihood of being enrolled in private schools, with 32 (10.1% in the age bracket) enrolled. Conversely, the age group of 5 to 9 year old has the lowest likelihood of being enrolled in a private school, with 169 (100.0% in the age bracket) attending a public institution.
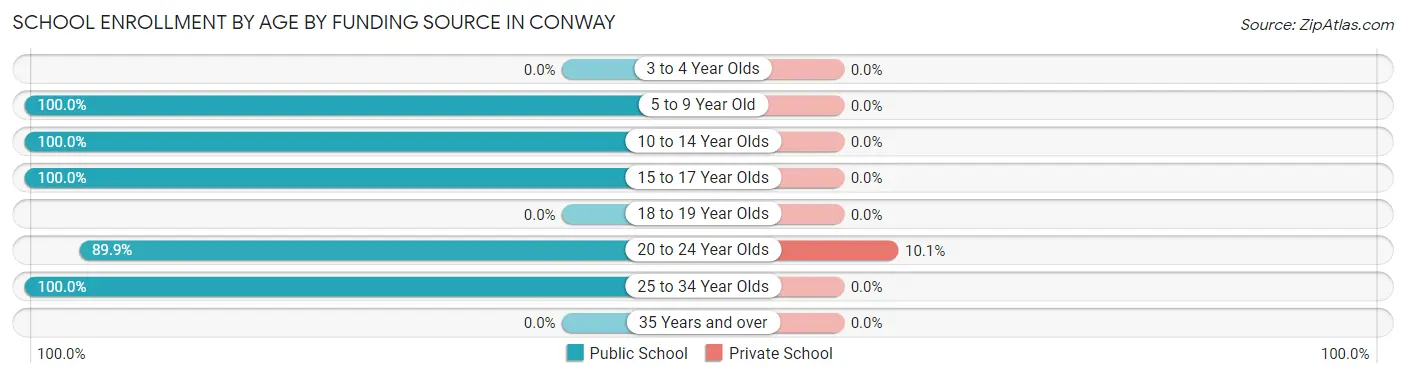
| Age Bracket | Public School | Private School |
| 3 to 4 Year Olds | 0 (0.0%) | 0 (0.0%) |
| 5 to 9 Year Old | 169 (100.0%) | 0 (0.0%) |
| 10 to 14 Year Olds | 249 (100.0%) | 0 (0.0%) |
| 15 to 17 Year Olds | 58 (100.0%) | 0 (0.0%) |
| 18 to 19 Year Olds | 0 (0.0%) | 0 (0.0%) |
| 20 to 24 Year Olds | 284 (89.9%) | 32 (10.1%) |
| 25 to 34 Year Olds | 12 (100.0%) | 0 (0.0%) |
| 35 Years and over | 0 (0.0%) | 0 (0.0%) |
| Total | 772 (96.0%) | 32 (4.0%) |
Educational Attainment by Field of Study in Conway
Business (309 | 31.2%), education (160 | 16.2%), literature & languages (103 | 10.4%), bio, nature & agricultural (85 | 8.6%), and science & technology (76 | 7.7%) are the most common fields of study among 989 individuals in Conway who have obtained a bachelor's degree or higher.
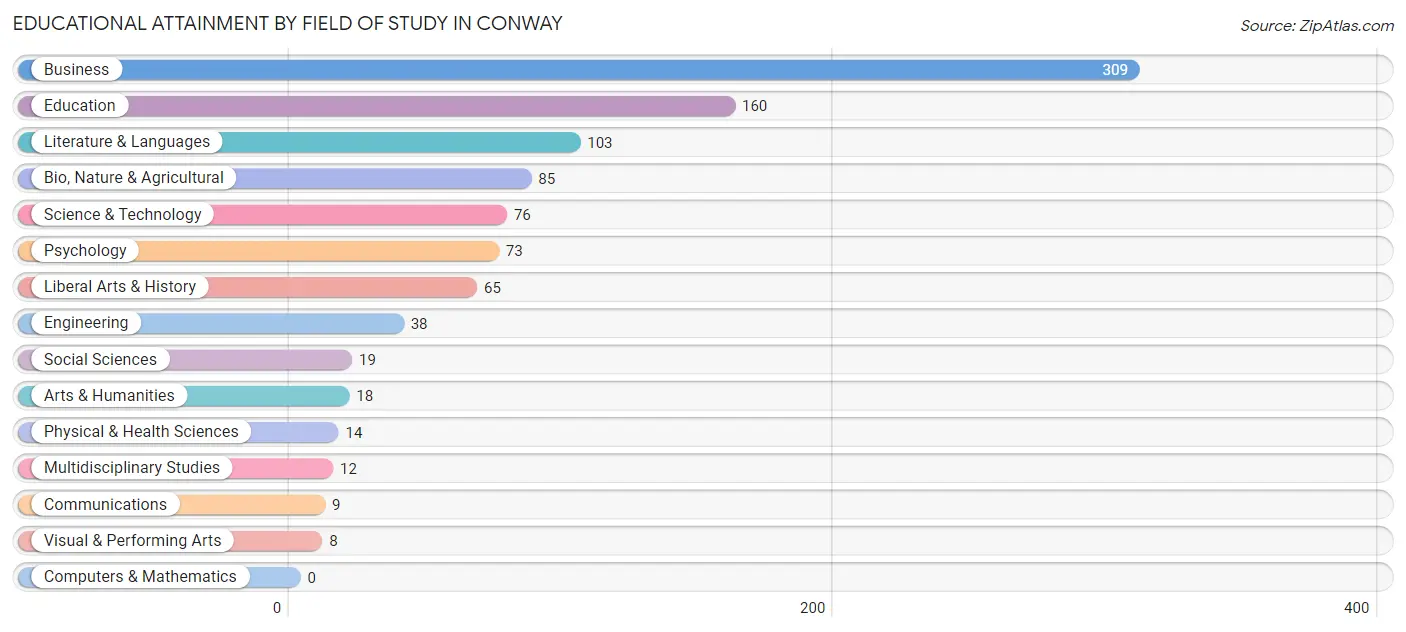
| Field of Study | # Graduates | % Graduates |
| Computers & Mathematics | 0 | 0.0% |
| Bio, Nature & Agricultural | 85 | 8.6% |
| Physical & Health Sciences | 14 | 1.4% |
| Psychology | 73 | 7.4% |
| Social Sciences | 19 | 1.9% |
| Engineering | 38 | 3.8% |
| Multidisciplinary Studies | 12 | 1.2% |
| Science & Technology | 76 | 7.7% |
| Business | 309 | 31.2% |
| Education | 160 | 16.2% |
| Literature & Languages | 103 | 10.4% |
| Liberal Arts & History | 65 | 6.6% |
| Visual & Performing Arts | 8 | 0.8% |
| Communications | 9 | 0.9% |
| Arts & Humanities | 18 | 1.8% |
| Total | 989 | 100.0% |
Transportation & Commute in Conway
Vehicle Availability by Sex in Conway
The most prevalent vehicle ownership categories in Conway are males with 2 vehicles (438, accounting for 48.3%) and females with 2 vehicles (239, making up 51.2%).
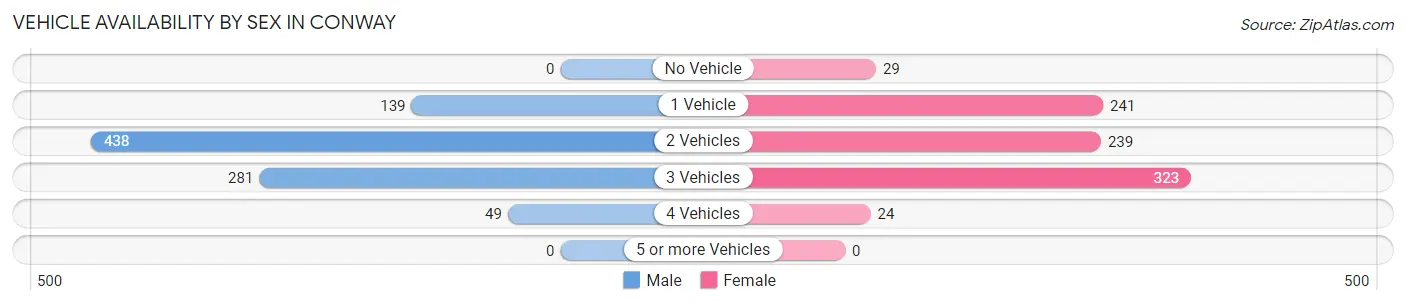
| Vehicles Available | Male | Female |
| No Vehicle | 0 (0.0%) | 29 (3.4%) |
| 1 Vehicle | 139 (15.3%) | 241 (28.1%) |
| 2 Vehicles | 438 (48.3%) | 239 (27.9%) |
| 3 Vehicles | 281 (31.0%) | 323 (37.7%) |
| 4 Vehicles | 49 (5.4%) | 24 (2.8%) |
| 5 or more Vehicles | 0 (0.0%) | 0 (0.0%) |
| Total | 907 (100.0%) | 856 (100.0%) |
Commute Time in Conway
The most frequently occuring commute durations in Conway are 5 to 9 minutes (388 commuters, 26.0%), 10 to 14 minutes (378 commuters, 25.3%), and 15 to 19 minutes (318 commuters, 21.3%).
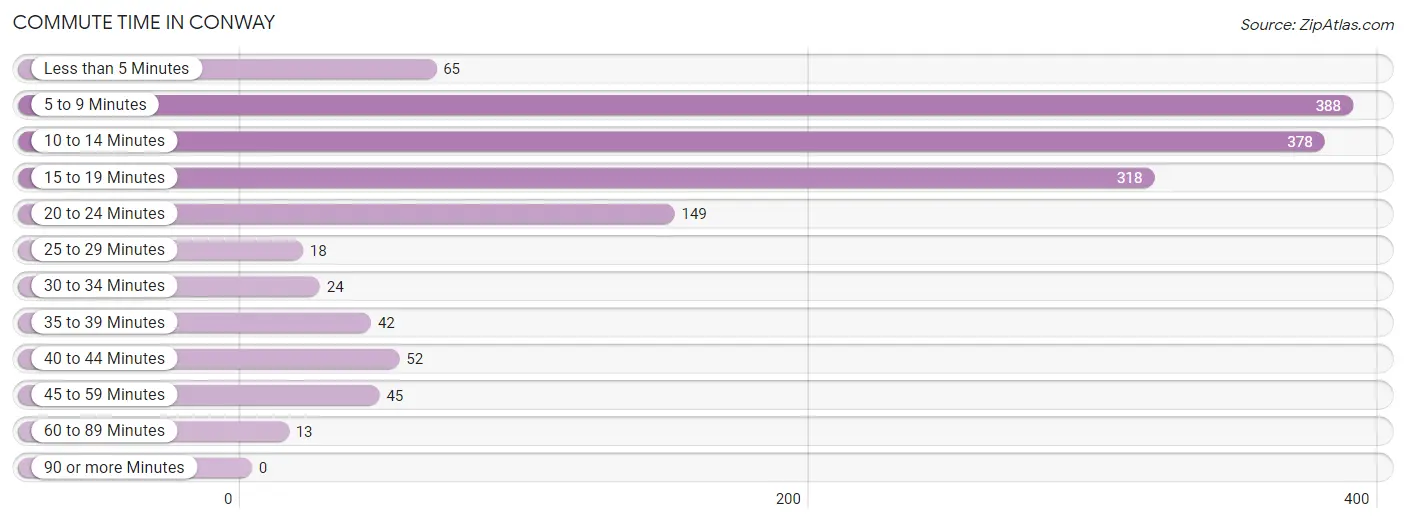
| Commute Time | # Commuters | % Commuters |
| Less than 5 Minutes | 65 | 4.4% |
| 5 to 9 Minutes | 388 | 26.0% |
| 10 to 14 Minutes | 378 | 25.3% |
| 15 to 19 Minutes | 318 | 21.3% |
| 20 to 24 Minutes | 149 | 10.0% |
| 25 to 29 Minutes | 18 | 1.2% |
| 30 to 34 Minutes | 24 | 1.6% |
| 35 to 39 Minutes | 42 | 2.8% |
| 40 to 44 Minutes | 52 | 3.5% |
| 45 to 59 Minutes | 45 | 3.0% |
| 60 to 89 Minutes | 13 | 0.9% |
| 90 or more Minutes | 0 | 0.0% |
Commute Time by Sex in Conway
The most common commute times in Conway are 5 to 9 minutes (237 commuters, 27.4%) for males and 10 to 14 minutes (201 commuters, 32.1%) for females.
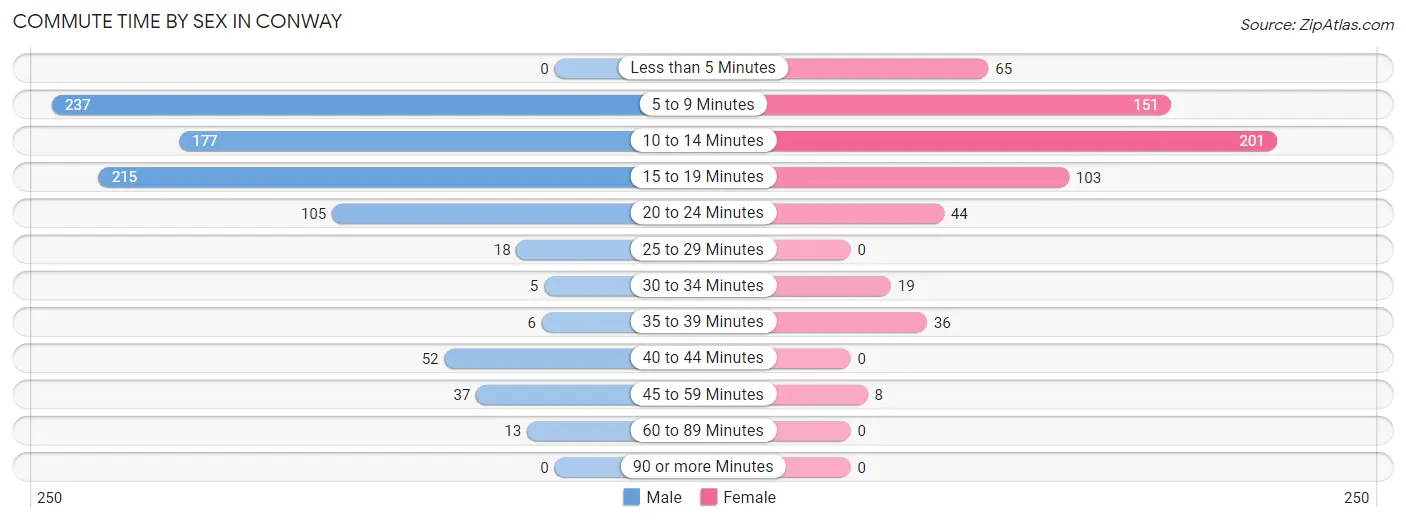
| Commute Time | Male | Female |
| Less than 5 Minutes | 0 (0.0%) | 65 (10.4%) |
| 5 to 9 Minutes | 237 (27.4%) | 151 (24.1%) |
| 10 to 14 Minutes | 177 (20.5%) | 201 (32.1%) |
| 15 to 19 Minutes | 215 (24.9%) | 103 (16.4%) |
| 20 to 24 Minutes | 105 (12.1%) | 44 (7.0%) |
| 25 to 29 Minutes | 18 (2.1%) | 0 (0.0%) |
| 30 to 34 Minutes | 5 (0.6%) | 19 (3.0%) |
| 35 to 39 Minutes | 6 (0.7%) | 36 (5.7%) |
| 40 to 44 Minutes | 52 (6.0%) | 0 (0.0%) |
| 45 to 59 Minutes | 37 (4.3%) | 8 (1.3%) |
| 60 to 89 Minutes | 13 (1.5%) | 0 (0.0%) |
| 90 or more Minutes | 0 (0.0%) | 0 (0.0%) |
Time of Departure to Work by Sex in Conway
The most frequent times of departure to work in Conway are 7:30 AM to 7:59 AM (249, 28.8%) for males and 8:00 AM to 8:29 AM (111, 17.7%) for females.
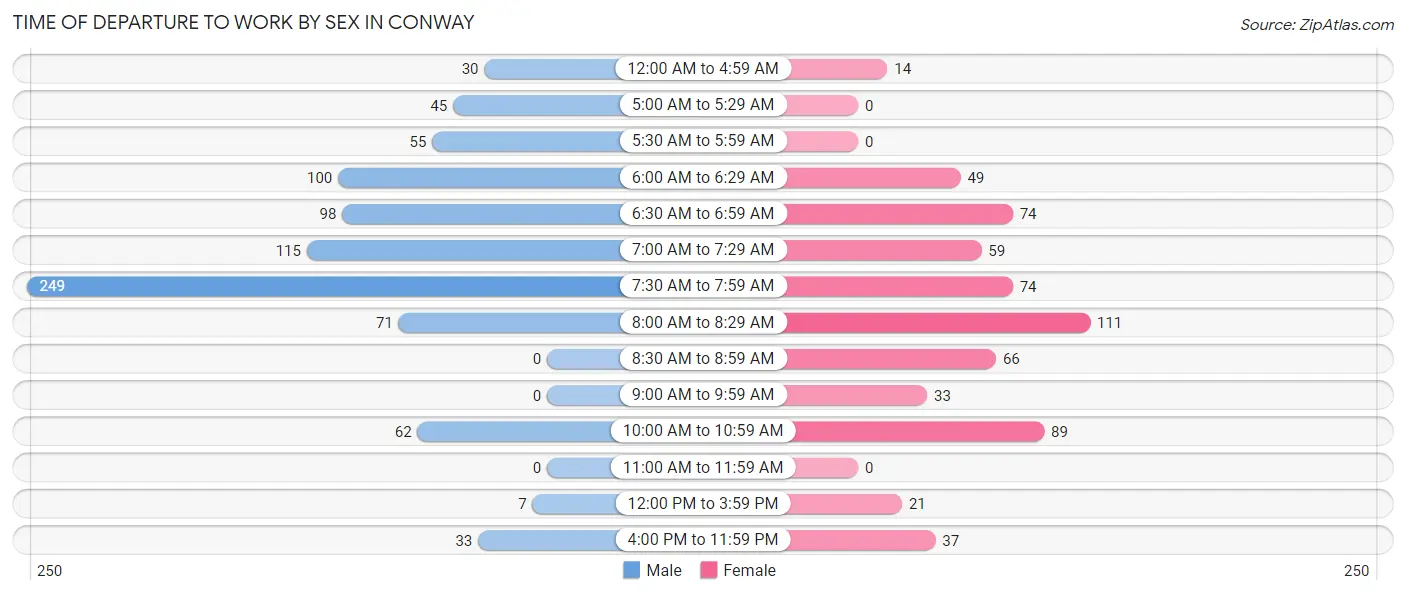
| Time of Departure | Male | Female |
| 12:00 AM to 4:59 AM | 30 (3.5%) | 14 (2.2%) |
| 5:00 AM to 5:29 AM | 45 (5.2%) | 0 (0.0%) |
| 5:30 AM to 5:59 AM | 55 (6.4%) | 0 (0.0%) |
| 6:00 AM to 6:29 AM | 100 (11.6%) | 49 (7.8%) |
| 6:30 AM to 6:59 AM | 98 (11.3%) | 74 (11.8%) |
| 7:00 AM to 7:29 AM | 115 (13.3%) | 59 (9.4%) |
| 7:30 AM to 7:59 AM | 249 (28.8%) | 74 (11.8%) |
| 8:00 AM to 8:29 AM | 71 (8.2%) | 111 (17.7%) |
| 8:30 AM to 8:59 AM | 0 (0.0%) | 66 (10.5%) |
| 9:00 AM to 9:59 AM | 0 (0.0%) | 33 (5.3%) |
| 10:00 AM to 10:59 AM | 62 (7.2%) | 89 (14.2%) |
| 11:00 AM to 11:59 AM | 0 (0.0%) | 0 (0.0%) |
| 12:00 PM to 3:59 PM | 7 (0.8%) | 21 (3.4%) |
| 4:00 PM to 11:59 PM | 33 (3.8%) | 37 (5.9%) |
| Total | 865 (100.0%) | 627 (100.0%) |
Housing Occupancy in Conway
Occupancy by Ownership in Conway
Of the total 1,613 dwellings in Conway, owner-occupied units account for 1,197 (74.2%), while renter-occupied units make up 416 (25.8%).
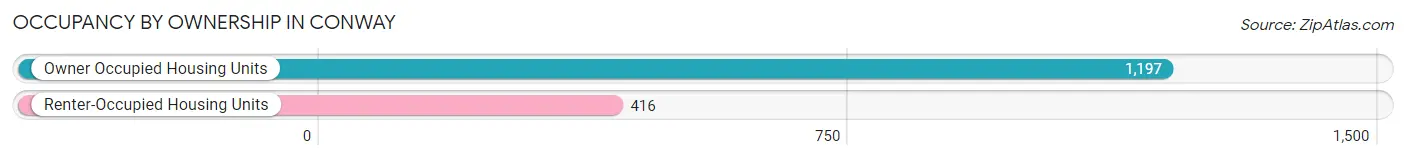
| Occupancy | # Housing Units | % Housing Units |
| Owner Occupied Housing Units | 1,197 | 74.2% |
| Renter-Occupied Housing Units | 416 | 25.8% |
| Total Occupied Housing Units | 1,613 | 100.0% |
Occupancy by Household Size in Conway
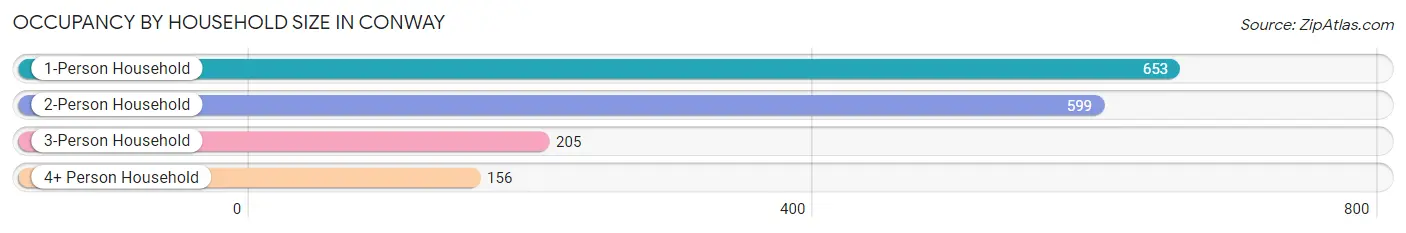
| Household Size | # Housing Units | % Housing Units |
| 1-Person Household | 653 | 40.5% |
| 2-Person Household | 599 | 37.1% |
| 3-Person Household | 205 | 12.7% |
| 4+ Person Household | 156 | 9.7% |
| Total Housing Units | 1,613 | 100.0% |
Occupancy by Ownership by Household Size in Conway
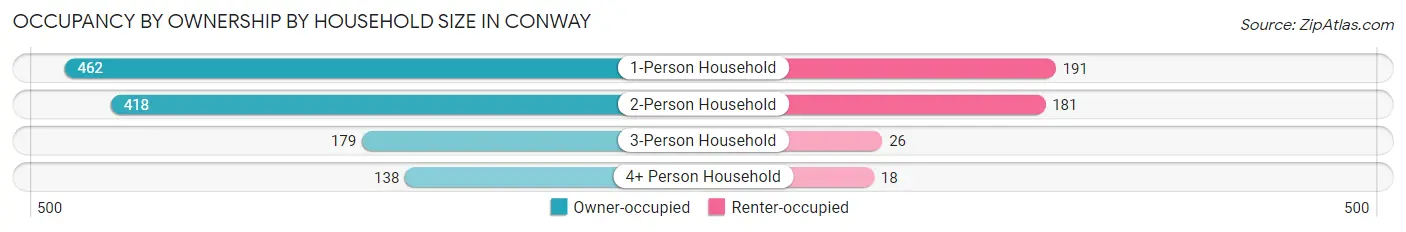
| Household Size | Owner-occupied | Renter-occupied |
| 1-Person Household | 462 (70.8%) | 191 (29.2%) |
| 2-Person Household | 418 (69.8%) | 181 (30.2%) |
| 3-Person Household | 179 (87.3%) | 26 (12.7%) |
| 4+ Person Household | 138 (88.5%) | 18 (11.5%) |
| Total Housing Units | 1,197 (74.2%) | 416 (25.8%) |
Occupancy by Educational Attainment in Conway
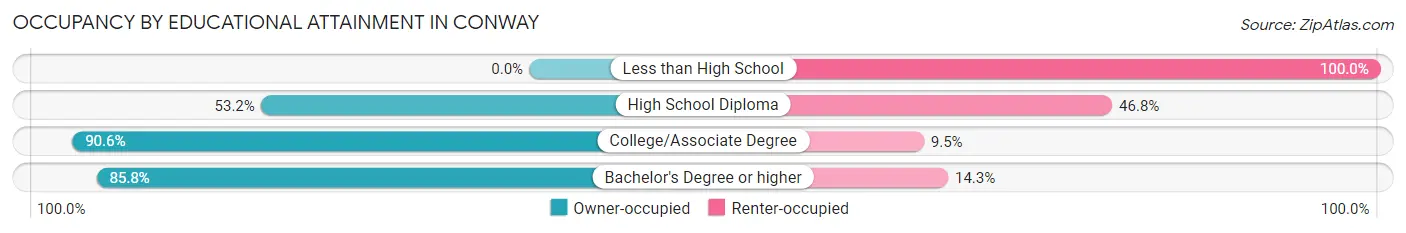
| Household Size | Owner-occupied | Renter-occupied |
| Less than High School | 0 (0.0%) | 44 (100.0%) |
| High School Diploma | 290 (53.2%) | 255 (46.8%) |
| College/Associate Degree | 546 (90.5%) | 57 (9.5%) |
| Bachelor's Degree or higher | 361 (85.8%) | 60 (14.2%) |
Occupancy by Age of Householder in Conway
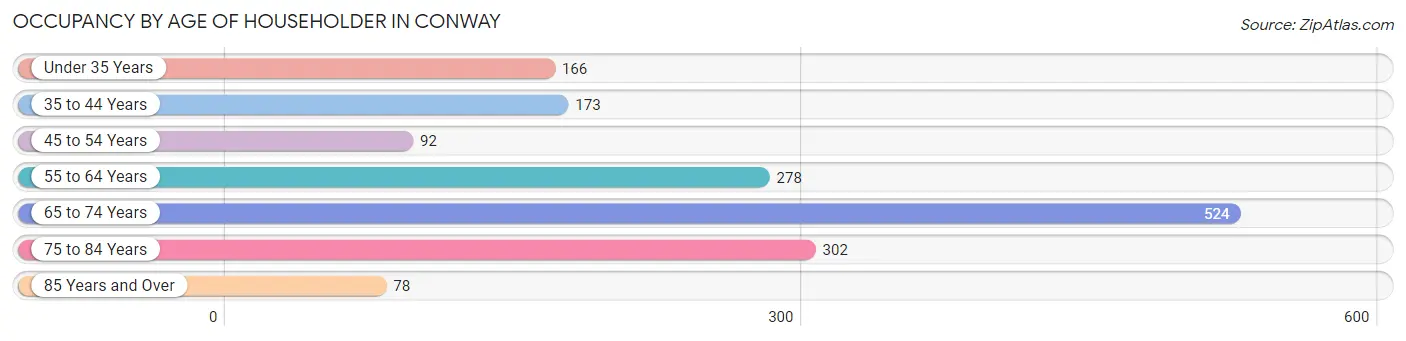
| Age Bracket | # Households | % Households |
| Under 35 Years | 166 | 10.3% |
| 35 to 44 Years | 173 | 10.7% |
| 45 to 54 Years | 92 | 5.7% |
| 55 to 64 Years | 278 | 17.2% |
| 65 to 74 Years | 524 | 32.5% |
| 75 to 84 Years | 302 | 18.7% |
| 85 Years and Over | 78 | 4.8% |
| Total | 1,613 | 100.0% |
Housing Finances in Conway
Median Income by Occupancy in Conway
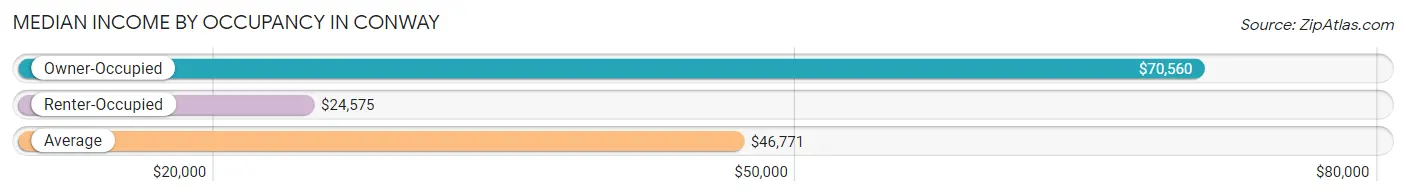
| Occupancy Type | # Households | Median Income |
| Owner-Occupied | 1,197 (74.2%) | $70,560 |
| Renter-Occupied | 416 (25.8%) | $24,575 |
| Average | 1,613 (100.0%) | $46,771 |
Occupancy by Householder Income Bracket in Conway
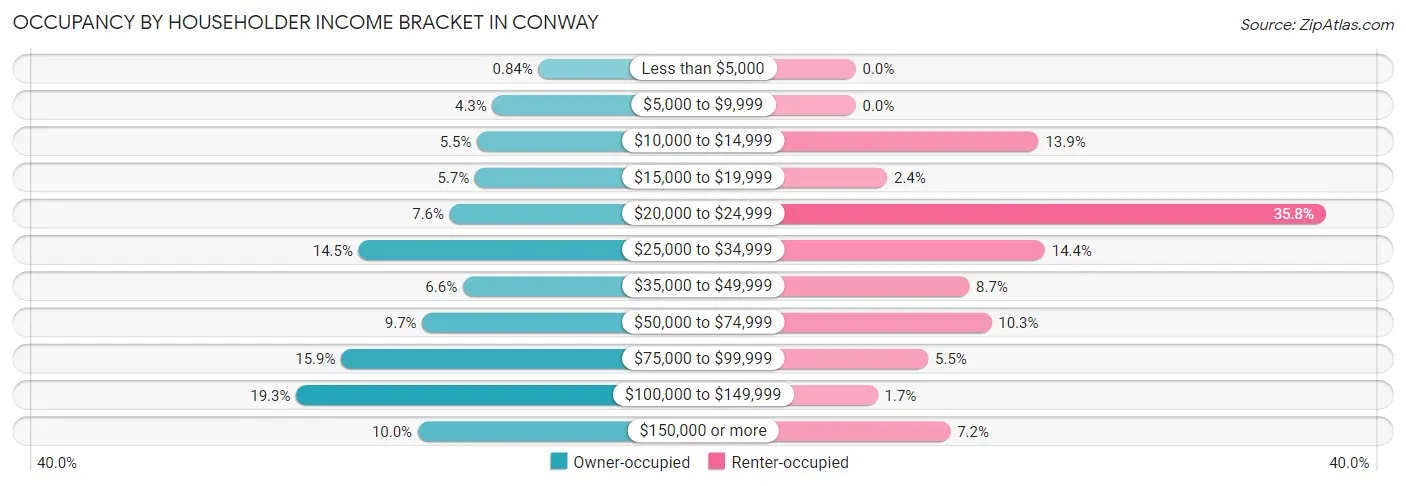
| Income Bracket | Owner-occupied | Renter-occupied |
| Less than $5,000 | 10 (0.8%) | 0 (0.0%) |
| $5,000 to $9,999 | 52 (4.3%) | 0 (0.0%) |
| $10,000 to $14,999 | 66 (5.5%) | 58 (13.9%) |
| $15,000 to $19,999 | 68 (5.7%) | 10 (2.4%) |
| $20,000 to $24,999 | 91 (7.6%) | 149 (35.8%) |
| $25,000 to $34,999 | 174 (14.5%) | 60 (14.4%) |
| $35,000 to $49,999 | 79 (6.6%) | 36 (8.6%) |
| $50,000 to $74,999 | 116 (9.7%) | 43 (10.3%) |
| $75,000 to $99,999 | 190 (15.9%) | 23 (5.5%) |
| $100,000 to $149,999 | 231 (19.3%) | 7 (1.7%) |
| $150,000 or more | 120 (10.0%) | 30 (7.2%) |
| Total | 1,197 (100.0%) | 416 (100.0%) |
Monthly Housing Cost Tiers in Conway
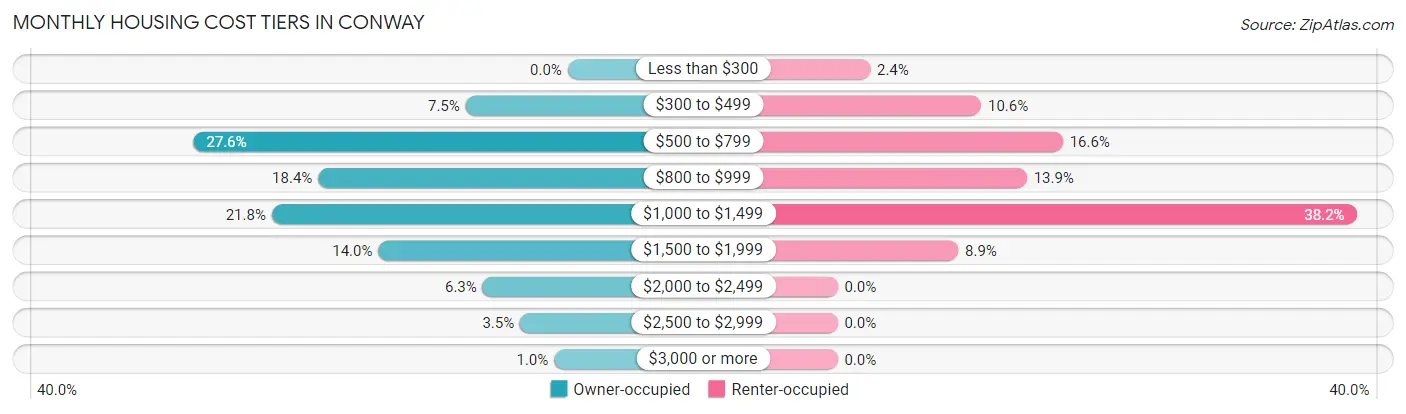
| Monthly Cost | Owner-occupied | Renter-occupied |
| Less than $300 | 0 (0.0%) | 10 (2.4%) |
| $300 to $499 | 90 (7.5%) | 44 (10.6%) |
| $500 to $799 | 330 (27.6%) | 69 (16.6%) |
| $800 to $999 | 220 (18.4%) | 58 (13.9%) |
| $1,000 to $1,499 | 261 (21.8%) | 159 (38.2%) |
| $1,500 to $1,999 | 167 (14.0%) | 37 (8.9%) |
| $2,000 to $2,499 | 75 (6.3%) | 0 (0.0%) |
| $2,500 to $2,999 | 42 (3.5%) | 0 (0.0%) |
| $3,000 or more | 12 (1.0%) | 0 (0.0%) |
| Total | 1,197 (100.0%) | 416 (100.0%) |
Physical Housing Characteristics in Conway
Housing Structures in Conway
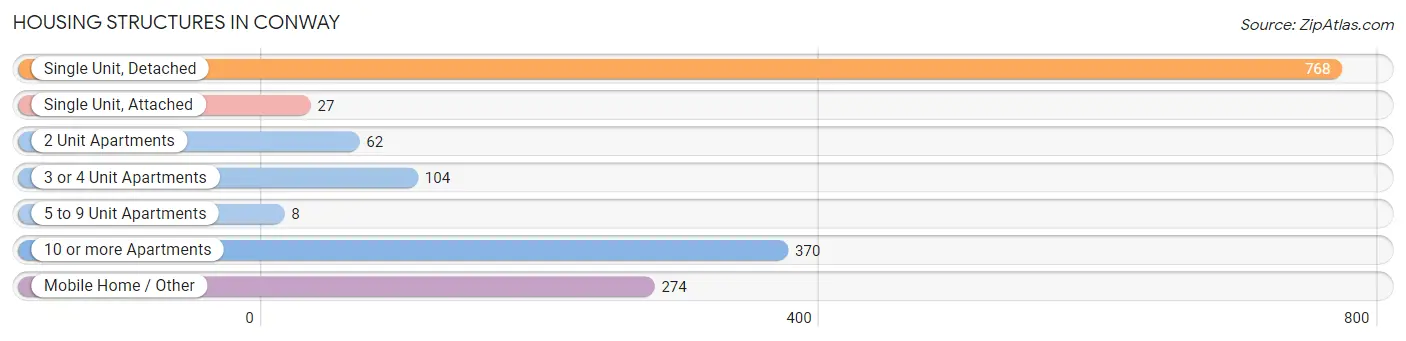
| Structure Type | # Housing Units | % Housing Units |
| Single Unit, Detached | 768 | 47.6% |
| Single Unit, Attached | 27 | 1.7% |
| 2 Unit Apartments | 62 | 3.8% |
| 3 or 4 Unit Apartments | 104 | 6.5% |
| 5 to 9 Unit Apartments | 8 | 0.5% |
| 10 or more Apartments | 370 | 22.9% |
| Mobile Home / Other | 274 | 17.0% |
| Total | 1,613 | 100.0% |
Housing Structures by Occupancy in Conway
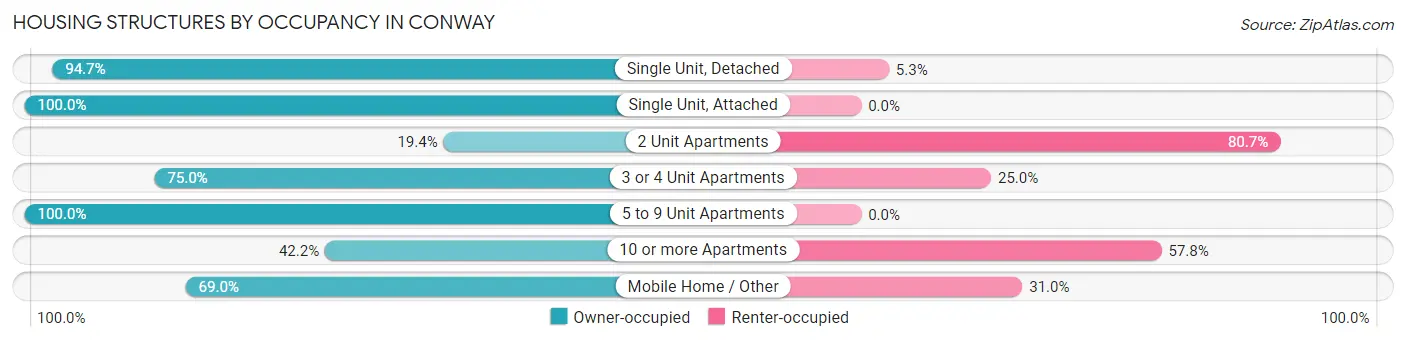
| Structure Type | Owner-occupied | Renter-occupied |
| Single Unit, Detached | 727 (94.7%) | 41 (5.3%) |
| Single Unit, Attached | 27 (100.0%) | 0 (0.0%) |
| 2 Unit Apartments | 12 (19.4%) | 50 (80.6%) |
| 3 or 4 Unit Apartments | 78 (75.0%) | 26 (25.0%) |
| 5 to 9 Unit Apartments | 8 (100.0%) | 0 (0.0%) |
| 10 or more Apartments | 156 (42.2%) | 214 (57.8%) |
| Mobile Home / Other | 189 (69.0%) | 85 (31.0%) |
| Total | 1,197 (74.2%) | 416 (25.8%) |
Housing Structures by Number of Rooms in Conway
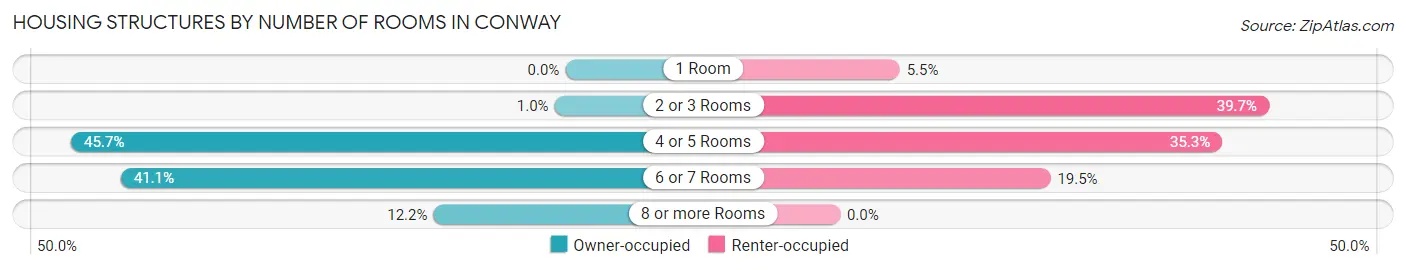
| Number of Rooms | Owner-occupied | Renter-occupied |
| 1 Room | 0 (0.0%) | 23 (5.5%) |
| 2 or 3 Rooms | 12 (1.0%) | 165 (39.7%) |
| 4 or 5 Rooms | 547 (45.7%) | 147 (35.3%) |
| 6 or 7 Rooms | 492 (41.1%) | 81 (19.5%) |
| 8 or more Rooms | 146 (12.2%) | 0 (0.0%) |
| Total | 1,197 (100.0%) | 416 (100.0%) |
Housing Structure by Heating Type in Conway
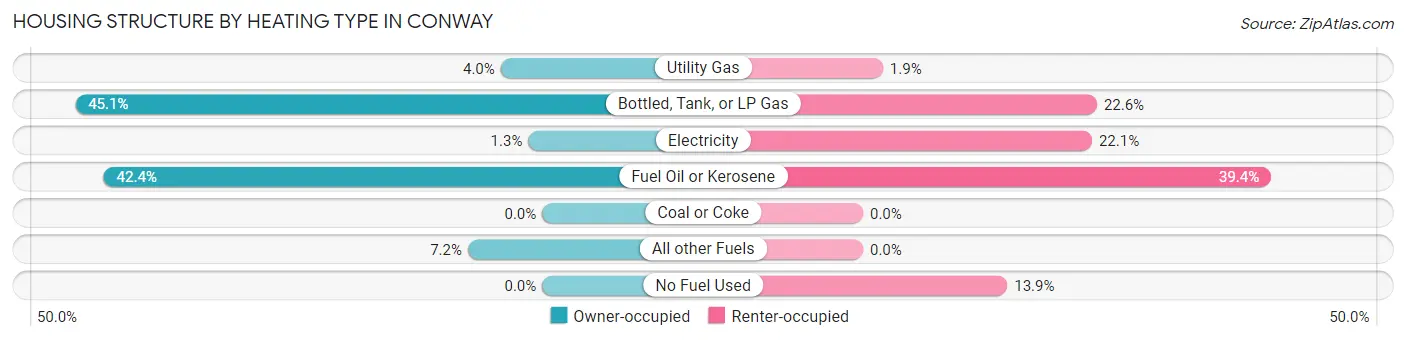
| Heating Type | Owner-occupied | Renter-occupied |
| Utility Gas | 48 (4.0%) | 8 (1.9%) |
| Bottled, Tank, or LP Gas | 540 (45.1%) | 94 (22.6%) |
| Electricity | 16 (1.3%) | 92 (22.1%) |
| Fuel Oil or Kerosene | 507 (42.4%) | 164 (39.4%) |
| Coal or Coke | 0 (0.0%) | 0 (0.0%) |
| All other Fuels | 86 (7.2%) | 0 (0.0%) |
| No Fuel Used | 0 (0.0%) | 58 (13.9%) |
| Total | 1,197 (100.0%) | 416 (100.0%) |
Household Vehicle Usage in Conway
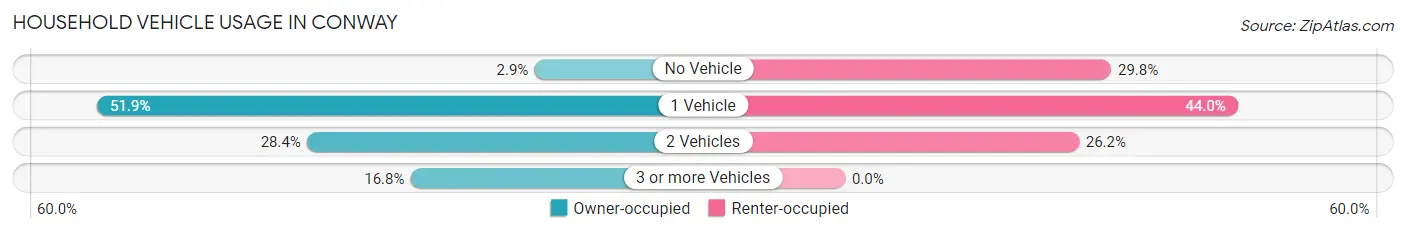
| Vehicles per Household | Owner-occupied | Renter-occupied |
| No Vehicle | 35 (2.9%) | 124 (29.8%) |
| 1 Vehicle | 621 (51.9%) | 183 (44.0%) |
| 2 Vehicles | 340 (28.4%) | 109 (26.2%) |
| 3 or more Vehicles | 201 (16.8%) | 0 (0.0%) |
| Total | 1,197 (100.0%) | 416 (100.0%) |
Real Estate & Mortgages in Conway
Real Estate and Mortgage Overview in Conway
| Characteristic | Without Mortgage | With Mortgage |
| Housing Units | 765 | 432 |
| Median Property Value | $134,600 | $254,400 |
| Median Household Income | $31,490 | $59 |
| Monthly Housing Costs | $805 | $12 |
| Real Estate Taxes | $2,033 | $0 |
Property Value by Mortgage Status in Conway
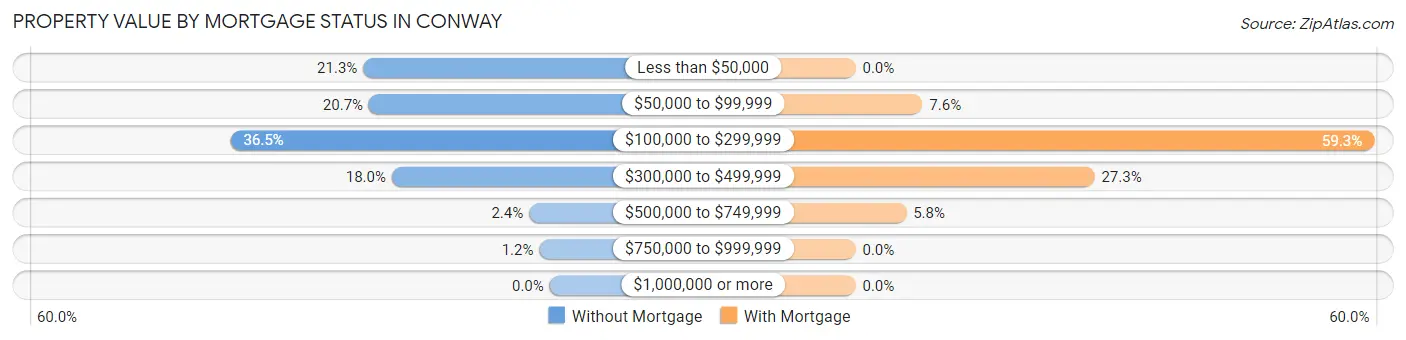
| Property Value | Without Mortgage | With Mortgage |
| Less than $50,000 | 163 (21.3%) | 0 (0.0%) |
| $50,000 to $99,999 | 158 (20.6%) | 33 (7.6%) |
| $100,000 to $299,999 | 279 (36.5%) | 256 (59.3%) |
| $300,000 to $499,999 | 138 (18.0%) | 118 (27.3%) |
| $500,000 to $749,999 | 18 (2.4%) | 25 (5.8%) |
| $750,000 to $999,999 | 9 (1.2%) | 0 (0.0%) |
| $1,000,000 or more | 0 (0.0%) | 0 (0.0%) |
| Total | 765 (100.0%) | 432 (100.0%) |
Household Income by Mortgage Status in Conway
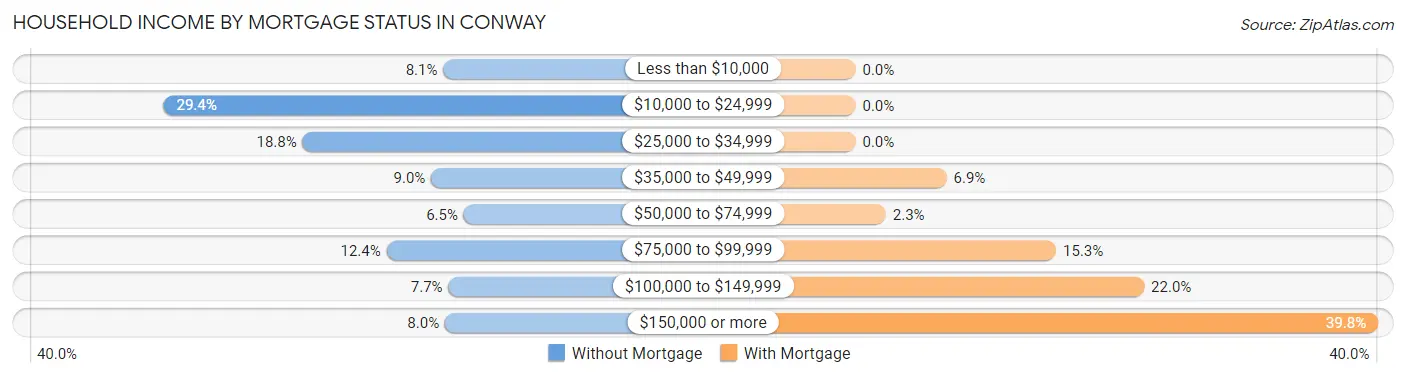
| Household Income | Without Mortgage | With Mortgage |
| Less than $10,000 | 62 (8.1%) | 0 (0.0%) |
| $10,000 to $24,999 | 225 (29.4%) | 0 (0.0%) |
| $25,000 to $34,999 | 144 (18.8%) | 0 (0.0%) |
| $35,000 to $49,999 | 69 (9.0%) | 30 (6.9%) |
| $50,000 to $74,999 | 50 (6.5%) | 10 (2.3%) |
| $75,000 to $99,999 | 95 (12.4%) | 66 (15.3%) |
| $100,000 to $149,999 | 59 (7.7%) | 95 (22.0%) |
| $150,000 or more | 61 (8.0%) | 172 (39.8%) |
| Total | 765 (100.0%) | 432 (100.0%) |
Property Value to Household Income Ratio in Conway
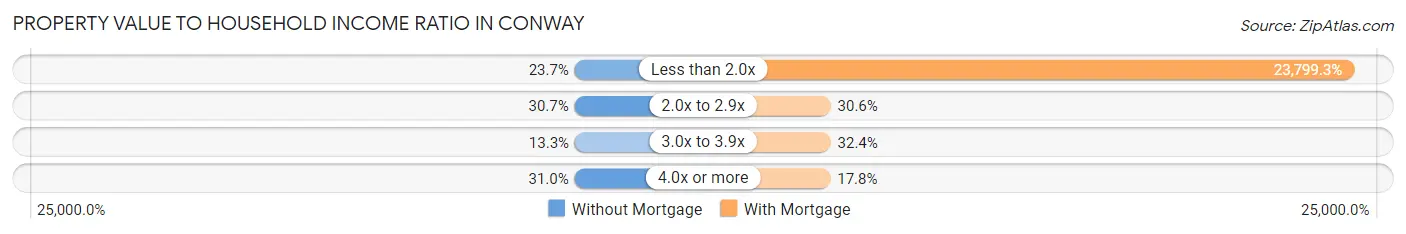
| Value-to-Income Ratio | Without Mortgage | With Mortgage |
| Less than 2.0x | 181 (23.7%) | 102,813 (23,799.3%) |
| 2.0x to 2.9x | 235 (30.7%) | 132 (30.6%) |
| 3.0x to 3.9x | 102 (13.3%) | 140 (32.4%) |
| 4.0x or more | 237 (31.0%) | 77 (17.8%) |
| Total | 765 (100.0%) | 432 (100.0%) |
Real Estate Taxes by Mortgage Status in Conway
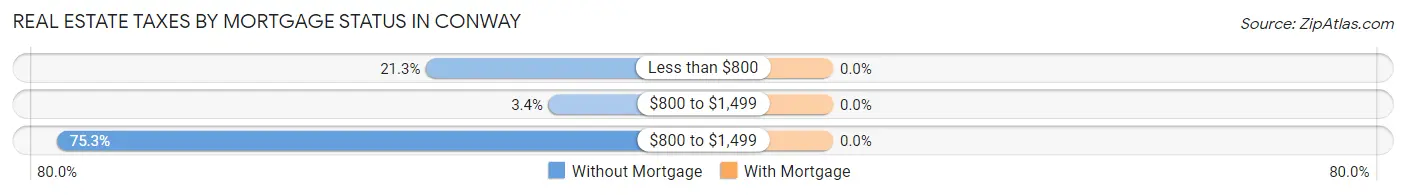
| Property Taxes | Without Mortgage | With Mortgage |
| Less than $800 | 163 (21.3%) | 0 (0.0%) |
| $800 to $1,499 | 26 (3.4%) | 0 (0.0%) |
| $800 to $1,499 | 576 (75.3%) | 0 (0.0%) |
| Total | 765 (100.0%) | 432 (100.0%) |
Health & Disability in Conway
Health Insurance Coverage by Age in Conway
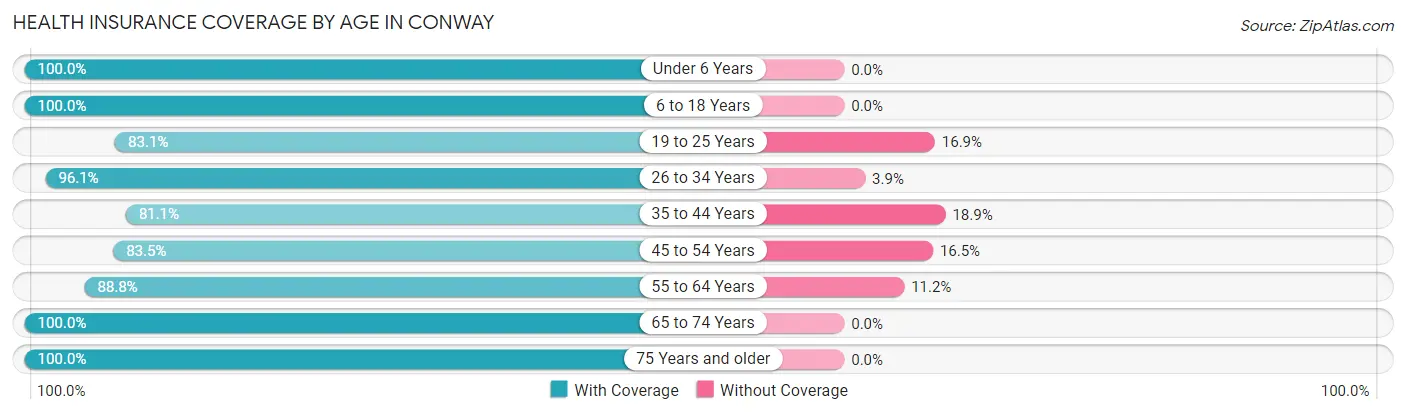
| Age Bracket | With Coverage | Without Coverage |
| Under 6 Years | 176 (100.0%) | 0 (0.0%) |
| 6 to 18 Years | 483 (100.0%) | 0 (0.0%) |
| 19 to 25 Years | 492 (83.1%) | 100 (16.9%) |
| 26 to 34 Years | 272 (96.1%) | 11 (3.9%) |
| 35 to 44 Years | 387 (81.1%) | 90 (18.9%) |
| 45 to 54 Years | 202 (83.5%) | 40 (16.5%) |
| 55 to 64 Years | 350 (88.8%) | 44 (11.2%) |
| 65 to 74 Years | 669 (100.0%) | 0 (0.0%) |
| 75 Years and older | 531 (100.0%) | 0 (0.0%) |
| Total | 3,562 (92.6%) | 285 (7.4%) |
Health Insurance Coverage by Citizenship Status in Conway
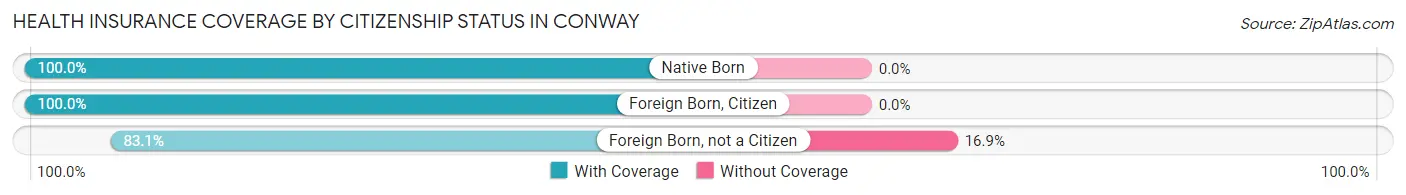
| Citizenship Status | With Coverage | Without Coverage |
| Native Born | 176 (100.0%) | 0 (0.0%) |
| Foreign Born, Citizen | 483 (100.0%) | 0 (0.0%) |
| Foreign Born, not a Citizen | 492 (83.1%) | 100 (16.9%) |
Health Insurance Coverage by Household Income in Conway
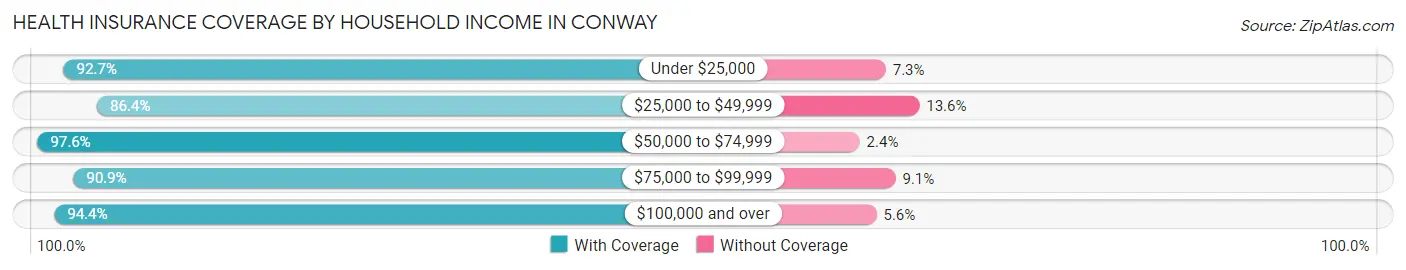
| Household Income | With Coverage | Without Coverage |
| Under $25,000 | 685 (92.7%) | 54 (7.3%) |
| $25,000 to $49,999 | 541 (86.4%) | 85 (13.6%) |
| $50,000 to $74,999 | 446 (97.6%) | 11 (2.4%) |
| $75,000 to $99,999 | 577 (90.9%) | 58 (9.1%) |
| $100,000 and over | 1,306 (94.4%) | 77 (5.6%) |
Public vs Private Health Insurance Coverage by Age in Conway
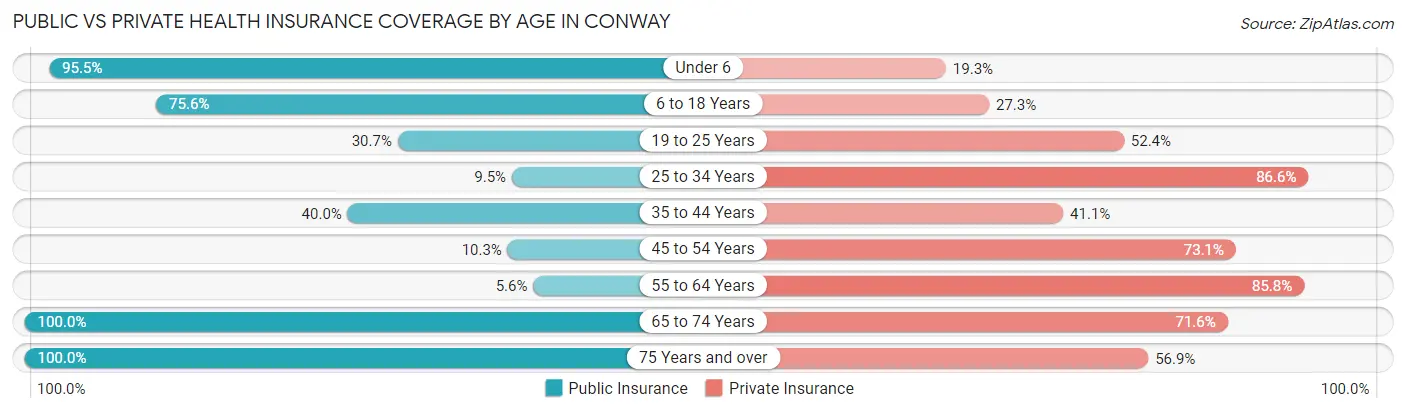
| Age Bracket | Public Insurance | Private Insurance |
| Under 6 | 168 (95.5%) | 34 (19.3%) |
| 6 to 18 Years | 365 (75.6%) | 132 (27.3%) |
| 19 to 25 Years | 182 (30.7%) | 310 (52.4%) |
| 25 to 34 Years | 27 (9.5%) | 245 (86.6%) |
| 35 to 44 Years | 191 (40.0%) | 196 (41.1%) |
| 45 to 54 Years | 25 (10.3%) | 177 (73.1%) |
| 55 to 64 Years | 22 (5.6%) | 338 (85.8%) |
| 65 to 74 Years | 669 (100.0%) | 479 (71.6%) |
| 75 Years and over | 531 (100.0%) | 302 (56.9%) |
| Total | 2,180 (56.7%) | 2,213 (57.5%) |
Disability Status by Sex by Age in Conway
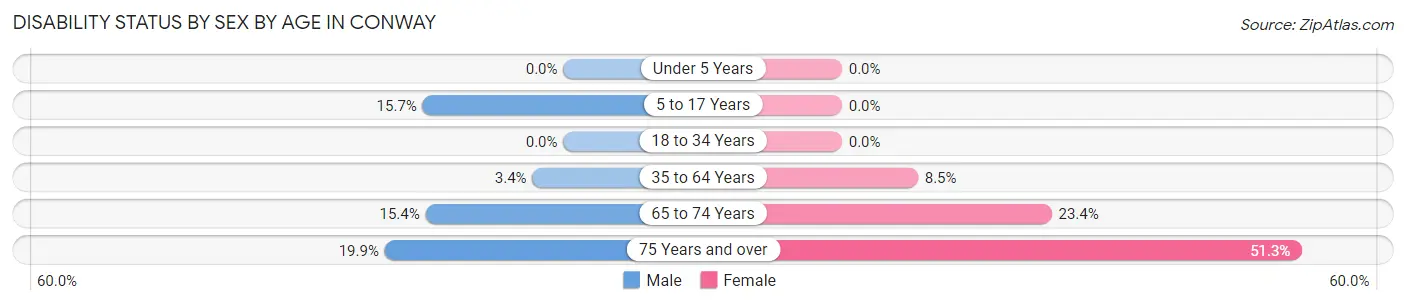
| Age Bracket | Male | Female |
| Under 5 Years | 0 (0.0%) | 0 (0.0%) |
| 5 to 17 Years | 42 (15.7%) | 0 (0.0%) |
| 18 to 34 Years | 0 (0.0%) | 0 (0.0%) |
| 35 to 64 Years | 22 (3.4%) | 40 (8.5%) |
| 65 to 74 Years | 35 (15.3%) | 103 (23.4%) |
| 75 Years and over | 35 (19.9%) | 182 (51.3%) |
Disability Class by Sex by Age in Conway
Disability Class: Hearing Difficulty
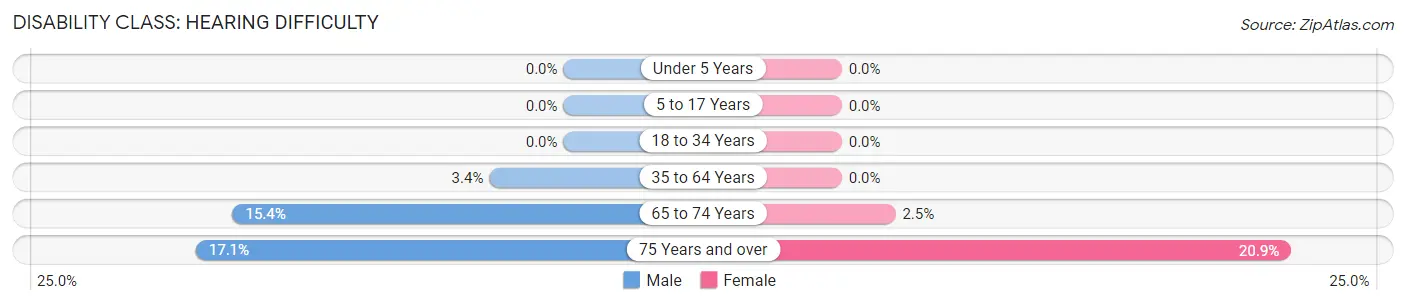
| Age Bracket | Male | Female |
| Under 5 Years | 0 (0.0%) | 0 (0.0%) |
| 5 to 17 Years | 0 (0.0%) | 0 (0.0%) |
| 18 to 34 Years | 0 (0.0%) | 0 (0.0%) |
| 35 to 64 Years | 22 (3.4%) | 0 (0.0%) |
| 65 to 74 Years | 35 (15.3%) | 11 (2.5%) |
| 75 Years and over | 30 (17.1%) | 74 (20.8%) |
Disability Class: Vision Difficulty
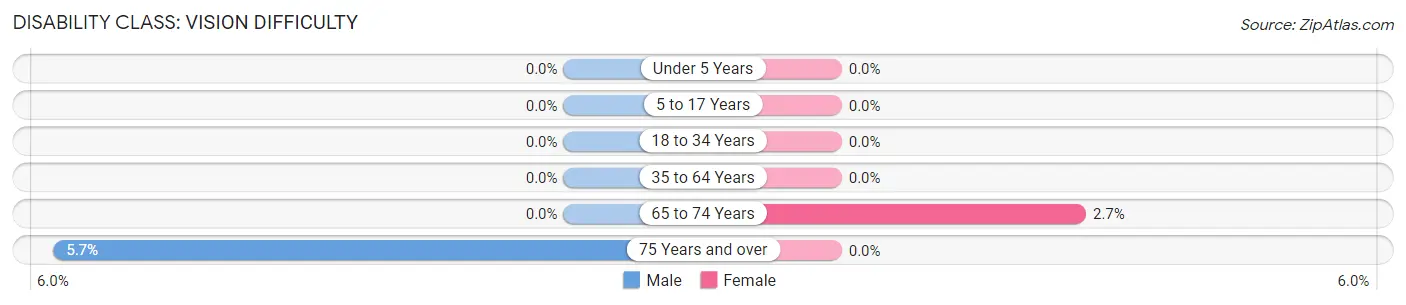
| Age Bracket | Male | Female |
| Under 5 Years | 0 (0.0%) | 0 (0.0%) |
| 5 to 17 Years | 0 (0.0%) | 0 (0.0%) |
| 18 to 34 Years | 0 (0.0%) | 0 (0.0%) |
| 35 to 64 Years | 0 (0.0%) | 0 (0.0%) |
| 65 to 74 Years | 0 (0.0%) | 12 (2.7%) |
| 75 Years and over | 10 (5.7%) | 0 (0.0%) |
Disability Class: Cognitive Difficulty
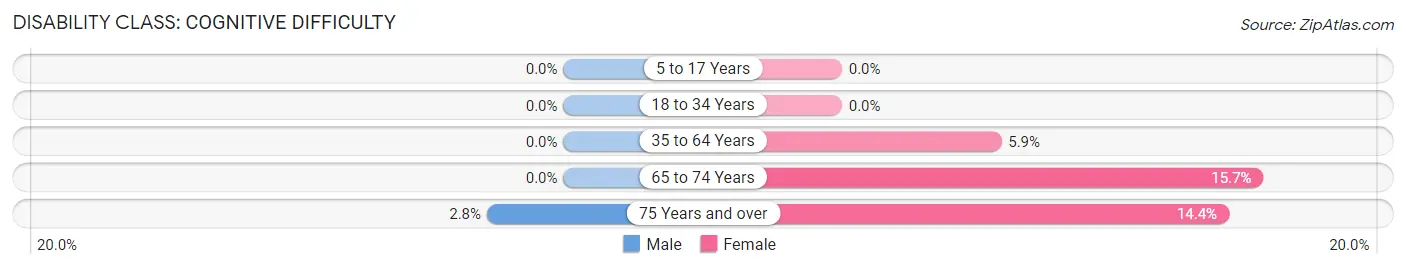
| Age Bracket | Male | Female |
| 5 to 17 Years | 0 (0.0%) | 0 (0.0%) |
| 18 to 34 Years | 0 (0.0%) | 0 (0.0%) |
| 35 to 64 Years | 0 (0.0%) | 28 (5.9%) |
| 65 to 74 Years | 0 (0.0%) | 69 (15.7%) |
| 75 Years and over | 5 (2.8%) | 51 (14.4%) |
Disability Class: Ambulatory Difficulty
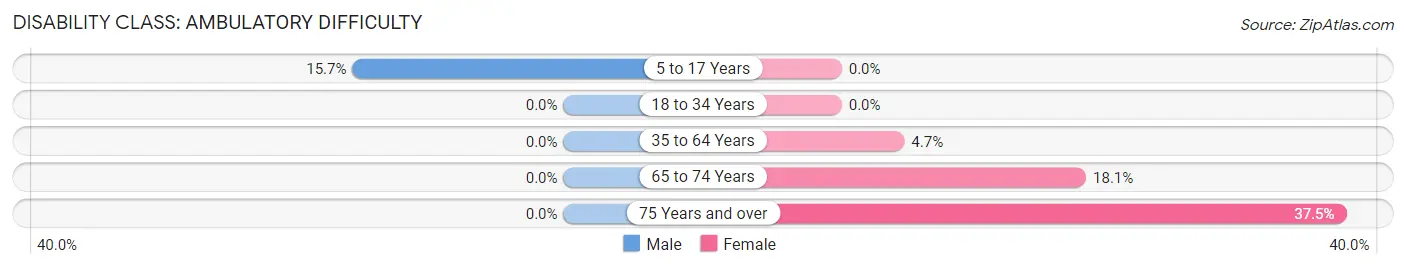
| Age Bracket | Male | Female |
| 5 to 17 Years | 42 (15.7%) | 0 (0.0%) |
| 18 to 34 Years | 0 (0.0%) | 0 (0.0%) |
| 35 to 64 Years | 0 (0.0%) | 22 (4.6%) |
| 65 to 74 Years | 0 (0.0%) | 80 (18.1%) |
| 75 Years and over | 0 (0.0%) | 133 (37.5%) |
Disability Class: Self-Care Difficulty
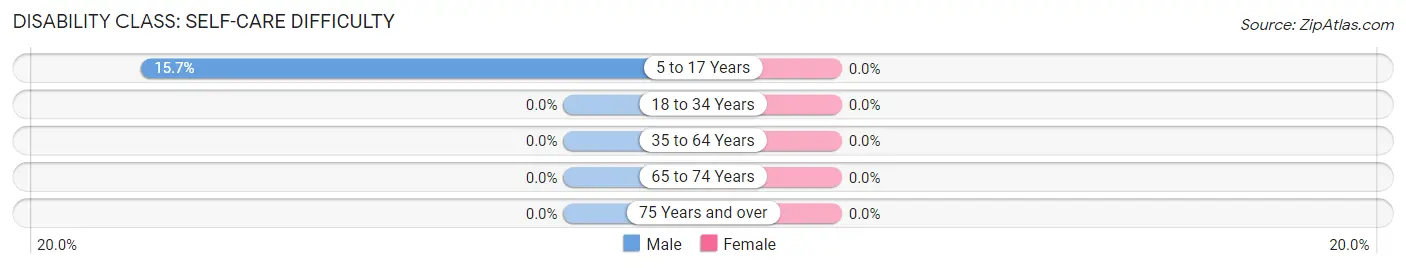
| Age Bracket | Male | Female |
| 5 to 17 Years | 42 (15.7%) | 0 (0.0%) |
| 18 to 34 Years | 0 (0.0%) | 0 (0.0%) |
| 35 to 64 Years | 0 (0.0%) | 0 (0.0%) |
| 65 to 74 Years | 0 (0.0%) | 0 (0.0%) |
| 75 Years and over | 0 (0.0%) | 0 (0.0%) |
Technology Access in Conway
Computing Device Access in Conway
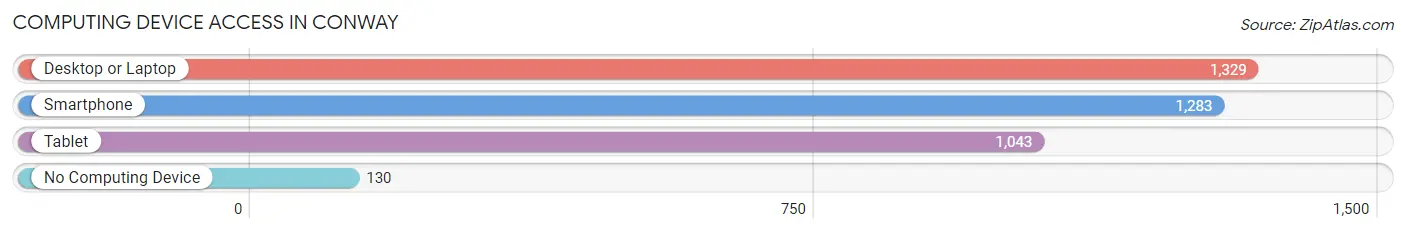
| Device Type | # Households | % Households |
| Desktop or Laptop | 1,329 | 82.4% |
| Smartphone | 1,283 | 79.5% |
| Tablet | 1,043 | 64.7% |
| No Computing Device | 130 | 8.1% |
| Total | 1,613 | 100.0% |
Internet Access in Conway
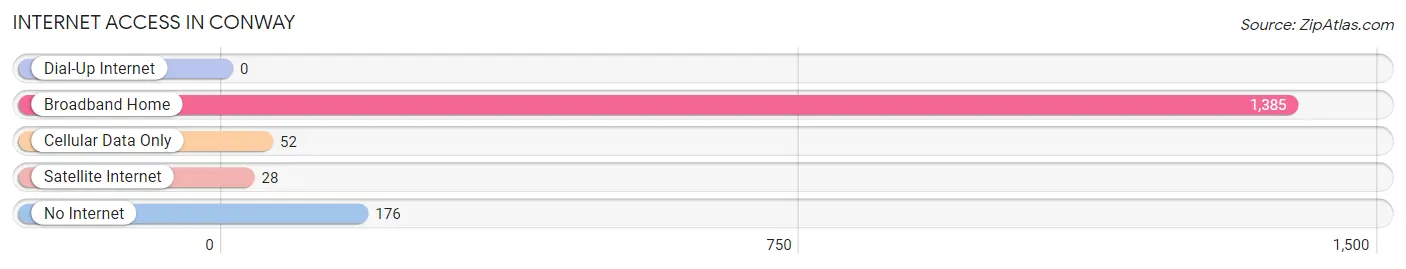
| Internet Type | # Households | % Households |
| Dial-Up Internet | 0 | 0.0% |
| Broadband Home | 1,385 | 85.9% |
| Cellular Data Only | 52 | 3.2% |
| Satellite Internet | 28 | 1.7% |
| No Internet | 176 | 10.9% |
| Total | 1,613 | 100.0% |
Conway Summary
Conway, New Hampshire is a small town located in the White Mountains region of the state. It is situated in the eastern part of the state, near the Maine border. The town was first settled in 1765 and was incorporated in 1767. It is the county seat of Carroll County and is home to a population of approximately 10,000 people.
Geography
Conway is located in the White Mountains region of New Hampshire, near the Maine border. It is situated in the eastern part of the state, in the foothills of the White Mountains. The town is bordered by the towns of Bartlett, Madison, Eaton, and Albany. The town is situated on the Saco River, which flows through the town and is a popular destination for fishing and other recreational activities. The town is also home to the Conway Scenic Railroad, which offers scenic train rides through the White Mountains.
The town is located in the White Mountain National Forest, which is a popular destination for outdoor recreation. The forest is home to a variety of wildlife, including moose, black bear, and white-tailed deer. The forest also offers a variety of hiking trails, camping sites, and other recreational activities.
Economy
Conway is a popular tourist destination, due to its proximity to the White Mountains and the Saco River. The town is home to a variety of tourist attractions, including the Conway Scenic Railroad, the Mount Washington Cog Railway, and the Mount Washington Auto Road. The town is also home to a variety of shops, restaurants, and other businesses.
The town is also home to a variety of manufacturing and industrial businesses. The town is home to a paper mill, a furniture factory, and a variety of other businesses. The town is also home to a variety of small businesses, including a variety of retail stores, restaurants, and other businesses.
Demographics
As of the 2010 census, the population of Conway was 10,115. The racial makeup of the town was 95.3% White, 0.7% African American, 0.3% Native American, 0.7% Asian, 0.1% Pacific Islander, 0.7% from other races, and 2.0% from two or more races. Hispanic or Latino of any race were 1.9% of the population.
The median income for a household in the town was $45,938, and the median income for a family was $54,938. The per capita income for the town was $25,938. About 8.3% of families and 11.2% of the population were below the poverty line, including 15.2% of those under age 18 and 6.2% of those age 65 or over.
Conway is a small town with a rich history and a variety of attractions. It is home to a variety of businesses, tourist attractions, and recreational activities. The town is also home to a variety of manufacturing and industrial businesses, as well as a variety of small businesses. The town is home to a diverse population, with a variety of racial and ethnic backgrounds.
Common Questions
What is Per Capita Income in Conway?
Per Capita income in Conway is $33,042.
What is the Median Family Income in Conway?
Median Family Income in Conway is $83,636.
What is the Median Household income in Conway?
Median Household Income in Conway is $46,771.
What is Income or Wage Gap in Conway?
Income or Wage Gap in Conway is 17.2%.
Women in Conway earn 82.8 cents for every dollar earned by a man.
What is Inequality or Gini Index in Conway?
Inequality or Gini Index in Conway is 0.46.
What is the Total Population of Conway?
Total Population of Conway is 3,847.
What is the Total Male Population of Conway?
Total Male Population of Conway is 1,948.
What is the Total Female Population of Conway?
Total Female Population of Conway is 1,899.
What is the Ratio of Males per 100 Females in Conway?
There are 102.58 Males per 100 Females in Conway.
What is the Ratio of Females per 100 Males in Conway?
There are 97.48 Females per 100 Males in Conway.
What is the Median Population Age in Conway?
Median Population Age in Conway is 41.7 Years.
What is the Average Family Size in Conway
Average Family Size in Conway is 3.2 People.
What is the Average Household Size in Conway
Average Household Size in Conway is 2.4 People.
How Large is the Labor Force in Conway?
There are 2,090 People in the Labor Forcein in Conway.
What is the Percentage of People in the Labor Force in Conway?
63.8% of People are in the Labor Force in Conway.
What is the Unemployment Rate in Conway?
Unemployment Rate in Conway is 15.3%.