Goffstown, NH Map & Demographics
Goffstown Map
Goffstown Overview
$58,670
PER CAPITA INCOME
$132,318
AVG FAMILY INCOME
$131,146
AVG HOUSEHOLD INCOME
23.4%
WAGE / INCOME GAP [ % ]
76.6¢/ $1
WAGE / INCOME GAP [ $ ]
0.39
INEQUALITY / GINI INDEX
3,028
TOTAL POPULATION
1,473
MALE POPULATION
1,555
FEMALE POPULATION
94.73
MALES / 100 FEMALES
105.57
FEMALES / 100 MALES
35.6
MEDIAN AGE
3.1
AVG FAMILY SIZE
2.7
AVG HOUSEHOLD SIZE
1,953
LABOR FORCE [ PEOPLE ]
78.2%
PERCENT IN LABOR FORCE
Goffstown Zip Codes
Goffstown Area Codes
Income in Goffstown
Income Overview in Goffstown
Per Capita Income in Goffstown is $58,670, while median incomes of families and households are $132,318 and $131,146 respectively.
| Characteristic | Number | Measure |
| Per Capita Income | 3,028 | $58,670 |
| Median Family Income | 767 | $132,318 |
| Mean Family Income | 767 | $167,239 |
| Median Household Income | 1,132 | $131,146 |
| Mean Household Income | 1,132 | $148,430 |
| Income Deficit | 767 | $0 |
| Wage / Income Gap (%) | 3,028 | 23.40% |
| Wage / Income Gap ($) | 3,028 | 76.60¢ per $1 |
| Gini / Inequality Index | 3,028 | 0.39 |
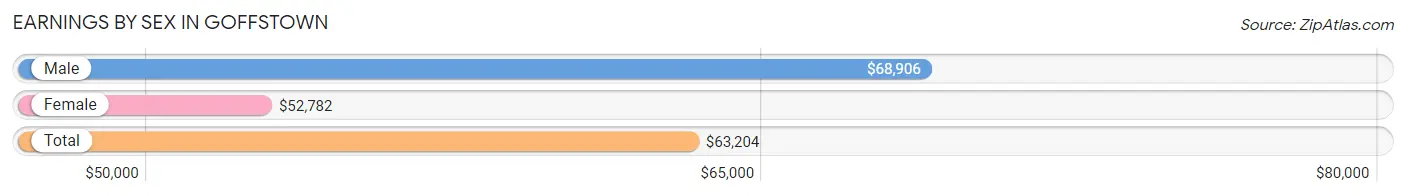
Earnings by Sex in Goffstown
Average Earnings in Goffstown are $63,204, $68,906 for men and $52,782 for women, a difference of 23.4%.
| Sex | Number | Average Earnings |
| Male | 1,055 (52.9%) | $68,906 |
| Female | 941 (47.1%) | $52,782 |
| Total | 1,996 (100.0%) | $63,204 |
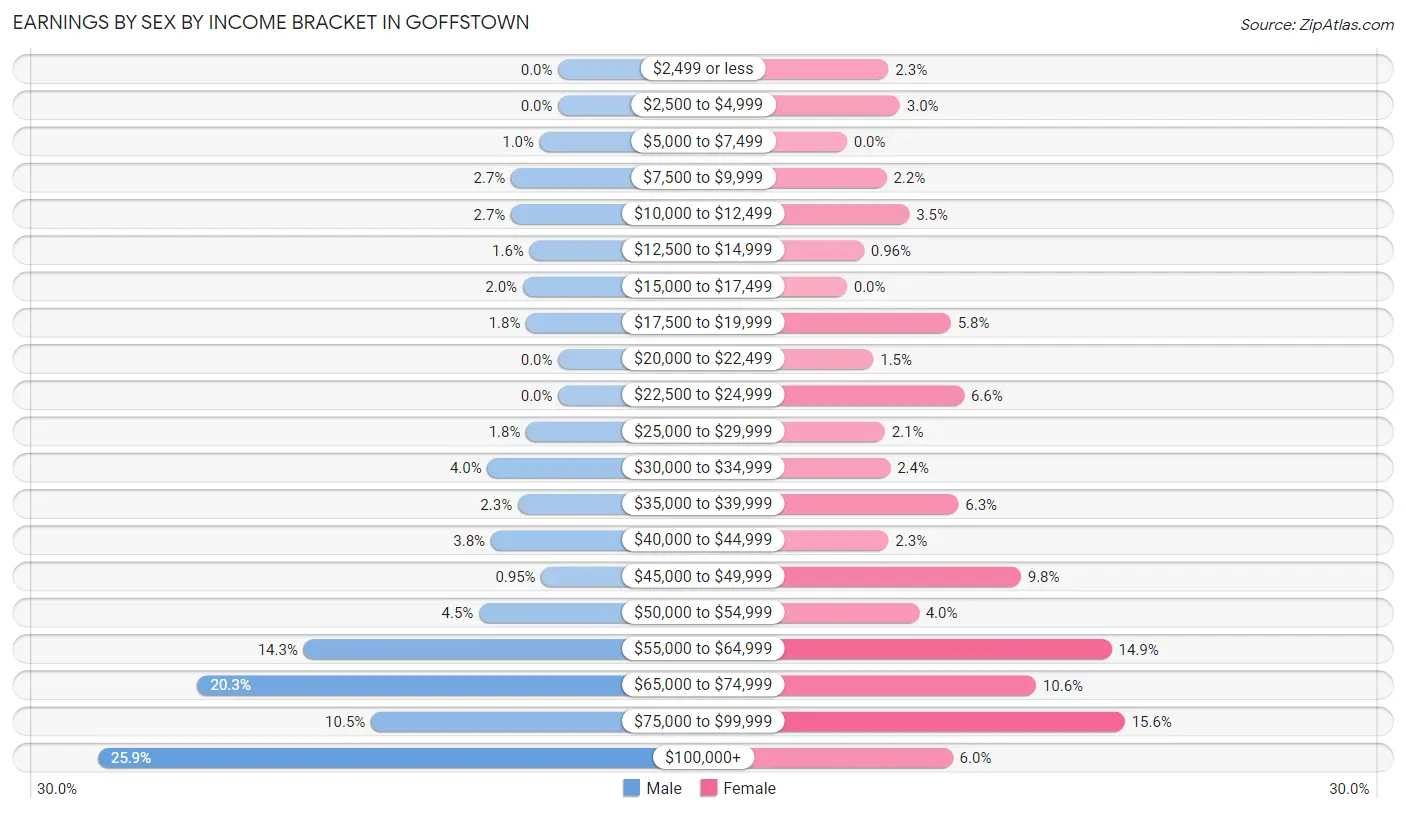
Earnings by Sex by Income Bracket in Goffstown
The most common earnings brackets in Goffstown are $100,000+ for men (273 | 25.9%) and $75,000 to $99,999 for women (147 | 15.6%).
| Income | Male | Female |
| $2,499 or less | 0 (0.0%) | 22 (2.3%) |
| $2,500 to $4,999 | 0 (0.0%) | 28 (3.0%) |
| $5,000 to $7,499 | 11 (1.0%) | 0 (0.0%) |
| $7,500 to $9,999 | 28 (2.6%) | 21 (2.2%) |
| $10,000 to $12,499 | 28 (2.6%) | 33 (3.5%) |
| $12,500 to $14,999 | 17 (1.6%) | 9 (1.0%) |
| $15,000 to $17,499 | 21 (2.0%) | 0 (0.0%) |
| $17,500 to $19,999 | 19 (1.8%) | 55 (5.8%) |
| $20,000 to $22,499 | 0 (0.0%) | 14 (1.5%) |
| $22,500 to $24,999 | 0 (0.0%) | 62 (6.6%) |
| $25,000 to $29,999 | 19 (1.8%) | 20 (2.1%) |
| $30,000 to $34,999 | 42 (4.0%) | 23 (2.4%) |
| $35,000 to $39,999 | 24 (2.3%) | 59 (6.3%) |
| $40,000 to $44,999 | 40 (3.8%) | 22 (2.3%) |
| $45,000 to $49,999 | 10 (0.9%) | 92 (9.8%) |
| $50,000 to $54,999 | 47 (4.4%) | 38 (4.0%) |
| $55,000 to $64,999 | 151 (14.3%) | 140 (14.9%) |
| $65,000 to $74,999 | 214 (20.3%) | 100 (10.6%) |
| $75,000 to $99,999 | 111 (10.5%) | 147 (15.6%) |
| $100,000+ | 273 (25.9%) | 56 (5.9%) |
| Total | 1,055 (100.0%) | 941 (100.0%) |
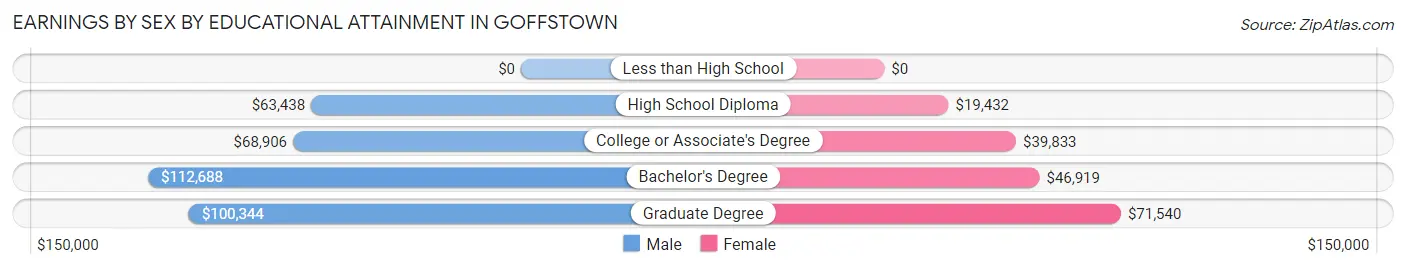
Earnings by Sex by Educational Attainment in Goffstown
Average earnings in Goffstown are $72,929 for men and $55,296 for women, a difference of 24.2%. Men with an educational attainment of bachelor's degree enjoy the highest average annual earnings of $112,688, while those with high school diploma education earn the least with $63,438. Women with an educational attainment of graduate degree earn the most with the average annual earnings of $71,540, while those with high school diploma education have the smallest earnings of $19,432.
| Educational Attainment | Male Income | Female Income |
| Less than High School | - | - |
| High School Diploma | $63,438 | $19,432 |
| College or Associate's Degree | $68,906 | $39,833 |
| Bachelor's Degree | $112,688 | $46,919 |
| Graduate Degree | $100,344 | $71,540 |
| Total | $72,929 | $55,296 |
Family Income in Goffstown
Family Income Brackets in Goffstown
According to the Goffstown family income data, there are 255 families falling into the $100,000 to $149,999 income range, which is the most common income bracket and makes up 33.3% of all families.
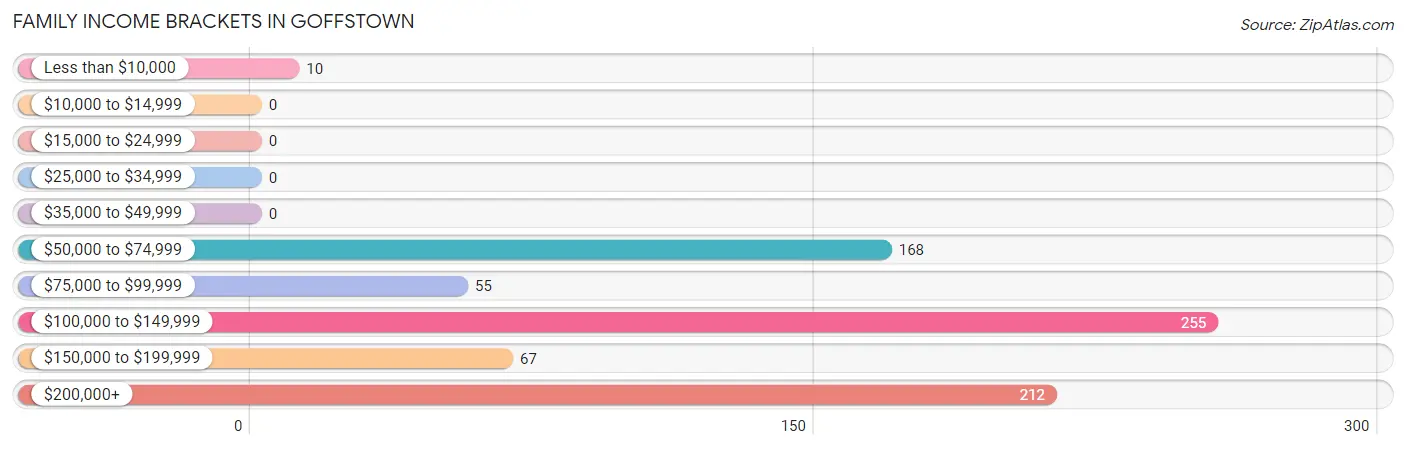
| Income Bracket | # Families | % Families |
| Less than $10,000 | 10 | 1.3% |
| $10,000 to $14,999 | 0 | 0.0% |
| $15,000 to $24,999 | 0 | 0.0% |
| $25,000 to $34,999 | 0 | 0.0% |
| $35,000 to $49,999 | 0 | 0.0% |
| $50,000 to $74,999 | 168 | 21.9% |
| $75,000 to $99,999 | 55 | 7.2% |
| $100,000 to $149,999 | 255 | 33.2% |
| $150,000 to $199,999 | 67 | 8.7% |
| $200,000+ | 212 | 27.6% |
Family Income by Famaliy Size in Goffstown
4-person families (94 | 12.3%) account for the highest median family income in Goffstown with $143,750 per family, while 3-person families (277 | 36.1%) have the highest median income of $47,735 per family member.
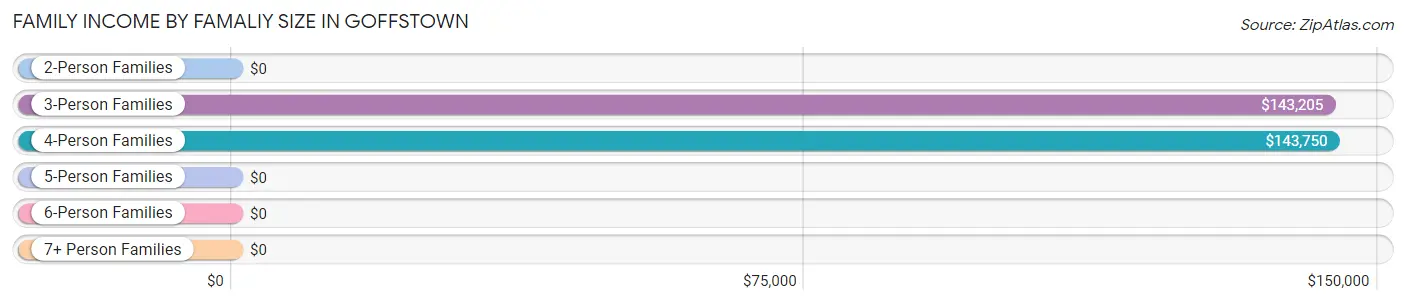
| Income Bracket | # Families | Median Income |
| 2-Person Families | 352 (45.9%) | $0 |
| 3-Person Families | 277 (36.1%) | $143,205 |
| 4-Person Families | 94 (12.3%) | $143,750 |
| 5-Person Families | 14 (1.8%) | $0 |
| 6-Person Families | 14 (1.8%) | $0 |
| 7+ Person Families | 16 (2.1%) | $0 |
| Total | 767 (100.0%) | $132,318 |
Family Income by Number of Earners in Goffstown
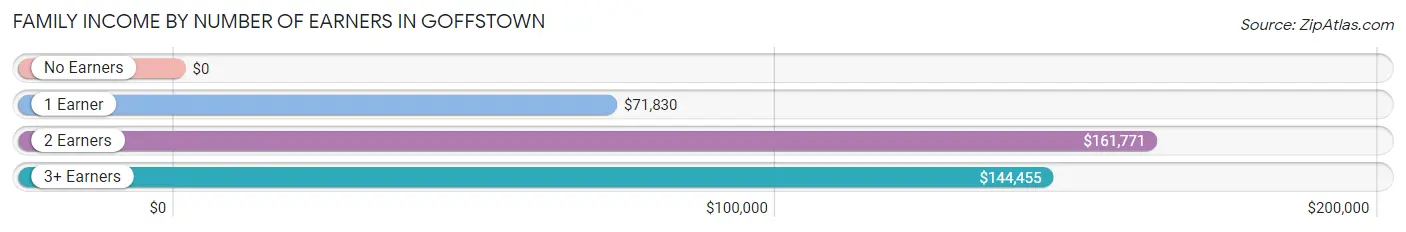
| Number of Earners | # Families | Median Income |
| No Earners | 10 (1.3%) | $0 |
| 1 Earner | 234 (30.5%) | $71,830 |
| 2 Earners | 367 (47.8%) | $161,771 |
| 3+ Earners | 156 (20.3%) | $144,455 |
| Total | 767 (100.0%) | $132,318 |
Household Income in Goffstown
Household Income Brackets in Goffstown
With 383 households falling in the category, the $100,000 to $149,999 income range is the most frequent in Goffstown, accounting for 33.8% of all households. In contrast, only 5 households (0.4%) fall into the $10,000 to $14,999 income bracket, making it the least populous group.
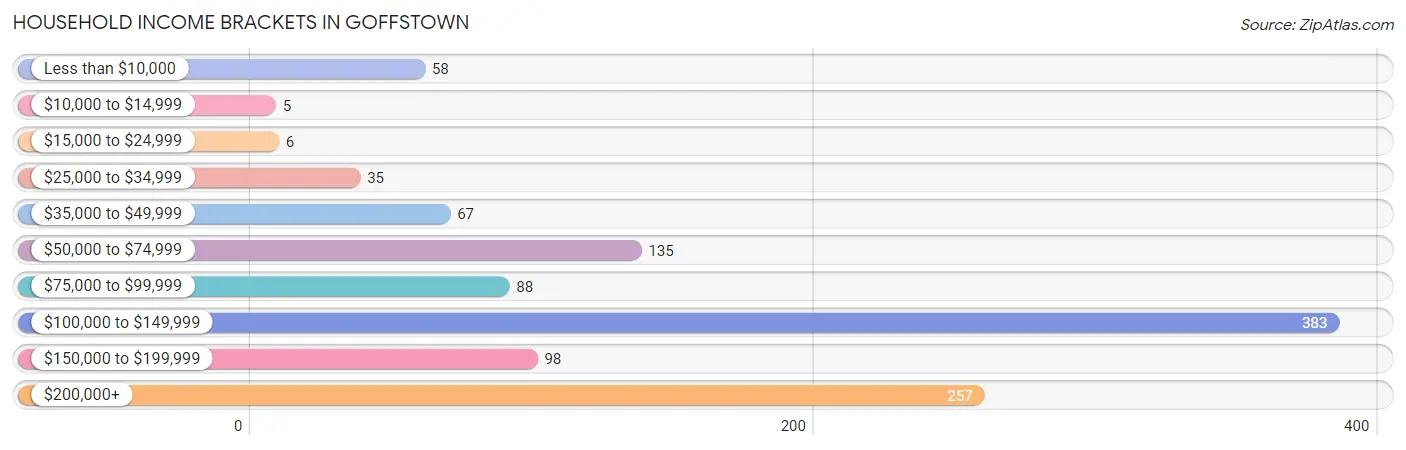
| Income Bracket | # Households | % Households |
| Less than $10,000 | 58 | 5.1% |
| $10,000 to $14,999 | 5 | 0.4% |
| $15,000 to $24,999 | 6 | 0.5% |
| $25,000 to $34,999 | 35 | 3.1% |
| $35,000 to $49,999 | 67 | 5.9% |
| $50,000 to $74,999 | 135 | 11.9% |
| $75,000 to $99,999 | 88 | 7.8% |
| $100,000 to $149,999 | 383 | 33.8% |
| $150,000 to $199,999 | 98 | 8.7% |
| $200,000+ | 257 | 22.7% |
Household Income by Householder Age in Goffstown
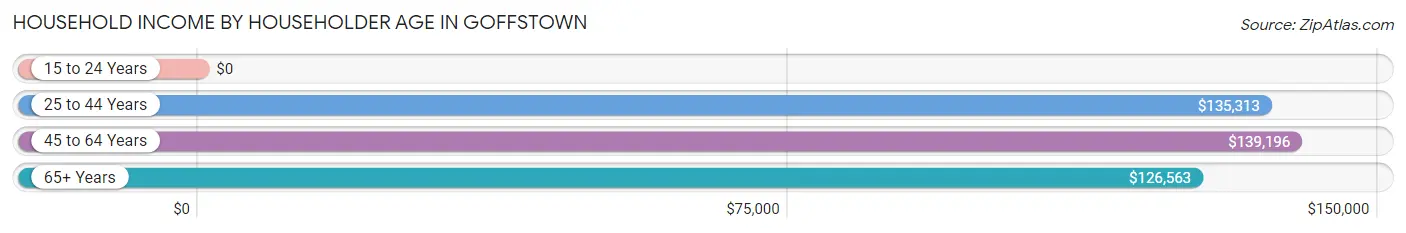
The median household income in Goffstown is $131,146, with the highest median household income of $139,196 found in the 45 to 64 years age bracket for the primary householder. A total of 425 households (37.5%) fall into this category. Meanwhile, the 15 to 24 years age bracket for the primary householder has the lowest median household income of $0, with 26 households (2.3%) in this group.
| Income Bracket | # Households | Median Income |
| 15 to 24 Years | 26 (2.3%) | $0 |
| 25 to 44 Years | 391 (34.5%) | $135,313 |
| 45 to 64 Years | 425 (37.5%) | $139,196 |
| 65+ Years | 290 (25.6%) | $126,563 |
| Total | 1,132 (100.0%) | $131,146 |
Poverty in Goffstown
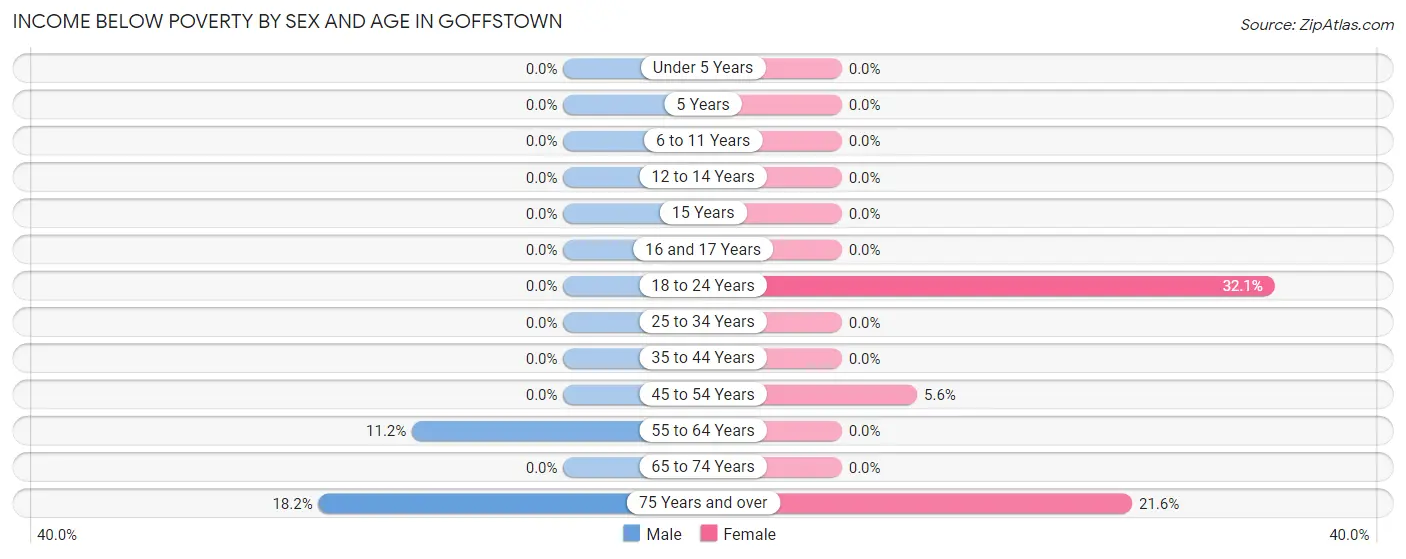
Income Below Poverty by Sex and Age in Goffstown
With 2.8% poverty level for males and 3.9% for females among the residents of Goffstown, 75 year old and over males and 18 to 24 year old females are the most vulnerable to poverty, with 10 males (18.2%) and 27 females (32.1%) in their respective age groups living below the poverty level.
| Age Bracket | Male | Female |
| Under 5 Years | 0 (0.0%) | 0 (0.0%) |
| 5 Years | 0 (0.0%) | 0 (0.0%) |
| 6 to 11 Years | 0 (0.0%) | 0 (0.0%) |
| 12 to 14 Years | 0 (0.0%) | 0 (0.0%) |
| 15 Years | 0 (0.0%) | 0 (0.0%) |
| 16 and 17 Years | 0 (0.0%) | 0 (0.0%) |
| 18 to 24 Years | 0 (0.0%) | 27 (32.1%) |
| 25 to 34 Years | 0 (0.0%) | 0 (0.0%) |
| 35 to 44 Years | 0 (0.0%) | 0 (0.0%) |
| 45 to 54 Years | 0 (0.0%) | 8 (5.6%) |
| 55 to 64 Years | 31 (11.2%) | 0 (0.0%) |
| 65 to 74 Years | 0 (0.0%) | 0 (0.0%) |
| 75 Years and over | 10 (18.2%) | 25 (21.5%) |
| Total | 41 (2.8%) | 60 (3.9%) |
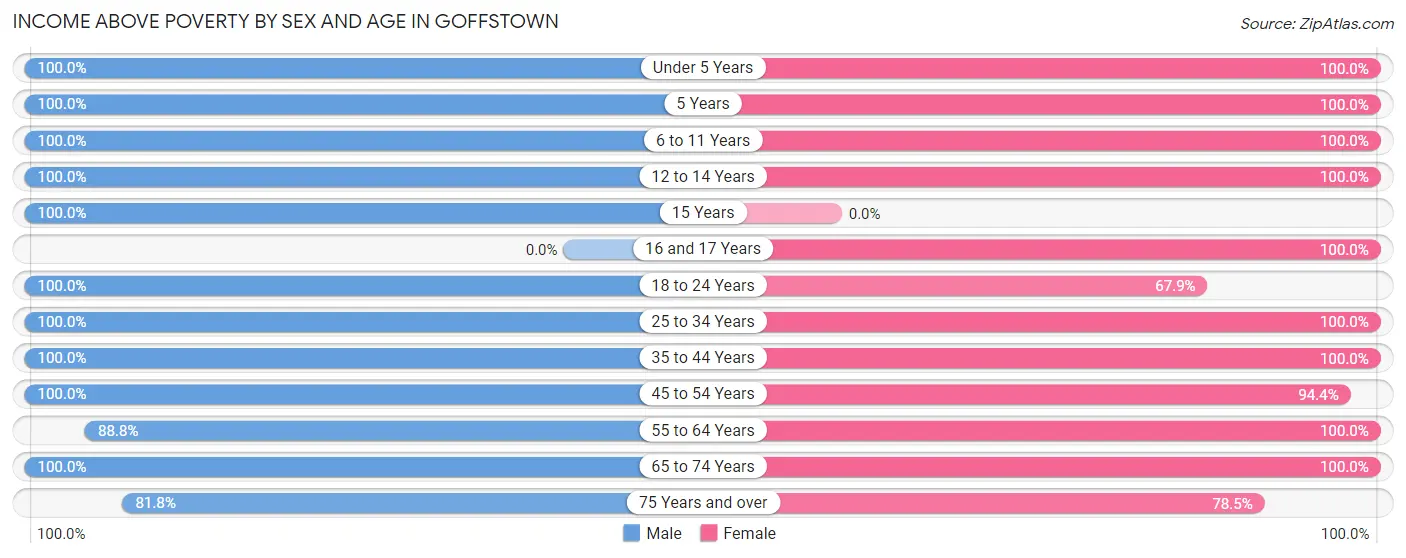
Income Above Poverty by Sex and Age in Goffstown
According to the poverty statistics in Goffstown, males aged under 5 years and females aged under 5 years are the age groups that are most secure financially, with 100.0% of males and 100.0% of females in these age groups living above the poverty line.
| Age Bracket | Male | Female |
| Under 5 Years | 115 (100.0%) | 179 (100.0%) |
| 5 Years | 3 (100.0%) | 24 (100.0%) |
| 6 to 11 Years | 15 (100.0%) | 102 (100.0%) |
| 12 to 14 Years | 39 (100.0%) | 16 (100.0%) |
| 15 Years | 16 (100.0%) | 0 (0.0%) |
| 16 and 17 Years | 0 (0.0%) | 14 (100.0%) |
| 18 to 24 Years | 77 (100.0%) | 57 (67.9%) |
| 25 to 34 Years | 406 (100.0%) | 366 (100.0%) |
| 35 to 44 Years | 164 (100.0%) | 134 (100.0%) |
| 45 to 54 Years | 142 (100.0%) | 135 (94.4%) |
| 55 to 64 Years | 245 (88.8%) | 256 (100.0%) |
| 65 to 74 Years | 165 (100.0%) | 99 (100.0%) |
| 75 Years and over | 45 (81.8%) | 91 (78.4%) |
| Total | 1,432 (97.2%) | 1,473 (96.1%) |
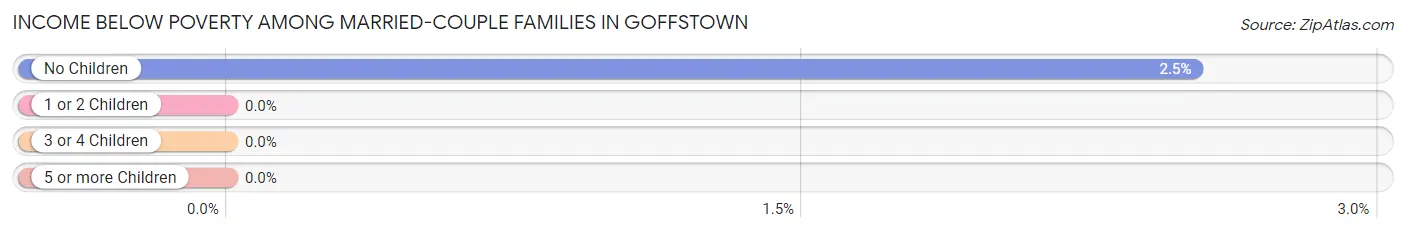
Income Below Poverty Among Married-Couple Families in Goffstown
The poverty statistics for married-couple families in Goffstown show that 1.7% or 10 of the total 604 families live below the poverty line. Families with no children have the highest poverty rate of 2.5%, comprising of 10 families. On the other hand, families with 1 or 2 children have the lowest poverty rate of 0.0%, which includes 0 families.
| Children | Above Poverty | Below Poverty |
| No Children | 387 (97.5%) | 10 (2.5%) |
| 1 or 2 Children | 174 (100.0%) | 0 (0.0%) |
| 3 or 4 Children | 17 (100.0%) | 0 (0.0%) |
| 5 or more Children | 16 (100.0%) | 0 (0.0%) |
| Total | 594 (98.3%) | 10 (1.7%) |
Income Below Poverty Among Single-Parent Households in Goffstown
| Children | Single Father | Single Mother |
| No Children | 0 (0.0%) | 0 (0.0%) |
| 1 or 2 Children | 0 (0.0%) | 0 (0.0%) |
| 3 or 4 Children | 0 (0.0%) | 0 (0.0%) |
| 5 or more Children | 0 (0.0%) | 0 (0.0%) |
| Total | 0 (0.0%) | 0 (0.0%) |
Income Below Poverty Among Married-Couple vs Single-Parent Households in Goffstown
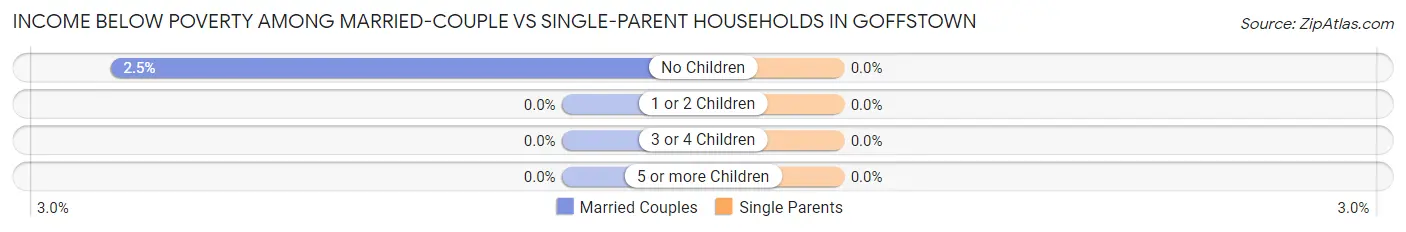
| Children | Married-Couple Families | Single-Parent Households |
| No Children | 10 (2.5%) | 0 (0.0%) |
| 1 or 2 Children | 0 (0.0%) | 0 (0.0%) |
| 3 or 4 Children | 0 (0.0%) | 0 (0.0%) |
| 5 or more Children | 0 (0.0%) | 0 (0.0%) |
| Total | 10 (1.7%) | 0 (0.0%) |
Race in Goffstown
The most populous races in Goffstown are White / Caucasian (2,690 | 88.8%), Two or more Races (306 | 10.1%), and Asian (20 | 0.7%).
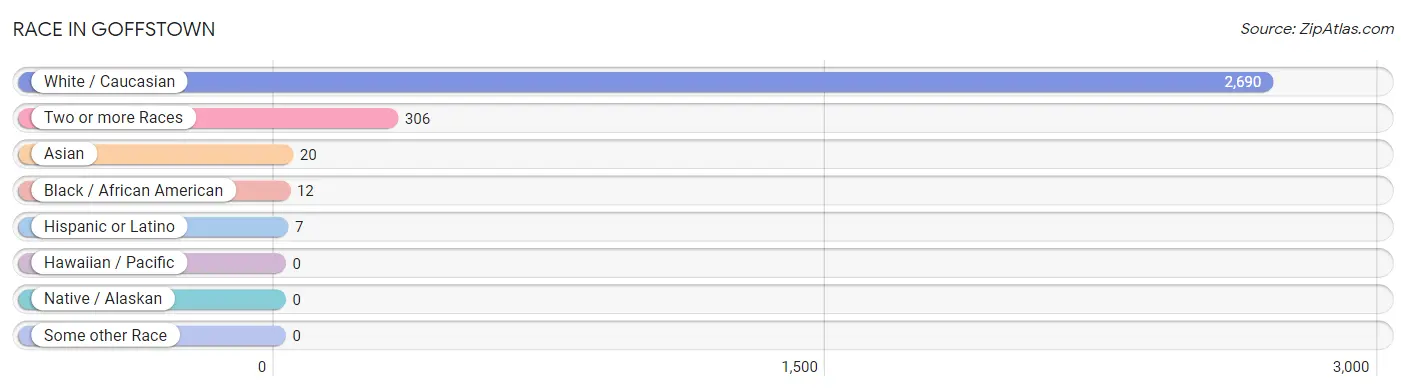
| Race | # Population | % Population |
| Asian | 20 | 0.7% |
| Black / African American | 12 | 0.4% |
| Hawaiian / Pacific | 0 | 0.0% |
| Hispanic or Latino | 7 | 0.2% |
| Native / Alaskan | 0 | 0.0% |
| White / Caucasian | 2,690 | 88.8% |
| Two or more Races | 306 | 10.1% |
| Some other Race | 0 | 0.0% |
| Total | 3,028 | 100.0% |
Ancestry in Goffstown
The most populous ancestries reported in Goffstown are Irish (685 | 22.6%), French (636 | 21.0%), French Canadian (481 | 15.9%), Italian (348 | 11.5%), and English (330 | 10.9%), together accounting for 81.9% of all Goffstown residents.
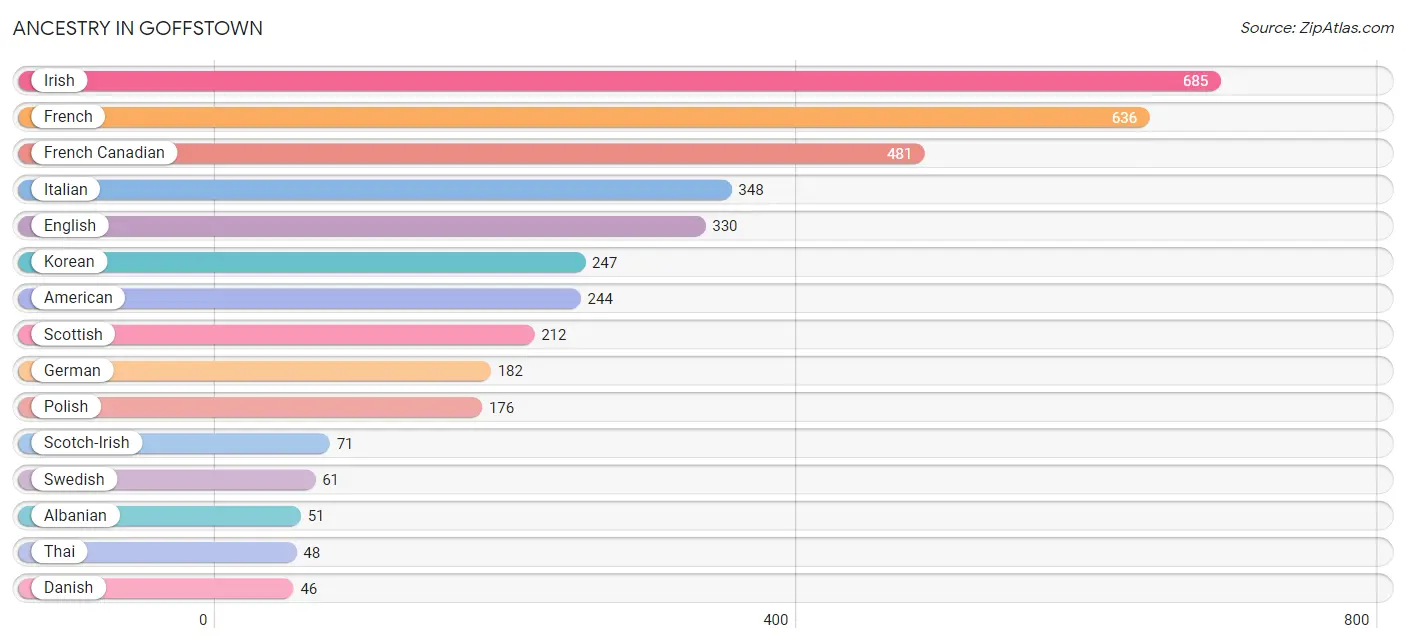
| Ancestry | # Population | % Population |
| Albanian | 51 | 1.7% |
| American | 244 | 8.1% |
| British | 7 | 0.2% |
| Canadian | 37 | 1.2% |
| Danish | 46 | 1.5% |
| Dutch | 31 | 1.0% |
| English | 330 | 10.9% |
| French | 636 | 21.0% |
| French Canadian | 481 | 15.9% |
| German | 182 | 6.0% |
| Iranian | 24 | 0.8% |
| Irish | 685 | 22.6% |
| Italian | 348 | 11.5% |
| Korean | 247 | 8.2% |
| Norwegian | 19 | 0.6% |
| Polish | 176 | 5.8% |
| Portuguese | 35 | 1.2% |
| Russian | 6 | 0.2% |
| Samoan | 13 | 0.4% |
| Scandinavian | 21 | 0.7% |
| Scotch-Irish | 71 | 2.3% |
| Scottish | 212 | 7.0% |
| South American | 7 | 0.2% |
| Swedish | 61 | 2.0% |
| Thai | 48 | 1.6% |
| Uruguayan | 7 | 0.2% |
| Welsh | 13 | 0.4% | View All 27 Rows |
Immigrants in Goffstown
The most numerous immigrant groups reported in Goffstown came from Canada (64 | 2.1%), Europe (29 | 1.0%), France (24 | 0.8%), Western Europe (24 | 0.8%), and Caribbean (20 | 0.7%), together accounting for 5.3% of all Goffstown residents.
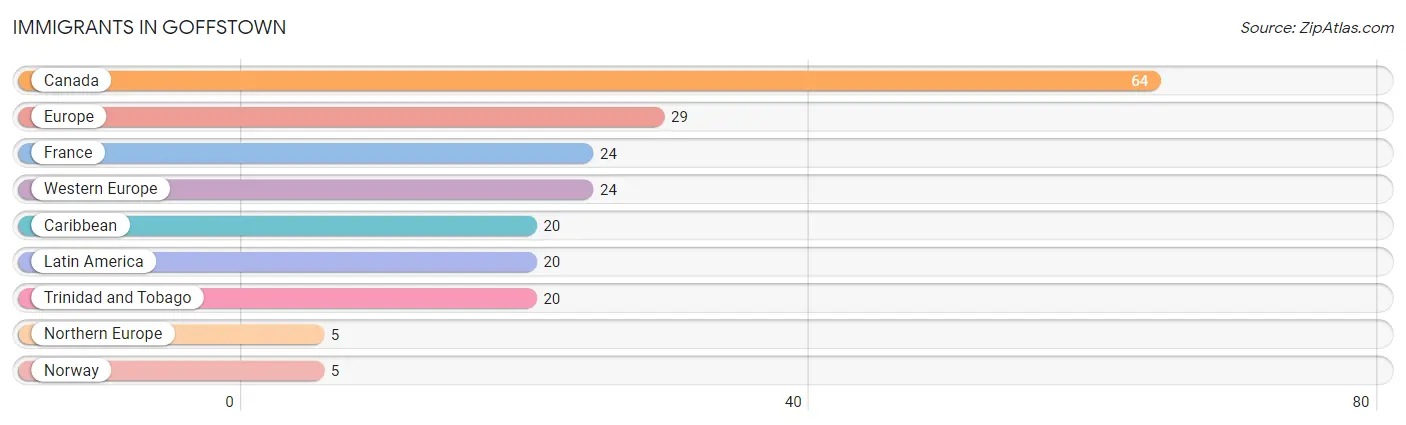
| Immigration Origin | # Population | % Population |
| Canada | 64 | 2.1% |
| Caribbean | 20 | 0.7% |
| Europe | 29 | 1.0% |
| France | 24 | 0.8% |
| Latin America | 20 | 0.7% |
| Northern Europe | 5 | 0.2% |
| Norway | 5 | 0.2% |
| Trinidad and Tobago | 20 | 0.7% |
| Western Europe | 24 | 0.8% | View All 9 Rows |
Sex and Age in Goffstown
Sex and Age in Goffstown
The most populous age groups in Goffstown are 25 to 29 Years (253 | 17.2%) for men and 25 to 29 Years (227 | 14.6%) for women.
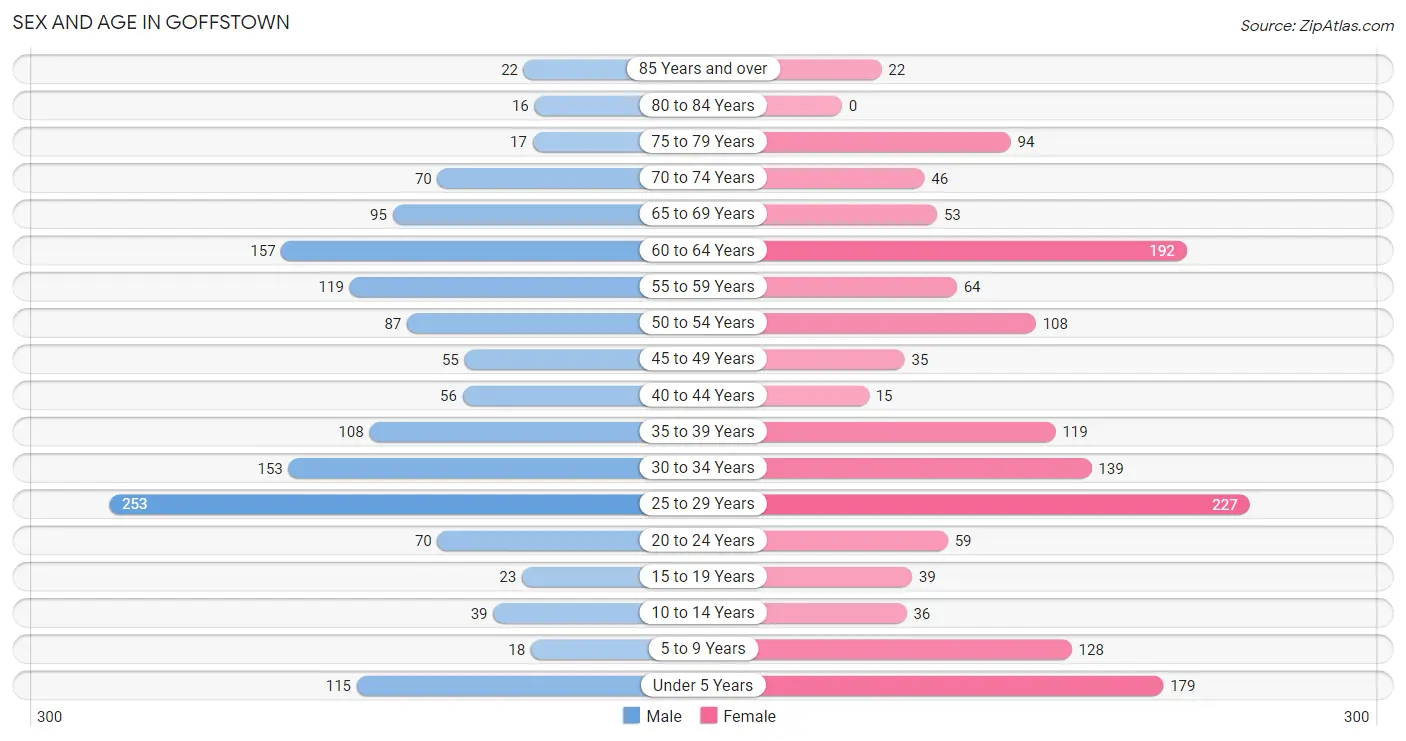
| Age Bracket | Male | Female |
| Under 5 Years | 115 (7.8%) | 179 (11.5%) |
| 5 to 9 Years | 18 (1.2%) | 128 (8.2%) |
| 10 to 14 Years | 39 (2.6%) | 36 (2.3%) |
| 15 to 19 Years | 23 (1.6%) | 39 (2.5%) |
| 20 to 24 Years | 70 (4.8%) | 59 (3.8%) |
| 25 to 29 Years | 253 (17.2%) | 227 (14.6%) |
| 30 to 34 Years | 153 (10.4%) | 139 (8.9%) |
| 35 to 39 Years | 108 (7.3%) | 119 (7.6%) |
| 40 to 44 Years | 56 (3.8%) | 15 (1.0%) |
| 45 to 49 Years | 55 (3.7%) | 35 (2.2%) |
| 50 to 54 Years | 87 (5.9%) | 108 (7.0%) |
| 55 to 59 Years | 119 (8.1%) | 64 (4.1%) |
| 60 to 64 Years | 157 (10.7%) | 192 (12.3%) |
| 65 to 69 Years | 95 (6.5%) | 53 (3.4%) |
| 70 to 74 Years | 70 (4.8%) | 46 (3.0%) |
| 75 to 79 Years | 17 (1.1%) | 94 (6.0%) |
| 80 to 84 Years | 16 (1.1%) | 0 (0.0%) |
| 85 Years and over | 22 (1.5%) | 22 (1.4%) |
| Total | 1,473 (100.0%) | 1,555 (100.0%) |
Families and Households in Goffstown
Median Family Size in Goffstown
The median family size in Goffstown is 3.06 persons per family, with married-couple families (604 | 78.7%) accounting for the largest median family size of 3.18 persons per family. On the other hand, single male/father families (58 | 7.6%) represent the smallest median family size with 2.24 persons per family.
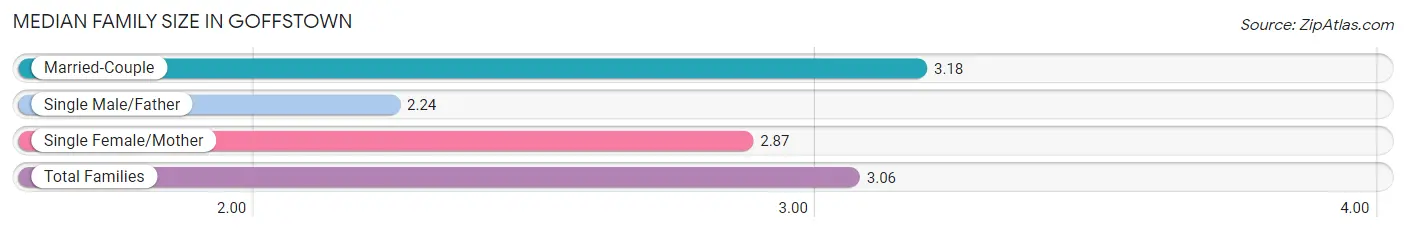
| Family Type | # Families | Family Size |
| Married-Couple | 604 (78.7%) | 3.18 |
| Single Male/Father | 58 (7.6%) | 2.24 |
| Single Female/Mother | 105 (13.7%) | 2.87 |
| Total Families | 767 (100.0%) | 3.06 |
Median Household Size in Goffstown
The median household size in Goffstown is 2.67 persons per household, with single female/mother households (105 | 9.3%) accounting for the largest median household size of 4.24 persons per household. non-family households (365 | 32.2%) represent the smallest median household size with 1.35 persons per household.
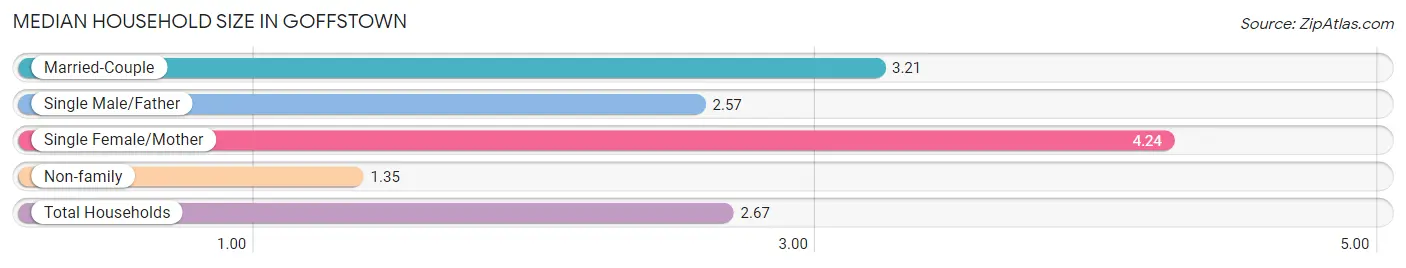
| Household Type | # Households | Household Size |
| Married-Couple | 604 (53.4%) | 3.21 |
| Single Male/Father | 58 (5.1%) | 2.57 |
| Single Female/Mother | 105 (9.3%) | 4.24 |
| Non-family | 365 (32.2%) | 1.35 |
| Total Households | 1,132 (100.0%) | 2.67 |
Household Size by Marriage Status in Goffstown
Out of a total of 1,132 households in Goffstown, 767 (67.8%) are family households, while 365 (32.2%) are nonfamily households. The most numerous type of family households are 3-person households, comprising 376, and the most common type of nonfamily households are 1-person households, comprising 261.
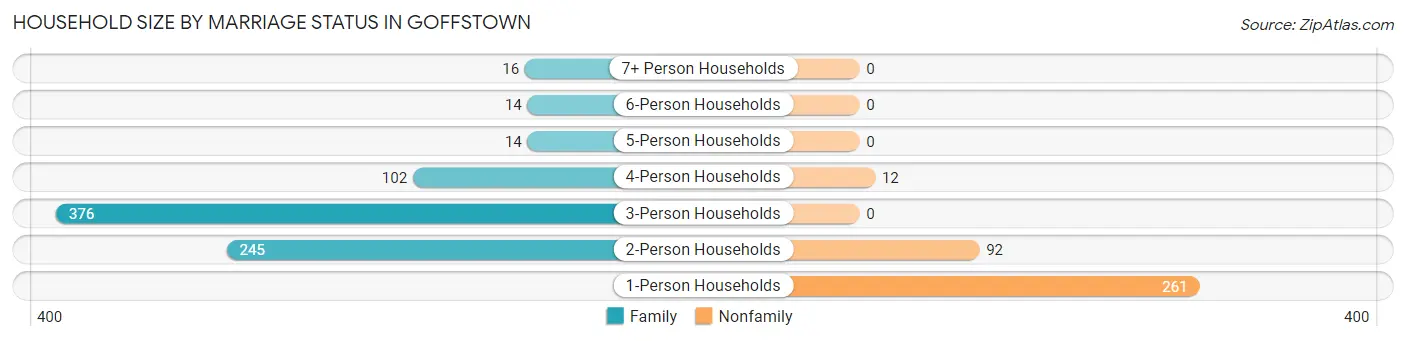
| Household Size | Family Households | Nonfamily Households |
| 1-Person Households | - | 261 (23.1%) |
| 2-Person Households | 245 (21.6%) | 92 (8.1%) |
| 3-Person Households | 376 (33.2%) | 0 (0.0%) |
| 4-Person Households | 102 (9.0%) | 12 (1.1%) |
| 5-Person Households | 14 (1.2%) | 0 (0.0%) |
| 6-Person Households | 14 (1.2%) | 0 (0.0%) |
| 7+ Person Households | 16 (1.4%) | 0 (0.0%) |
| Total | 767 (67.8%) | 365 (32.2%) |
Female Fertility in Goffstown
Fertility by Age in Goffstown
Average fertility rate in Goffstown is 12.0 births per 1,000 women. Women in the age bracket of 20 to 34 years have the highest fertility rate with 19.0 births per 1,000 women. Women in the age bracket of 20 to 34 years acount for 100.0% of all women with births.
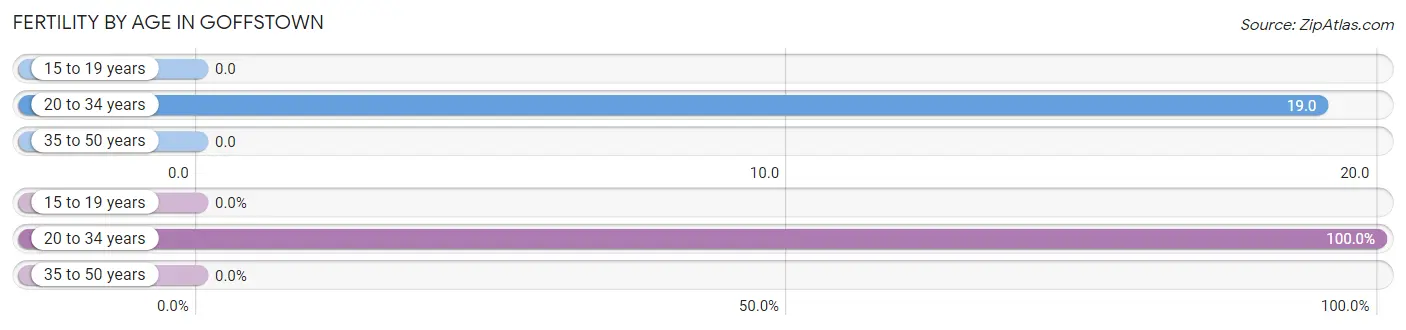
| Age Bracket | Women with Births | Births / 1,000 Women |
| 15 to 19 years | 0 (0.0%) | 0.0 |
| 20 to 34 years | 8 (100.0%) | 19.0 |
| 35 to 50 years | 0 (0.0%) | 0.0 |
| Total | 8 (100.0%) | 12.0 |
Fertility by Age by Marriage Status in Goffstown
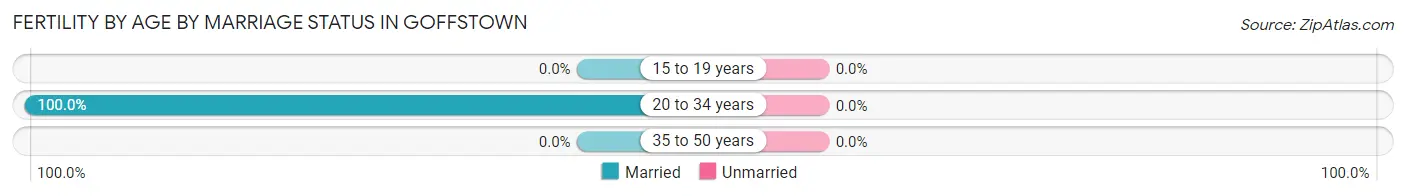
| Age Bracket | Married | Unmarried |
| 15 to 19 years | 0 (0.0%) | 0 (0.0%) |
| 20 to 34 years | 8 (100.0%) | 0 (0.0%) |
| 35 to 50 years | 0 (0.0%) | 0 (0.0%) |
| Total | 8 (100.0%) | 0 (0.0%) |
Fertility by Education in Goffstown
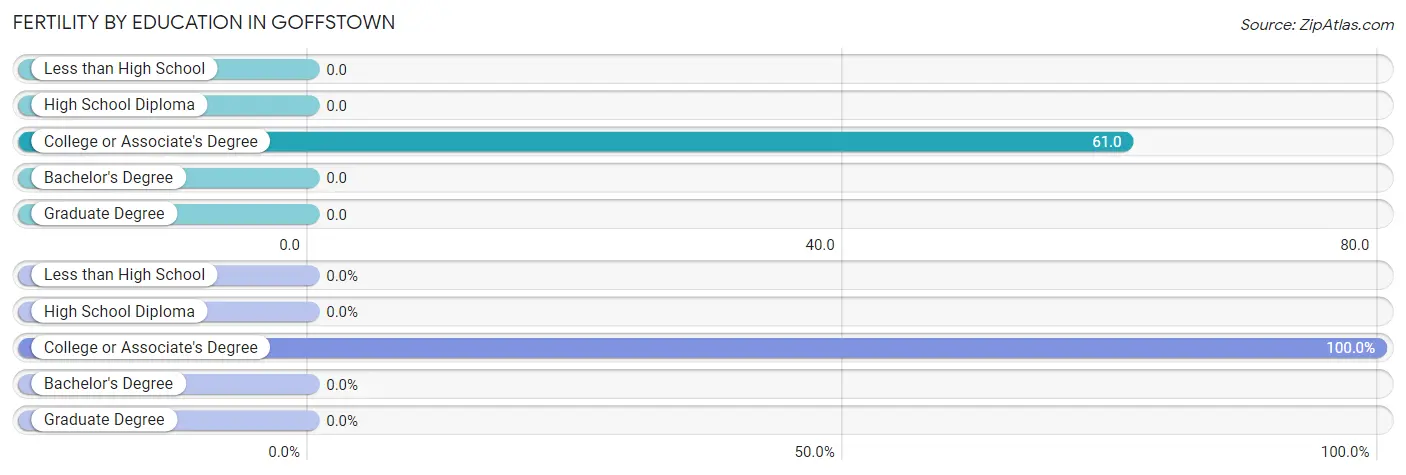
| Educational Attainment | Women with Births | Births / 1,000 Women |
| Less than High School | 0 (0.0%) | 0.0 |
| High School Diploma | 0 (0.0%) | 0.0 |
| College or Associate's Degree | 8 (100.0%) | 61.0 |
| Bachelor's Degree | 0 (0.0%) | 0.0 |
| Graduate Degree | 0 (0.0%) | 0.0 |
| Total | 8 (100.0%) | 12.0 |
Fertility by Education by Marriage Status in Goffstown
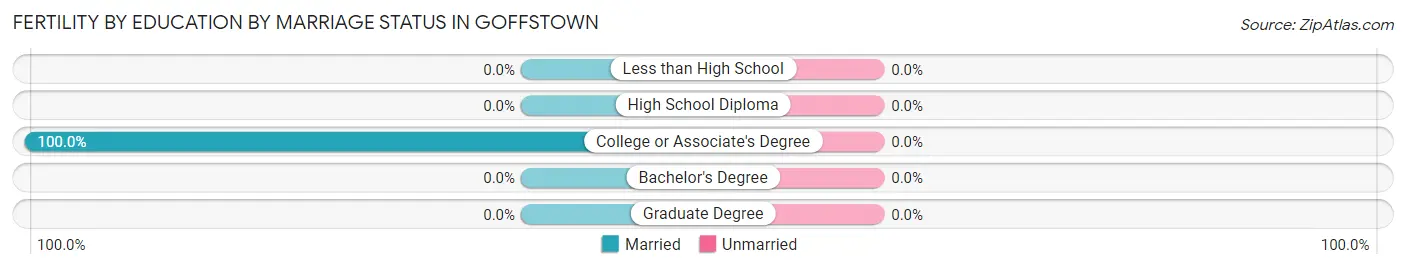
| Educational Attainment | Married | Unmarried |
| Less than High School | 0 (0.0%) | 0 (0.0%) |
| High School Diploma | 0 (0.0%) | 0 (0.0%) |
| College or Associate's Degree | 8 (100.0%) | 0 (0.0%) |
| Bachelor's Degree | 0 (0.0%) | 0 (0.0%) |
| Graduate Degree | 0 (0.0%) | 0 (0.0%) |
| Total | 8 (100.0%) | 0 (0.0%) |
Employment Characteristics in Goffstown
Employment by Class of Employer in Goffstown
Among the 1,889 employed individuals in Goffstown, private company employees (1,191 | 63.0%), not-for-profit organizations (264 | 14.0%), and local government employees (200 | 10.6%) make up the most common classes of employment.
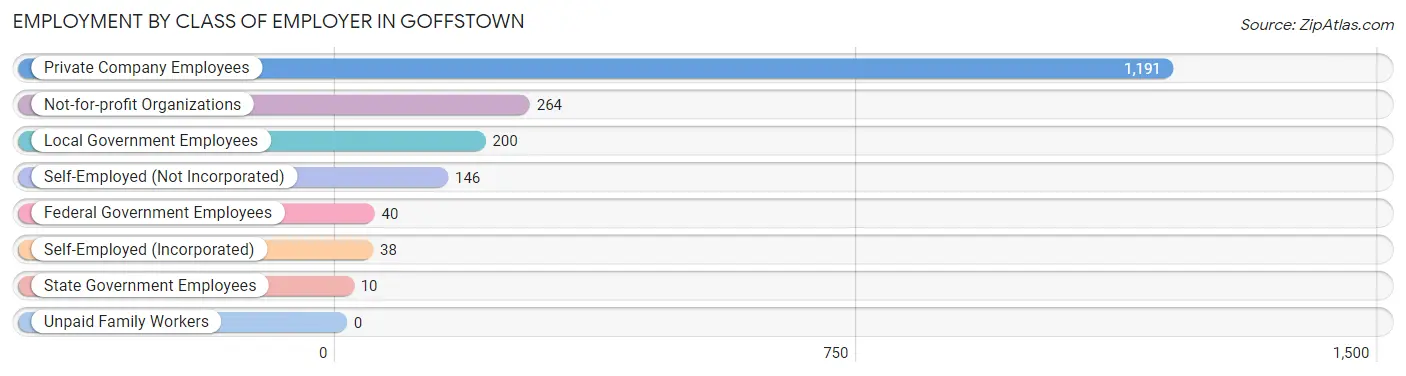
| Employer Class | # Employees | % Employees |
| Private Company Employees | 1,191 | 63.0% |
| Self-Employed (Incorporated) | 38 | 2.0% |
| Self-Employed (Not Incorporated) | 146 | 7.7% |
| Not-for-profit Organizations | 264 | 14.0% |
| Local Government Employees | 200 | 10.6% |
| State Government Employees | 10 | 0.5% |
| Federal Government Employees | 40 | 2.1% |
| Unpaid Family Workers | 0 | 0.0% |
| Total | 1,889 | 100.0% |
Employment Status by Age in Goffstown
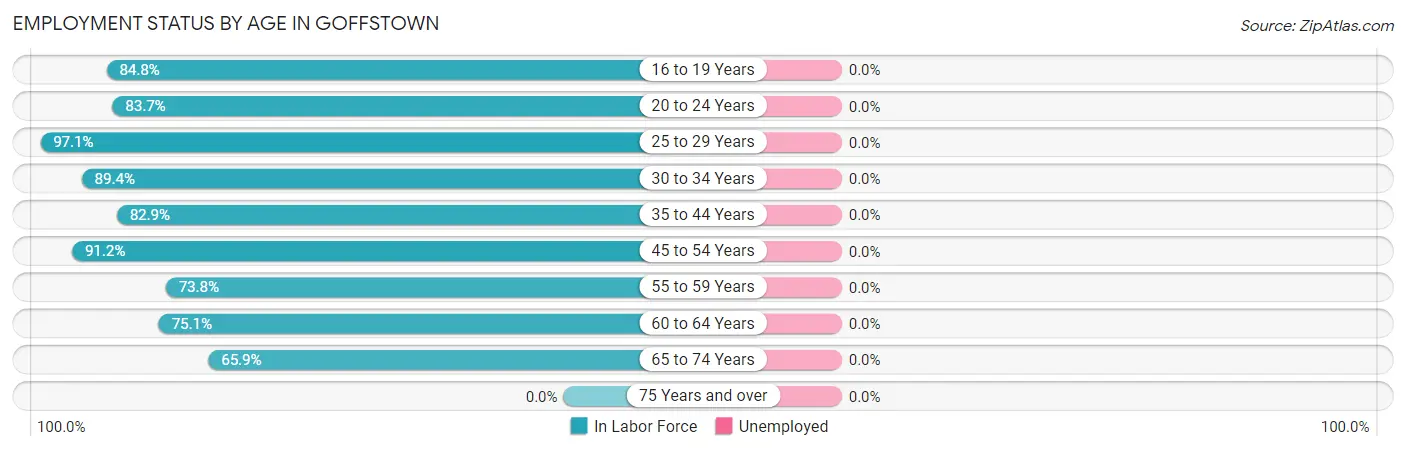
| Age Bracket | In Labor Force | Unemployed |
| 16 to 19 Years | 39 (84.8%) | 0 (0.0%) |
| 20 to 24 Years | 108 (83.7%) | 0 (0.0%) |
| 25 to 29 Years | 466 (97.1%) | 0 (0.0%) |
| 30 to 34 Years | 261 (89.4%) | 0 (0.0%) |
| 35 to 44 Years | 247 (82.9%) | 0 (0.0%) |
| 45 to 54 Years | 260 (91.2%) | 0 (0.0%) |
| 55 to 59 Years | 135 (73.8%) | 0 (0.0%) |
| 60 to 64 Years | 262 (75.1%) | 0 (0.0%) |
| 65 to 74 Years | 174 (65.9%) | 0 (0.0%) |
| 75 Years and over | 0 (0.0%) | 0 (0.0%) |
| Total | 1,953 (78.2%) | 0 (0.0%) |
Employment Status by Educational Attainment in Goffstown
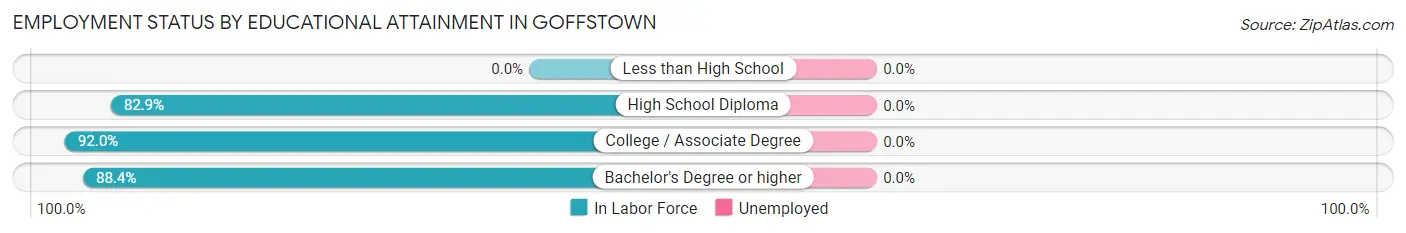
| Educational Attainment | In Labor Force | Unemployed |
| Less than High School | 0 (0.0%) | 0 (0.0%) |
| High School Diploma | 350 (82.9%) | 0 (0.0%) |
| College / Associate Degree | 542 (92.0%) | 0 (0.0%) |
| Bachelor's Degree or higher | 739 (88.4%) | 0 (0.0%) |
| Total | 1,630 (86.4%) | 0 (0.0%) |
Employment Occupations by Sex in Goffstown
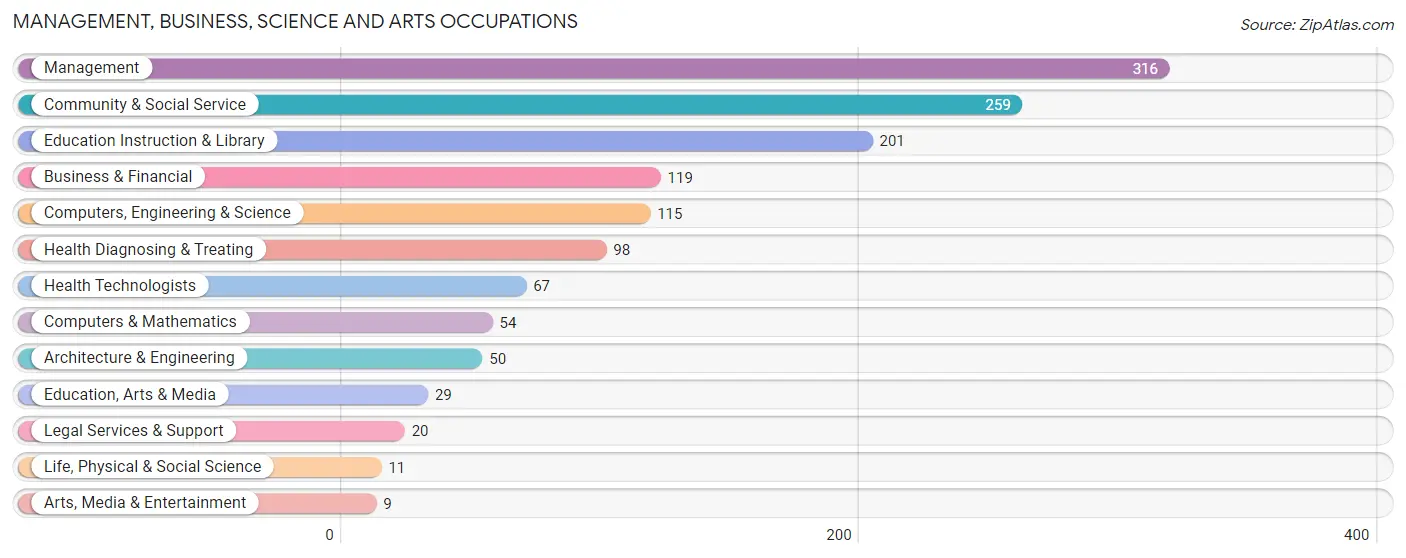
Management, Business, Science and Arts Occupations
The most common Management, Business, Science and Arts occupations in Goffstown are Management (316 | 16.2%), Community & Social Service (259 | 13.3%), Education Instruction & Library (201 | 10.3%), Business & Financial (119 | 6.1%), and Computers, Engineering & Science (115 | 5.9%).
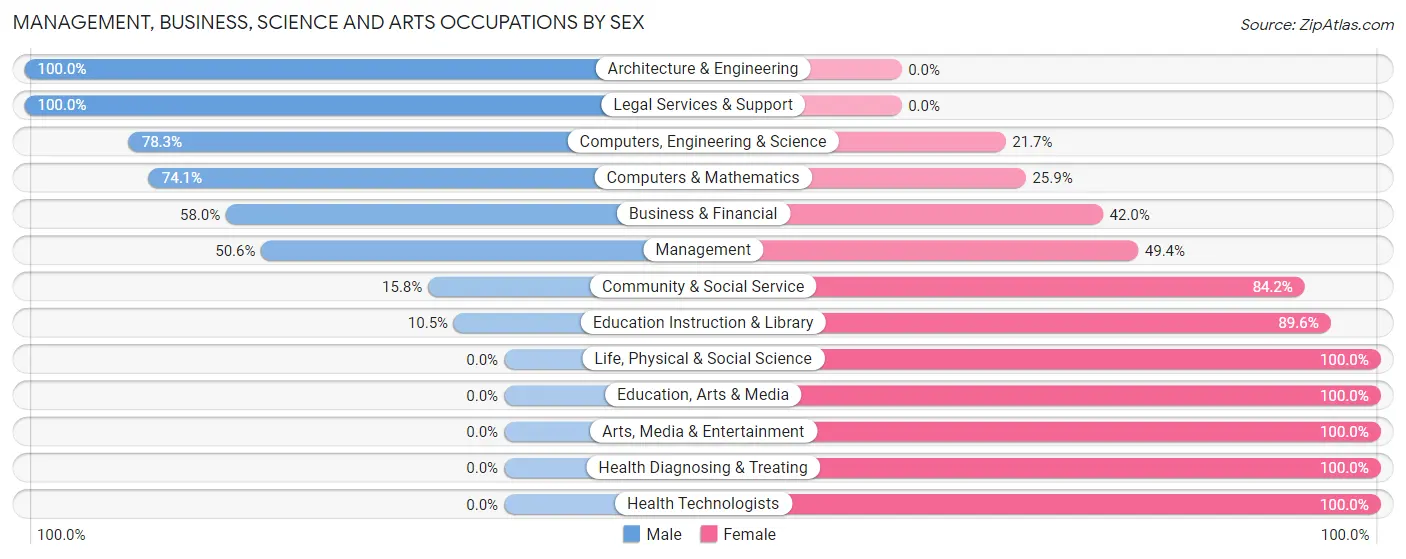
Management, Business, Science and Arts Occupations by Sex
Within the Management, Business, Science and Arts occupations in Goffstown, the most male-oriented occupations are Architecture & Engineering (100.0%), Legal Services & Support (100.0%), and Computers, Engineering & Science (78.3%), while the most female-oriented occupations are Life, Physical & Social Science (100.0%), Education, Arts & Media (100.0%), and Arts, Media & Entertainment (100.0%).
| Occupation | Male | Female |
| Management | 160 (50.6%) | 156 (49.4%) |
| Business & Financial | 69 (58.0%) | 50 (42.0%) |
| Computers, Engineering & Science | 90 (78.3%) | 25 (21.7%) |
| Computers & Mathematics | 40 (74.1%) | 14 (25.9%) |
| Architecture & Engineering | 50 (100.0%) | 0 (0.0%) |
| Life, Physical & Social Science | 0 (0.0%) | 11 (100.0%) |
| Community & Social Service | 41 (15.8%) | 218 (84.2%) |
| Education, Arts & Media | 0 (0.0%) | 29 (100.0%) |
| Legal Services & Support | 20 (100.0%) | 0 (0.0%) |
| Education Instruction & Library | 21 (10.4%) | 180 (89.5%) |
| Arts, Media & Entertainment | 0 (0.0%) | 9 (100.0%) |
| Health Diagnosing & Treating | 0 (0.0%) | 98 (100.0%) |
| Health Technologists | 0 (0.0%) | 67 (100.0%) |
| Total (Category) | 360 (39.7%) | 547 (60.3%) |
| Total (Overall) | 1,028 (52.7%) | 924 (47.3%) |
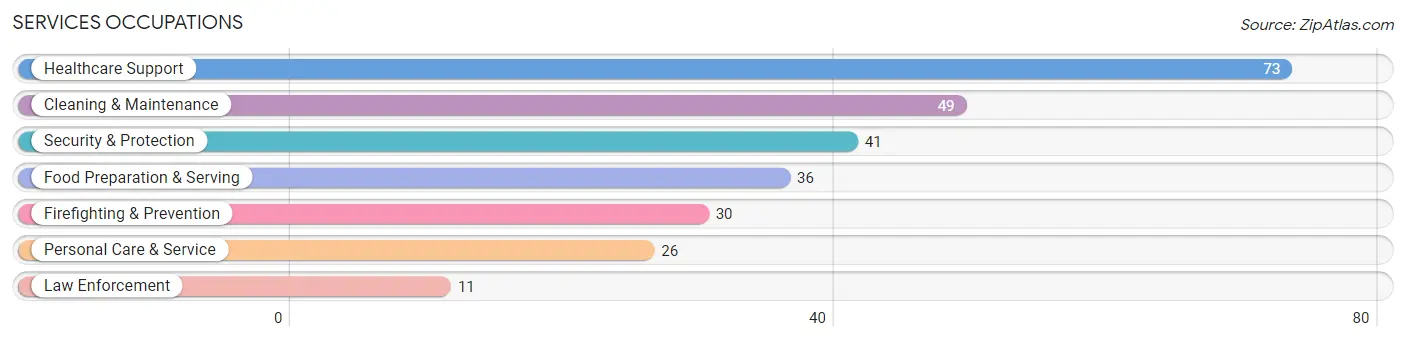
Services Occupations
The most common Services occupations in Goffstown are Healthcare Support (73 | 3.7%), Cleaning & Maintenance (49 | 2.5%), Security & Protection (41 | 2.1%), Food Preparation & Serving (36 | 1.8%), and Firefighting & Prevention (30 | 1.5%).
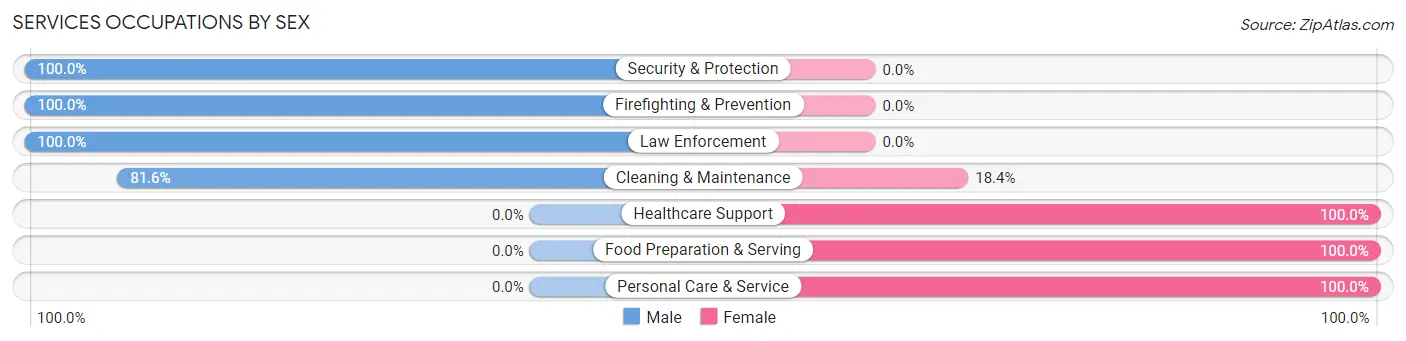
Services Occupations by Sex
Within the Services occupations in Goffstown, the most male-oriented occupations are Security & Protection (100.0%), Firefighting & Prevention (100.0%), and Law Enforcement (100.0%), while the most female-oriented occupations are Healthcare Support (100.0%), Food Preparation & Serving (100.0%), and Personal Care & Service (100.0%).
| Occupation | Male | Female |
| Healthcare Support | 0 (0.0%) | 73 (100.0%) |
| Security & Protection | 41 (100.0%) | 0 (0.0%) |
| Firefighting & Prevention | 30 (100.0%) | 0 (0.0%) |
| Law Enforcement | 11 (100.0%) | 0 (0.0%) |
| Food Preparation & Serving | 0 (0.0%) | 36 (100.0%) |
| Cleaning & Maintenance | 40 (81.6%) | 9 (18.4%) |
| Personal Care & Service | 0 (0.0%) | 26 (100.0%) |
| Total (Category) | 81 (36.0%) | 144 (64.0%) |
| Total (Overall) | 1,028 (52.7%) | 924 (47.3%) |
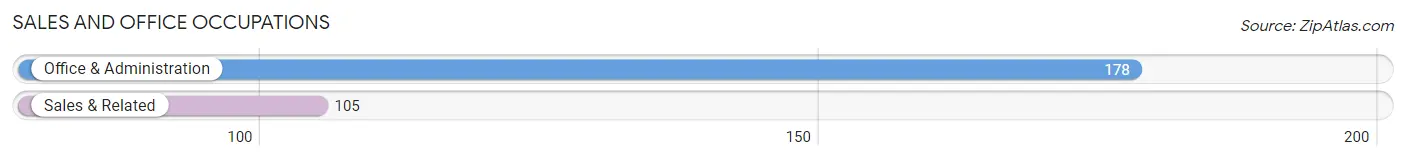
Sales and Office Occupations
The most common Sales and Office occupations in Goffstown are Office & Administration (178 | 9.1%), and Sales & Related (105 | 5.4%).
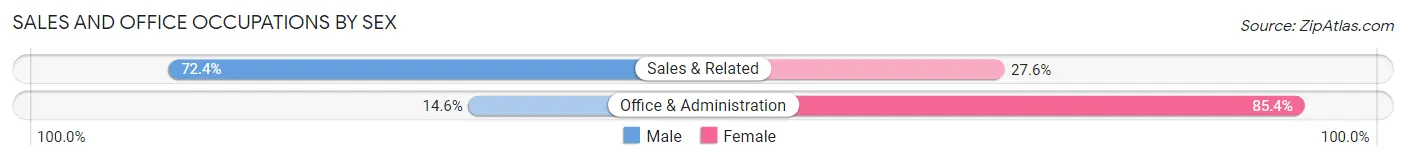
Sales and Office Occupations by Sex
| Occupation | Male | Female |
| Sales & Related | 76 (72.4%) | 29 (27.6%) |
| Office & Administration | 26 (14.6%) | 152 (85.4%) |
| Total (Category) | 102 (36.0%) | 181 (64.0%) |
| Total (Overall) | 1,028 (52.7%) | 924 (47.3%) |
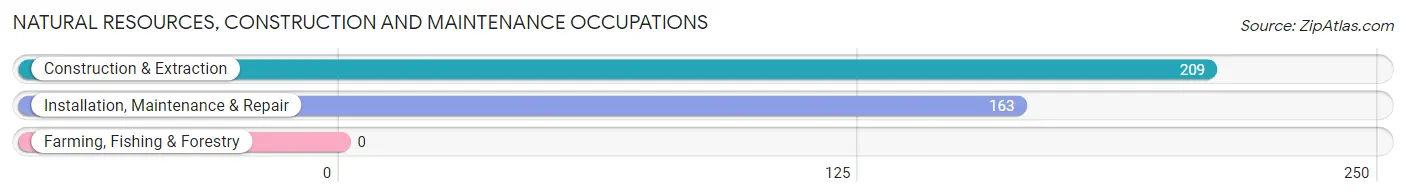
Natural Resources, Construction and Maintenance Occupations
The most common Natural Resources, Construction and Maintenance occupations in Goffstown are Construction & Extraction (209 | 10.7%), and Installation, Maintenance & Repair (163 | 8.4%).
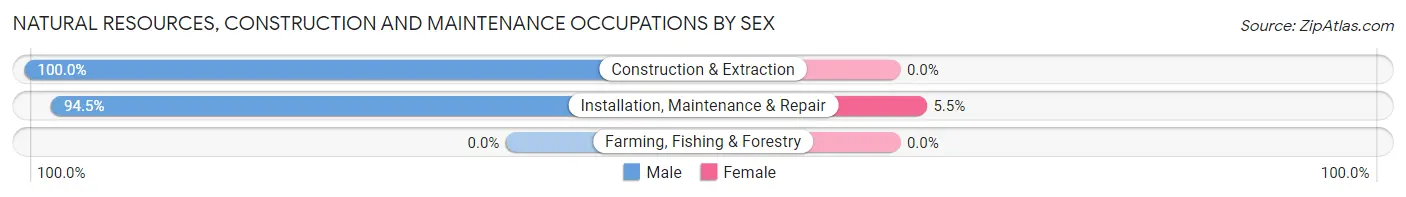
Natural Resources, Construction and Maintenance Occupations by Sex
| Occupation | Male | Female |
| Farming, Fishing & Forestry | 0 (0.0%) | 0 (0.0%) |
| Construction & Extraction | 209 (100.0%) | 0 (0.0%) |
| Installation, Maintenance & Repair | 154 (94.5%) | 9 (5.5%) |
| Total (Category) | 363 (97.6%) | 9 (2.4%) |
| Total (Overall) | 1,028 (52.7%) | 924 (47.3%) |
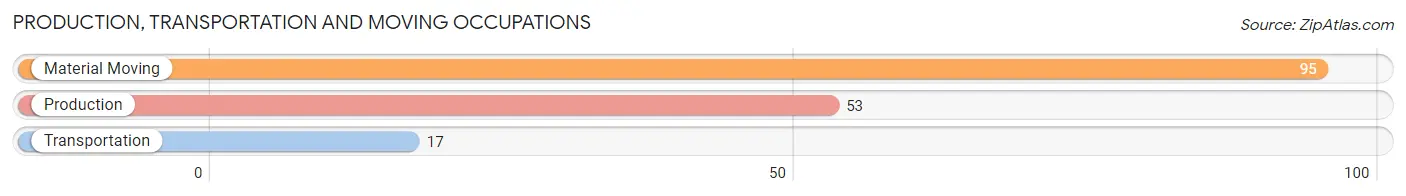
Production, Transportation and Moving Occupations
The most common Production, Transportation and Moving occupations in Goffstown are Material Moving (95 | 4.9%), Production (53 | 2.7%), and Transportation (17 | 0.9%).
Production, Transportation and Moving Occupations by Sex
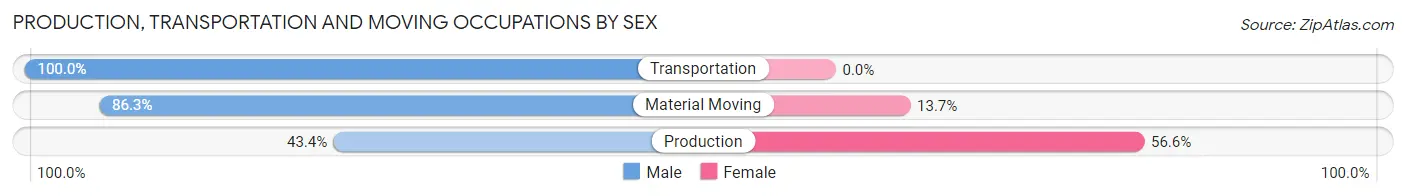
| Occupation | Male | Female |
| Production | 23 (43.4%) | 30 (56.6%) |
| Transportation | 17 (100.0%) | 0 (0.0%) |
| Material Moving | 82 (86.3%) | 13 (13.7%) |
| Total (Category) | 122 (73.9%) | 43 (26.1%) |
| Total (Overall) | 1,028 (52.7%) | 924 (47.3%) |
Employment Industries by Sex in Goffstown
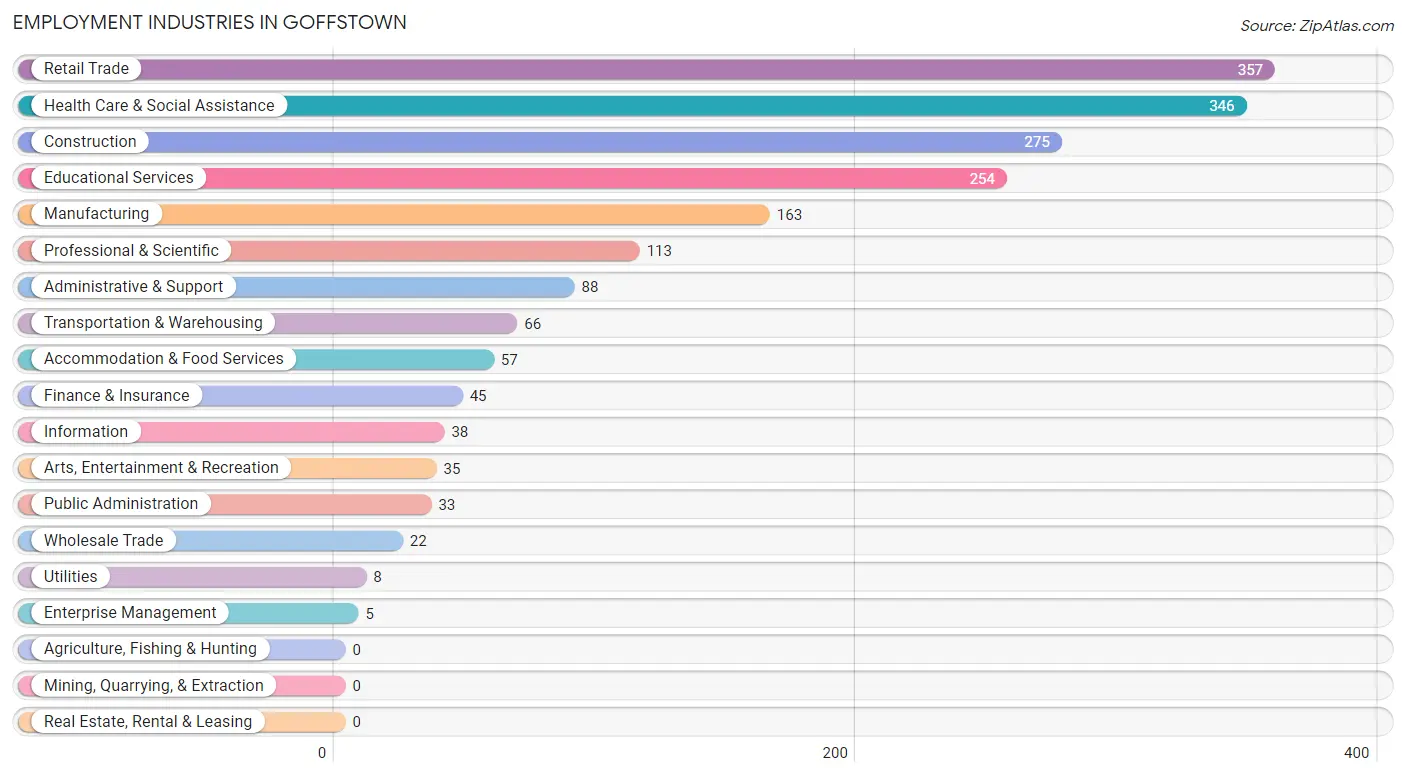
Employment Industries in Goffstown
The major employment industries in Goffstown include Retail Trade (357 | 18.3%), Health Care & Social Assistance (346 | 17.7%), Construction (275 | 14.1%), Educational Services (254 | 13.0%), and Manufacturing (163 | 8.4%).
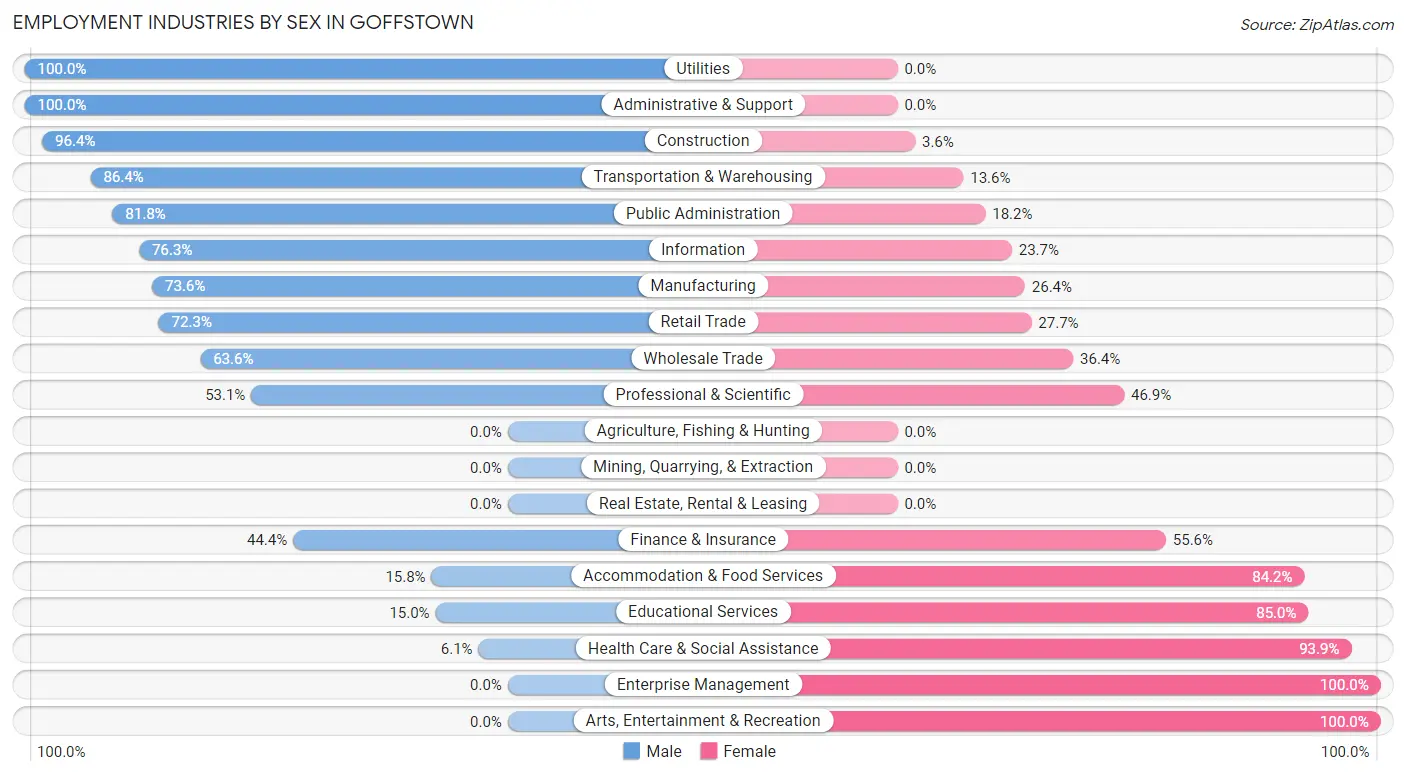
Employment Industries by Sex in Goffstown
The Goffstown industries that see more men than women are Utilities (100.0%), Administrative & Support (100.0%), and Construction (96.4%), whereas the industries that tend to have a higher number of women are Enterprise Management (100.0%), Arts, Entertainment & Recreation (100.0%), and Health Care & Social Assistance (93.9%).
| Industry | Male | Female |
| Agriculture, Fishing & Hunting | 0 (0.0%) | 0 (0.0%) |
| Mining, Quarrying, & Extraction | 0 (0.0%) | 0 (0.0%) |
| Construction | 265 (96.4%) | 10 (3.6%) |
| Manufacturing | 120 (73.6%) | 43 (26.4%) |
| Wholesale Trade | 14 (63.6%) | 8 (36.4%) |
| Retail Trade | 258 (72.3%) | 99 (27.7%) |
| Transportation & Warehousing | 57 (86.4%) | 9 (13.6%) |
| Utilities | 8 (100.0%) | 0 (0.0%) |
| Information | 29 (76.3%) | 9 (23.7%) |
| Finance & Insurance | 20 (44.4%) | 25 (55.6%) |
| Real Estate, Rental & Leasing | 0 (0.0%) | 0 (0.0%) |
| Professional & Scientific | 60 (53.1%) | 53 (46.9%) |
| Enterprise Management | 0 (0.0%) | 5 (100.0%) |
| Administrative & Support | 88 (100.0%) | 0 (0.0%) |
| Educational Services | 38 (15.0%) | 216 (85.0%) |
| Health Care & Social Assistance | 21 (6.1%) | 325 (93.9%) |
| Arts, Entertainment & Recreation | 0 (0.0%) | 35 (100.0%) |
| Accommodation & Food Services | 9 (15.8%) | 48 (84.2%) |
| Public Administration | 27 (81.8%) | 6 (18.2%) |
| Total | 1,028 (52.7%) | 924 (47.3%) |
Education in Goffstown
School Enrollment in Goffstown
The most common levels of schooling among the 398 students in Goffstown are elementary school (94 | 23.6%), college / undergraduate (80 | 20.1%), and nursery / preschool (79 | 19.9%).
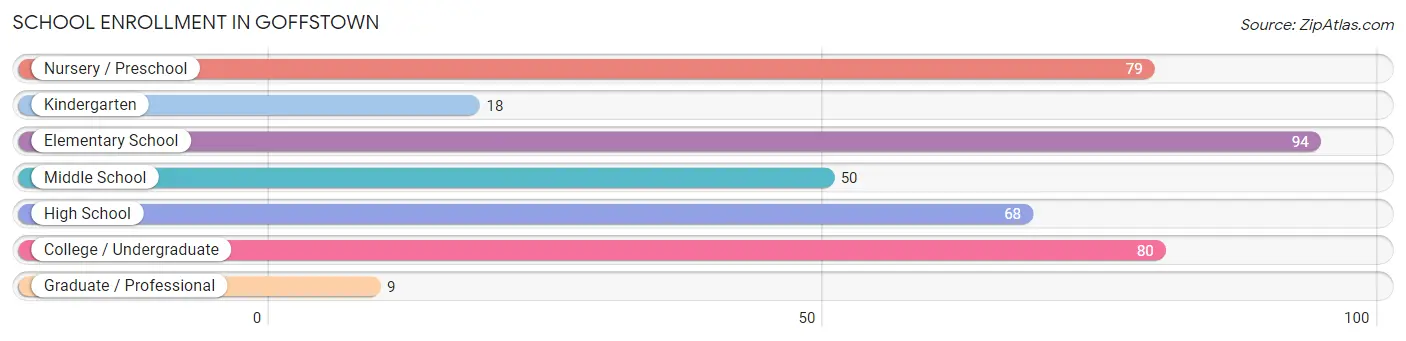
| School Level | # Students | % Students |
| Nursery / Preschool | 79 | 19.9% |
| Kindergarten | 18 | 4.5% |
| Elementary School | 94 | 23.6% |
| Middle School | 50 | 12.6% |
| High School | 68 | 17.1% |
| College / Undergraduate | 80 | 20.1% |
| Graduate / Professional | 9 | 2.3% |
| Total | 398 | 100.0% |
School Enrollment by Age by Funding Source in Goffstown
Out of a total of 398 students who are enrolled in schools in Goffstown, 171 (43.0%) attend a private institution, while the remaining 227 (57.0%) are enrolled in public schools. The age group of 3 to 4 year olds has the highest likelihood of being enrolled in private schools, with 55 (100.0% in the age bracket) enrolled. Conversely, the age group of 18 to 19 year olds has the lowest likelihood of being enrolled in a private school, with 32 (100.0% in the age bracket) attending a public institution.
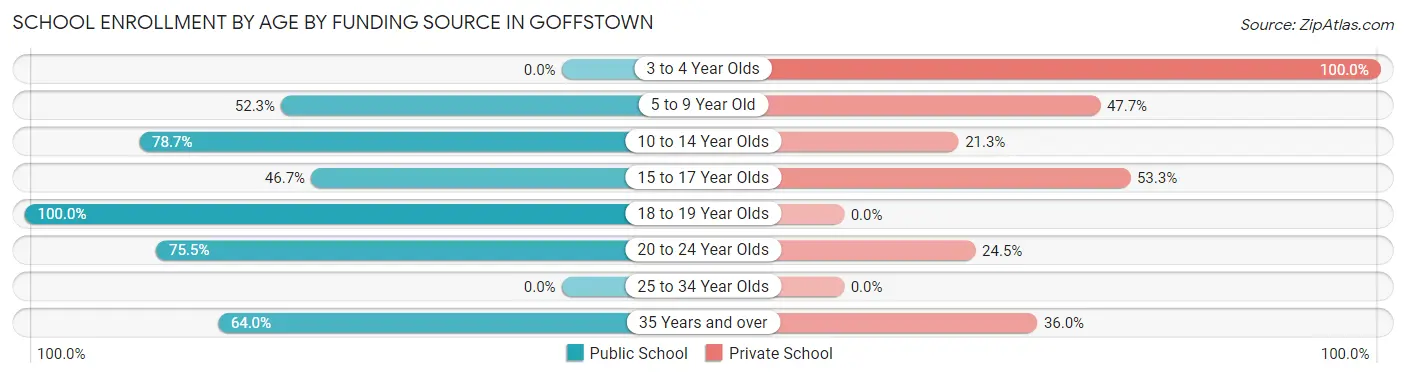
| Age Bracket | Public School | Private School |
| 3 to 4 Year Olds | 0 (0.0%) | 55 (100.0%) |
| 5 to 9 Year Old | 69 (52.3%) | 63 (47.7%) |
| 10 to 14 Year Olds | 59 (78.7%) | 16 (21.3%) |
| 15 to 17 Year Olds | 14 (46.7%) | 16 (53.3%) |
| 18 to 19 Year Olds | 32 (100.0%) | 0 (0.0%) |
| 20 to 24 Year Olds | 37 (75.5%) | 12 (24.5%) |
| 25 to 34 Year Olds | 0 (0.0%) | 0 (0.0%) |
| 35 Years and over | 16 (64.0%) | 9 (36.0%) |
| Total | 227 (57.0%) | 171 (43.0%) |
Educational Attainment by Field of Study in Goffstown
Business (296 | 25.7%), education (199 | 17.3%), science & technology (137 | 11.9%), engineering (117 | 10.2%), and physical & health sciences (65 | 5.7%) are the most common fields of study among 1,151 individuals in Goffstown who have obtained a bachelor's degree or higher.
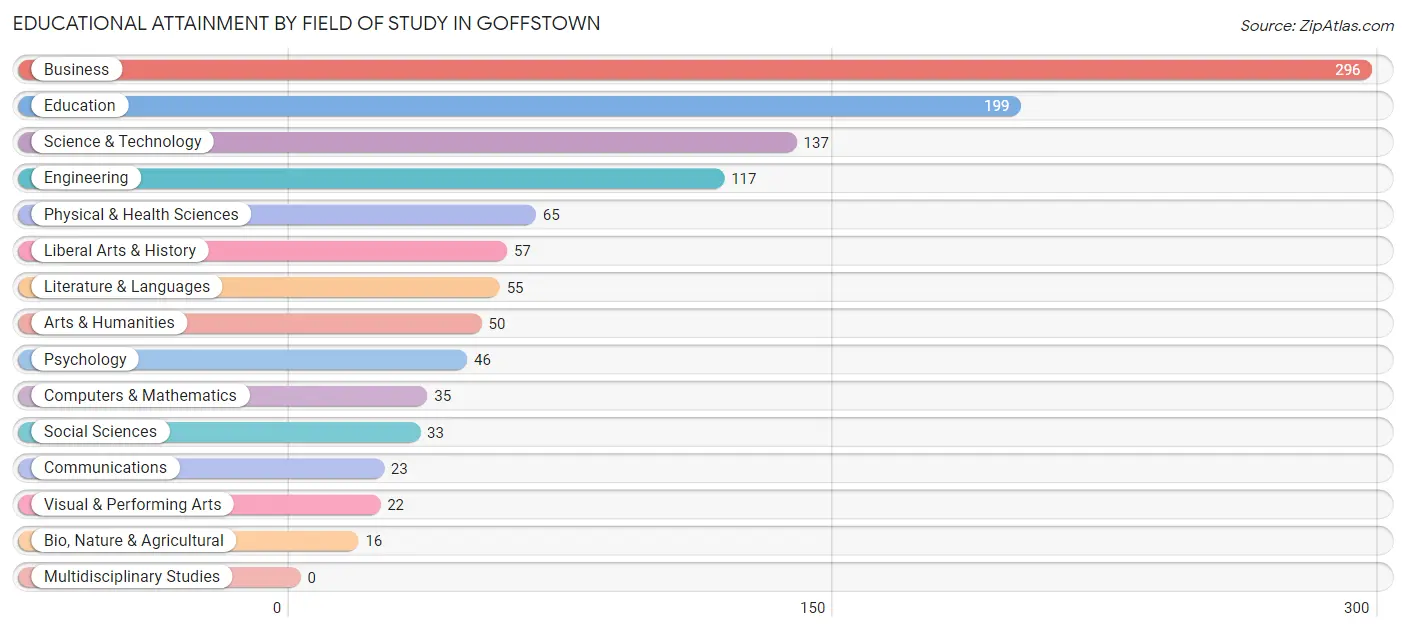
| Field of Study | # Graduates | % Graduates |
| Computers & Mathematics | 35 | 3.0% |
| Bio, Nature & Agricultural | 16 | 1.4% |
| Physical & Health Sciences | 65 | 5.7% |
| Psychology | 46 | 4.0% |
| Social Sciences | 33 | 2.9% |
| Engineering | 117 | 10.2% |
| Multidisciplinary Studies | 0 | 0.0% |
| Science & Technology | 137 | 11.9% |
| Business | 296 | 25.7% |
| Education | 199 | 17.3% |
| Literature & Languages | 55 | 4.8% |
| Liberal Arts & History | 57 | 5.0% |
| Visual & Performing Arts | 22 | 1.9% |
| Communications | 23 | 2.0% |
| Arts & Humanities | 50 | 4.3% |
| Total | 1,151 | 100.0% |
Transportation & Commute in Goffstown
Vehicle Availability by Sex in Goffstown
The most prevalent vehicle ownership categories in Goffstown are males with 3 vehicles (475, accounting for 46.2%) and females with 3 vehicles (373, making up 55.2%).
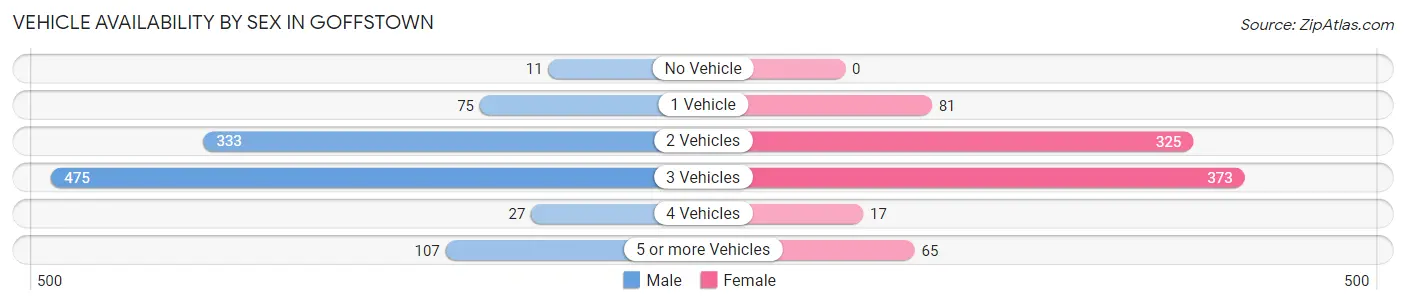
| Vehicles Available | Male | Female |
| No Vehicle | 11 (1.1%) | 0 (0.0%) |
| 1 Vehicle | 75 (7.3%) | 81 (9.4%) |
| 2 Vehicles | 333 (32.4%) | 325 (37.8%) |
| 3 Vehicles | 475 (46.2%) | 373 (43.3%) |
| 4 Vehicles | 27 (2.6%) | 17 (2.0%) |
| 5 or more Vehicles | 107 (10.4%) | 65 (7.5%) |
| Total | 1,028 (100.0%) | 861 (100.0%) |
Commute Time in Goffstown
The most frequently occuring commute durations in Goffstown are 20 to 24 minutes (329 commuters, 19.7%), 45 to 59 minutes (291 commuters, 17.4%), and 30 to 34 minutes (232 commuters, 13.9%).
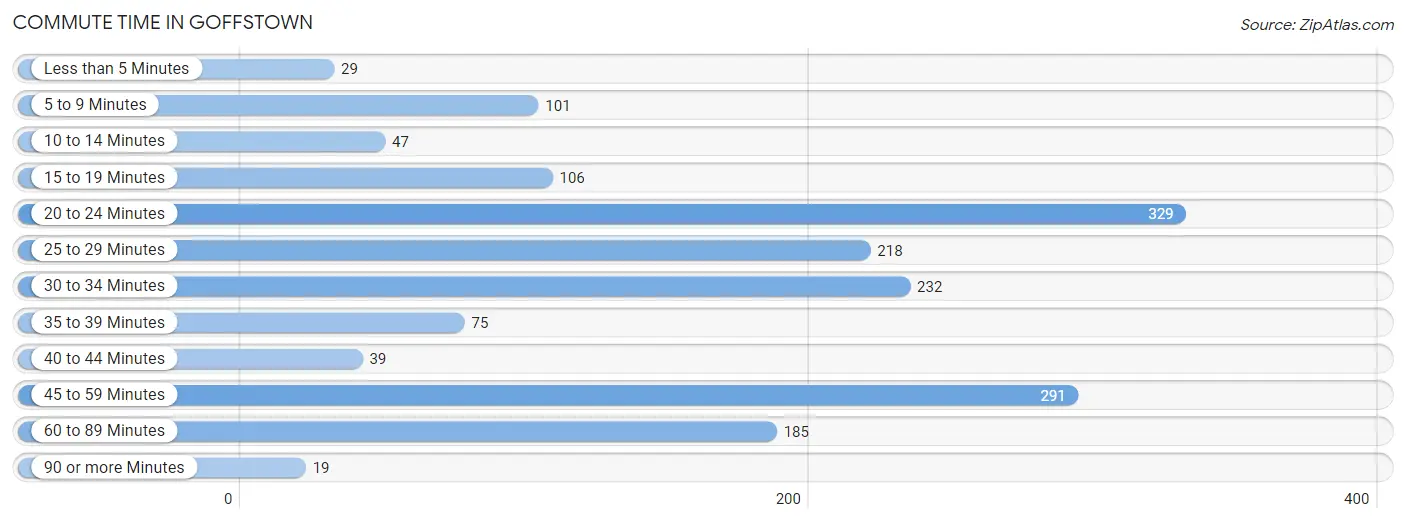
| Commute Time | # Commuters | % Commuters |
| Less than 5 Minutes | 29 | 1.7% |
| 5 to 9 Minutes | 101 | 6.0% |
| 10 to 14 Minutes | 47 | 2.8% |
| 15 to 19 Minutes | 106 | 6.3% |
| 20 to 24 Minutes | 329 | 19.7% |
| 25 to 29 Minutes | 218 | 13.1% |
| 30 to 34 Minutes | 232 | 13.9% |
| 35 to 39 Minutes | 75 | 4.5% |
| 40 to 44 Minutes | 39 | 2.3% |
| 45 to 59 Minutes | 291 | 17.4% |
| 60 to 89 Minutes | 185 | 11.1% |
| 90 or more Minutes | 19 | 1.1% |
Commute Time by Sex in Goffstown
The most common commute times in Goffstown are 45 to 59 minutes (232 commuters, 26.2%) for males and 20 to 24 minutes (231 commuters, 29.4%) for females.
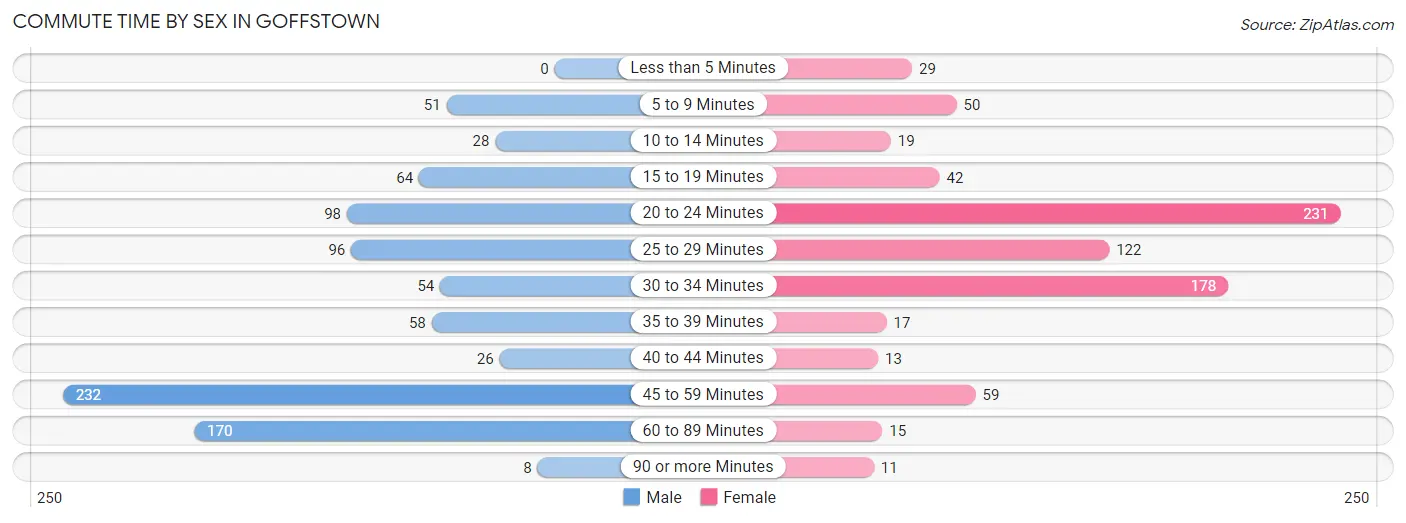
| Commute Time | Male | Female |
| Less than 5 Minutes | 0 (0.0%) | 29 (3.7%) |
| 5 to 9 Minutes | 51 (5.8%) | 50 (6.4%) |
| 10 to 14 Minutes | 28 (3.2%) | 19 (2.4%) |
| 15 to 19 Minutes | 64 (7.2%) | 42 (5.3%) |
| 20 to 24 Minutes | 98 (11.1%) | 231 (29.4%) |
| 25 to 29 Minutes | 96 (10.8%) | 122 (15.5%) |
| 30 to 34 Minutes | 54 (6.1%) | 178 (22.7%) |
| 35 to 39 Minutes | 58 (6.6%) | 17 (2.2%) |
| 40 to 44 Minutes | 26 (2.9%) | 13 (1.7%) |
| 45 to 59 Minutes | 232 (26.2%) | 59 (7.5%) |
| 60 to 89 Minutes | 170 (19.2%) | 15 (1.9%) |
| 90 or more Minutes | 8 (0.9%) | 11 (1.4%) |
Time of Departure to Work by Sex in Goffstown
The most frequent times of departure to work in Goffstown are 7:00 AM to 7:29 AM (248, 28.0%) for males and 6:30 AM to 6:59 AM (209, 26.6%) for females.
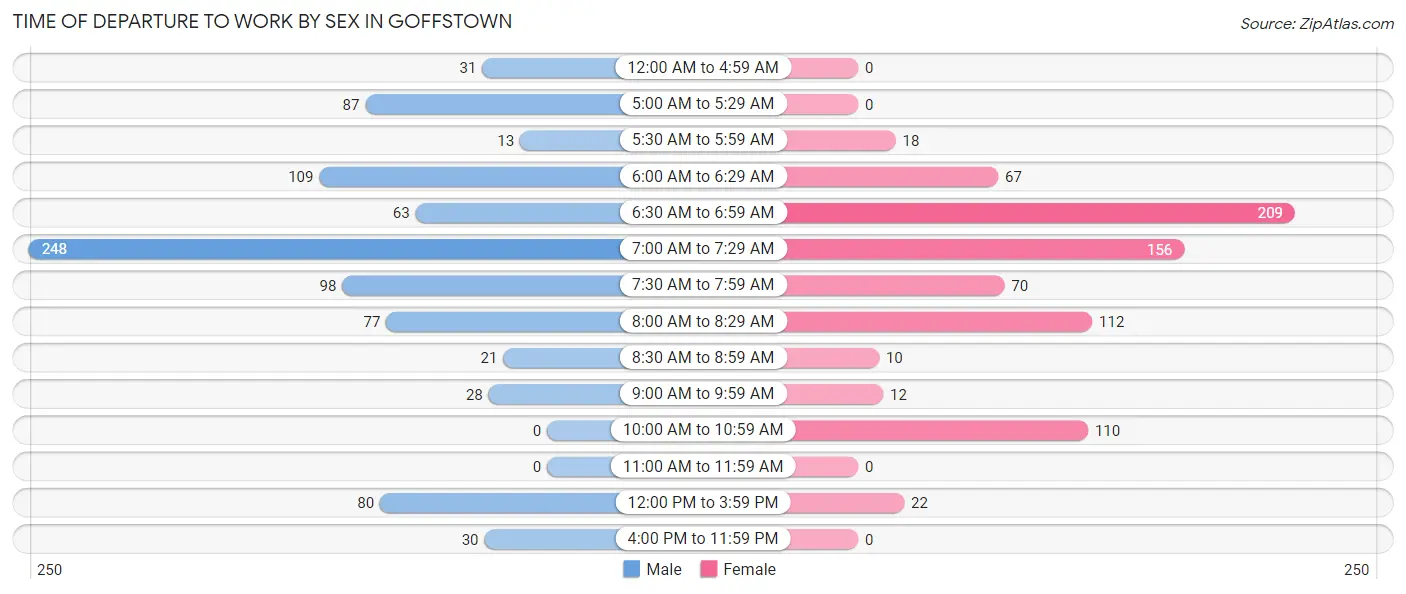
| Time of Departure | Male | Female |
| 12:00 AM to 4:59 AM | 31 (3.5%) | 0 (0.0%) |
| 5:00 AM to 5:29 AM | 87 (9.8%) | 0 (0.0%) |
| 5:30 AM to 5:59 AM | 13 (1.5%) | 18 (2.3%) |
| 6:00 AM to 6:29 AM | 109 (12.3%) | 67 (8.5%) |
| 6:30 AM to 6:59 AM | 63 (7.1%) | 209 (26.6%) |
| 7:00 AM to 7:29 AM | 248 (28.0%) | 156 (19.9%) |
| 7:30 AM to 7:59 AM | 98 (11.1%) | 70 (8.9%) |
| 8:00 AM to 8:29 AM | 77 (8.7%) | 112 (14.2%) |
| 8:30 AM to 8:59 AM | 21 (2.4%) | 10 (1.3%) |
| 9:00 AM to 9:59 AM | 28 (3.2%) | 12 (1.5%) |
| 10:00 AM to 10:59 AM | 0 (0.0%) | 110 (14.0%) |
| 11:00 AM to 11:59 AM | 0 (0.0%) | 0 (0.0%) |
| 12:00 PM to 3:59 PM | 80 (9.0%) | 22 (2.8%) |
| 4:00 PM to 11:59 PM | 30 (3.4%) | 0 (0.0%) |
| Total | 885 (100.0%) | 786 (100.0%) |
Housing Occupancy in Goffstown
Occupancy by Ownership in Goffstown
Of the total 1,132 dwellings in Goffstown, owner-occupied units account for 1,002 (88.5%), while renter-occupied units make up 130 (11.5%).
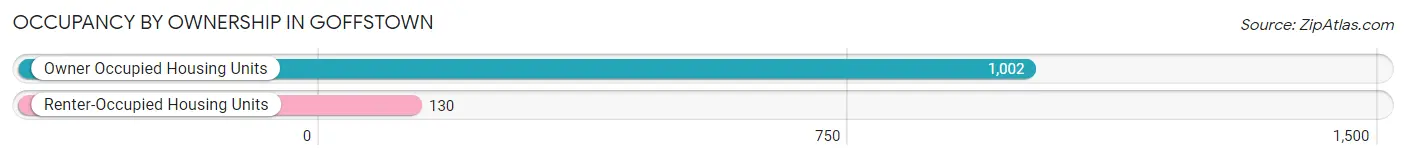
| Occupancy | # Housing Units | % Housing Units |
| Owner Occupied Housing Units | 1,002 | 88.5% |
| Renter-Occupied Housing Units | 130 | 11.5% |
| Total Occupied Housing Units | 1,132 | 100.0% |
Occupancy by Household Size in Goffstown
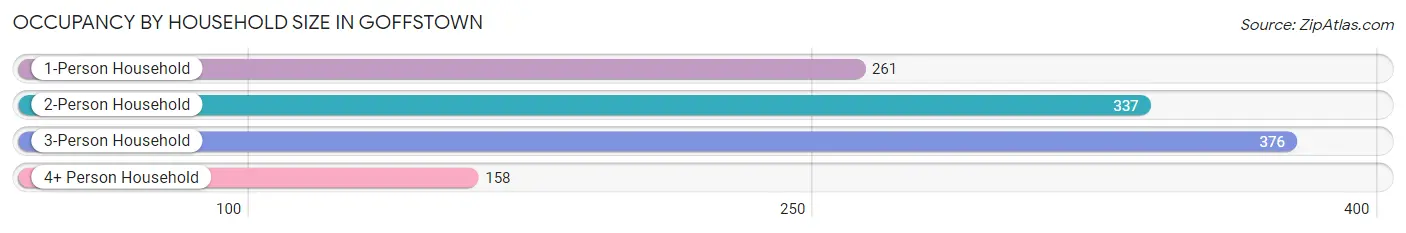
| Household Size | # Housing Units | % Housing Units |
| 1-Person Household | 261 | 23.1% |
| 2-Person Household | 337 | 29.8% |
| 3-Person Household | 376 | 33.2% |
| 4+ Person Household | 158 | 14.0% |
| Total Housing Units | 1,132 | 100.0% |
Occupancy by Ownership by Household Size in Goffstown
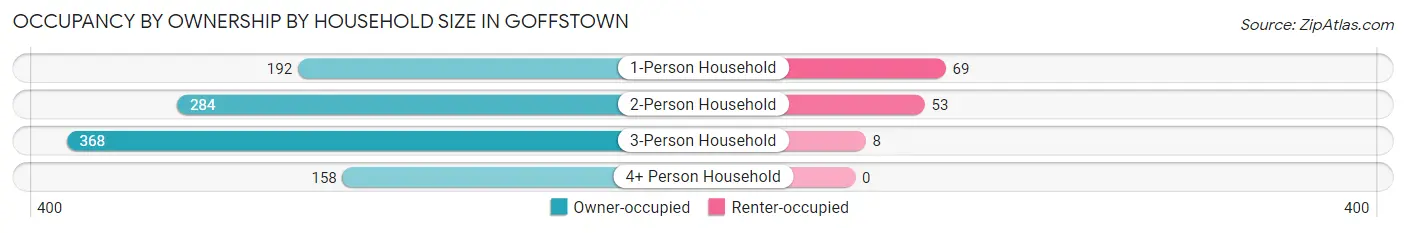
| Household Size | Owner-occupied | Renter-occupied |
| 1-Person Household | 192 (73.6%) | 69 (26.4%) |
| 2-Person Household | 284 (84.3%) | 53 (15.7%) |
| 3-Person Household | 368 (97.9%) | 8 (2.1%) |
| 4+ Person Household | 158 (100.0%) | 0 (0.0%) |
| Total Housing Units | 1,002 (88.5%) | 130 (11.5%) |
Occupancy by Educational Attainment in Goffstown
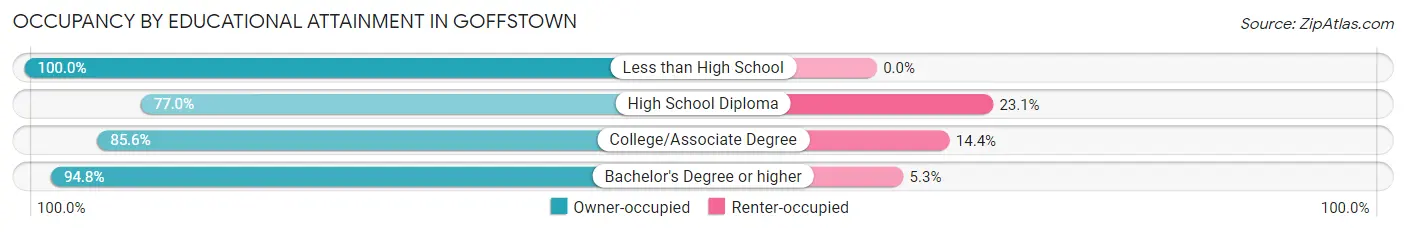
| Household Size | Owner-occupied | Renter-occupied |
| Less than High School | 31 (100.0%) | 0 (0.0%) |
| High School Diploma | 227 (76.9%) | 68 (23.1%) |
| College/Associate Degree | 184 (85.6%) | 31 (14.4%) |
| Bachelor's Degree or higher | 560 (94.8%) | 31 (5.2%) |
Occupancy by Age of Householder in Goffstown
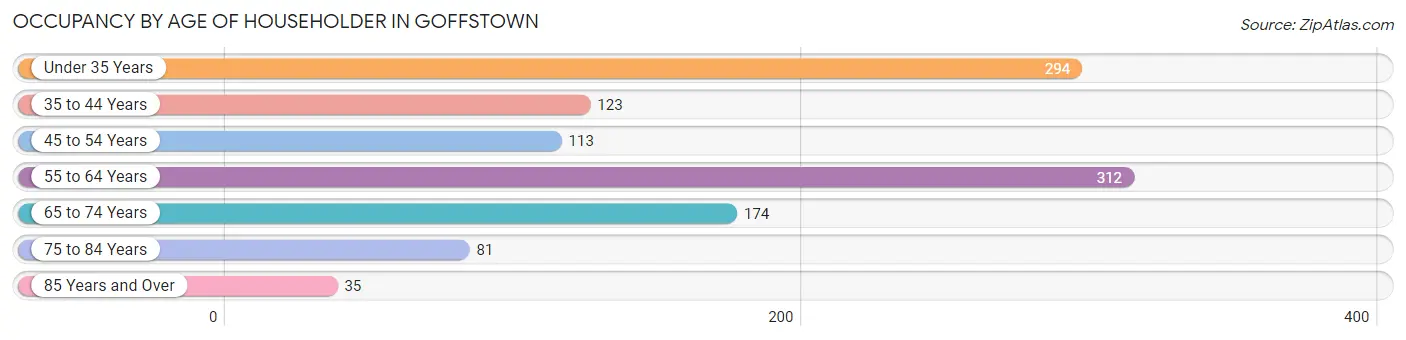
| Age Bracket | # Households | % Households |
| Under 35 Years | 294 | 26.0% |
| 35 to 44 Years | 123 | 10.9% |
| 45 to 54 Years | 113 | 10.0% |
| 55 to 64 Years | 312 | 27.6% |
| 65 to 74 Years | 174 | 15.4% |
| 75 to 84 Years | 81 | 7.2% |
| 85 Years and Over | 35 | 3.1% |
| Total | 1,132 | 100.0% |
Housing Finances in Goffstown
Median Income by Occupancy in Goffstown
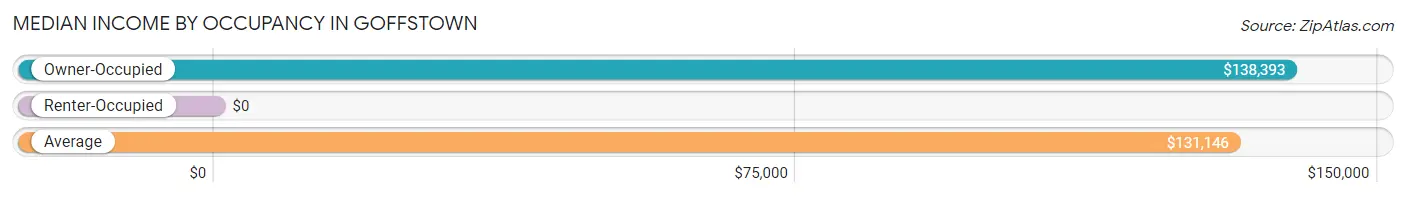
| Occupancy Type | # Households | Median Income |
| Owner-Occupied | 1,002 (88.5%) | $138,393 |
| Renter-Occupied | 130 (11.5%) | $0 |
| Average | 1,132 (100.0%) | $131,146 |
Occupancy by Householder Income Bracket in Goffstown
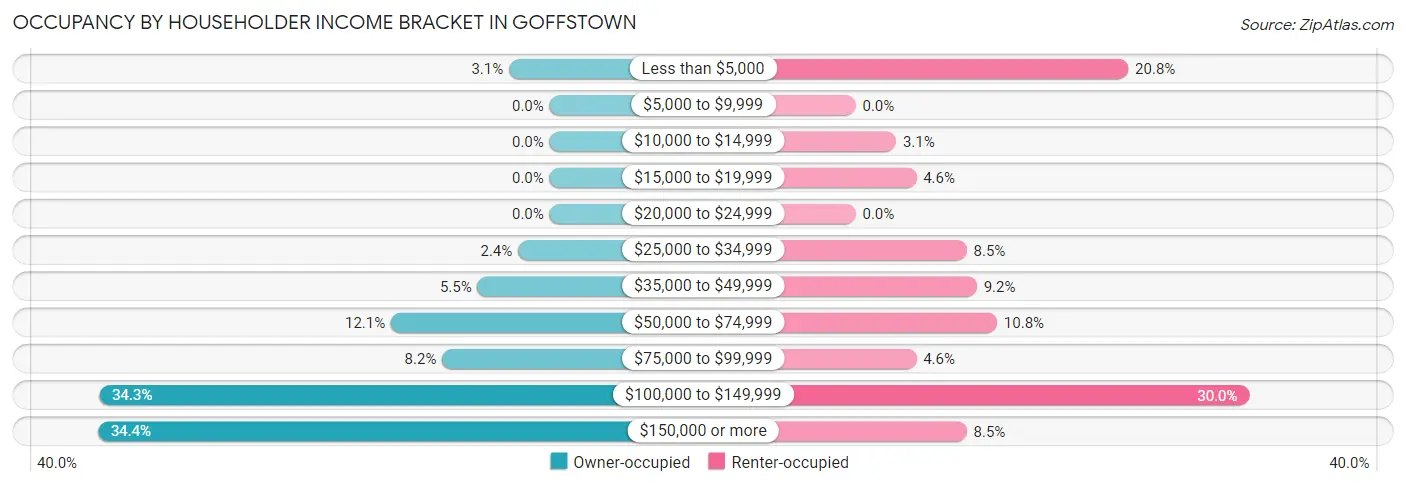
| Income Bracket | Owner-occupied | Renter-occupied |
| Less than $5,000 | 31 (3.1%) | 27 (20.8%) |
| $5,000 to $9,999 | 0 (0.0%) | 0 (0.0%) |
| $10,000 to $14,999 | 0 (0.0%) | 4 (3.1%) |
| $15,000 to $19,999 | 0 (0.0%) | 6 (4.6%) |
| $20,000 to $24,999 | 0 (0.0%) | 0 (0.0%) |
| $25,000 to $34,999 | 24 (2.4%) | 11 (8.5%) |
| $35,000 to $49,999 | 55 (5.5%) | 12 (9.2%) |
| $50,000 to $74,999 | 121 (12.1%) | 14 (10.8%) |
| $75,000 to $99,999 | 82 (8.2%) | 6 (4.6%) |
| $100,000 to $149,999 | 344 (34.3%) | 39 (30.0%) |
| $150,000 or more | 345 (34.4%) | 11 (8.5%) |
| Total | 1,002 (100.0%) | 130 (100.0%) |
Monthly Housing Cost Tiers in Goffstown
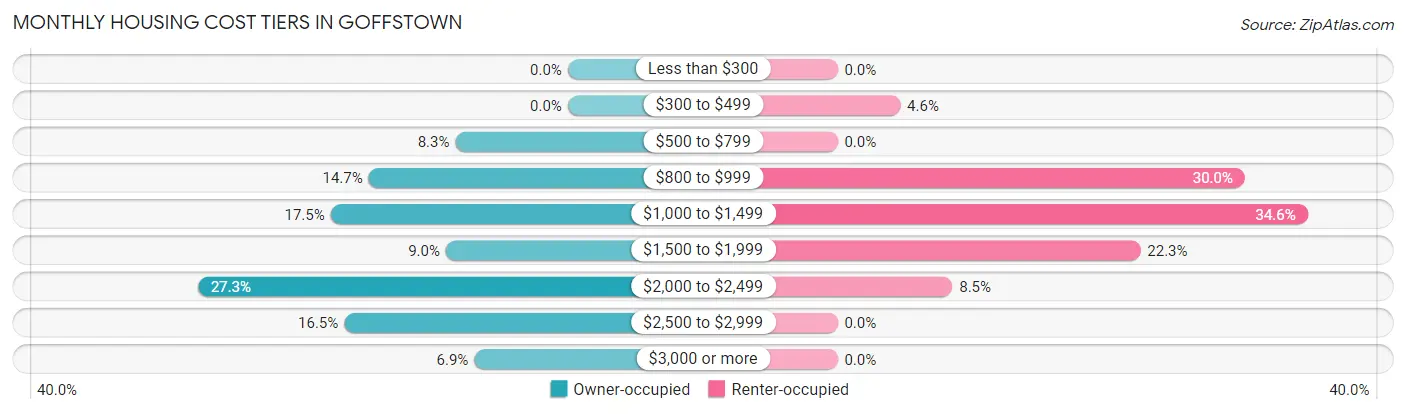
| Monthly Cost | Owner-occupied | Renter-occupied |
| Less than $300 | 0 (0.0%) | 0 (0.0%) |
| $300 to $499 | 0 (0.0%) | 6 (4.6%) |
| $500 to $799 | 83 (8.3%) | 0 (0.0%) |
| $800 to $999 | 147 (14.7%) | 39 (30.0%) |
| $1,000 to $1,499 | 175 (17.5%) | 45 (34.6%) |
| $1,500 to $1,999 | 90 (9.0%) | 29 (22.3%) |
| $2,000 to $2,499 | 273 (27.3%) | 11 (8.5%) |
| $2,500 to $2,999 | 165 (16.5%) | 0 (0.0%) |
| $3,000 or more | 69 (6.9%) | 0 (0.0%) |
| Total | 1,002 (100.0%) | 130 (100.0%) |
Physical Housing Characteristics in Goffstown
Housing Structures in Goffstown
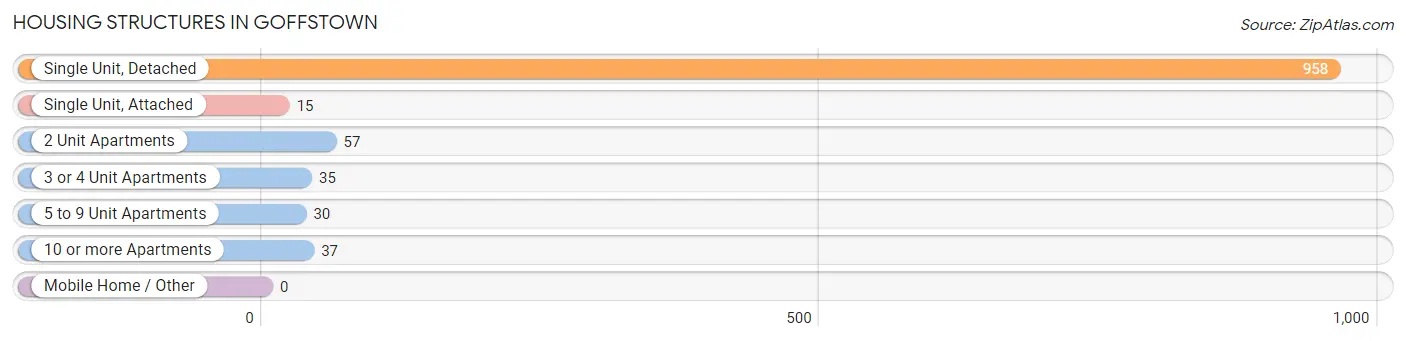
| Structure Type | # Housing Units | % Housing Units |
| Single Unit, Detached | 958 | 84.6% |
| Single Unit, Attached | 15 | 1.3% |
| 2 Unit Apartments | 57 | 5.0% |
| 3 or 4 Unit Apartments | 35 | 3.1% |
| 5 to 9 Unit Apartments | 30 | 2.6% |
| 10 or more Apartments | 37 | 3.3% |
| Mobile Home / Other | 0 | 0.0% |
| Total | 1,132 | 100.0% |
Housing Structures by Occupancy in Goffstown
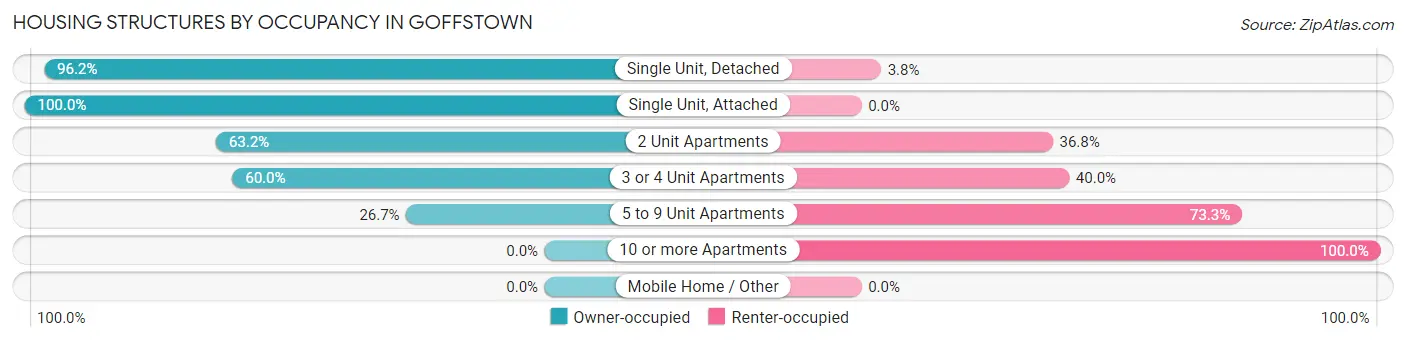
| Structure Type | Owner-occupied | Renter-occupied |
| Single Unit, Detached | 922 (96.2%) | 36 (3.8%) |
| Single Unit, Attached | 15 (100.0%) | 0 (0.0%) |
| 2 Unit Apartments | 36 (63.2%) | 21 (36.8%) |
| 3 or 4 Unit Apartments | 21 (60.0%) | 14 (40.0%) |
| 5 to 9 Unit Apartments | 8 (26.7%) | 22 (73.3%) |
| 10 or more Apartments | 0 (0.0%) | 37 (100.0%) |
| Mobile Home / Other | 0 (0.0%) | 0 (0.0%) |
| Total | 1,002 (88.5%) | 130 (11.5%) |
Housing Structures by Number of Rooms in Goffstown
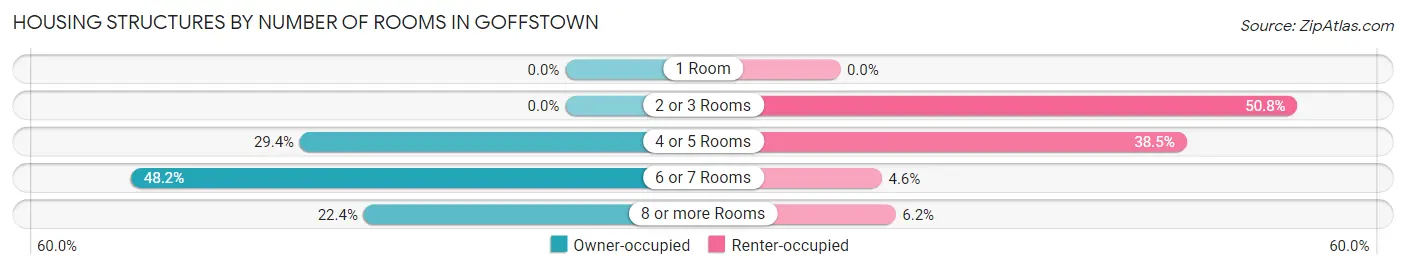
| Number of Rooms | Owner-occupied | Renter-occupied |
| 1 Room | 0 (0.0%) | 0 (0.0%) |
| 2 or 3 Rooms | 0 (0.0%) | 66 (50.8%) |
| 4 or 5 Rooms | 295 (29.4%) | 50 (38.5%) |
| 6 or 7 Rooms | 483 (48.2%) | 6 (4.6%) |
| 8 or more Rooms | 224 (22.4%) | 8 (6.1%) |
| Total | 1,002 (100.0%) | 130 (100.0%) |
Housing Structure by Heating Type in Goffstown
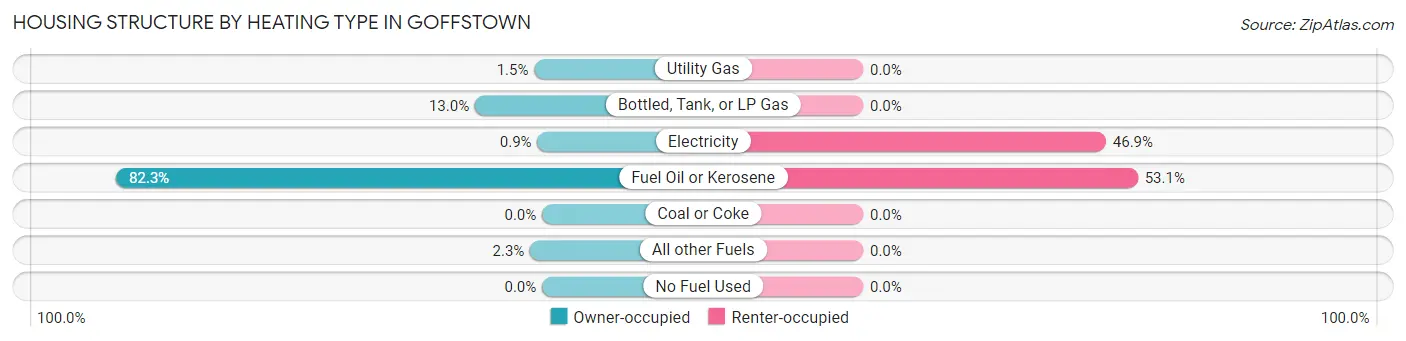
| Heating Type | Owner-occupied | Renter-occupied |
| Utility Gas | 15 (1.5%) | 0 (0.0%) |
| Bottled, Tank, or LP Gas | 130 (13.0%) | 0 (0.0%) |
| Electricity | 9 (0.9%) | 61 (46.9%) |
| Fuel Oil or Kerosene | 825 (82.3%) | 69 (53.1%) |
| Coal or Coke | 0 (0.0%) | 0 (0.0%) |
| All other Fuels | 23 (2.3%) | 0 (0.0%) |
| No Fuel Used | 0 (0.0%) | 0 (0.0%) |
| Total | 1,002 (100.0%) | 130 (100.0%) |
Household Vehicle Usage in Goffstown
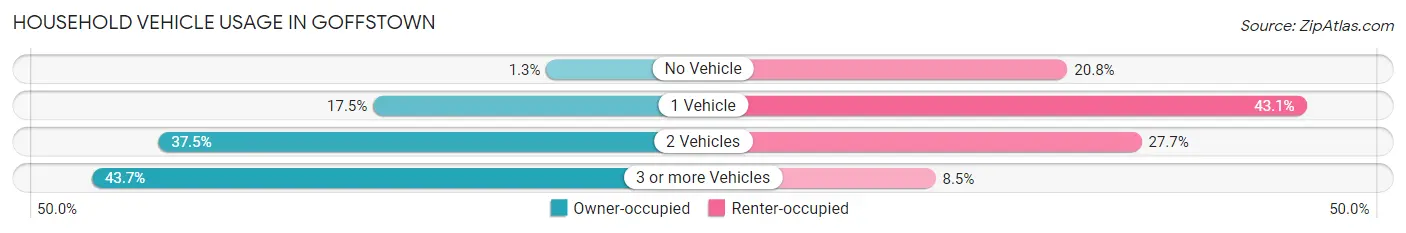
| Vehicles per Household | Owner-occupied | Renter-occupied |
| No Vehicle | 13 (1.3%) | 27 (20.8%) |
| 1 Vehicle | 175 (17.5%) | 56 (43.1%) |
| 2 Vehicles | 376 (37.5%) | 36 (27.7%) |
| 3 or more Vehicles | 438 (43.7%) | 11 (8.5%) |
| Total | 1,002 (100.0%) | 130 (100.0%) |
Real Estate & Mortgages in Goffstown
Real Estate and Mortgage Overview in Goffstown
| Characteristic | Without Mortgage | With Mortgage |
| Housing Units | 331 | 671 |
| Median Property Value | $297,800 | $345,100 |
| Median Household Income | $140,417 | $247 |
| Monthly Housing Costs | $965 | $69 |
| Real Estate Taxes | $6,719 | $0 |
Property Value by Mortgage Status in Goffstown
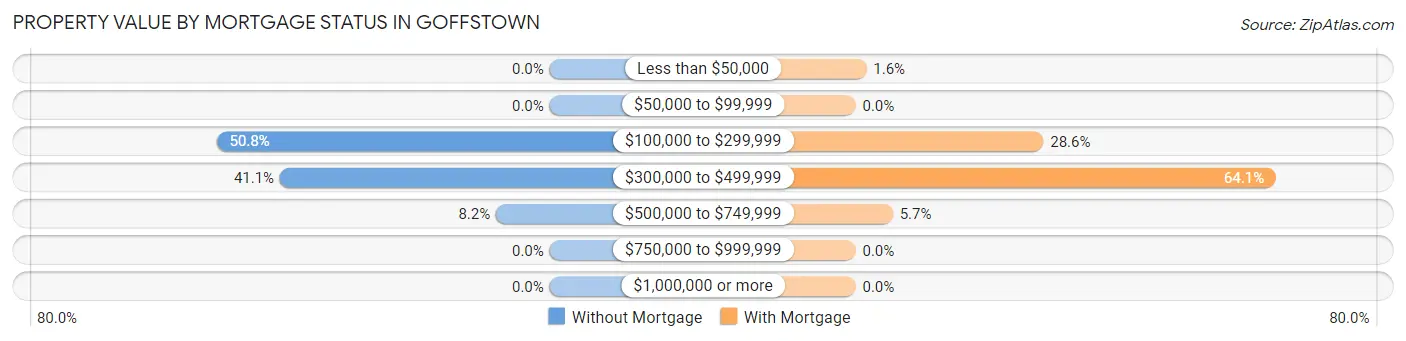
| Property Value | Without Mortgage | With Mortgage |
| Less than $50,000 | 0 (0.0%) | 11 (1.6%) |
| $50,000 to $99,999 | 0 (0.0%) | 0 (0.0%) |
| $100,000 to $299,999 | 168 (50.8%) | 192 (28.6%) |
| $300,000 to $499,999 | 136 (41.1%) | 430 (64.1%) |
| $500,000 to $749,999 | 27 (8.2%) | 38 (5.7%) |
| $750,000 to $999,999 | 0 (0.0%) | 0 (0.0%) |
| $1,000,000 or more | 0 (0.0%) | 0 (0.0%) |
| Total | 331 (100.0%) | 671 (100.0%) |
Household Income by Mortgage Status in Goffstown
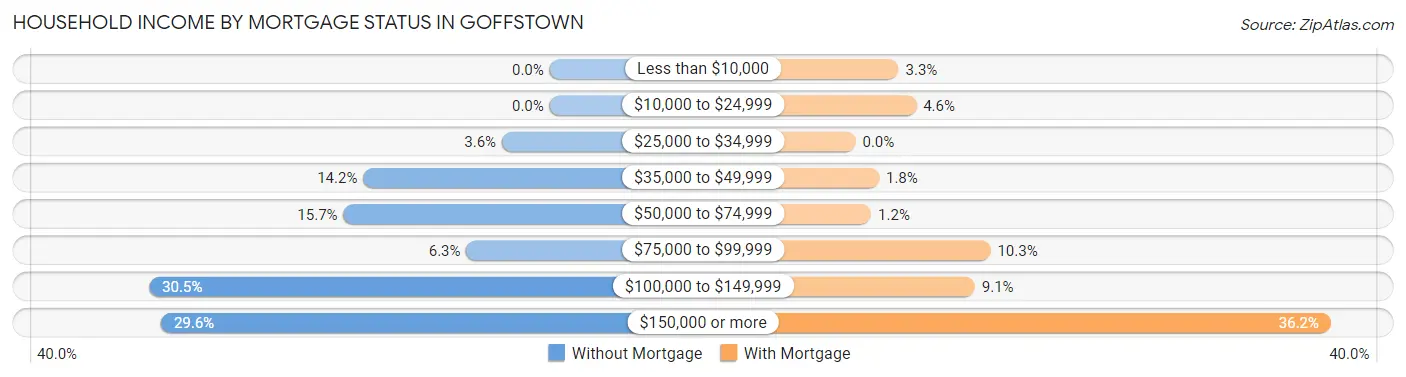
| Household Income | Without Mortgage | With Mortgage |
| Less than $10,000 | 0 (0.0%) | 22 (3.3%) |
| $10,000 to $24,999 | 0 (0.0%) | 31 (4.6%) |
| $25,000 to $34,999 | 12 (3.6%) | 0 (0.0%) |
| $35,000 to $49,999 | 47 (14.2%) | 12 (1.8%) |
| $50,000 to $74,999 | 52 (15.7%) | 8 (1.2%) |
| $75,000 to $99,999 | 21 (6.3%) | 69 (10.3%) |
| $100,000 to $149,999 | 101 (30.5%) | 61 (9.1%) |
| $150,000 or more | 98 (29.6%) | 243 (36.2%) |
| Total | 331 (100.0%) | 671 (100.0%) |
Property Value to Household Income Ratio in Goffstown
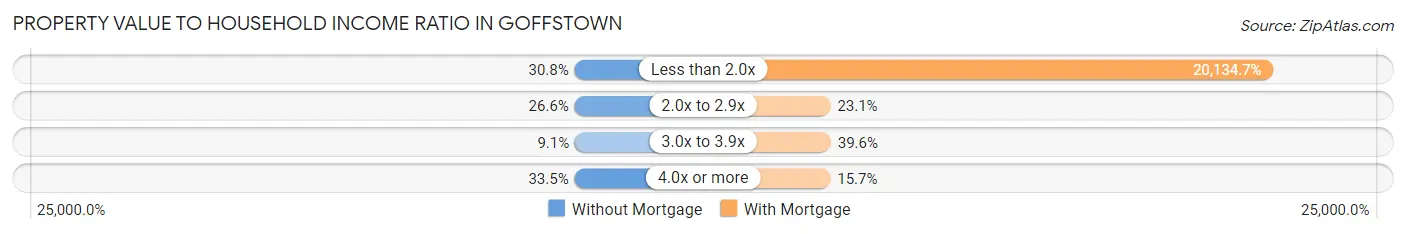
| Value-to-Income Ratio | Without Mortgage | With Mortgage |
| Less than 2.0x | 102 (30.8%) | 135,104 (20,134.7%) |
| 2.0x to 2.9x | 88 (26.6%) | 155 (23.1%) |
| 3.0x to 3.9x | 30 (9.1%) | 266 (39.6%) |
| 4.0x or more | 111 (33.5%) | 105 (15.7%) |
| Total | 331 (100.0%) | 671 (100.0%) |
Real Estate Taxes by Mortgage Status in Goffstown
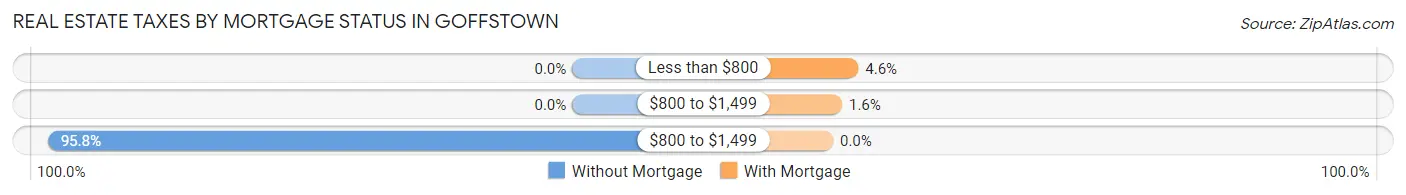
| Property Taxes | Without Mortgage | With Mortgage |
| Less than $800 | 0 (0.0%) | 31 (4.6%) |
| $800 to $1,499 | 0 (0.0%) | 11 (1.6%) |
| $800 to $1,499 | 317 (95.8%) | 0 (0.0%) |
| Total | 331 (100.0%) | 671 (100.0%) |
Health & Disability in Goffstown
Health Insurance Coverage by Age in Goffstown
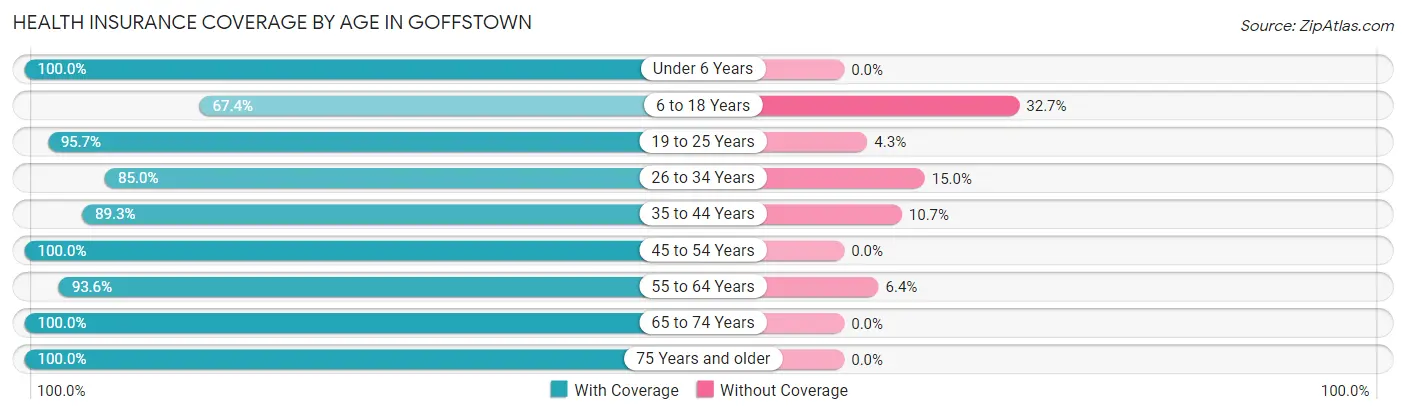
| Age Bracket | With Coverage | Without Coverage |
| Under 6 Years | 332 (100.0%) | 0 (0.0%) |
| 6 to 18 Years | 165 (67.3%) | 80 (32.7%) |
| 19 to 25 Years | 244 (95.7%) | 11 (4.3%) |
| 26 to 34 Years | 549 (85.0%) | 97 (15.0%) |
| 35 to 44 Years | 266 (89.3%) | 32 (10.7%) |
| 45 to 54 Years | 285 (100.0%) | 0 (0.0%) |
| 55 to 64 Years | 498 (93.6%) | 34 (6.4%) |
| 65 to 74 Years | 264 (100.0%) | 0 (0.0%) |
| 75 Years and older | 171 (100.0%) | 0 (0.0%) |
| Total | 2,774 (91.6%) | 254 (8.4%) |
Health Insurance Coverage by Citizenship Status in Goffstown
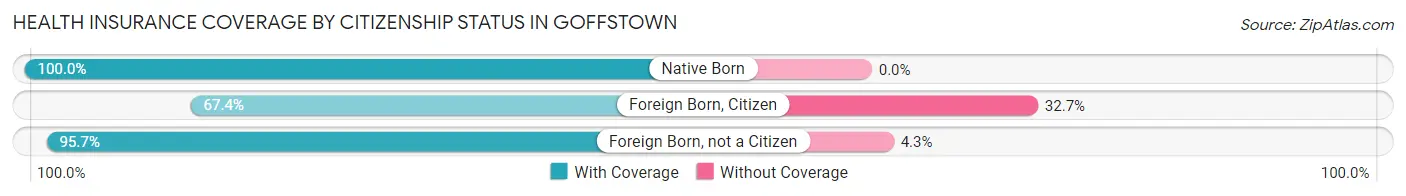
| Citizenship Status | With Coverage | Without Coverage |
| Native Born | 332 (100.0%) | 0 (0.0%) |
| Foreign Born, Citizen | 165 (67.3%) | 80 (32.7%) |
| Foreign Born, not a Citizen | 244 (95.7%) | 11 (4.3%) |
Health Insurance Coverage by Household Income in Goffstown
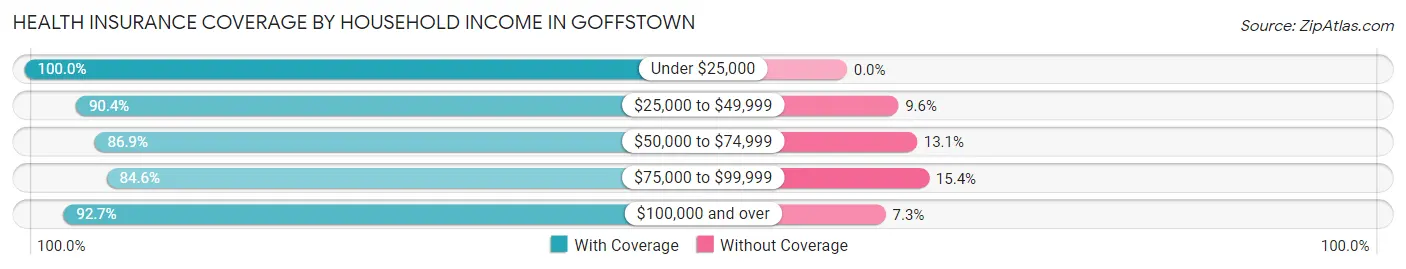
| Household Income | With Coverage | Without Coverage |
| Under $25,000 | 68 (100.0%) | 0 (0.0%) |
| $25,000 to $49,999 | 122 (90.4%) | 13 (9.6%) |
| $50,000 to $74,999 | 278 (86.9%) | 42 (13.1%) |
| $75,000 to $99,999 | 176 (84.6%) | 32 (15.4%) |
| $100,000 and over | 2,130 (92.7%) | 167 (7.3%) |
Public vs Private Health Insurance Coverage by Age in Goffstown
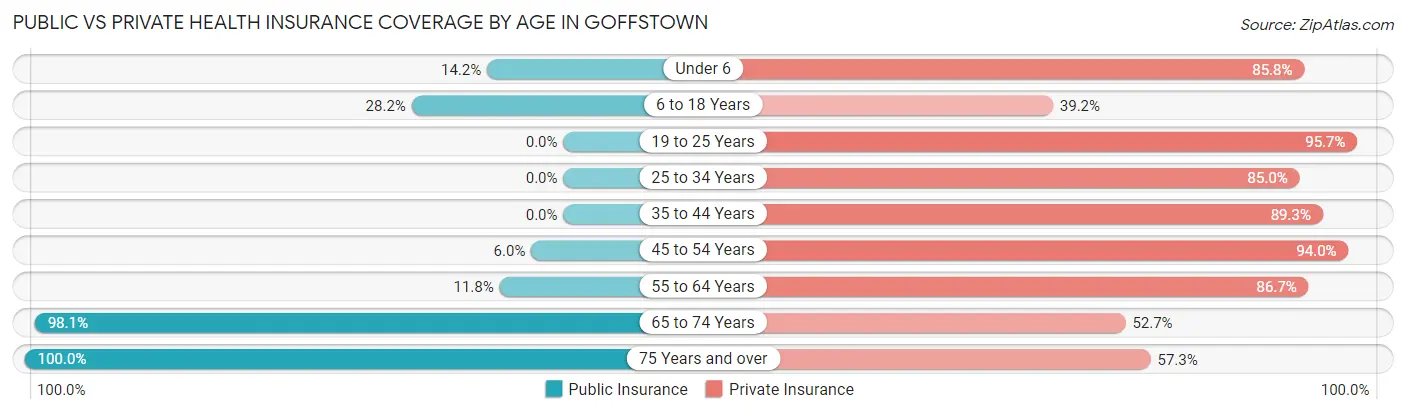
| Age Bracket | Public Insurance | Private Insurance |
| Under 6 | 47 (14.2%) | 285 (85.8%) |
| 6 to 18 Years | 69 (28.2%) | 96 (39.2%) |
| 19 to 25 Years | 0 (0.0%) | 244 (95.7%) |
| 25 to 34 Years | 0 (0.0%) | 549 (85.0%) |
| 35 to 44 Years | 0 (0.0%) | 266 (89.3%) |
| 45 to 54 Years | 17 (6.0%) | 268 (94.0%) |
| 55 to 64 Years | 63 (11.8%) | 461 (86.7%) |
| 65 to 74 Years | 259 (98.1%) | 139 (52.6%) |
| 75 Years and over | 171 (100.0%) | 98 (57.3%) |
| Total | 626 (20.7%) | 2,406 (79.5%) |
Disability Status by Sex by Age in Goffstown
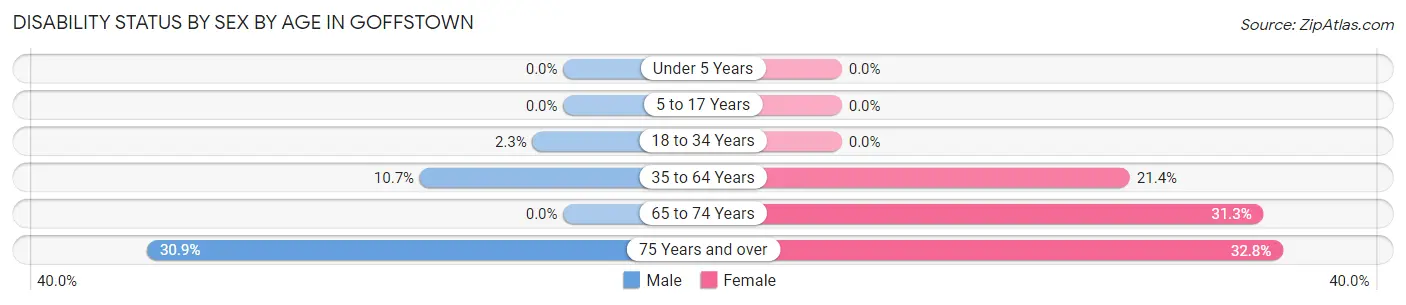
| Age Bracket | Male | Female |
| Under 5 Years | 0 (0.0%) | 0 (0.0%) |
| 5 to 17 Years | 0 (0.0%) | 0 (0.0%) |
| 18 to 34 Years | 11 (2.3%) | 0 (0.0%) |
| 35 to 64 Years | 62 (10.6%) | 114 (21.4%) |
| 65 to 74 Years | 0 (0.0%) | 31 (31.3%) |
| 75 Years and over | 17 (30.9%) | 38 (32.8%) |
Disability Class by Sex by Age in Goffstown
Disability Class: Hearing Difficulty
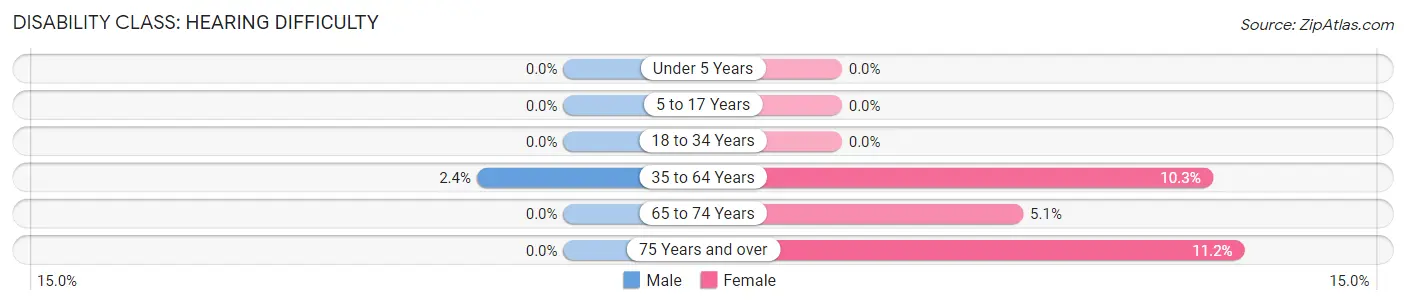
| Age Bracket | Male | Female |
| Under 5 Years | 0 (0.0%) | 0 (0.0%) |
| 5 to 17 Years | 0 (0.0%) | 0 (0.0%) |
| 18 to 34 Years | 0 (0.0%) | 0 (0.0%) |
| 35 to 64 Years | 14 (2.4%) | 55 (10.3%) |
| 65 to 74 Years | 0 (0.0%) | 5 (5.1%) |
| 75 Years and over | 0 (0.0%) | 13 (11.2%) |
Disability Class: Vision Difficulty
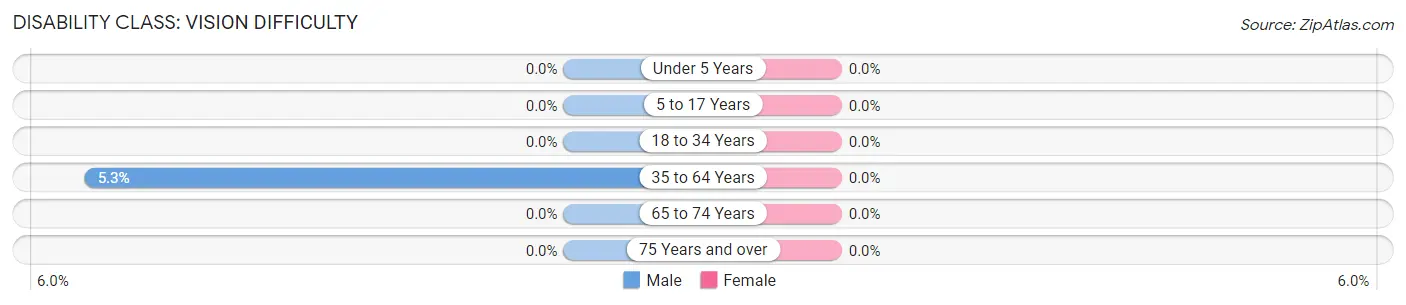
| Age Bracket | Male | Female |
| Under 5 Years | 0 (0.0%) | 0 (0.0%) |
| 5 to 17 Years | 0 (0.0%) | 0 (0.0%) |
| 18 to 34 Years | 0 (0.0%) | 0 (0.0%) |
| 35 to 64 Years | 31 (5.3%) | 0 (0.0%) |
| 65 to 74 Years | 0 (0.0%) | 0 (0.0%) |
| 75 Years and over | 0 (0.0%) | 0 (0.0%) |
Disability Class: Cognitive Difficulty
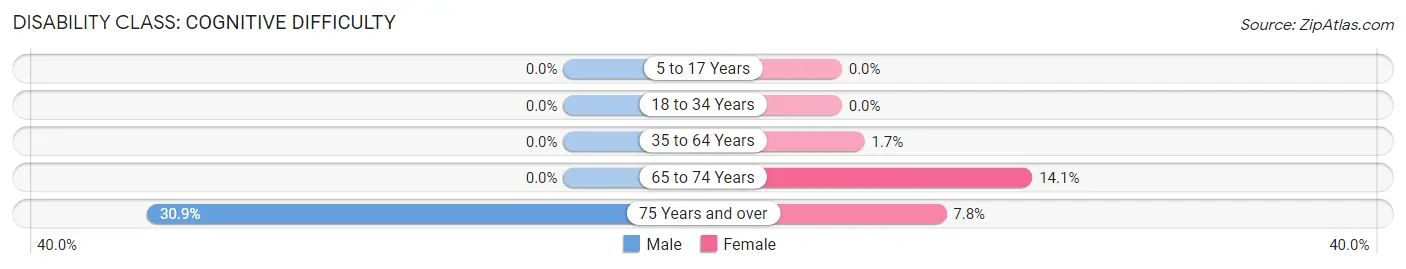
| Age Bracket | Male | Female |
| 5 to 17 Years | 0 (0.0%) | 0 (0.0%) |
| 18 to 34 Years | 0 (0.0%) | 0 (0.0%) |
| 35 to 64 Years | 0 (0.0%) | 9 (1.7%) |
| 65 to 74 Years | 0 (0.0%) | 14 (14.1%) |
| 75 Years and over | 17 (30.9%) | 9 (7.8%) |
Disability Class: Ambulatory Difficulty
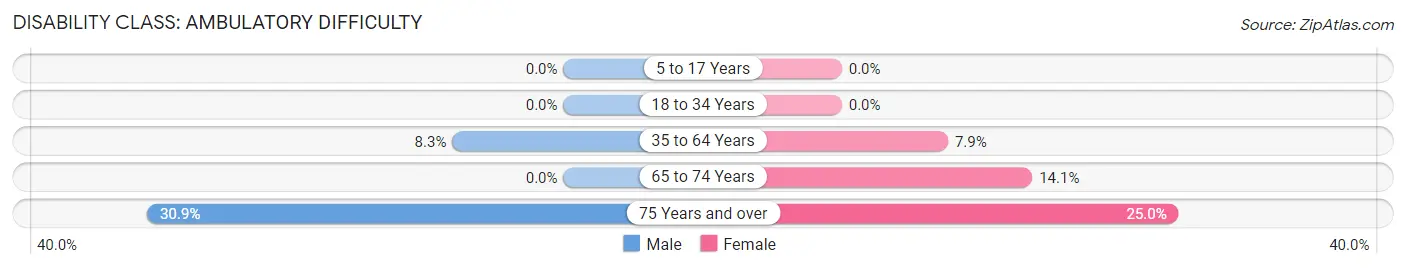
| Age Bracket | Male | Female |
| 5 to 17 Years | 0 (0.0%) | 0 (0.0%) |
| 18 to 34 Years | 0 (0.0%) | 0 (0.0%) |
| 35 to 64 Years | 48 (8.3%) | 42 (7.9%) |
| 65 to 74 Years | 0 (0.0%) | 14 (14.1%) |
| 75 Years and over | 17 (30.9%) | 29 (25.0%) |
Disability Class: Self-Care Difficulty
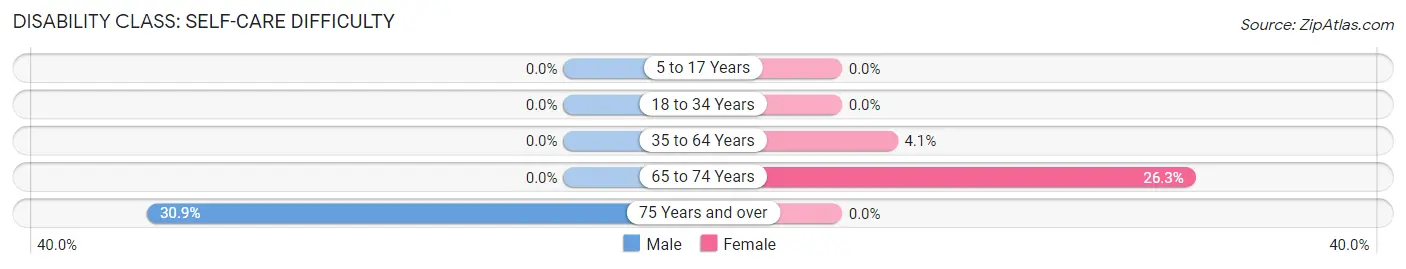
| Age Bracket | Male | Female |
| 5 to 17 Years | 0 (0.0%) | 0 (0.0%) |
| 18 to 34 Years | 0 (0.0%) | 0 (0.0%) |
| 35 to 64 Years | 0 (0.0%) | 22 (4.1%) |
| 65 to 74 Years | 0 (0.0%) | 26 (26.3%) |
| 75 Years and over | 17 (30.9%) | 0 (0.0%) |
Technology Access in Goffstown
Computing Device Access in Goffstown
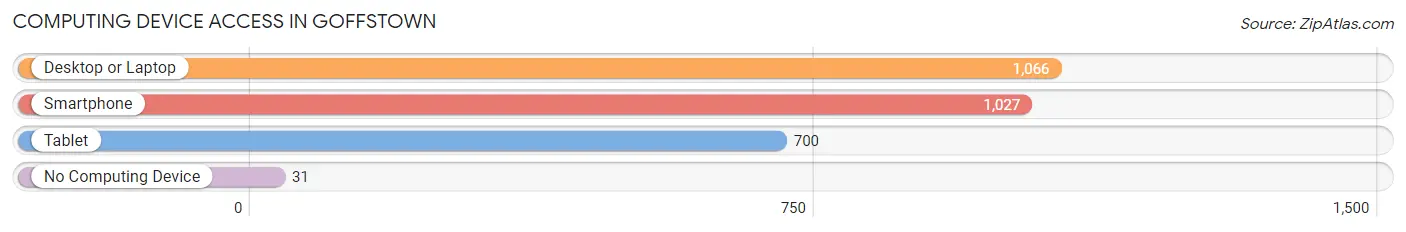
| Device Type | # Households | % Households |
| Desktop or Laptop | 1,066 | 94.2% |
| Smartphone | 1,027 | 90.7% |
| Tablet | 700 | 61.8% |
| No Computing Device | 31 | 2.7% |
| Total | 1,132 | 100.0% |
Internet Access in Goffstown
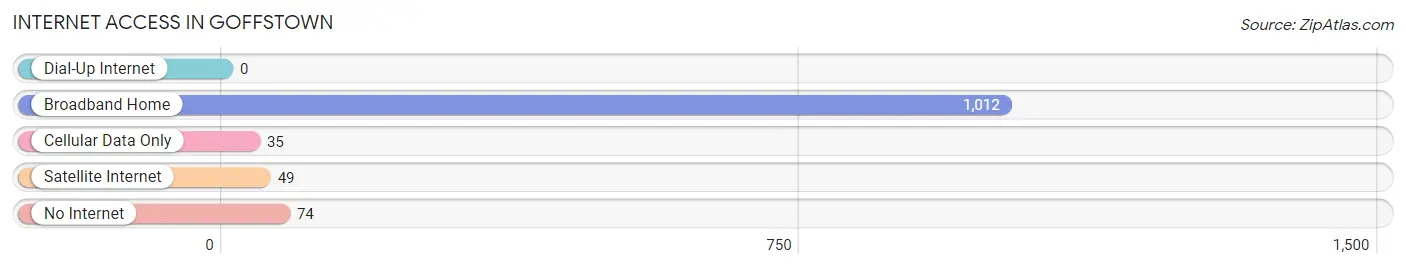
| Internet Type | # Households | % Households |
| Dial-Up Internet | 0 | 0.0% |
| Broadband Home | 1,012 | 89.4% |
| Cellular Data Only | 35 | 3.1% |
| Satellite Internet | 49 | 4.3% |
| No Internet | 74 | 6.5% |
| Total | 1,132 | 100.0% |
Goffstown Summary
Goffstown is a town located in Hillsborough County, New Hampshire, United States. It is situated along the Merrimack River, and is bordered by the towns of Manchester, Bedford, New Boston, Dunbarton, and Weare. The town was incorporated in 1761 and has a population of 17,651 as of the 2010 census.
Geography
Goffstown is located in southeastern New Hampshire, approximately 10 miles south of Manchester and 30 miles northwest of Boston. It is situated along the Merrimack River, and is bordered by the towns of Manchester, Bedford, New Boston, Dunbarton, and Weare. The town has a total area of 33.2 square miles, of which 32.9 square miles is land and 0.3 square miles is water.
The highest point in Goffstown is the summit of Uncanoonuc Mountain, at 1,065 feet above sea level. The town is home to several bodies of water, including the Piscataquog River, the Merrimack River, and the Massabesic Lake.
History
Goffstown was first settled in 1733 by a group of Scots-Irish immigrants led by Captain John Goffe. The town was incorporated in 1761 and named after Goffe.
Goffstown was an important center of industry during the 19th century. The town was home to several mills, including the Goffstown Manufacturing Company, which produced cotton and woolen goods. The town was also home to several tanneries, which produced leather goods.
Economy
Goffstown has a diverse economy, with a mix of manufacturing, retail, and service industries. The town is home to several large employers, including the Saint Anselm College, the New Hampshire State Prison, and the Goffstown Manufacturing Company.
The town is also home to several small businesses, including restaurants, retail stores, and professional services.
Demographics
As of the 2010 census, there were 17,651 people, 6,845 households, and 4,717 families residing in the town. The population density was 535.3 people per square mile. There were 7,093 housing units at an average density of 215.9 per square mile.
The racial makeup of the town was 96.2% White, 0.7% African American, 0.3% Native American, 1.2% Asian, 0.1% Pacific Islander, 0.5% from other races, and 1.1% from two or more races. Hispanic or Latino of any race were 1.7% of the population.
The median age in the town was 40.2 years. 22.2% of residents were under the age of 18; 8.2% were between the ages of 18 and 24; 25.2% were from 25 to 44; 30.2% were from 45 to 64; and 14.2% were 65 years of age or older. The gender makeup of the town was 48.7% male and 51.3% female.
Conclusion
Goffstown is a town located in Hillsborough County, New Hampshire, United States. It is situated along the Merrimack River, and is bordered by the towns of Manchester, Bedford, New Boston, Dunbarton, and Weare. The town was incorporated in 1761 and has a population of 17,651 as of the 2010 census. Goffstown has a diverse economy, with a mix of manufacturing, retail, and service industries. The town is home to several large employers, including the Saint Anselm College, the New Hampshire State Prison, and the Goffstown Manufacturing Company. The racial makeup of the town was 96.2% White, 0.7% African American, 0.3% Native American, 1.2% Asian, 0.1% Pacific Islander, 0.5% from other races, and 1.1% from two or more races. The median age in the town was 40.2 years. Goffstown is a vibrant and diverse community with a rich history and a bright future.
Common Questions
What is Per Capita Income in Goffstown?
Per Capita income in Goffstown is $58,670.
What is the Median Family Income in Goffstown?
Median Family Income in Goffstown is $132,318.
What is the Median Household income in Goffstown?
Median Household Income in Goffstown is $131,146.
What is Income or Wage Gap in Goffstown?
Income or Wage Gap in Goffstown is 23.4%.
Women in Goffstown earn 76.6 cents for every dollar earned by a man.
What is Inequality or Gini Index in Goffstown?
Inequality or Gini Index in Goffstown is 0.39.
What is the Total Population of Goffstown?
Total Population of Goffstown is 3,028.
What is the Total Male Population of Goffstown?
Total Male Population of Goffstown is 1,473.
What is the Total Female Population of Goffstown?
Total Female Population of Goffstown is 1,555.
What is the Ratio of Males per 100 Females in Goffstown?
There are 94.73 Males per 100 Females in Goffstown.
What is the Ratio of Females per 100 Males in Goffstown?
There are 105.57 Females per 100 Males in Goffstown.
What is the Median Population Age in Goffstown?
Median Population Age in Goffstown is 35.6 Years.
What is the Average Family Size in Goffstown
Average Family Size in Goffstown is 3.1 People.
What is the Average Household Size in Goffstown
Average Household Size in Goffstown is 2.7 People.
How Large is the Labor Force in Goffstown?
There are 1,953 People in the Labor Forcein in Goffstown.
What is the Percentage of People in the Labor Force in Goffstown?
78.2% of People are in the Labor Force in Goffstown.